[level-membership-for-basic-science-category]
Chapter 9 Drug Discovery and Evaluation
Preclinical Process
Drug Discovery
Compound-Centered Drug Discovery
Natural Products
Naturally derived products were the first blockbuster drugs and paved the way for further drug discovery through compound-centered research. Once the efficacy and safety (and potential profitability) of compounds such as penicillin had been established, pharmaceutical chemists set about refining the structures of these agents to achieve specific pharmacologic effects. Table 9-1 lists some common drugs derived from natural sources.
| Compound | Source |
|---|---|
| Penicillin | Penicillium mold |
| Morphine | Opium poppy |
| Cyclosporine | Fungus |
Penicillin
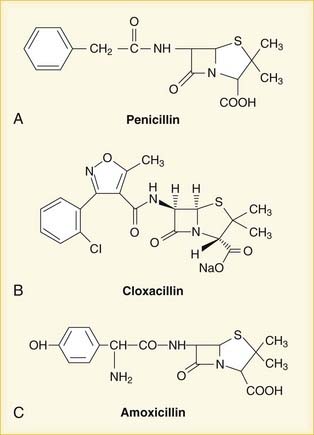
Once the chemical structure of penicillin was established, chemists began work on synthesizing new versions, each with its own distinct properties (Figure 9-1). Penicillin-resistant bacteria produce β-lactamase enzymes that attack the penicillin structure. A simple modification of the structure of penicillin created a bulky chemical chain that blocks β-lactamases from the β-lactam site, resulting in the β-lactamase–resistant drug cloxacillin.
Endogenous Ligands
Target-Centered Drug Discovery
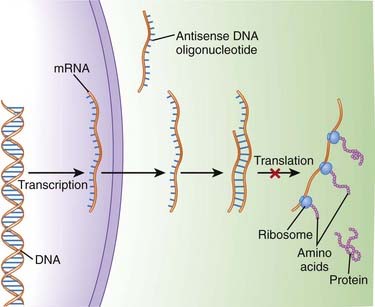
An understanding of the genetic basis for disease also provides new targets and will lead to gene-based therapies. The ultimate goal will be to selectively target genes that cause or contribute to disease, and prevent their expression. One of the most promising examples of this target-centered approach is antisense (Figure 9-3).


 Second-generation antisense agents are designed to signal for destruction of the sense strand, once they have bound to it. The sense strand is destroyed by enzymes (RNAses), allowing the antisense strand to be used again.

The concept of gene-based therapeutics is covered in Chapter 6.
Tools Used in Drug Discovery


 Combinatorial chemistry
 This is an automated method allows for the generation of a large number of compounds from a small number of precursors. This technology allows pharmaceutical companies to create very large libraries of compounds that systematically cover most or all of the possible variations in structure that may occur around a common precursor.
Preclinical Testing
Pharmacokinetics
 A key step in the development process is to determine the route of metabolism for the drug. If metabolized by CYP450 enzymes, the isoenzymes involved will be identified. Tests will also be performed to determine whether the drug is an inducer or inhibitor (or neither) of metabolizing enzymes, again with a focus on CYP450.

Toxicology
 Tests for the toxic effects of a drug are generally performed on live animals, most commonly rats and mice. These tests are considered necessary because of the current limitations with using either in vitro testing or computer modeling to simulate the effects of a drug in a human.
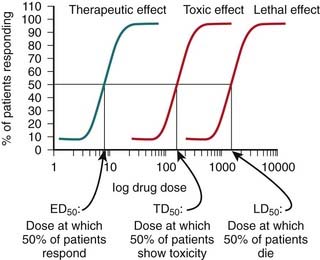
 A key feature of these toxicology studies is that increasingly high, supraphysiologic doses of drug are administered. The therapeutic index of a drug is determined using quantal dose-response curves (see pharmacodynamics chapter for further description of quantal dose-response curves). The therapeutic index is the ratio of the toxic (TD) or lethal dose (LD) of a drug to its effective dose (ED) (Figure 9-4).
Chemical and Pharmaceutical Development
 Once the manufacturer has fully characterized the pharmacokinetics, pharmacodynamics, and toxicology of the new chemical, the manufacturer must also consider practical issues, such as how the drug will be produced and what form it will take. The chapter on pharmacokinetics provides a complete description of various dosage forms. Typically, the oral route is the preferred route.
Clinical Process
Stages in the Drug Approval Process
Once a new drug application has been filed, manufacturers may begin the process of clinical trials, with the overall goal of proving that the drug is both efficacious and safe. The process is traditionally carried out in phases, with increasingly large numbers of patients in each phase. The manufacturer is responsible for the conduct of these trials, although regulatory agencies may conduct site inspections to confirm that studies are being conducted properly. Table 9-2 lists the key characteristics of each phase of the clinical trial process.
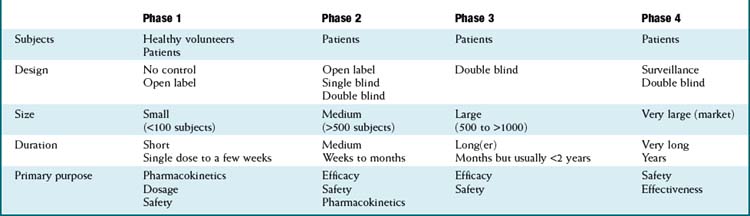
Phase 1


Phase 2
 In phase 2 we begin to see the drug compared with results in a control group, usually a placebo control. These trials include patients and are of moderate size, usually 100 subjects per group or less. By this time, a range of doses should be established, such that the main purpose is to determine efficacy and safety.
Phase 3
 Phase 3 represents the final stage before drug approval and establishes the efficacy of the doses that will be used in the clinic. By this time, obvious safety issues should have been seen, so phase 3 trials are open to a much larger group of patients. However, owing to the size of these trials, less-obvious safety issues may arise, sometimes either preventing the approval of the drug or warranting a strong warning on the labeling.
Phase IV
 Phase 4 is also referred to as postmarketing surveillance. Regulatory agencies may require double-blind controlled trials in this phase, depending on how many unresolved issues remain from phase 3. Phase 4 has not been a regulatory requirement, although recent events with drugs such as rofecoxib have illustrated the importance of postmarketing surveillance.
Limitations of the Drug Approval Process
 Clinical trials are typically not large enough to reveal rare but serious adverse events that may become obvious once the drug is available to the general population.


Clinical Trial Design
 Randomization is a process by which study participants are randomly assigned to one of the interventions in the trial.
 One of the goals of randomization is to stratify groups in the trial so that the composition of each intervention group is identical to that of the other. Demographic and relevant baseline characteristics of the participant’s medical condition should be balanced to ensure that comparison groups all begin from the same starting point.

 Blinding ensures that patients and providers are not influenced by knowledge of their assigned intervention.


 The simplest design is a superiority design, in which one intervention is determined simply to be statistically superior to another. Superiority designs typically involve a comparison with placebo.
 A margin for noninferiority is defined before the start of the trial.

Analyzing Data from Clinical Trials
Efficacy Data
 Subsequently, the ARR is expressed as a reciprocal, the number needed to treat (NNT). The NNT is the number of patients who must be treated with a given intervention to prevent an event in one patient.


Pooling Data from Studies: the Meta-Analysis
The data from a meta-analysis are often presented as a forest plot (Figure 9-5). The plot provides a quick graphical representation of the data, as well as numeric summaries to the left of the plot.
 The plot gives a quick summary of the direction of the data. In this case, four of five studies favor the experimental drug over placebo, the only exception being the OUTLIER study.


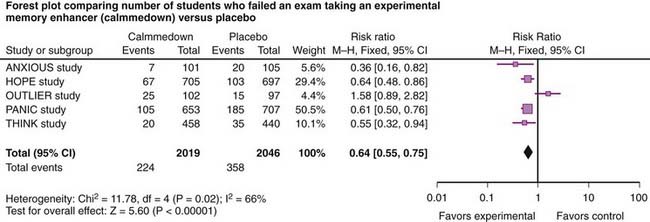
The final key piece of information that a forest plot provides is an indication of the heterogeneity between studies. In Figure 9-5, the results of four studies are fairly consistent, with the exception of the OUTLIER study. An important consideration when assessing the reliability of these data is heterogeneity of the included studies.
 The meta-analysis in Figure 9-5 also provides a measure of heterogeneity, expressed as either a P value or an I2 value. When the test for heterogeneity yields P < .05, significant heterogeneity is considered to exist within the meta-analysis. The higher the I2 value, the greater the heterogeneity. In this case, another analysis should be performed to account for this heterogeneity.

[/level-membership-for-basic-science-category][not-level-membership-for-basic-science-category]
Chapter 9 Drug Discovery and Evaluation
Preclinical Process
Drug Discovery
Compound-Centered Drug Discovery
Natural Products
Naturally derived products were the first blockbuster drugs and paved the way for further drug discovery through compound-centered research. Once the efficacy and safety (and potential profitability) of compounds such as penicillin had been established, pharmaceutical chemists set about refining the structures of these agents to achieve specific pharmacologic effects. Table 9-1 lists some common drugs derived from natural sources.
| Compound | Source |
|---|---|
| Penicillin | Penicillium mold |
| Morphine | Opium poppy |
| Cyclosporine | Fungus |
Penicillin
Once the chemical structure of penicillin was established, chemists began work on synthesizing new versions, each with its own distinct properties (Figure 9-1). Penicillin-resistant bacteria produce β-lactamase enzymes that attack the penicillin structure. A simple modification of the structure of penicillin created a bulky chemical chain that blocks β-lactamases from the β-lactam site, resulting in the β-lactamase–resistant drug cloxacillin.
Endogenous Ligands
Target-Centered Drug Discovery
An understanding of the genetic basis for disease also provides new targets and will lead to gene-based therapies. The ultimate goal will be to selectively target genes that cause or contribute to disease, and prevent their expression. One of the most promising examples of this target-centered approach is antisense (Figure 9-3).
Second-generation antisense agents are designed to signal for destruction of the sense strand, once they have bound to it. The sense strand is destroyed by enzymes (RNAses), allowing the antisense strand to be used again.
The concept of gene-based therapeutics is covered in Chapter 6.
Tools Used in Drug Discovery
Combinatorial chemistry
This is an automated method allows for the generation of a large number of compounds from a small number of precursors. This technology allows pharmaceutical companies to create very large libraries of compounds that systematically cover most or all of the possible variations in structure that may occur around a common precursor.Preclinical Testing
Pharmacokinetics
A key step in the development process is to determine the route of metabolism for the drug. If metabolized by CYP450 enzymes, the isoenzymes involved will be identified. Tests will also be performed to determine whether the drug is an inducer or inhibitor (or neither) of metabolizing enzymes, again with a focus on CYP450.[/not-level-membership-for-basic-science-category]
