Regulation of Intermediatory Metabolism During Fasting and Feeding
Glucose Metabolism: Methodological Considerations
Glucose Metabolism: Basal (Postabsorptive) State
In the fasting (or postabsorptive) state, the plasma glucose concentration in a healthy adult is maintained within a very narrow range: 65 to 105 mg/dL (3.6 to 5.8 mmol/L). Under these conditions, insulin-independent tissues, the brain (50% to 60%), and splanchnic organs (20% to 25%) account for the majority of total body glucose utilization. Muscle, an insulin-dependent tissue, is responsible for most of the remaining 20% to 25% of glucose disposal.1,2 The basal rate of tissue glucose uptake is precisely matched to the rate of glucose output by the liver. After the ingestion or infusion of glucose, this fine balance between hepatic glucose production and tissue glucose utilization is disrupted, and the maintenance of normal glucose homeostasis in the fed state is dependent on four processes that occur simultaneously and in a coordinated fashion: (1) in response to hyperglycemia, insulin secretion is stimulated; (2) the combination of hyperinsulinemia and hyperglycemia augments glucose uptake by splanchnic (liver and gut) and peripheral (primarily muscle) tissues; (3) both insulin and hyperglycemia suppress hepatic glucose production; (4) insulin inhibits lipolysis in adipocytes, and the reduction in plasma free fatty acid (FFA) concentration enhances muscle glucose uptake and facilitates the suppression of hepatic glucose production.3 Glucose uptake by fat cells accounts for <10% of an ingested or infused glucose load in a lean adult in whom fat mass averages 25% of body weight (women) and 15% (men). Adipose tissue glucose uptake can increase to 15% to 20% of ingested glucose in the obese subject. In this chapter, we review the whole-body and cellular mechanisms by which pancreatic hormones (insulin and glucagon) regulate the normal trafficking of substrates between the splanchnic tissues (liver and gastrointestinal tract) and the glucose-utilizing organs in the fed and fasting conditions.
Energy Metabolism
From the quantitative standpoint, fat represents the major energy source in the body (Table 10-1). An adult of ideal body weight (70 kg) possesses approximately 12 kg of triglyceride, which is stored within adipose tissue.4 If this fat were completely mobilized and oxidized, it would provide about 110,000 kcal. Assuming an average metabolic rate of 2000 kcal/day, this would be sufficient to sustain the body’s energy needs for 55 days. In addition to its abundance, fat is a more efficient energy source than either glycogen or protein, because 9.5 kcal is generated for every gram of fat that is completely oxidized. The comparable energy value for glycogen and protein is 4 kcal/g. Moreover, fat is a less cumbersome storage form of energy because it exists in a nearly anhydrous form in the adipocyte, whereas each gram of glycogen and protein requires approximately 3 g of water. From these considerations, it is obvious that the caloric density of adipose tissue (∼8.5 kcal/g of fat) is much greater than the caloric density of either glycogen or protein (∼1 kcal/g). Viewed in another way, if one were to replace the amount of energy stored in fat with an equivalent amount of energy in the form of glycogen or protein, the body weight of our hypothetical 70-kg man would expand to 160 kg. This has major adaptive disadvantages for a species that depends on mobility for survival.
Table 10-1
Tissue and Circulating Energy Content Provided by the Three Major Fuels: Fat, Carbohydrate, and Protein
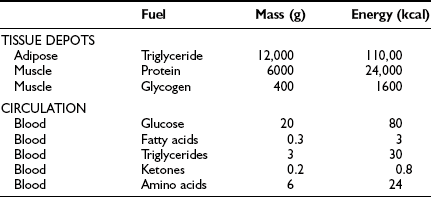
Data from Ruderman NB, Tornheim K, Goodman MN: Fuel homeostasis and intermediary metabolism of carbohydrate, fat, and protein. In Becker KL (ed): Principles and Practice of Endocrinology and Metabolism. Philadelphia: Lippincott, 1992, pp 1054–1064.
Because the major storage form of energy in the body is fat, but the brain and other neural tissues have an obligate need for glucose, the body must have a readily available form of carbohydrate. This is provided by glycogen. In a 70-kg man, approximately 80 g of carbohydrate is stored as liver glycogen and 400 g as muscle glycogen.4 Because muscle does not contain glucose 6-phosphatase (G6Pase), it cannot generate free glucose for transportation to other tissues. However, glycogenolysis in muscle can provide a readily available source of glucose for local needs in response to acute muscular activity. In addition, muscle-derived lactate, pyruvate, and alanine can be transported via the blood to the liver, where they are used for gluconeogenesis during starvation. In contrast to muscle, the liver contains all the necessary enzymatic machinery to produce free glucose from glycogen and to synthesize new glucose from gluconeogenesis precursors. Thus for short-term metabolic needs, liver glycogen represents the principal carbohydrate reservoir for the energy needs of the brain. As can be seen in Table 10-1, the amount of energy contained in circulating glucose is quite small.
From a theoretical standpoint, protein also represents a large reservoir of energy. A 70-kg man possesses approximately 6 kg of protein with a potential energy value of 24,000 kcal.4 However, each protein in the body has a specific function—for example, an integral constituent of cell membranes and organelles, an enzyme, a contractile element such as actin or myosin, or a specific transporter of some essential nutrient, element, or vitamin. An excessive breakdown of protein would lead to the disruption of normal cell function and eventually to death. Therefore, the body has developed a complex metabolic and hormonal response to fasting that minimizes proteolysis and release of amino acids. Thus when fasting is prolonged beyond 2 to 3 days, there is a major shift from carbohydrate to fat and ketone body utilization. After 1 to 2 weeks of starvation, the rates of gluconeogenesis and glucose utilization are markedly reduced, and ketone bodies become an important substrate for the energy needs of the brain and other neuronal tissues. However, the brain always maintains a need for some glucose. Acetone, which is formed by the nonenzymatic decarboxylation of acetoacetic acid, can serve as a gluconeogenic precursor by being converted to pyruvaldehyde in the liver or to 1,2-propanediol in extrahepatic tissues. The rise in circulating blood ketone levels also provides a signal to the muscle to inhibit protein catabolism, thus sparing amino acids for vital cell functions.
Glucose Distribution
As a metabolic substrate, carbohydrate is present in organisms in its simple monomeric form, α-d-glucopyranose, and as a branched polymer of α-glucose, namely, glycogen. Disaccharides of glucose include lactose, maltose, and sucrose, but these are quantitatively less important. In normal subjects, glucose circulates in plasma water at a basal concentration that ranges from 65 to 100 mg/dL (3.6 to 5.6 mmol/L). After a meal, the plasma glucose concentration in healthy individuals does not exceed 160 to 180 mg/dL (8.9 to 10 mmol/L). Circulating plasma glucose is in rapid equilibration with the red blood cell (RBC) glucose concentration.5 A non-insulin-regulatable transporter effects the facilitated diffusion of glucose from plasma water into the RBC.6 Because of the abundance of this transporter in RBCs, glucose diffuses very rapidly across RBC membranes, with an estimated equilibration time of only 4 seconds. After its transport into the cell, the rate of glucose utilization via glycolysis has been estimated to be approximately 25 µmol/min or 6 µmol/min per square meter of diffusion surface (each RBC is 7 µm in diameter and 2 µm thick; a total RBC mass of 2 to 3 × 10¹³ cells exposes a surface area of ∼4 m2).5 Because this rate is ∼17,000 times slower than the rate of glucose transport into the erythrocyte, the glucose concentration will, in general, be the same in plasma and erythrocyte water. Plasma proteins comprise some 8% of plasma volume, whereas RBC proteins and ghosts occupy ca. Thirty-eight percent of the packed RBC volume (which, in turn, averages 40% of the total blood volume). Thus 20% (i.e., 0.38 × 0.4 + 0.08 × 0.6 = 0.2) of the total blood volume is inaccessible to glucose. It follows that glucose concentration should be identical in plasma and RBC water under most circumstances and that a blood water glucose concentration of 90 mg/dL (5.0 mmol/L) translates into a plasma glucose concentration of 83 mg/dL (4.6 mmol/L) and a whole-blood glucose concentration of 72 mg/dL (4.0 mmol/L), that is, a 15% systematic difference between plasma and whole-blood glucose concentration under typical conditions of hematocrit, proteinemia, and erythrocyte volume.
Glucose Metabolism: Methodological Considerations
Because both RBCs and plasma transport glucose, the total amount of the sugar reaching any given organ is the product of the arterial whole-blood glucose concentration times the total blood flow to that organ. Similarly, the total amount of glucose leaving a body region is the product of whole-blood glucose level in the venous effluent times the blood flow rate. From this, it follows that the net balance of glucose movement across a body region is given by the product of blood flow and the arteriovenous whole-blood glucose concentration difference, or the Fick principle (Fig. 10-1). It should be emphasized that the use of plasma flow rates and plasma glucose concentration systematically underestimates the net organ balance of glucose (and, for that matter, of any substance that is transported in plasma as well as in RBCs, e.g., lactate, some amino acids). Because the plasma flow is less than the blood flow by an amount equal to the hematocrit (∼40%), whereas the plasma glucose concentration is higher than whole-blood glucose by only 15% (0.6 × 1.15 = 0.69), this will lead to a 31% underestimation of the net organ balance.
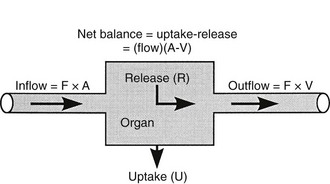
FIGURE 10-1 Schematic representation of substrate (e.g., glucose) exchange across an organ (e.g., the liver) that both irreversibly removes the substrate and adds it to the systemic circulation. A, Arterial concentration; F, blood flow; V, venous concentration.
In muscle, which does not contain G6Pase, the net organ balance is equivalent to the amount of glucose that is taken up and metabolized. In the liver, however, there can be simultaneous uptake and release (from hepatic glycogen stores or gluconeogenesis). By combining the organ balance technique with tracer glucose (labeled with radioactive, e.g., tritium [3H], or stable isotopes, e.g., deuterium [2H]) one can calculate the uptake of glucose by an organ bed according to the following equation7:

where FE is the fractional extraction of tracer glucose—calculated as (A* − V*)/A*—and A* and V* represent the radioactivity of labeled glucose (or the tracer/tracee ratio in the case of stable isotope tracers) in the artery and vein, respectively. If one knows the net balance of glucose (or any other substrate) across an organ bed and the unidirectional uptake, one can calculate the release of glucose (or any other substrate) according to the following relationship (see Fig. 10-1):
By employing the catheter technique to measure the net organ balance of glucose in combination with tracer glucose, much information can be gained about the interorgan exchange of glucose and other substrates, as well as the metabolic pathways involved in the regulation of glucose utilization. The use of a glucose tracer also allows one to measure whole-body glucose (or other substrates) turnover.8 Because of its simplicity, the isotope dilution method has become popular among clinical investigators and has generated large amounts of information. It therefore warrants a brief description here; a more detailed explanation of the tracer technique, as applied to glucose turnover measurement, can be found in Ref. 8. The choice of a tracer is dictated by cost, ease of measurement, and safety (radiation burden in the case of radioactively labeled tracers). The tracer can be administered as a pulse injection or constant intravenous infusion, depending on the type of information that is desired. For metabolic studies, a primed continuous infusion usually is employed. When both the tracee (i.e., cold glucose) and tracer (e.g., radiolabeled glucose) are in steady state, the glucose turnover rate (milligrams per minute) is simply calculated by dividing the tracer infusion rate by the equilibrium plasma glucose specific activity. In normal healthy subjects, equilibrium represents the time (usually ∼2 hours after starting the tracer infusion) when unchanging plasma tracer and tracee concentrations indicate that glucose specific activity has become uniform throughout its distribution space. The calculation of the turnover rate as described previously (infusion rate/plasma specific activity) is not based on any assumptions and can be used to quantitate glucose turnover in the postabsorptive state. When non-steady-state conditions apply, this approach cannot be used. Such is the case after glucose ingestion or infusion. Practical ways to circumvent this problem, however, have been developed. Their common rationale is provided by the theory that the degree and rate of change in glucose-specific activity are the principal factors that affect non-steady-state analysis of isotope data. The larger the swings in glucose-specific activity are, the more uncertain is the estimation of the actual rates of glucose appearance and disappearance from plasma data. All the formal models that have been proposed to represent the glucose system become progressively weaker as plasma glucose–specific activity is allowed to fluctuate freely. Therefore, one of two strategies can be employed. Either the tracer administration is repeated when the glucose system has reached a new, reasonably steady state or tracer glucose infusion rates can be adjusted empirically to “clamp” the plasma glucose–specific activity constant close to the basal level. In both cases, the aim is to minimize the changes in glucose-specific activity, thereby meeting the conditions under which steady-state equations can be used reliably. Therefore, in reporting results of glucose turnover obtained under non-steady-state conditions, we will make some selection of available data.
Glucose Metabolism: Basal (Postabsorptive) State
By convention, the basal or postabsorptive state is defined as the metabolic condition that prevails in the morning after an overnight (10 to 14 hours) fast. For most individuals, this time represents the longest period of fasting in everyday life. For the rest of the day, most people are more or less in the fed state. Maintenance of the fasting plasma glucose concentration is primarily the responsibility of the liver.9,10 The liver provides glucose for all tissues of the body, either by breaking down its own stores of glycogen or by synthesizing glucose from gluconeogenic precursors, of which the most important are lactate, pyruvate, glycerol, alanine, and other gluconeogenic amino acids. The central role of the liver in providing a constant supply of glucose to the body is related to the presence of G6Pase, which catalyzes the conversion of glucose 6-phosphate (G6P) to glucose within the hepatocyte. Although a number of tissues, including muscle and adipocytes, possess the enzymatic machinery necessary to degrade glycogen and synthesize G6P from lactate and amino acids, they either completely lack or possess too little of the key enzyme, G6Pase, to release significant amounts of free glucose into the circulation. The kidney, like the liver, also possesses the necessary enzymatic apparatus to produce glucose via the gluconeogenic pathway and to release it into the circulation. In normal subjects after an overnight fast, the kidney contributes ∼10% of total body glucose production.11 During prolonged starvation and metabolic acidosis, renal gluconeogenesis is enhanced and may contribute as much as 25% of basal glucose production. Unlike the liver, the major gluconeogenic precursor for the kidney is glutamine.
Under postabsorptive conditions, glucose output in healthy adults averages 140 mg/min (778 µmol/min) or 2.0 mg/min per kg of body weight (11 µmol/min per kilogram) in a 70-kg individual (Fig. 10-2). The variation around this mean is significant (20% to 30%), with an unknown contribution of genetic and environmental factors. Little information is available concerning how much the fasting glucose output varies as a consequence of changes in dietary habits, caloric intake, or physical fitness. Intrafamilial covariance of this physiologic variable also is undetermined. Under standard nutritional conditions, the normal liver contains approximately 80 g of glycogen (see Table 10-1), and during fasting, liver glycogen stores decline at a rate of approximately 110 mg/min (611 µmol/min) or 8% per hour. From this it follows that hepatic glycogen depots would become empty after approximately 12 hours. Because fasting can be prolonged well beyond 12 hours, it is obvious that gluconeogenesis must progressively replace glycogenolysis as the fast continues.12 In animals, the basal rate of glucose turnover is considerably higher than in humans—for example, dogs (3.6 mg/min per kilogram) and rats (7.2 mg/min per kilogram)—and the limited capacity of the liver to store glycogen confers an increasing role to gluconeogenesis for the maintenance of basal glycemia. This limitation on glycogen accumulation has an anatomic basis, because stuffing the cytoplasm with glycogen granules impairs cellular functions and results in liver damage, as seen in patients with glycogen storage diseases. In healthy subjects, after a 10- to 12-hour overnight fast, gluconeogenesis accounts for approximately 50% of total hepatic glucose release (see Fig. 10-2).12 The substrates for this de novo glucose synthesis remain somewhat elusive. Circulating lactate, pyruvate, glycerol, alanine, and other gluconeogenic amino acids are natural candidate precursors and have been shown to transfer their carbons to newly synthesized glucose molecules, as documented by the incorporation of labeled lactate into glucose, that is, the Cori cycle. However, transsplanchnic catheterization in humans has shown that the net uptake of known circulating gluconeogenic precursors (lactate, pyruvate, glycerol, amino acids) can account for only 15% to 20% of total endogenous glucose production.13 The discrepancy between radioisotopic estimates of basal gluconeogenic rate and accountable circulating precursors suggests that the bloodborne substrates may not be the only source of gluconeogenic precursors. Within the splanchnic area, the intestine returns 10% to 20% of its glucose uptake to the liver as lactate, but this fills only part of the gap. It has been suggested that intrahepatic proteolysis and/or lipolysis could provide ample amounts of gluconeogenic precursors in addition to those entering from the systemic circulation.
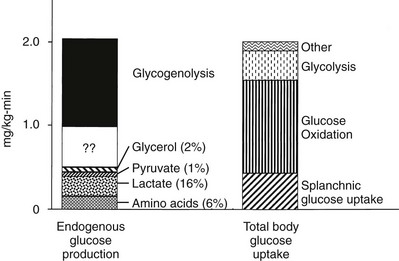
FIGURE 10-2 Hepatic glucose production and tissue glucose uptake in the postabsorptive state in healthy subjects. See text for a more detailed discussion. (Reproduced from DeFronzo RA: Pathogenesis of type 2 diabetes: metabolic and molecular implications for identifying diabetes genes. Diabetes Rev 5:177–269, 1997.)
The regulation of basal hepatic glucose production is controlled by the sum of multiple neural, hormonal, and metabolic stimuli, some stimulatory and others inhibitory.9,10 Fig. 10-3 portrays the control system as a simple balance between inhibition and stimulation. Insulin and glucagon provide the primary hormonal signals that regulate the production of glucose by the liver under postabsorptive conditions. Of the two, the action of insulin normally predominates. Hepatic glucose production is exquisitely sensitive to very small fluctuations in the circulating plasma insulin concentration. Increments in the plasma insulin concentration of as little as 5 to 10 µU/mL cause a marked, rapid suppression of glycogenolysis and decline in hepatic glucose output, whereas inhibition of gluconeogenesis is less sensitive.10
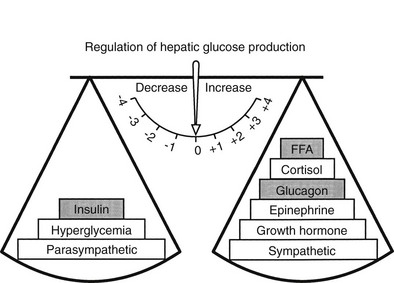
FIGURE 10-3 Balance of factors that regulate hepatic glucose production. Stimulatory factors are shown by the positive numbers to the right; inhibitory factors, of which insulin is dominant, are shown by the negative numbers to the left.
By restraining lipolysis and proteolysis, insulin also reduces the delivery of potential glucose precursors (glycerol and amino acids) from peripheral tissues (adipocytes and muscle) to the liver, and this further reduces hepatic glucose output. In its capacity as the inhibitory signal for glucose release, insulin is greatly favored by the anatomic connection between the pancreas and the liver. Because the pancreatic vein is a tributary of the portal vein, insulin, which is secreted by the β cells, reaches the liver in fasting humans at a concentration that is three to four times higher than the peripheral (arterial) concentration. This steep portosystemic gradient is maintained by the high rate of insulin degradation by hepatic tissues (fractional insulin extraction = 50%). Consequently, a small secretory stimulus to the β cells will disproportionately raise the portal insulin concentration, thereby selectively acting on glucose production rather than enhancing peripheral glucose utilization. In addition to short-circuiting the general circulation, pancreatic insulin release is potentiated by a number of gastrointestinal hormones (e.g., glucose-dependent insulinotropic polypeptide, glucagon-like peptide-1, secretin, cholecystokinin, pancreozymin, and others, which are released in response to meal ingestion).14 Therefore, anatomic and physiologic connections that comprise the gut-liver-pancreas axis ensure that the primary station for the handling of foodstuff, the liver, is under close control by a nearby, well-informed unit, the β cell.
Conversely, small decrements in the peripheral plasma insulin concentration, as little as 1 to 2 µU/mL, lead to an increase in hepatic glucose production.15 This highly sensitive interaction between the liver and insulin plays a critical role in the maintenance of basal glucose levels when fasting is prolonged. As glycogen stores become depleted, there is a small decrease in the arterial glucose concentration, which in turn leads to a decline in pancreatic insulin secretion and stimulation of glucagon release. The resultant hypoinsulinemia removes the constraint on lipolysis, and plasma FFA levels rise. By mass action, FFAs enhance their own uptake by all cells in the body, including liver and muscle. Enhanced FFA oxidation by the hepatocytes provides an energy source to drive gluconeogenesis, and the end product of beta oxidation, acetyl-CoA, stimulates the first committed enzyme, pyruvate carboxylase, in the gluconeogenic pathway (Fig. 10-4).1,2 The combination of hypoinsulinemia, hypoglycemia, and increased FFA and amino acid supply also stimulates hepatic gluconeogenesis. In peripheral tissues, enhanced FFA and ketone oxidation spare glucose utilization (Randle cycle; see subsequent discussion), thereby minimizing the need for carbohydrate as an energy source.1,2
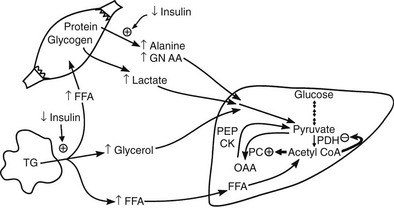
FIGURE 10-4 In the fasting state, the decrease in basal plasma insulin concentration removes the inhibitory effect of the hormone on lipolysis and plasma glycerol, and FFA levels increase. In the hepatocyte, enhanced delivery of FFA, in combination with a decreased insulin/glucagon ratio, stimulates beta oxidation, leading to the accumulation of acetyl-CoA. Increased acetyl-CoA, by inhibiting pyruvate dehydrogenase and stimulating pyruvate carboxylase in the liver, shuttles pyruvate into the gluconeogenic pathway. Hypoinsulinemia also stimulates proteolysis in muscle and the enhanced delivery of alanine, other gluconeogenic amino acids, glycerol, and lactate from peripheral tissues, thereby providing the substrates for accelerated hepatic gluconeogenesis. AA, Amino acids; FFA, free fatty acids; GN, gluconeogenic; OAA, oxaloacetic acid; PC, pyruvate carboxylase; PDH, pyruvate dehydrogenase; PEPCK, phosphoenolpyruvate carboxykinase; TG, triglyceride.
Another important consequence of the fasting-related decline in plasma insulin concentration is the stimulation of proteolysis.15 This augments the outflow of amino acids, especially alanine, which accounts for approximately 50% of total α-amino nitrogen release. The predominance of alanine in the amino acid efflux from muscle cannot be explained by its presence in cellular proteins, of which alanine accounts for only 7% to 10%. The major source of alanine outflow from muscle during starvation is derived from the transamination of glucose-derived (from muscle glycogen and circulating glucose) pyruvate. The branched-chain amino acids (valine, leucine, isoleucine) provide the amino groups for muscle alanine synthesis. The alanine that is released from muscle is transported via the bloodstream to the liver, where it is converted to glucose, thus completing the glucose-alanine cycle (see Fig. 10-4).13 The glucose-lactate cycle (Cori cycle) also provides an important source of three-carbon skeletons for gluconeogenesis during fasting.15 Insulinopenia enhances the breakdown of glycogen and leads to accumulation of pyruvate. Because the Krebs cycle has been inhibited by the accelerated rate of FFA oxidation (Randle cycle), the pyruvate can either be transaminated to alanine (glucose-alanine cycle) or converted to lactate and released into the circulation, where it is carried to the liver and synthesized into glucose (glucose-lactate cycle). From the quantitative standpoint, approximately twice as many carbon skeletons are recycled to glucose via the Cori cycle compared with the alanine cycle.
The counterregulatory hormones (glucagon, epinephrine, growth hormone, cortisol, thyroid hormones) all are capable of offsetting the action of insulin on the liver and work by stimulating both glycogenolysis and gluconeogenesis.16 Glucagon plays a major role in the tonic support of basal hepatic glucose release and, in humans and animals, experimental suppression of endogenous glucagon secretion with preservation of basal insulin levels causes a 30% to 40% decline in hepatic glucose production.17 This suppression of glucose production involves both the glycogenolytic and gluconeogenic pathways. The precise quantitative contribution of the other counterregulatory hormones to the maintenance of basal glucose output under normal conditions of fasting has not been assessed. However, it is likely that they (i.e., epinephrine, cortisol, and growth hormone) also exert a tonic effect on hepatic glucose production in the postabsorptive state, and the withdrawal of insulin (i.e., hypoinsulinemia) that occurs with prolonged fasting allows their stimulatory effect on glycogenolysis and gluconeogenesis to occur unopposed. The net result of their unopposed action is an increase in hepatic glucose and renal output.
During more pronounced hypoglycemia, as may occur with insulin administration, all the counterregulatory hormones are released and act synergistically to restore normoglycemia.16 However, they do so with different dose-response kinetics and time courses. Glucagon and catecholamines act rapidly, whereas cortisol, growth hormone, and thyroid hormones (in that order) are involved in the long-range control of hepatic glucose release. Small, acute increases in plasma glucagon and epinephrine concentrations markedly stimulate both glycogenolysis and gluconeogenesis. Acute elevations in plasma cortisol, growth hormone, and thyroid hormones have no stimulatory effect on total hepatic glucose release. However, both cortisol and growth hormone have been shown to markedly potentiate the effects of epinephrine and glucagon on hepatic glucose release.
In addition to hormonal regulation, the central nervous system has an important role in the maintenance of hepatic glucose production.18 Both parasympathetic and sympathetic fibers reach the liver via the splanchnic nerves, thereby supplying autonomic neural modulation of both glucose production and uptake. In animals, parasympathetic stimulation restrains glycogenolysis and enhances glycogen synthesis, whereas activation of the sympathetic nerves innervating the liver stimulates glucose output via potentiation of both glycogenolysis and gluconeogenesis. In humans, the influence of the sympathetic nervous system on hepatic glucose metabolism can be demonstrated under conditions of acute stimulation, but the contribution of the autonomic nervous system to the maintenance of basal hepatic glucose production remains undetermined.
A number of metabolic signals play an important role in the control of hepatic glucose production in the postabsorptive state.9,10,19 Hyperglycemia per se inhibits liver glucose output. In normal adults, hyperglycemia and hyperinsulinemia occur concurrently, and in combination they provide a potent stimulus to suppress hepatic glucose release. As shown in Fig. 10-5, physiologic hyperglycemia (maintained using the hyperglycemic clamp technique), while maintaining basal insulinemia, is as effective as insulin in suppressing hepatic glucose production. More impressive is the observation that hyperglycemia in the presence of hypoinsulinemia (hyperglycemic clamp with somatostatin) causes a greater than 50% suppression of hepatic glucose release (see Fig. 10-5). Conversely, hypoglycemia by itself provides a trigger to increase hepatic glucose release. During insulin-induced hypoglycemia in humans and animals, an increase in plasma glucose occurs even when the counterregulatory hormonal response is inhibited (glucose autoregulation). Recent studies suggest that this effect of hypoglycemia is mediated via glucose sensors in the hypothalamic region of the brain, which activate hepatic glycogenolysis via sympathetic connections to the liver.20
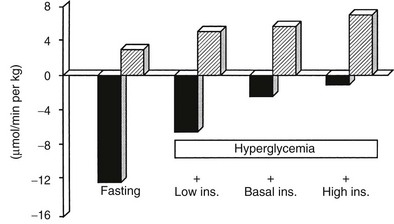
FIGURE 10-5 Splanchnic glucose uptake (hatched columns) and hepatic glucose production (solid columns) in healthy subjects under four experimental conditions: overnight fast; hyperglycemia (+125 mg/dL) with somatostatin blockade of endogenous insulin release (Low Ins.); hyperglycemia (+125 mg/dL) with somatostatin plus insulin replacement to maintain the fasting insulin concentration constant (Basal Ins.); hyperglycemia (+125 mg/dL) with endogenous insulin (55 µU/mL) release. Note that hyperglycemia per se inhibits hepatic glucose production and that hyperglycemia acts synergistically with insulin to inhibit liver glucose output. In contrast, hyperglycemia stimulates glucose uptake to approximately the same extent in the presence of low, basal, or high insulin, that is, mostly by mass action. (Drawn from the data from DeFronzo RA, Ferrannini E, Hendler R et al: Regulation of splanchnic and peripheral glucose uptake by insulin and hyperglycemia in man. Diabetes 32:35–45, 1983.)
Altered substrate delivery to the liver also influences glucose release by the liver. In nondiabetic humans, it is difficult to demonstrate a detectable increase in hepatic glucose production by infusing large quantities of glycerol, lactate, or a mixture of amino acids, as long as there occurs a physiologic increase in plasma insulin concentration to balance out such gluconeogenic push. However, even though total hepatic glucose output does not increase, there is a marked stimulation of gluconeogenesis that is precisely counterbalanced by an inhibition of glycogenolysis. The increased provision of gluconeogenic precursors leads to an increase in the intrahepatic formation of G6P, but the eventual fate of this intermediate is glycogen rather than free glucose, because the rate-limiting enzyme for glucose production, G6Pase, is not simultaneously activated. FFAs play an important role in setting the level of hepatic glucose production. Only the odd-chain FFAs (i.e., propionate) can donate their carbon atoms to oxaloacetate in the tricarboxylic acid cycle and thus directly contribute to net gluconeogenesis. Most physiologic FFAs are of even chain, and although they can exchange their carbon moieties with tricarboxylic acid cycle intermediates, they do not contribute to de novo glucose synthesis. Nonetheless, when the perfusion medium of isolated rat liver is enriched with oleate or palmitate, new glucose formation from lactate or pyruvate is enhanced. The biochemical mechanisms involved in this stimulation of gluconeogenesis have been well worked out.21 The products of FFA oxidation, citrate and acetyl-CoA, activate the key enzymes that control gluconeogenesis, pyruvate carboxylase, phosphoenolpyruvate carboxykinase, and G6Pase (see Fig. 10-4). In addition, elevated plasma FFA concentrations in vivo are usually accompanied by raised glycerol levels because both result from the hydrolysis of triglycerides (see Fig. 10-4). Therefore, accelerated lipolysis supplies both the stimulus (FFA), the substrate (glycerol), and the energy source (ATP) to drive gluconeogenesis. In isolated hepatocytes, FFAs in micromolar amounts also have been shown to inhibit glycogen synthase. This suggests that an additional interaction of FFA metabolism with hepatic glucose production may be at the level of glycogen metabolism. In healthy volunteers, short-term infusion of triglycerides (with heparin to activate lipoprotein lipase) increases the plasma FFA concentration, leading to the stimulation of hepatic glucose output under conditions (i.e., hyperglycemia and insulinopenia induced by somatostatin plus glucose infusion) that mimic the diabetic state.22 A large part of this effect can be reproduced by infusing, under the same experimental circumstances, glycerol alone. On the other hand, when endogenous insulin is allowed to increase or when exogenous insulin is administered, the stimulatory effect of triglyceride infusion to increase the plasma FFA concentration on hepatic glucose release is easily overcome. In summary, the long-chain FFAs can regulate hepatic glucose production both by acting on the key enzymes of gluconeogenesis (i.e., through buildup of the products of FFA oxidation) and by virtue of the substrate push of glycerol. This regulatory loop is operative particularly when insulin secretion is not stimulated (i.e., in the basal state). Conversely, studies in both animals and humans have documented that a significant part of the suppressive action of insulin on hepatic glucose production is mediated via the hormone’s antilipolytic effect on adipocytes.10,23 If the plasma FFA concentration is maintained during insulin infusion, the inhibitory effect of physiologic hyperinsulinemia on hepatic glucose production is impaired.
Glucose Disposal
In the basal (postabsorptive) state, the rate of whole-body glucose disposal equals the rate of hepatic glucose production, and the plasma glucose concentration remains constant.1,2 Information about the contribution of individual organs and tissues to total glucose uptake has been obtained in regional catheterization studies performed in combination with glucose tracers and indirect calorimetry.24 By collating the available information, the organ circulation model depicted in Fig. 10-6 can be constructed.5 In this synthesis, steady-state interorgan exchanges of glucose, tissue blood flow, and regional glucose gradients are calculated based on a rate of hepatic glucose production of 140 mg/min (778 µmol/min). For a 70-kg man, this equals 2.0 mg/min per kilogram or 11 µmol/min per kilogram. In the postabsorptive state, approximately 70% of basal glucose disposal takes place in insulin-independent tissues (brain, liver, kidney, intestine, RBC). Of these, the brain predominates and accounts for almost half of the total hepatic glucose production. The liver plus gastrointestinal (splanchnic) tissues account for an additional 20%. It also can be appreciated that the fractional extraction of glucose (as defined earlier) is quite low everywhere in the body (ranging from 1.0% to 3.5%) except in the brain (9%) (Table 10-2). Because skeletal muscle represents 40% of total body weight and receives 16% of the cardiac output, one can calculate that it accounts for one third of the overall glucose disposal in the basal state (i.e., ∼245 µmol/min or 44 mg/min) (see Fig. 10-6).1,2,5 As shown in Table 10-2, the muscle glucose clearance averages 1.3 mL/min per kilogram of tissue. Glucose clearance is a useful metabolic concept and is defined as the amount of plasma that is completely cleared of glucose in a given period; as such, it provides an index of the efficiency of tissue glucose removal. In the rank of efficiency of tissue glucose clearance in the basal state, resting muscle is last, being 10 times less active than the liver and 50 times less avid than the brain. It is noteworthy that tissues (brain, liver, kidneys) that have a high glucose clearance in the basal state are insulin independent. Increasing the plasma insulin concentration above fasting values has no effect on glucose clearance by these tissues (i.e., brain, liver, kidneys), whereas in muscle, glucose clearance increases by a factor of 10 or greater over the physiologic range of insulin concentrations. The intermediate position of heart muscle in the list is accounted for by its constant working state.
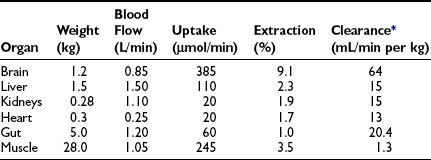
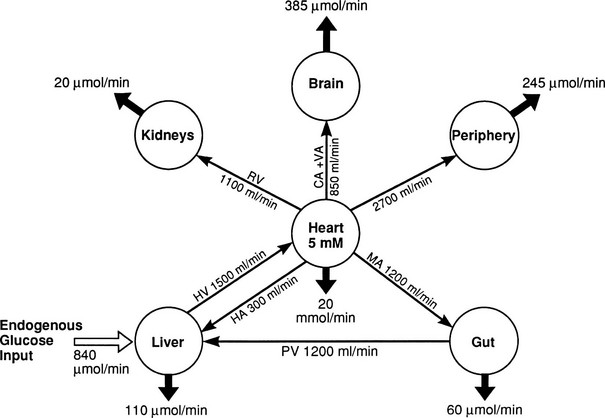
FIGURE 10-6 Schematic representation of organ glucose metabolism and blood flow in the basal (or postabsorptive) state. Average data compiled for healthy adults from the literature are indicated. Periphery encompasses all tissues other than the liver, gut, kidneys, brain, and heart; gut includes organs (i.e., spleen, pancreas) draining their blood supply into the portal circulation. Organ blood flow is shown in mL/min and glucose fluxes in mg/min (µmol/min). CA, Carotid arteries; HA, hepatic artery; HV, hepatic vein; MA, mesenteric arteries; PV, portal vein; RV, renal veins; V, vertebral artery. (Redrawn from Ferrannini E, DeFronzo RA: Insulin actions in vivo: glucose metabolism. In DeFronzo RA, Ferrannini E, Keen H, Zimmet P [eds]: International Textbook of Diabetes Mellitus. Chichester, UK: John Wiley & Sons, 2004, pp 277–318.)
These organ-specific glucose clearance characteristics (see Table 10-2) represent the physiologic equivalent of the type and abundance of specific glucose transporters (GLUTs) the various tissues express (Table 10-3).2,6 They also help to define the concept of an insulin-independent tissue. Thus in tissues in which an increase in the plasma insulin concentration does not accelerate the glucose clearance, the GLUT is not responsive to acute changes in the plasma insulin concentration. At present, several GLUT isoforms have been isolated.2,6 A non-insulin-regulatable GLUT (GLUT-1) effects facilitated glucose transport in RBCs. The abundance of this transporter in RBCs ensures rapid diffusion of glucose across the RBC membrane, and this characteristic confers on RBCs an important role in the interorgan exchange of glucose. The same GLUT-1 transporter is present in the brain. Because of its low Km (∼1 mmol/L), it saturates at plasma glucose concentrations well below the normal fasting plasma glucose concentration (∼5 mmol/L), thereby ensuring a constant flux of glucose into the brain cells. This is an important adaptive mechanism that provides the cerebral tissues an adequate supply of fuel even in the face of hypoglycemia. Another unique feature of GLUT-1 is its low Vmax (∼3 mmol/L). This protects the brain against acute fluid shifts and cerebral edema that otherwise would accompany hyperglycemia. Thus GLUT-1 is well suited for its physiologic function, especially in the individual with insulin-dependent diabetes in whom extreme shifts in plasma glucose concentration (from hypoglycemia to hyperglycemia) are common. Another important corollary of GLUT-1 is that an increase in plasma glucose concentration above fasting levels (i.e., >5 mmol/L) will necessarily lead to a decline in brain glucose clearance because the transporter saturates at approximately 3 mmol/L. Moreover, because under postabsorptive conditions the brain is responsible for approximately half of the total body glucose disposal, it also follows that an increase in fasting plasma glucose concentration (with or without an increase in plasma insulin) will be associated with a decline in whole-body glucose clearance.
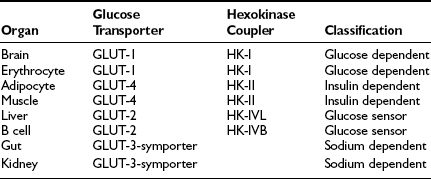
A totally distinct (from the physiologic standpoint) GLUT, GLUT-2, is present in liver and pancreatic β cells.2,6 It has a high Km (∼15 to 20 mmol/L), and as a consequence, the free glucose concentration in cells expressing this transporter increases in direct proportion to the increase in plasma glucose concentration. This characteristic allows these cells to respond as “glucose sensors.”1,2 As the ambient glucose concentration increases, more glucose enters the β cell, which responds by appropriately augmenting its secretion of insulin, whereas the liver reads the rising plasma glucose level and decreases its output of glucose. As a corollary of this, an increase in the plasma glucose concentration is associated with a proportional increase in glucose uptake by these tissues with an unchanging glucose clearance. Because GLUT-2 does not respond to insulin, hyperinsulinemia is not associated with an increase in hepatic or β-cell glucose clearance.
It is noteworthy that each GLUT is associated with a specific hexokinase, which has a Km that parallels that of its associated GLUT.25 For liver and β cells, the phosphorylating enzyme is hexokinase IV or glucokinase. Its high Km constant has led investigators to propose glucokinase as the β-cell sensor. Consistent with this, recent studies have demonstrated that some forms of maturity-onset diabetes of the young (MODY) are associated with mutations in the glucokinase gene, and the physiologic counterpart of this is a defect in insulin secretion. Insulin-sensitive tissues, muscle, and adipocytes contain GLUT-4 and its physiologic coupler, hexokinase II. GLUT-4 has a Km constant of approximately 5 mmol/L, which is close to that of the plasma glucose concentration. In the basal state, the majority of GLUT-4 are not located in the plasma membrane but reside in vesicles within the cell. After exposure to insulin, the concentration of GLUT-4 in the plasma membrane of adipocytes and muscle increases markedly, and there is a reciprocal decline in the intracellular GLUT-4 pool.26 Insulin not only enhances their translocation and insertion into the plasma membrane but also augments their intrinsic activity. Thus, muscle glucose clearance increases markedly, 10-fold or greater, in response to increments in plasma insulin concentration within the physiologic range.1,2,27 GLUT-3, the other major GLUT, is present in the gut and kidney.2,6 It is sodium-dependent and does not respond to insulin. In the gut, it mediates unidirectional gastrointestinal absorption of glucose in the small intestine, whereas in the kidney, it regulates unidirectional glucose absorption in the proximal tubule. Although this transporter is insulin insensitive, it plays a crucial role in glucose homeostasis by regulating its entry into the body and preventing its loss via the kidney.
The intracellular disposition of transported glucose can be studied in vivo by using glucose tracers and then measuring the appearance of the label in specific metabolic products such as lactate (i.e., anaerobic glycolysis) and carbon dioxide (i.e, complete oxidation).8 These techniques, even when correctly applied, provide only estimates of the metabolic fate of plasma glucose. For example, should glycogen in muscle be oxidized directly, the plasma glucose–specific activity would miss it completely because plasma glucose does not equilibrate with the intracellular free-glucose pool. To circumvent this problem, investigators have employed indirect calorimetry, which measures total carbon dioxide production from all carbohydrate sources, both intracellular and extracellular.28 Although indirect calorimetry depends on a number of assumptions, these are reasonable and have been largely validated. Moreover, this technique is easy to apply and noninvasive. Indirect calorimetry also provides a good estimate of the rate of energy expenditure and complements information obtained by tracer methods. In the basal state and under ordinary nutritionally circumstances, oxygen consumption averages 250 mL/min, whereas carbon dioxide production is 200 mL/min—that is, the whole-body respiratory quotient equals 0.8 (respiratory quotient = carbon dioxide production/oxygen consumption). From the equations depicted in Table 10-4, whole-body carbohydrate oxidation can be estimated to account for approximately 60% of total glucose uptake in the postabsorptive state.24 Because the brain uses 46% of the total glucose turnover (see Table 10-2), and because essentially all brain glucose uptake is accounted for by oxidation, it follows that three fourths (i.e., 46/0.6 or 77%) of basal glucose oxidation occurs in the brain. Little is left for other tissues, which preferentially derive their metabolic energy from the oxidation of FFAs and other lipids under postabsorptive conditions. Skeletal muscle, for example, has a respiratory quotient of 0.75 and relies on fat oxidation for the production of 80% of the energy that it needs in the resting state. Thus the basal state is characterized by parsimonious use of glucose as a metabolic fuel.15 Moreover, the glucose is selectively channeled to organs that cannot rely on alternative energy sources. In the postabsorptive state, more than half of the total energy production is generated via oxidation of fat, of which there are plentiful stores (see Table 10-1). Insulin is the principal regulator that determines the metabolic mix of fuels in the basal state. A small decrement in the circulating hormone level releases the brake on lipolysis, and the plasma FFA concentration increases, thereby allowing fat to override glucose in the competition between the two substrates. Although these very small changes in plasma insulin concentration are sufficient to promote a shift in fuel metabolism from carbohydrate to fat, the plasma insulin level is still sufficiently elevated to maintain glucose transport and metabolism in target tissues at minimal rates and to restrain protein breakdown, which contributes only approximately 15% to basal energy metabolism.15 The role that counterregulatory (glucagon, epinephrine, cortisol, growth hormone, thyroid hormones) hormones play in basal glucose uptake is less well defined but probably centers on the maintenance of lipolysis, because all the insulin antagonistic hormones are more or less potent lipolytic stimuli.
Table 10-4
Indirect Calorimetry: Calculation of Carbohydrate and Lipid Oxidation and Energy Expenditure
| Net carbohydrate oxidation (µmol/min) | 25.3Vco2 − 17.8Vo2 − 16.0 N |
| Net lipid oxidation (µmol/min) | 6.5 (Vo2 − Vco2) − 7.5 N |
| Energy expenditure (kJ/min) | 0.0164Vo2 + 0.0046Vco2 − 0.014 N |
Glucose Cycles
After entry of glucose into the cell through a specific GLUT, the sugar does not necessarily follow a direct path to its eventual fate, be it glycogen, lactate, carbon dioxide, or pentoses. Rather, it may in part reach its destination via a number of circuitous routes that have become known as futile cycles. A metabolic futile cycle is one in which a precursor is converted into a product by a forward reaction and then resynthesized to the precursor. In such a reaction, there is no net product accumulation, but energy (ATP) is used. There are multiple examples of such futile cycles in the glucose metabolic pathway.29,30 The first involves the conversion of glucose to G6P by glucokinase and its subsequent reconversion to intracellular free glucose by G6Pase in the liver. Each turn of this cycle uses one molecule of ATP. Another example of a futile cycle is represented by the conversion of G6P to fructose-6-phosphate and back through the phosphoglucoisomerase reaction. Perhaps the best-studied futile cycle that is under the control of insulin is the conversion of fructose-6-phosphate to fructose-1,6-bisphosphate in the liver. The reverse reaction is regulated by fructose-1,6-bisphosphatase, whereas the forward reaction is catalyzed by phosphofructokinase (PFK). The latter enzyme is controlled by the energy status of the cell and key intracellular metabolites. High levels of ATP, acidosis, and citrate inhibit PFK, whereas ADP and alkalosis stimulate PFK. The most potent activator of PFK is fructose-2,6-bisphosphate, whose synthesis is stimulated by the enzyme fructose-2,6-bisphosphate kinase. This latter enzyme is under the control of insulin, and the PFK step, therefore, represents an important regulatory control point for insulin action.31
In general terms, whenever bidirectional flux through a metabolic pathway is simultaneously operative, there exists a cycle, regardless of the number of intermediate reactions and regardless of whether one or more tissues are involved. In the examples cited previously, the cycles occurred within individual cells. However, cycles also can exist between organs. In this regard, lipolysis in adipose tissue followed by partial reesterification of FFAs in the liver is a complete cycle. Another important cycle is the breakdown of proteins in the liver or other tissues. The glucose-alanine and glucose-lactate (Cori) loops13 also represent important cycles (see previous discussion) that provide conservation of carbon skeletons and transfer of α-amino groups between muscle and liver.
The derogatory connotation of futility has traditionally been reserved for those cycles that go on in the same cell. These cycles are, however, anything but futile. As elegantly discussed by Newsholme and Leech,29 a metabolic cycle with a reverberating internal loop provides the best kinetic stratagem to maintain the enzymes of a dormant pathway at a minimum of activity, while at the same time ensuring a high sensitivity gain for rapid amplification of incoming signals. The ATP cost of these cycles is itself a means of increasing the efficiency of energy dissipation. The fact that the activity of these cycles is under hormonal control (e.g., catecholamines, glucagon, and thyroid hormones enhance the cycling rate) establishes a mechanism for rapid modulation. In this way, these cycles become components of facultative thermogenesis. Equally important, the operation of these futile or substrate cycles allows the generation of metabolic intermediates that can modulate the activities of key enzymes and allow allosteric regulation.
Glucose Metabolism: Fed (Postprandial) State
The rate-limiting factor for the absorption of glucose is gastric emptying. Once glucose enters the small intestine, it is rapidly transported by a specific transport system (GLUT-3) that is sodium dependent. This transporter is unique to the intestine and kidney (see Table 10-3), which requires glucose to be transported against a steep concentration gradient. The gut (and kidney) epithelial cells use a sodium-glucose cotransport system to overcome the unfavorable glucose concentration gradient.32 Sodium is transported from the intestinal lumen into the epithelial cell down a favorable sodium gradient. Both sodium and glucose are bound to the transporter, and cellular entry of sodium brings with it glucose. The intracellular glucose exits via the basolateral membrane via a different GLUT (GLUT-1) that is similar to that in the erythrocyte. For glucose transport to continue, sodium also must be pumped out via the basolateral membrane to maintain the favorable sodium gradient for sodium entry from the lumen. This active step is efficiently carried out by a Na+/K+-ATPase pump. This coupled system, which effectively and rapidly transports glucose from the intestinal lumen into the interstitial fluid, is independent of insulin.
Quantitation of Insulin Sensitivity and Insulin Secretion
Because of the difficulties involved in following the gastrointestinal absorption of glucose and the continuously changing plasma glucose and insulin concentrations, the regulation of glucose homeostasis during the fed state has classically been investigated using intravenous glucose, which can be administered in formats that are more suitable for some formal analysis. The most detailed information concerning glucose utilization by the whole body, organs, and specific intracellular pathways has come from studies employing the insulin/glucose clamp technique33 in combination with indirect calorimetry, isotope turnover methodology, and limb (forearm and leg) catheterization. Because the insulin-glucose clamp technique has become the reference method for the study of glucose metabolism, this procedure is described briefly. The euglycemic insulin version of the clamp technique is shown in Fig. 10-7. An exogenous infusion of regular insulin is started at time zero and is given as a priming dose followed by a constant infusion (usually at a rate of 1 mU/min per kilogram or 40 mU/min per square meter or 240 pmol/min per square meter). Such an infusion quickly establishes a hyperinsulinemic plateau of approximately 70 to 80 µU/mL. A few minutes after starting the insulin, an infusion of 20% glucose is begun. Based on the plasma glucose concentration, which is measured every 5 to 10 minutes, and using the negative feedback principle, the glucose infusion rate is adjusted periodically to maintain the plasma glucose concentration constant at basal level. In response to the hyperinsulinemic stimulus, there is an initial delay in the onset of insulin-stimulated glucose disposal that lasts approximately 15 to 20 minutes.27 After this delay, there is a rapid increase in glucose utilization from 20 to 80 minutes, and this reaches a near-steady-state value of 5 to 10 mg/min per kilogram of body weight (27 to 54 µmol/min per kilogram) during the last 40 minutes of the insulin clamp in healthy young subjects.27 Because endogenous glucose production is completely or nearly completely (>90%) suppressed by insulin, and the plasma glucose concentration is clamped at the basal level, the rate of exogenous glucose infusion must equal the rate of glucose uptake by all tissues of the body and provides a quantitative measure of the amount of glucose metabolized (M). In insulin-resistant conditions (e.g., obesity and type 2 diabetes mellitus1,2), hepatic glucose production (measured with radiolabeled glucose or a stable isotope of glucose) is not completely suppressed and must be added to the rate of exogenous glucose infusion to obtain the true rate of total body glucose utilization. The higher the glucose metabolic rate (M), the more sensitive the individual is to insulin. The euglycemic insulin clamp technique has the following advantages: (1) any desired combination of plasma glucose and insulin levels can be achieved and maintained; (2) the time course of insulin action can be determined with a time resolution of approximately 10 minutes; (3) other techniques, such as tracer glucose infusion, indirect calorimetry, limb catheterization, magnetic resonance imaging/spectroscopy, and muscle biopsy, can be combined with the clamp protocol; (4) because hypoglycemia is avoided, the release of counterregulatory hormones (which antagonize insulin action) is prevented, and one can derive a pure measure of tissue sensitivity to insulin; (5) the interaction of other hormones or substrates with insulin action can be quantitated by simultaneously infusing them during a clamp study; (6) the achievement of constant or nearly constant levels of insulin, glucose, tracer glucose-specific activity (or enrichment), and glucose metabolic rate allows one to make quantitative measurements under steady-state conditions and thus avoid interpretive problems encountered when plasma glucose and insulin concentrations and glucose flux rates are constantly changing (i.e., during an oral glucose tolerance test or intravenous glucose tolerance test). The hyperglycemic version of the glucose clamp is depicted in Fig. 10-8.33 In this procedure, the plasma glucose concentration is acutely increased by a priming infusion of glucose that is administered in a logarithmically decreasing manner over 15 minutes. Thereafter, the plasma glucose concentration is clamped at the designed plateau by periodically adjusting an exogenous glucose infusion as described in the euglycemic version. The hyperglycemic step evokes an endogenous insulin response that is typically biphasic. During the initial 10 minutes, there is an early burst of insulin release which is followed by a gradual, continuous increase in the plasma insulin concentration. The initial (0 to 10 minutes) peak of insulin represents the release of preformed hormone that is stored within β-cell granules. The late (10 to 120 minutes) phase, which is believed to represent the release of insulin packaged in immature granules or newly synthesized insulin, lasts until the glucose stimulus is withdrawn. By analogy with the euglycemic insulin clamp counterpart, the hyperglycemic clamp also provides a quantitative measure of the total amount of glucose taken up and metabolized (M) by the body in response to the combined stimuli of endogenous hyperinsulinemia plus hyperglycemia.
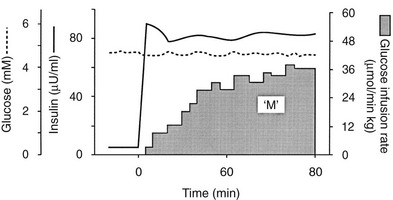
FIGURE 10-7 Schematic representation of the euglycemic insulin clamp technique. See text for a detailed discussion.
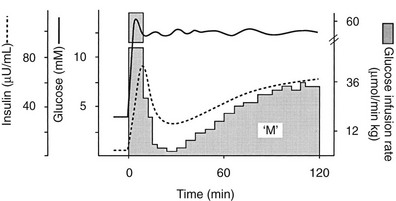
FIGURE 10-8 Schematic representation of the hyperglycemic clamp technique. See text for a detailed discussion.
One disadvantage of the hyperglycemic clamp or any study in which glucose is administered intravenously is the inability to examine the effect of incretins on insulin secretion.14 Thus, when glucose is administered orally, the insulin response is significantly greater than when the same arterial glucose profile is created by intravenous glucose administration (Fig. 10-9). This phenomenon is generally known as the incretin effect. The size of the incretin effect has been shown to be directly related to the strength of the oral stimulus; thus, ascending doses of oral glucose induce progressively larger incretin effects in the healthy subject.34 A defective incretin effect has been demonstrated in nondiabetic obese subjects as well as in subjects with type 2 diabetes.35 Two incretins, glucagon-like peptide-1 and glucose-dependent insulinotropic polypeptide, which are secreted by the L and K cells of the small intestine, respectively, in response to nutrient ingestion, partake of the incretin effect on account of their ability to potentiate glucose-induced insulin secretion.14,35
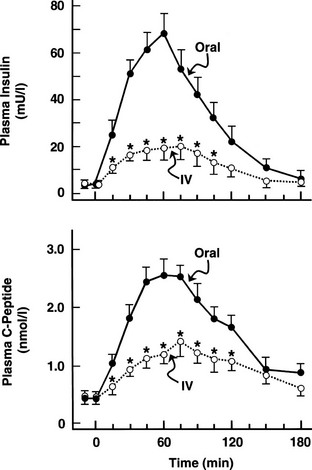
FIGURE 10-9 Effect of intravenous versus oral glucose on plasma insulin and C-peptide responses. Incretin effect: Plasma insulin (top) and C-peptide (bottom) responses after oral glucose tolerance tests (solid circles) and during isoglycemic intravenous glucose infusion (open circles) in the same subjects. IV, Intravenous. (From Nauck M, Stockmann F, Ebert R, Creutzfeldt W: Reduced incretin effect in type 2 diabetes mellitus. Diabetologia 29:46–52, 1986.)
Dynamic Interaction Between Insulin Sensitivity and Insulin Secretion
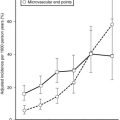
In normal, healthy individuals, the euglycemic insulin clamp technique has demonstrated that insulin sensitivity declines with age,36 in part because of the age-related increase in adiposity.37 More importantly, within the normal population insulin sensitivity ranges widely. Among young, healthy, normal, glucose-tolerant subjects, insulin-mediated glucose disposal varies up to fivefold (Fig. 10-10).38 A number of factors are known to influence insulin sensitivity. In addition to age, adipose tissue mass, fat topography, and degree of physical fitness all are powerful determinants of insulin-mediated glucose disposal.1,2 Increased total body fat content and especially increased visceral fat,3 as well as decreased Vo2max,39 are associated with impaired insulin action. Increased metabolites of triglyceride and FFAs (fatty acyl-coenzyme A, diacylglycerol, and ceramide) within muscle and liver cells are associated with insulin resistance in these organs.3 Diet composition (increased fat and reduced carbohydrate) also has been shown to impair insulin sensitivity. However, even when these factors are taken into account, one cannot fully explain the wide variation in insulin sensitivity among healthy adult individuals.38 Studies in whites, Pima Indians, and Mexican Americans1,2,40 have demonstrated that genetic factors play an important role in the distribution of insulin sensitivity (as measured by the glucose disposal rate during a euglycemic insulin clamp).
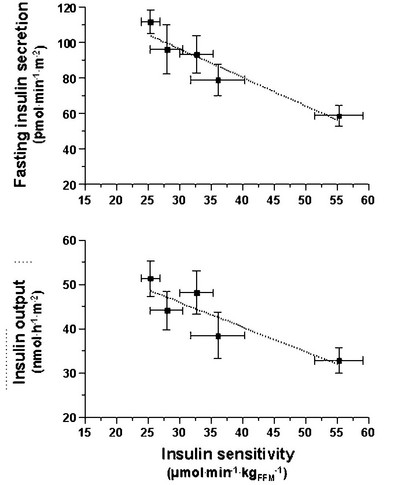
FIGURE 10-10 Reciprocal relationship between insulin sensitivity (measured by the euglycemic insulin clamp technique33) and insulin secretion (as reconstructed by the C-peptide deconvolution technique46) in the fasting state (top) and in response to a 75-g oral glucose load over 2 hours (bottom) in lean, nondiabetic subjects (rightmost symbols), in obese nondiabetic subjects (split into tertiles of 2-hour plasma glucose concentrations (middle symbols), and in subjects with impaired glucose tolerance (IGT) (leftmost symbols). (Redrawn from Ferrannini E, Gastaldelli A, Miyazaki Y et al: Beta-cell function in subjects spanning the range from normal glucose tolerance to overt diabetes: A new analysis. J Clin Endocrinol Metab 90:493–500, 2005.)
Glucose homeostasis results from a fine balance between tissue sensitivity to insulin and insulin secretion.41 This implies that the β cell must be able to sense the defect in insulin action and precisely augment its secretion of insulin to offset the insulin resistance. In fact, insulin resistance is neither necessary nor sufficient so long as the β-cell functional reserve is large enough to cope even with severe insulin resistance. The typical case is the morbidly obese subject with normal glucose tolerance, in whom insulin output can be 10-fold higher than in lean individuals38 and decrease to near-normal levels following major weight loss.42 β-Cell dysfunction, on the other hand, is necessary and sufficient to produce hyperglycemia; type 1 diabetes is the prototype of primary β-cell failure. In recent years, clinically significant advances have also been made in the area of in vivo β-cell function.43 Firstly, it has been recognized that absolute insulin secretion (whether fasting or post-meal) reflects the set-point of β-cell secretory function (i.e., secretory capacity) of which insulin resistance and presumably β-cell mass are positive determinants. However, the strongest determinant of glucose tolerance is the ability of the secretory machinery to rapidly and adequately cope with the acute changes in glucose induced by feeding. This aspect of β-cell function, called glucose sensitivity, is largely independent of insulin resistance. Recent studies serve to emphasize the importance of this dynamic interaction between insulin sensitivity and insulin secretion.44,45 In these studies, both insulin sensitivity (by the euglycemic insulin clamp technique) and β-cell function (by mathematical modeling of C-peptide concentrations46) were measured in lean and obese subjects with and without type 2 diabetes. As shown in Fig. 10-10, in nondiabetic subjects, both fasting insulin secretion and total insulin output in response to an oral glucose tolerance test (OGTT) are inversely related to insulin sensitivity. When including type 2 diabetic patients with progressively worse glycemic control, the relation of the different parameters of glucose metabolism to glucose tolerance is strikingly different (Fig. 10-11). Insulin output shows a biphasic pattern, initially increasing as glucose tolerance deteriorates, to eventually fall below normal values in severe diabetes. Insulin sensitivity drops by 35% in the passage between lean and obese nondiabetic subjects (first two dots to the left of the panels) and continues to fall slowly in the transition from the following two tertiles of glucose tolerance, through impaired glucose tolerance (IGT), to progressively more severe hyperglycemia. In contrast, β-cell glucose sensitivity declines monotonically in parallel with progressively higher 2-hour plasma glucose concentrations. Thus, individuals in the highest tertile of what would be considered to represent normal glucose tolerance (i.e., 2-hour plasma = 120 to 139 mg/dL) have lost ∼50% of β-cell glucose sensitivity, whereas IGT individuals have lost ∼65% of β-cell function (see Fig. 10-11). Log-transformation of these variables demonstrates that the glucose sensitivity is continuously and linearly related to the 2-hour plasma glucose concentration in a reciprocal fashion throughout the range from low-normal to very high (Fig. 10-12), confirming that glucose sensing is a critical determinant of glucose tolerance. The separate quantitative contribution of insulin sensitivity and β-cell glucose sensitivity to glucose tolerance (as the 2-hour plasma glucose level) is shown in Figure 10-13, which also illustrates the complex, nonlinear interaction of these two main physiologic determinants of glucose tolerance.
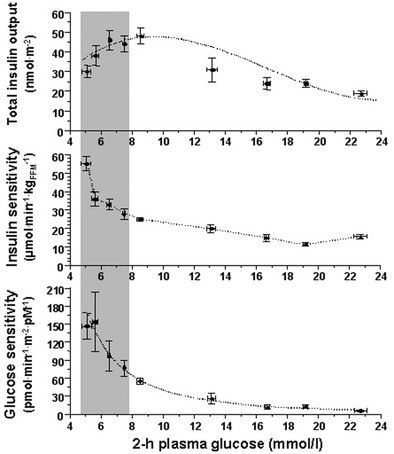
FIGURE 10-11 Relationship between plasma glucose concentrations measured 2 hours following the ingestion of 75 g of glucose (abscissae) and total insulin output (top), insulin sensitivity (middle) and β-cell glucose sensitivity (bottom) in different groups of subjects: from left to right, lean nondiabetic controls, obese nondiabetic subjects by tertile of 2-hour plasma glucose levels, IGT subjects, and patients with overt type 2 diabetes by quartile of 2-hour plasma glucose levels. IGT, Impaired glucose tolerance. (Redrawn from Ferrannini E, Gastaldelli A, Miyazaki Y et al: Beta-cell function in subjects spanning the range from normal glucose tolerance to overt diabetes: A new analysis. J Clin Endocrinol Metab 90:493–500, 2005.)
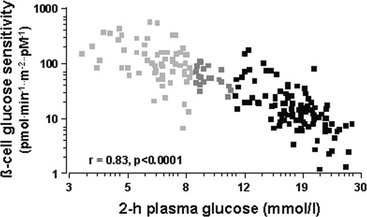
FIGURE 10-12 Continuous, inverse association between β-cell glucose sensitivity and insulin sensitivity (individual data from Fig. 10-11). Note the logarithmic scale for both parameters. (Redrawn from Ferrannini E, Gastaldelli A, Miyazaki Y et al: Beta-cell function in subjects spanning the range from normal glucose tolerance to overt diabetes: a new analysis. J Clin Endocrinol Metab 90:493–500, 2005.)
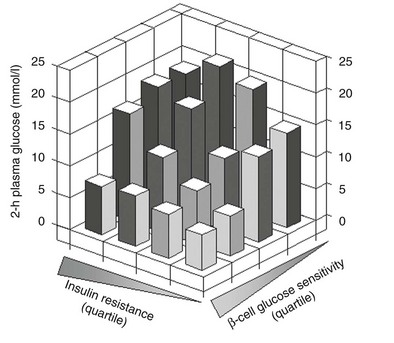
FIGURE 10-13 Independent contribution of insulin resistance and β-cell glucose insensitivity to glucose tolerance (as the 2-hour plasma glucose level following a standard 75-g oral glucose tolerance test) in subjects spanning the range from normal glucose tolerance to overt diabetes (data as in Figs. 10-11 and 10-12). (Redrawn from Ferrannini E, Gastaldelli A, Miyazaki Y et al: Beta-cell function in subjects spanning the range from normal glucose tolerance to overt diabetes: A new analysis. J Clin Endocrinol Metab 90:493–500, 2005.)
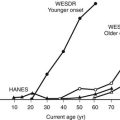
Recent genome-wide scan association analyses in diabetic47 and nondiabetic cohorts48 have consistently identified common mutations in genes more or less directly related to β-cell glucose sensitivity. Although the risk conferred by such variants is small, it is conceivable that individuals carrying one or, more likely, several of these gene polymorphisms start with an inherently poor β-cell glucose sensitivity, which may be compounded by a degree of “essential” insulin resistance. Obesity and insulin resistance initially provide compensation by raising the secretory set-point; eventually, however, ageing and glucose toxicity—even that engendered by slight chronic elevations in plasma glucose levels—wear out β-cells (especially intrinsically defective β-cells), leading to diabetes. This paradigm of the evolution of hyperglycemia from normoglycemia under the separate pressures of insulin resistance and β-cell glucose sensitivity, schematized in Fig. 10-14, has received preliminary validation in longitudinal studies in humans.49
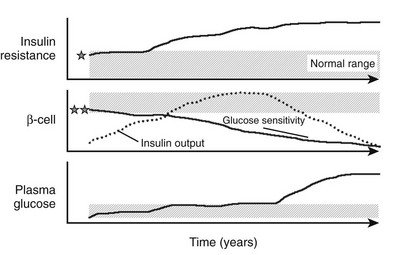
FIGURE 10-14 Schematic representation of the natural history of type 2 diabetes. Shaded areas represent the normal ranges for insulin resistance (top), β-cell function (middle), and plasma glucose concentrations (bottom). Insulin resistance may start from values close to the upper limit of normal in predisposed individuals (indicated by the star) and worsen under the pressure of obesity and a sedentary lifestyle. Insulin output (dotted line) initially increases to cope with the ensuing insulin resistance and obesity. β-Cell glucose sensitivity, however, may initially be close to the lower limit of normal in genetically predisposed individuals (double star) and declines continually thereafter. Plasma glucose concentrations creep up slowly through the prediabetic phase, eventually to rise rather rapidly into the diabetic range.
Effect of Insulin on Hepatic and Peripheral Glucose Metabolism
The maintenance of normal glucose homeostasis requires the closely coordinated effects of insulin and hyperglycemia to simultaneously (1) suppress endogenous (primarily hepatic) glucose production; (2) stimulate glucose uptake by peripheral tissues, primarily muscle; (3) stimulate glucose uptake by the liver; and (4) inhibit lipolysis and reduce the plasma FFA concentration.1,2 The decrease in circulating plasma FFA levels plays an important role in enhancing the suppression of hepatic glucose production and augmenting muscle glucose uptake in response to a physiologic increase in plasma insulin concentration.3
Using the euglycemic insulin clamp technique, insulin can be shown to exert a potent suppressive action on hepatic glucose production such that portal insulin concentrations of less than 100 µU/mL completely abolish glucose entry into the circulation.9,19,50 Fig. 10-15 shows the typical time course for suppression of endogenous (hepatic) glucose production after an acute increase in plasma insulin to levels of 60 to 70 µU/mL in healthy subjects.51 Dose-response curves relating the calculated portal plasma insulin concentration to inhibition of hepatic glucose production (Fig. 10-16) indicate a half-maximal effect at a level of approximately 30 µU/mL, corresponding to an increment in the portal insulin concentration of only 5 to 10 µU/mL.19,50 These results indicate the exquisite sensitivity of the liver to very small increments in the circulating plasma insulin concentration. Note that in its capacity of a glucose-producing organ, the liver is extremely sensitive to insulin, whereas the ability of insulin to augment hepatic glucose uptake under conditions of euglycemia is quite modest. In the presence of hyperglycemia, insulin has a small stimulatory effect on hepatic glucose uptake.52,53 Hyperglycemia, induced by intravenous glucose administration, strongly synergizes this inhibitory action of insulin on hepatic glucose production (see Fig. 10-5). Under euglycemic conditions, the apparent maximal stimulation is approximately 15 mg/min per kilogram (∼80 µmol/min per kilogram) in healthy adult subjects and occurs with plasma insulin concentrations of approximately 250 µU/mL; the half-maximal stimulation of glucose uptake occurs with a plasma insulin concentration of 70 to 110 µU/mL. A dose-response curve of similar shape is derived when progressively higher insulin doses are infused locally into the forearm or leg tissues, approximately 70% of which consists of skeletal muscle. By extrapolating from forearm or leg muscle to total body muscle mass, it can be estimated that with prevailing peripheral plasma insulin concentrations in the high physiologic range (60 to 90 µU/mL), approximately 70% of total glucose disposal occurs in muscle tissue.24 Obviously, this percentage increases further with progressively higher insulin levels, because the contribution of insulin-independent tissues declines. By combining the insulin clamp technique (plasma insulin concentration, ∼70 to 80 µU/mL) with leg and hepatic vein catheterization, a composite picture of whole-body glucose disposal can be generated (Fig. 10-17). Brain (∼1.2 mg/min per kilogram) and splanchnic (liver plus gastrointestinal tissues) (∼0.5 mg/min per kilogram) glucose uptake are unaffected by insulin infusion.1,2 Adipose tissue in adult humans is relatively inert. Although it represents an insulin-dependent tissue, it accounts for no more than 4% to 5% of an infused glucose load. Consequently, muscle represents the primary tissue responsible for insulin-mediated glucose uptake under euglycemic conditions.24 When hyperglycemia (plasma glucose increased from 90 to 180 mg/dL) is superimposed on the same level of hyperinsulinemia (70 to 80 µU/mL), a doubling of total body glucose utilization occurs (Fig. 10-18); consequently, the glucose clearance remains unchanged. As can be seen in Fig. 10-18, essentially all the additional increase in glucose disposal above that observed under euglycemic conditions occurs in muscle. In the presence of hyperglycemia, insulin has a small stimulatory effect on hepatic glucose uptake, which amounts to approximately 10% of the total body glucose disposal.53
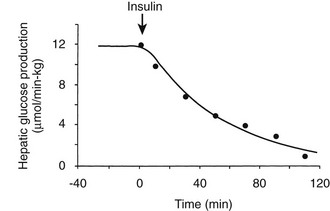
FIGURE 10-15 Time course of suppression of hepatic glucose production in healthy adults during a euglycemic insulin clamp. (Redrawn from Cobelli C, Mari A, Ferrannini E: The non-steady-state problem: error analysis of Steele’s model and developments for glucose kinetics. Am J Physiol 252:E679–E687, 1987.)
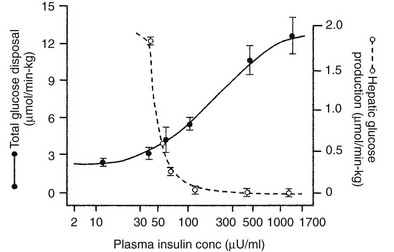
FIGURE 10-16 Dose-response relationship between the plasma insulin concentration (note the log scale) versus hepatic glucose production and whole-body glucose uptake in healthy subjects studied with the euglycemic insulin clamp technique. The insulin concentrations are peripheral levels in the case of total glucose uptake and portal levels in the case of hepatic glucose production. (Reproduced from DeFronzo RA, Ferrannini E, Hendler R et al: Regulation of splanchnic and peripheral glucose uptake by insulin and hyperglycemia in man. Diabetes 32:35–45, 1983.)
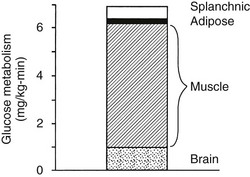
FIGURE 10-17 Summary of tissue glucose disposal during a euglycemic (90 mg/dL) hyperinsulinemic (+80 µU/mL) clamp in healthy subjects. (Reproduced from DeFronzo RA: Lilly lecture: The triumvirate: β-cell, muscle, liver: a collusion responsible for NIDDM. Diabetes 37:667–687, 1988.)
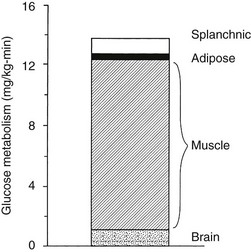
FIGURE 10-18 Summary of tissue glucose disposal during a hyperglycemic (180 mg/dL) hyperinsulinemic (80 µU/mL) clamp.
The regulation of glucose production and utilization by insulin is dependent on both the hormone concentration and time. At any given insulin concentration, there is a finite period before the effect of the hormone is seen and reaches its maximum. Such onset time is the sum of a circulatory delay (delivery of insulin from arterial blood to cell surface membrane) and a cellular lag (insulin receptor binding and effector activation). Similarly, insulin’s effect on glucose metabolism remains for some time (offset) after the circulating concentration has returned to basal levels. Fig. 10-19 shows the activation and deactivation times of insulin calculated at euglycemia over a wide range of plasma hormone levels (as high as 1000 mU/mL).54 With the reservations inherent in the analysis of non-steady-state tracer data, the results shown in Fig. 10-19 provide evidence that activation and deactivation are inversely related to one another. Thus at higher plasma insulin concentrations, the hormone’s effect is more rapid in onset and takes longer to wane. From the physiologic standpoint, it also is noteworthy that the relationship between onset and offset time is different for the liver (suppression of glucose release) and for peripheral tissues (stimulation of glucose uptake). At any insulin dose, the liver is activated more rapidly, and the effect persists for a longer duration. The more rapid onset of action in the liver may be related to the shorter diffusion time of bloodborne substances into highly perfused organs (1 mL/min per gram of tissue in the liver versus a corresponding value of 0.04 mL/min per gram in resting skeletal muscle; see Table 10-1) and to anatomic differences between liver capillaries (which are fenestrated) and muscle capillaries (which are not fenestrated).
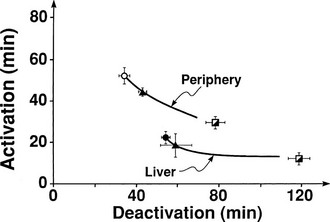
FIGURE 10-19 Relationships between activation and deactivation times for stimulation of peripheral glucose uptake and inhibition of hepatic glucose production during three insulin infusion rates: 15 mU/m2 per minute (open circles), 40 mU/m2 per minute (closed triangles), and 120 mU/m2 per minute (semiclosed squares). (Reconstructed from Prager R, Wallace P, Olefsky JM: In vivo kinetics of insulin action on peripheral glucose disposal and hepatic output in normal and obese subjects. J Clin Invest 78:472–481, 1986.)
Intracellular Pathways of Glucose Disposal
By combining indirect calorimetry with dose-response studies using the euglycemic insulin clamp technique, it has been possible to quantitate the two major components of whole-body glucose disposal, that is, glucose oxidation and nonoxidative glucose disposal.1,2,55 The latter primarily (>90%) represents glycogen synthesis, the remainder being accounted for by anaerobic metabolism, that is, net lactate production. Fig. 10-20 shows that the dose-response curves relating glucose oxidation and nonoxidative glucose disposal (glycogen synthesis) to the plasma insulin concentration both retain the sigmoidal shape of the curve for whole-body glucose uptake but with distinctly different dose kinetics. Thus, glucose oxidation is more sensitive (lower half maximum) but saturates earlier (lower maximum) than glycogen synthesis; the latter behaves as a pathway with low sensitivity and high capacity. Skeletal muscle has been identified as the predominant site of insulin-mediated net glycogen synthesis.56 However, the increment in carbohydrate oxidation that follows systemic insulin administration occurs in muscle as well as other tissues (probably the liver) in an approximate ratio of 1 to 2 (oxidation to glycogen synthesis). With the use of nuclear magnetic resonance spectroscopy, one can directly quantitate muscle glycogen synthesis. The time course of insulin-stimulated muscle glycogen formation (Fig. 10-21) closely follows the time course of nonoxidative glucose uptake by the whole body.56 By extrapolation from leg muscle to whole-body muscle, one can account for the great majority (∼90%) of nonoxidative glucose disposal as muscle glycogen formation. Under physiologic conditions of hyperinsulinemia, approximately two thirds of G6P is converted to glycogen and one third enters glycolysis.24,54 Of the glucose that enters the glycolytic pathway, the majority (∼80% to 90%) is oxidized in the Krebs cycle to carbon dioxide and water, and the remainder is converted to lactate.57
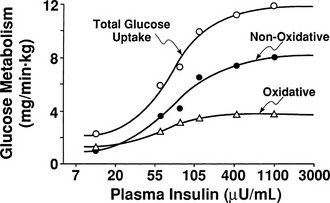
FIGURE 10-20 Dose-response relationship between the plasma insulin concentration and total body glucose uptake, glucose oxidation, and nonoxidative glucose disposal in healthy subjects during a euglycemic insulin clamp. (Drawn from Thiebaud D, Jacot E, DeFronzo RA et al: The effect of graded doses of insulin on total glucose uptake, glucose oxidation, and glucose storage in man. Diabetes 31:957–963, 1982.)
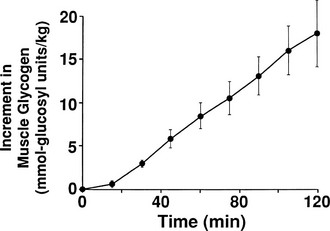
FIGURE 10-21 Time course of stimulation of muscle glycogen formation by combined hyperinsulinemia (100 µU/mL) and hyperglycemia (200 mg/dL) in healthy subjects as determined by nuclear magnetic resonance spectroscopy. (Redrawn from Shulman GI, Rothman DL, Jue T et al: Quantitation of muscle glycogen synthesis in normal subjects and subjects with non-insulin-dependent diabetes by 13C nuclear magnetic resonance spectroscopy. N Engl J Med 322:223–228, 1990.)
For insulin to exert its biological effects on glucose metabolism, it must first bind to specific receptors that are present on the cell surface of all insulin target tissues.2 After insulin has bound to and activated its receptor, second messengers are generated, and these second messengers initiate a series of events involving a cascade of phosphorylation-dephosphorylation reactions2,58–60 that eventually result in the stimulation of intracellular glucose metabolism. The initial step in glucose metabolism involves activation of the glucose transport system, leading to influx of glucose into insulin target tissues, primarily muscle (Fig. 10-22).2,6,26,61 The free glucose which has entered the cell is subsequently metabolized by a series of enzymatic steps that are under the control of insulin. Of these, the most important are glucose phosphorylation (catalyzed by hexokinase), glycogen synthase (which controls glycogen synthesis), and PFK and pyruvate dehydrogenase (which regulate glycolysis and glucose oxidation, respectively).
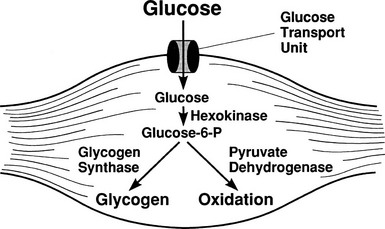
Insulin Receptor/Insulin Receptor Tyrosine Kinase
The insulin receptor is a glycoprotein consisting of two α subunits and two β subunits linked by disulfide bonds2,58–60 (see Chapter 8 and Fig. 10-23). The α subunit of the insulin receptor is entirely extracellular and contains the insulin-binding domain. The β subunit has an extracellular domain, a transcellular domain, and an intracellular domain that express insulin-stimulated kinase activity directed toward its own tyrosine residues. Insulin receptor phosphorylation of the α subunit, with subsequent activation of insulin receptor tyrosine kinase, represents the first step in the action of insulin on glucose metabolism. Mutagenesis experiments have shown that insulin receptors devoid of tyrosine kinase activity are completely ineffective in mediating insulin stimulation of cellular metabolism. Similarly, mutagenesis of any of the three major phosphorylation sites (at residues 1158, 1163, and 1162) impairs the insulin receptor kinase activity, and this is associated with a marked decrease in the acute metabolic and growth-promoting effects of insulin.
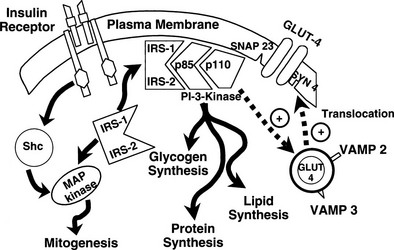
FIGURE 10-23 Schematic representation of the insulin receptor and the cascade of intracellular signaling molecules that have been implicated in insulin action; see text for a more detailed discussion. GLUT, Glucose transporter; MAP, mitogen-activated protein; PI-3-Kinase, phosphatidylinositol kinase; SNAP, soluble NSF attachment 23 kD protein; SYN, syntaxin; VAMP, vesicle-associated membrane.
Insulin Receptor Signal Transduction
After activation, insulin receptor tyrosine kinase phosphorylates specific intracellular proteins, of which at least nine have been identified (see Chapter 8 and Fig. 10-23).58 Four of these belong to the family of insulin-receptor substrate (IRS) proteins: IRS-1, IRS-2, IRS-3, IRS-4 (the others include Shc, Cbl, Gab-1, p60[dok], and APS). In muscle, IRS-1 serves as the major docking protein that interacts with the insulin receptor tyrosine kinase and undergoes tyrosine phosphorylation in regions containing amino acid sequence motifs (YXXM or YMXM) that, when phosphorylated, serve as recognition sites for proteins containing src-homology 2 (SH2) domains.58,62 Mutation of these specific tyrosines severely impairs the ability of insulin to stimulate glycogen and DNA synthesis, establishing the important role of IRS-1 in insulin signal transduction. In liver, IRS-2 serves as the primary docking protein that undergoes tyrosine phosphorylation and mediates the effect of insulin on hepatic glucose production, gluconeogenesis, and glycogen formation. In adipocytes, Cbl represents another substrate that is phosphorylated after its interaction with the insulin receptor tyrosine kinase and is required for stimulation of GLUT-4 translocation. Phosphorylation of Cbl occurs when the CAP/Cbl complex associates with flotillin in caveolae, or lipid rafts, containing insulin receptors.63
In muscle, the phosphorylated tyrosine residues on IRS-1 mediate an association between the SH2 domains of the 85-kD regulatory subunit of phosphatidylinositol-3-kinase (PI-3-kinase), leading to activation of the enzyme58–60,62 (see Fig. 10-23). PI-3-kinase is a heterodimeric enzyme composed of an 85-kD regulatory subunit and a 110-kD catalytic subunit. The latter catalyzes the 3′-phosphorylation of phosphatidylinositol (PI) in the plasma membrane glycolipids, thereby converting PI-4,5-bisphosphate to PI-3,4,5-triphosphate and PI-4-phosphate to PI-3,4 biphosphate. PI-(3,4,5)-P3 and PI-(3,4)-P2 lead to the stimulation of glucose transport. Activation of PI-3-kinase by phosphorylated IRS-1 also leads to activation of glycogen synthase58,62 via a process that involves activation of protein kinase B/Akt and subsequent inhibition of kinases such as GSK-3 and activation of protein phosphatase-1 (PP-1). Inhibitors of PI-3-kinase impair glucose transport by interfering with the translocation of GLUT-4 from their intracellular location and block the activation of glycogen synthase and hexokinase (HK)-II expression.26,58–62 The action of insulin to increase protein synthesis and inhibit protein synthesis also is mediated by PI-3-kinase and involves the activation of mTOR.64 Mammalian target of rapamycin (mTOR) controls translation machinery by phosphorylation and activation of p70 ribosomal S6 kinase [p70(rsk)] and phosphorylation of initiation factors.64 Insulin also promotes hepatic triglyceride synthesis by increasing the transcription factor steroid regulatory element–binding protein(SRBP)-1c, and this lipogenic effect of insulin also appears to be mediated via the PI-3-kinase pathway.58
Other proteins with SH2 domains, including the adapter protein Grb2 and Shc, also interact with IRS-1 and become phosphorylated after exposure to insulin.58,59,62 Grb2 and Shc serve to link IRS-1/IRS-2 to the mitogen-activated protein signaling pathway (see Fig. 10-23), which plays an important role in the generation of transcription factors.58,62 After the interaction between IRS-1/IRS-2 and Grb2 and Shc, Ras is activated, leading to the stepwise activation of Raf, mitogen-activated protein kinase (MEK), and extracellular signal-regulated kinase. Activated extracellular signal-regulated kinase then translocates into the nucleus of the cell, where it catalyzes the phosphorylation of transcription factors that promote cell growth, proliferation, and differentiation.58,59,62,65,66 Blockade of the mitogen-activated protein kinase pathway prevents the stimulation of cell growth by insulin but has no effect on the metabolic actions of the hormone.
Under anabolic conditions, insulin stimulates glycogen synthesis by simultaneously activating glycogen synthase and inhibiting glycogen phosphorylase67–69 (Fig. 10-24). The effect of insulin is mediated via the PI-3-kinase pathway, which inactivates kinases such as glycogen synthase kinase-3 and activates phosphatases, particularly PP-1. It is believed that PP-1 is the primary regulator of glycogen metabolism.67–69 In skeletal muscle, PP-1 associates with a specific glycogen-binding regulatory subunit, causing dephosphorylation (activation) of glycogen synthase. PP-1 also phosphorylates (inactivates) glycogen phosphorylase. The precise steps that link insulin receptor tyrosine kinase/PI-3-kinase activation to stimulation of PP-1 have yet to be defined. Some evidence suggests that p90 ribosomal S6-kinase may be involved in the activation of glycogen synthase.58 Akt also has been shown to phosphorylate and thus inactivate GSK-3. This decreases glycogen synthase phosphorylation, leading to activation of the enzyme. A number of studies have convincingly demonstrated that inhibitors of PI-3-kinase inhibit glycogen synthase and abolish glycogen synthesis.58,59 From the physiologic standpoint, it makes sense that activation of glucose transport and glycogen synthase should be linked to the same signaling mechanism to provide a coordinated and efficient stimulation of intracellular glucose metabolism.
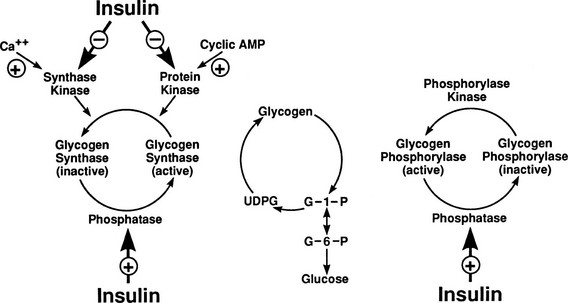
Glucose Transport
Activation of the insulin signal transduction system in insulin target tissues leads to the stimulation of glucose transport. The effect of insulin is brought about by the translocation of a large intracellular pool of GLUTs (associated with low-density microsomes) to the plasma membrane.2,6,26,61 There are five major, different facilitative GLUTs with distinctive tissue distributions6,61,70,71 (see Table 10-3). GLUT-4, the insulin-regulatable transporter, is found in insulin-sensitive tissues (muscle and adipocytes), has a Km of approximately 5 mmol/L, which is close to that of the plasma glucose concentration, and is associated with HK-II.72–74 In adipocytes and muscle, its concentration in the plasma membrane increases markedly after exposure to insulin, and this increase is associated with a reciprocal decline in the intracellular GLUT-4 pool. Acute physiologic hyperinsulinemia does not increase the total number of GLUT-4 in muscle, even though several studies have demonstrated an increase in muscle GLUT-4 mRNA. Using a novel isotopic dilution technique, the in vivo dose-response curve for the action of insulin on glucose transport in human forearm skeletal muscle has been described (Fig. 10-25). GLUT-1 represents the predominant GLUT in the insulin-independent tissues (brain and erythrocytes) but is also found in muscle and adipocytes. It is located primarily in the plasma membrane, where its concentration changes little after the addition of insulin. It has a low Km (∼1 mmol/L) and is well suited for its function, which is to mediate basal glucose uptake. It is found in association with HK-I.72–74 GLUT-2 predominates in the liver and pancreatic β cells, where it is found in association with a specific HK, HK-IV.72–75 In the β cell, HK-IV is referred to as glucokinase.75 GLUT-2 has a high Km (∼15 to 20 mmol/L); as a consequence, the glucose concentration in cells expressing this transporter increases in direct proportion to the increase in plasma glucose concentration. This characteristic allows these cells to respond as glucose sensors. In summary, each tissue has a specific GLUT and associated HK that allow it uniquely to carry out its specialized function to maintain whole-body glucose economy.
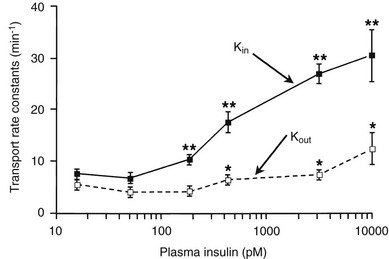
FIGURE 10-25 Insulin action on glucose transport. Insulin dose-response curve for inward (Kin) and outward (Kout) rate constants for the transmembrane transport of 3-O-methyl-glucose in forearm skeletal muscle at different plasma insulin concentrations. * P < 0.05 versus basal; ** P < 0.01 versus basal. (Reproduced from Bonadonna RC, Cobelli C, Saccomani MP et al: Glucose transport in human skeletal muscle: the in vivo response to insulin. Diabetes 42:191–198, 1993.)
Glucose Phosphorylation
Glucose phosphorylation and glucose transport are tightly coupled phenomena. Isoenzymes of HK (HKI to HKIV) catalyze the first committed intracellular step of glucose metabolism, the conversion of glucose to G6P72–75 (see Table 10-3). HKI, HKII, and HKIII are single-chain peptides that have a number of properties in common, including a very high affinity for glucose and product inhibition by G6P. HK-IV, also called glucokinase, has a lower affinity for glucose and is not inhibited by G6P. Glucokinase (HK-IVB) is the glucose sensor in the β cell, whereas HK-IVL plays an important role in the regulation of hepatic glucose metabolism. In both rat and human,73,76 skeletal muscle HK-II transcription is regulated by insulin. HK-I also is present in human skeletal muscle but is not regulated by insulin. In response to physiologic euglycemic hyperinsulinemia, HK-II cytosolic activity, protein content, and mRNA levels increase by 50% to 200% in healthy subjects,76 and this is associated with the translocation of HK-II from the cytosol to the mitochondria.77 In contrast, insulin has no effect on HK-I activity, protein content, or mRNA levels.
Glycogen Synthesis
After glucose enters the cell and is phosphorylated, it can either be converted to glycogen or enter the glycolytic pathway. Of the glucose that enters the glycolytic pathway, approximately 90% is oxidized. In the low physiologic range of hyperinsulinemia, glycogen synthesis and glucose oxidation are of approximately equal quantitative importance. With increasing plasma insulin concentrations, glycogen synthesis becomes predominant.50,55 If the rate of glucose oxidation is subtracted from the rate of whole-body insulin-mediated glucose disposal (determined from the insulin clamp), the difference represents nonoxidative glucose disposal (or glucose storage), which primarily reflects glycogen synthesis.1,2,56 Glucose conversion to lipid accounts for less than 5% of total glucose disposal,78 and 5% to 10% of the glucose taken up by muscle is released as lactate.57 Using nuclear magnetic resonance imaging spectroscopy and measuring insulin-stimulated incorporation of [1H,13C]-glucose into muscle glycogen,56 the rate of nonoxidative glucose disposal (glucose storage) has been shown to correlate closely with the rate of glycogen synthesis (see Fig. 10-21).
Glycogen synthase is the key insulin-regulated enzyme that controls the rate of muscle glycogen formation.67–69,79–81 Insulin enhances glycogen synthase activity by stimulating a cascade of phosphorylation-dephosphorylation reactions67,68,81 (see earlier discussion of insulin receptor signal transduction), which ultimately lead to the activation of PP-1 (also called glycogen synthase phosphatase).80,81 The regulatory subunit (G) of PP-1 has two serine phosphorylation sites, called site 1 and site 2. Phosphorylation of site 2 by cyclic adenosine monophosphate–dependent kinase (PKA) inactivates PP-1, while phosphorylation of site 1 by insulin activates PP-1, leading to the stimulation of glycogen synthase.81,82 Phosphorylation of site 1 of PP-1 by insulin in muscle is catalyzed by insulin-stimulated protein kinase-1, which is part of a family of serine/threonine protein kinases termed ribosomal S6-kinases. Because of their central role in muscle glycogen formation, and because impaired insulin-stimulated glycogen synthesis is a characteristic defect in patients with type 2 diabetes mellitus, considerable attention has been focused on the three enzymes—glycogen synthase, PP-1, and insulin-stimulated protein kinase-1—in the pathogenesis of insulin resistance in individuals with type 2 diabetes. The effect of insulin on glycogen synthase gene transcription and translation in vivo has been studied by employing the euglycemic insulin clamp in combination with muscle biopsies. Most studies76 have shown that insulin does not increase glycogen synthase mRNA or protein expression in human muscle in vivo. Rather, insulin converts the inactive (phosphorylated) form of glycogen synthase to the active (dephosphorylated) form of the enzyme.67–69,79
Glycolysis/Glucose Oxidation
Glucose oxidation accounts for approximately 90% of total glycolytic flux, while anaerobic glycolysis accounts for the other 10%.57 Two enzymes, PFK and PDH, play central roles in the regulation of glycolysis and glucose oxidation, respectively. PFK represents a key functional step in control of glycolysis.31,83 Insulin does not exert any direct effect on this enzyme, which is primarily regulated by the energy (ATP) and fuel (citrate, acetyl-CoA) status of the cell. However, insulin indirectly stimulates PFK by increasing fructose-2,6-bisphosphate, a potent activator of PFK. Insulin has no effect on muscle PFK activity, mRNA levels, or protein content in nondiabetic individuals.84 Insulin also regulates flux through glycolysis by increasing the activity of the multienzyme complex, PDH.30,83 This enzyme is activated by insulin, which stimulates PDH-phosphatase, thus converting the enzyme from its inactive phosphorylated form to its active dephosphorylated form (Fig. 10-26). The PDH complex enzyme also is inhibited by its products, acetyl-CoA and reduced nicotinamide adenine dinucleotide (NADH).
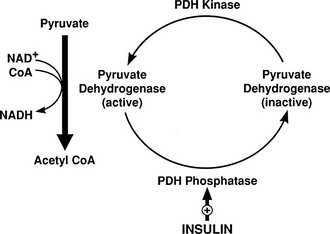
Free Fatty Acid–Amino Acid–Glucose Interactions
A major part of insulin’s stimulatory action on glucose metabolism is indirect and is mediated via changes in substrate metabolism. In contrast to the hormone’s stimulatory effect on glucose utilization, insulin is a powerful inhibitor of lipolysis and lipid oxidation.50 As shown in Fig. 10-27, plasma FFA concentrations decline steeply in response to small increments in circulating insulin levels under conditions of euglycemia. This decrease is the result of a drastic reduction in the rate of FFA appearance into the circulation. The concomitant decline in plasma glycerol concentration is consistent with in vitro studies and indicates that lipolysis is inhibited. The consequence of the reduced availability of FFA is a parallel reduction in both FFA oxidation and nonoxidative FFA disposal, that is, reesterification (Fig. 10-28). The inverse patterns of change in glucose disposal and oxidation on the one hand, and lipid utilization on the other, introduce the important concept of substrate competition. Glucose and long-chain FFAs are the first and best-known example of substrate competition in insulin-dependent tissues.85 Physiologically, the increases in plasma glucose (by mass action) and insulin (stimulation of glucose transport) concentrations increase the rate of glucose uptake into fat cells. The resultant increase in intracellular α-glycerol phosphate generated during the stimulation of glycolysis supplies the substrate for augmented reesterification of tissue FFAs, while at the same time insulin stimulates α-glycerol phosphate acyltransferase, the rate-limiting enzyme for triglyceride synthesis.30 These combined effects limit the release of FFAs into the bloodstream. In addition, the glucose-induced increase in plasma insulin concentration quickly inhibits lipolysis by stimulating hormone-sensitive lipase in the adipocyte, and this further reduces the supply of lipid substrates to the oxidative machinery in muscle and liver. A decrease in FFA oxidation by these tissues causes a reciprocal stimulation of glucose oxidation and glycogen synthesis by reversal of the Randle cycle in muscle (see later) and inhibition of gluconeogenesis in the liver.
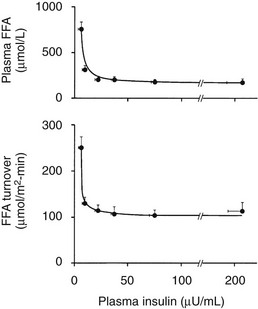
FIGURE 10-27 Dose-response relationship between the plasma insulin concentration and plasma free fatty acid (FFA) concentration (top) and rate of plasma FFA turnover (bottom) in healthy subjects during euglycemic insulin clamp studies. (Reproduced from Groop LC, Bonadonna RC, Del Prato S et al: Glucose and free fatty acid metabolism in non-insulin-dependent diabetes mellitus: evidence for multiple sites of insulin resistance. J Clin Invest 84:205–213, 1989.)
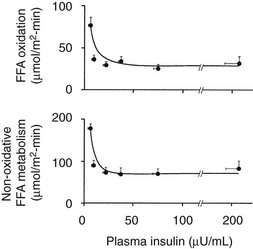
FIGURE 10-28 Dose-response relationship between the plasma insulin concentration versus the rate of whole-body free fatty acid (FFA) oxidation (top) and the rate of nonoxidative FFA disposal, that is, reesterification (bottom) in healthy subjects during euglycemic insulin clamp studies. (Reproduced from Groop LC, Bonadonna RC, Del Prato S et al: Glucose and free fatty acid metabolism in non-insulin-dependent diabetes mellitus: evidence for multiple sites of insulin resistance. J Clin Invest 84:205–213, 1989.)
The glucose-mediated inhibition of FFA metabolism is counterbalanced by an FFA-mediated inhibition of glucose metabolism, creating an FFA–glucose substrate interaction known as the Randle cycle.85 When the plasma FFA concentration is elevated, by mass action, FFAs are transported into muscle and liver cells by simple diffusion across the membrane. The intracellular free FFA concentration is maintained low by a specific FFA-binding protein and this ensures a favorable transport gradient. Once inside the cell, FFAs are transported into the mitochondria, where they undergo beta oxidation (Fig. 10-29). Before entering the mitochondria, the long-chain fatty acids (oleic, palmitic, stearic, linoleic, and palmitoleic) are first activated to their acyl-CoA derivative by the appropriate acyl-CoA synthetase. Because the inner mitochondrial membrane is not permeable to the fatty-acyl-CoA, a specific transport system is necessary to transport the fatty-acyl derivative into the mitochondria (see Fig. 10-29).86 The enzyme carnitine acyltransferase-I in the outer membrane transfers the cytosolic fatty acyl-CoA to carnitine, and the resulting fatty-acyl carnitine derivative is transported through the mitochondrial membrane. At the inner mitochondrial membrane, carnitine acyltransferase II, the rate-limiting enzyme for beta oxidation, catalyzes the transfer of the fatty-acyl unit from fatty-acyl carnitine back to CoA, and the fatty acyl-CoA then undergoes beta oxidation with the resultant generation of acetyl-CoA.
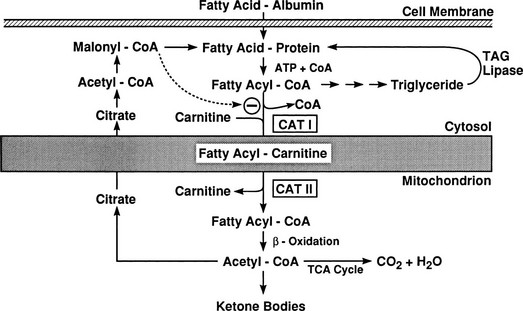
FIGURE 10-29 Free fatty acid (FFA) and ketone body metabolism in the liver. After transport into the hepatocyte, FFAs are activated to their acyl-CoA derivative. Depending on the hormonal, metabolic, and energy status of the cell, the fatty acyl-CoA moiety is either transported into the mitochondrion and oxidized or synthesized into triglyceride. Malonyl-CoA, which is a potent inhibitor of carnitine palmitoyl transferase I, plays a pivotal role in the switch from FFA oxidation to lipid synthesis. Insulin enhances the formation of malonyl-CoA by stimulating acetyl-CoA-carboxylase. Insulin also favors triglyceride synthesis by inhibiting triacylglycerol lipase, the rate-limiting step for lipolysis. ATP, Adenosine triphosphate; CAT, carnitine acyltransferase; TAG, triacylglycerol.
As beta oxidation proceeds, acetyl-CoA accumulates within the cell and becomes a powerful inhibitor of the PDH enzyme complex (Fig. 10-30).85,86 In addition, the accelerated rate of FFA oxidation consumes nicotinic adenine dinucleotide (NAD) and generates NADH. This shift in redox potential further inhibits PDH and impairs the Krebs cycle. Fatty acyl-CoA derivatives also have been shown to inhibit glycogen synthase in muscle and liver87,88 (see Fig. 10-30). In healthy humans, a physiologic elevation in the plasma FFA concentration (created by Intralipid/heparin infusion) stimulates FFA oxidation and inhibits both glucose oxidation and glucose storage (glycogen synthesis),89 thus providing experimental validation of the Randle cycle. In nondiabetic subjects, a physiologic increment in the plasma insulin level (+100 µU/mL) causes a 50% to 60% decline in plasma FFA concentration and a parallel decline in lipid oxidation (Fig. 10-31). Infusion of Intralipid during the insulin clamp, to maintain or increase the plasma FFA level (see Fig. 10-31), inhibits insulin-mediated stimulation of both glucose oxidation and glucose storage (glycogen synthesis) (Fig. 10-32). These data demonstrate that the Randle cycle operates in vivo in humans in response to physiologic changes in the plasma FFA concentration. The inhibitory effect of elevated plasma FFA levels is observed at all plasma insulin concentrations, spawning the physiologic and pharmacologic range.89 The inhibitory effect of an acute increase in plasma FFA concentration on muscle glucose metabolism is time dependent. Thus the earliest (within 2 hours) observed abnormality is a defect in glucose oxidation, as would be predicted by operation of the Randle cycle.85 This is followed (between 2 and 3 hours) by defects in glucose transport and phosphorylation and eventually (after 3 to 4 hours) by impaired glycogen synthesis.3,90
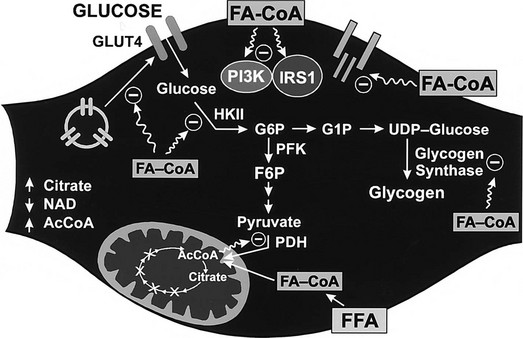
FIGURE 10-30 Schematic representation of the intracellular biochemical and molecular events that are inhibited by fatty acyl-CoAs and their intracellular metabolites; see text for a more detailed discussion. AcCoA, Acyl-CoA; F6P, fructose-6-phosphate; FA-CoA, fatty acyl-CoA; FFA, free fatty acid; G1P, glucose-1-phosphate; G6P, glucose-6-phosphate; GLUT, glucose transporter; HK, hexokinase; NAD, nicotinamide adenine dinucleotide; PDH, pyruvate dehydrogenase; PFK, phosphofructokinase; PI3K, phosphatidylinositol kinase; UDP, uridine diphosphate.
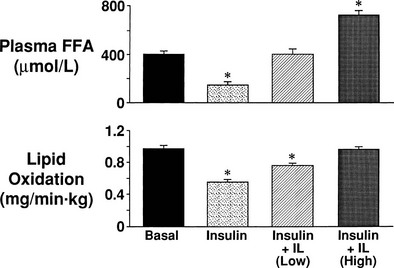
FIGURE 10-31 Plasma free fatty acid (FFA) concentration and total body lipid oxidation (measured by indirect calorimetry) in the basal state and during a 100 µU/mL euglycemic insulin clamp performed with and without Intralipid (IL) infusion. Intralipid was infused at two rates to maintain (low IL infusion) or increase (high IL infusion) the basal plasma FFA concentration. The high-dose Intralipid infusion rate maintained the rate of total body lipid oxidation constant at the basal value. (Reproduced from Thiebaud D, DeFronzo RA, Jacot E et al: Effect of long-chain triglyceride infusion on glucose metabolism in man. Metabolism 21:1128–1136, 1982.)
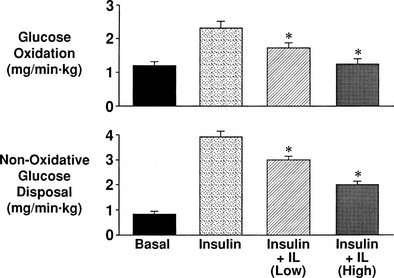
FIGURE 10-32 Inhibitory effect of Intralipid (IL) infusion and enhanced lipid oxidation on insulin-mediated rates of glucose oxidation and nonoxidative glucose disposal (see legend to Fig. 10-31 for description of the experimental protocol). (Reproduced from Thiebaud D, DeFronzo RA, Jacot E et al: Effect of long-chain triglyceride infusion on glucose metabolism in man. Metabolism 21:1128–1136, 1982.)
According to the FFA-glucose cycle originally proposed 4 decades ago by Randle and colleagues,85 the increase in FFA oxidation restrains glucose oxidation in muscle by altering the redox potential of the cell and inhibiting key glycolytic enzymes. The excessive FFA oxidation, in addition to causing the intracellular accumulation of acetyl-CoA (a potent inhibitor of PDH) and increasing the NADH/NAD ratio (causing a slowing of the Krebs cycle), results in the accumulation of citrate, a powerful inhibitor of PFK. Randle and colleagues proposed that inhibition of PFK caused product inhibition of the early steps involved in glucose metabolism, leading to the accumulation of G6P, which in turn inhibited HK-II. The block in glucose phosphorylation caused a buildup of intracellular free glucose, which restrained glucose transport into the cell via GLUT-4. The resultant decrease in glucose transport, in turn, resulted in impaired glycogen synthesis. This sequence of events by which accelerated plasma FFA oxidation inhibits muscle glucose transport, glucose oxidation, and glycogen synthesis is now referred to as the Randle cycle.85 It should be noted that the same scenario would ensue if the FFA were derived from triglycerides stored in muscle42 or from plasma.89
The original description of the Randle cycle was formulated based on experiments performed in rat diaphragm and heart muscle.85 More recent studies performed in human skeletal muscle implicate mechanisms in addition to those originally proposed by Randle and colleagues, in the FFA-induced insulin resistance. Several groups91 have failed to observe an increase in G6P, or in muscle citrate levels or an inhibition of PFK, when insulin-stimulated glucose metabolism was inhibited by a lipid infusion to increase the plasma FFA concentration. Thus, although increased FFA/lipid and decreased glucose oxidation are closely coupled, as originally demonstrated by Randle and colleagues, mechanisms other than product (i.e., elevated intracellular G6P and free glucose concentrations) inhibition of the early steps of glucose metabolism must be invoked to explain the defects in glucose transport, glucose phosphorylation, and glycogen synthesis (see Fig. 10-30).
Studies in humans and animals have shown a strong negative correlation between insulin-stimulated glucose metabolism and increased intramuscular lipid pools, including triglyceride, diacylglycerol, ceramides, and long-chain fatty acyl-CoAs.3,92–94 An acute increase in the plasma FFA concentration leads to an increase in muscle fatty acyl-CoA and diacylglycerol concentrations. Both long-chain fatty acyl-CoAs and diacylglycerol activate protein kinase C-θ, which increases serine phosphorylation with subsequent inhibition of IRS-1 tyrosine phosphorylation. In human muscle, elevated plasma FFA levels inhibit insulin-stimulated tyrosine phosphorylation of IRS-1, the association of the p85 subunit of PI 3-kinase with IRS-1, and activation of PI 3-kinase91,95 (see Fig. 10-30). Direct effects of long-chain fatty acyl-CoAs to inhibit glucose transport, glucose phosphorylation, and glycogen synthase also have been demonstrated in muscle (see Fig. 10-31). Last, increased muscle ceramide levels (secondary to increased long-chain fatty acyl-CoAs) interfere with glucose transport and inhibit glycogen synthase in muscle via multiple mechanisms involving alterations in a variety of intracellular lipid-signaling molecules that exert their inhibitory effects on multiple steps of glucose metabolism (insulin signal transduction system, glucose transport, glucose phosphorylation, glycogen synthase, PDH, Krebs cycle).
The extent to which insulin action in target tissues is direct rather than mediated by shifts in substrate supply can be appreciated by comparing systemic with local insulin administration. When infused intra-arterially into the human forearm, insulin does not alter the circulating substrate supply, in that neither FFA nor glucose concentrations change in the arterial blood recirculating to the forearm tissues. Under these conditions, insulin stimulates forearm glucose uptake and lactate release in a time-dependent manner (Fig. 10-33) but does not induce any detectable change in the local respiratory quotient (0.76) in the blood draining the forearm tissues.96 This observation indicates that the forearm tissues, and the muscle in particular, continue to rely mostly on lipid oxidation for energy production, and that the vast majority of insulin-stimulated glucose uptake is channeled to glycogen. In contrast, when comparable hyperinsulinemia is created by systemic infusion of insulin while maintaining euglycemia, the leg respiratory quotient increases from 0.74 to almost 1.00, that is, glucose oxidation increases, whereas lipid oxidation is markedly reduced. In summary, the direct effects of insulin are to promote glucose transport and phosphorylation, glycolysis, and glycogen synthesis; the stimulatory effect of the hormone on glucose oxidation is both direct and indirect, the latter being mediated by a fall in lipid availability.
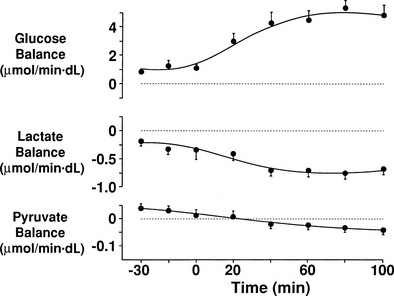
FIGURE 10-33 Net glucose, lactate, and pyruvate balances across the human forearm of healthy subjects in the fasting state (30 to 0 minutes) and during a 100-minute intra-arterial insulin infusion calculated to increase the local insulin concentration by approximately 120 µU/mL. (Reproduced from Natali A, Buzzigoli G, Taddei S et al: Effects of insulin on hemodynamics and metabolism in human forearm. Diabetes 39:490–500, 1990.)
The liver plays a central role in the regulation of glucose metabolism.1,2,9,10,97 After ingestion of a carbohydrate meal, it is essential that the liver suppress its basal rate of glucose production. In addition, the liver ultimately takes up approximately one third of the glucose in the ingested carbohydrate meal. Collectively, suppression of hepatic glucose production and augmentation of hepatic glucose uptake account for maintenance of approximately half of the maintenance of plasma glucose homeostasis after ingestion of a carbohydrate meal. The regulation of hepatic glucose production is controlled by a number of factors (see Fig. 10-3), of which insulin (inhibits hepatic glucose production) and glucagon and FFA (stimulate hepatic glucose production) are the most important. In vitro studies have demonstrated that plasma FFA are potent stimulators of hepatic glucose production and do so by increasing the activity of pyruvate carboxylase and phosphoenolpyruvate carboxykinase, the rate-limiting enzymes for gluconeogenesis.98 FFA also enhance the activity of G6P, the enzyme that ultimately controls the release of glucose by the liver99 (Fig. 10-34).
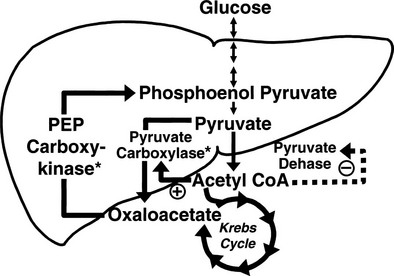
FIGURE 10-34 Schematic representation of the regulation of hepatic glucose production and hepatic gluconeogenesis. Sites of stimulation of free fatty acids are shown by the asterisk. See text for a more detailed discussion. PEP, Phosphoenolpyruvate.
In normal subjects, an acute physiologic increase in plasma FFA concentration stimulates gluconeogenesis, whereas a decrease in plasma FFA concentration reduces gluconeogenesis.100 A significant portion (as much as 25%) of the suppressive effect of insulin on hepatic glucose production is mediated via inhibition of lipolysis and a reduction in circulating plasma FFA concentration.10,23 The relationship between increased plasma FFA concentration, FFA oxidation, and hepatic glucose production can be explained as follows: (1) Increased plasma FFA levels, by mass action, augment FFA uptake by hepatocytes, leading to accelerated lipid oxidation and accumulation of acetyl-CoA. The increased concentration of acetyl-CoA stimulates pyruvate carboxylase, the rate-limiting enzyme in gluconeogenesis, as well as G6Pase, the rate-controlling enzyme for glucose release from the hepatocyte (see Fig. 10-34). (2) The increased rate of FFA oxidation provides a continuing source of energy (in the form of ATP) and reduced nucleotides (NADH) to drive gluconeogenesis. The net result is an enhanced flux of three carbon precursors from pyruvate to oxaloacetate and thus into the gluconeogenic pathway. Finally, it should be noted that an increase in plasma FFA concentration need not be associated with an increase in hepatic glucose production, even though gluconeogenesis is enhanced. This is especially true in nondiabetic subjects in whom, except under very unique experimental conditions, elevation of the plasma FFA level rarely leads to an accelerated rate of hepatic glucose output, because the stimulation of hepatic gluconeogenesis by FFA is precisely offset by an inhibition of glycogenolysis, thereby yielding no net change in hepatic glucose production. This hepatic autoregulation in response to FFA infusion is similar to that observed during the infusion of gluconeogenic precursors.101 Thus, in dogs and nondiabetic humans, intravenous administration of alanine, lactate, and glycerol augment gluconeogenesis but fail to increase total hepatic glucose production because of a reciprocal decline in glycogenolysis. The situation in insulin-resistant states, such as obesity and diabetes, appears to be different. Here, FFA infusion impairs the suppression of hepatic glucose production by insulin and in some instances may actually elevate the basal rate of hepatic glucose production.102,103
Amino acids also can enter into a substrate competition cycle with glucose, although somewhat less effectively than FFAs.104 Increased amino acid provision enhances glucose production under conditions of insulin deficiency or resistance and limits glucose utilization in the insulinized state. Furthermore, an increase in the plasma FFA concentration exerts a hypoaminoacidemic effect in humans.105 In summary, each of the three major substrates (i.e., glucose, FFAs, amino acids), if present in excessive amounts (whether by endogenous production or exogenous administration), can lower the level of the other two by stimulating insulin release. In this situation, glucose metabolism obviously is favored because it is a much more potent insulin secretagogue than fat or amino acids. In addition, multiple substrate effects (not mediated by insulin) participate in the regulation of the substrates themselves: high FFA and amino acid concentrations increase glucose, whereas a high FFA concentration lowers the amino acid levels. The net result is the creation of a glucose–FFA–amino acid cycle in which each member of the triad influences its fellow members both directly and indirectly through the stimulation of insulin secretion (Fig. 10-35).
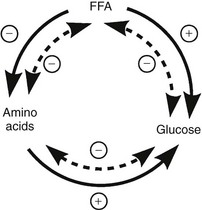
FIGURE 10-35 The glucose–free fatty acid–amino acid cycle. Because glucose, free fatty acid (FFA), and amino acids are all insulin secretogogues, isolated increases of each of them lower the circulating levels of the other two via hyperinsulinemia (inner ring). By substrate competition (outer ring), an increased supply of either FFAs or amino acids will spare glucose. In addition, FFAs have a hypoaminoacidemic effect of their own. See text for a detailed discussion. (Reproduced from Ferrannini E, DeFronzo RA: Insulin actions in vivo: glucose metabolism. In DeFronzo RA, Ferrannini E, Keen H, Zimmet P [eds]: International Textbook of Diabetes Mellitus. Chichester, UK: John Wiley & Sons, 2004, pp 277–318.)
Lipid Synthesis
In humans, adipose tissue and the liver represent the primary sites of fatty acid synthesis. Insulin augments fatty acid synthesis in these tissues primarily by activating acetyl-CoA carboxylase.30 This enzyme converts acetyl-CoA in the cytosol to malonyl-CoA (see Fig. 10-29). Insulin directly activates acetyl-CoA carboxylase by increasing its phosphorylation state and enhancing its synthesis. Insulin also indirectly activates the enzyme by increasing the supply of citrate, which activates acetyl-CoA carboxylase, and by stimulating the pentose phosphate cycle, thus providing the necessary reducing equivalents (NADH) for fat biosynthesis. Insulin also phosphorylates, thereby activating, ATP-citrate lyase, the step immediately preceding that catalyzed by acetyl-CoA carboxylase (see Fig. 10-29).30 The increase in cytosolic malonyl-CoA concentration simultaneously activates fatty acid synthase and binds to carnitine palmitoyl transferase-I, inactivating the enzyme and inhibiting fatty acid oxidation.86 The net result is an enhanced availability of fatty acyl-CoA for triglyceride synthesis. Insulin appears to have little effect on any of the enzymes involved in triacylglycerol synthesis. This is in marked contrast to insulin’s powerful inhibitory action on triacylglycerol lipase, the rate-limiting enzyme in the regulation of lipolysis.86 In addition to the stimulatory effect of insulin on triglyceride synthesis, the hormone also appears to enhance cholesterol formation through an effect exerted on hydroxymethylglutaryl-CoA reductase.
Ketone Metabolism
Ketones are formed in the liver from the oxidation of FFA, and their synthesis is tightly regulated by the circulating levels of insulin and glucagon as well as malonyl-CoA. In the fed state, insulin levels rise, lipolysis is inhibited, and intracellular malonyl-CoA levels rise86 (see Chapter 20). This latter key intermediate inhibits carnitine acyltransferase-I, thus favoring triglyceride synthesis and retarding fatty acid oxidation and ketone body formation. Conversely, in the starved or diabetic state, plasma insulin levels decline and glucagon increases. The increase in glucagon-to-insulin ratio is associated with a decrease in malonyl-CoA concentration, and fatty acid oxidation and ketogenesis are favored (see Fig. 10-30). With the exception of the liver, most tissues can oxidize ketone bodies. Their utilization by peripheral tissues, including muscle, is primarily regulated by their plasma concentration. Ketone bodies represent a major fuel for muscle during prolonged fasting, once their circulating blood levels increase to 1 to 3 mmol/L. Reversal of the elevated glucagon-to-insulin ratio after feeding rapidly inhibits ketogenesis, and the associated decline in plasma ketone levels abolishes ketone utilization by peripheral tissues.
Oral Glucose
At any given point in time, the glycemic response to an exogenous glucose load represents the balance between the rate of glucose appearance in the systemic circulation from all sources (i.e., ingested glucose entering via the gastrointestinal tract and endogenous glucose production) and the rate at which glucose is disposed of by all tissues in the body.97,106 Oral glucose appearance in the systemic circulation depends on (1) the rate at which the gastric contents are passed on to the small intestine; (2) the rate of intestinal glucose absorption; (3) the extent of gut glucose utilization; (4) the degree of hepatic glucose trapping; and (5) the dynamics of glucose transfer through the gut, liver, and posthepatic circulation to the right heart. The contribution of endogenous glucose production to the glycemic response to feeding depends on the extent and rate of change of hepatic glucose release. Initially, disposition of an ingested glucose load depends on changes in the pattern of hormonal stimuli and substrate availability. Because it represents a summation phenomenon, the response to oral glucose explores the whole of glucose tolerance, not the individual contribution of the various components. As discussed previously in this chapter, the rate-limiting step in the transfer of ingested glucose from the stomach to the liver is the rate of gastric emptying. This depends on the volume, temperature, osmolarity, and sodium content of the glucose solution when glucose alone is ingested. Glucose absorption through the intestinal epithelial cells is rapid, efficient, and well in excess of ordinary needs. Glucose utilization by intestinal tissues is small when glucose is presented from the vascular side, that is, when there is no oral glucose (see Table 10-2). The major fuels used by the gastrointestinal tissues in the postabsorptive state are FFA and glutamine. In the presence of glucose at high concentrations on the luminal side, it appears that gut glucose metabolism increases in response to the increased energy needs for absorption; the quantitative aspects of this stimulation of gut glucose utilization remain undetermined in the human. The possibility also exists that systemic hyperglycemia and/or hyperinsulinemia may impede intestinal glucose absorption.
Glucose uptake by the liver is stimulated by portal hyperglycemia (see following),9,10,107 and this has a major impact on hepatic glucose release. The traversal of glucose through the hepatic space is relatively quick, and this is unlikely to introduce a significant delay in the systemic appearance of oral glucose. In summary, the dynamics of oral glucose appearance are essentially determined by gastric emptying, whereas intestinal transport, transit across the gastrointestinal mucosa into the portal blood, and transhepatic passage together introduce only a small time delay. Stated otherwise, if neither gastrointestinal nor liver tissues used glucose, the time course of oral glucose appearance in the systemic circulation would follow that of gastric emptying, with a time shift of a few minutes. For this reason, the glucose absorption step represents a major component of the shape of the glycemic response to glucose. Fig. 10-36 shows the pattern of appearance of ingested glucose in healthy individuals, as reconstructed by a double tracer technique.97 Glucose appearance in the systemic circulation peaks within 30 to 45 minutes, declines slowly thereafter, but remains significantly above zero at 210 minutes after glucose ingestion. At least 4 to 5 hours are necessary for the complete absorption of an oral glucose load, and this is further prolonged by the presence of fat and protein in the meal. Fig. 10-36 also shows the time course of suppression of endogenous glucose release by oral glucose.97,107 A sustained nadir is reached between 60 and 120 minutes, and this is followed by a slow return to the fasting rate; however, hepatic glucose production is still significantly inhibited 210 minutes after the glucose challenge. Overall suppression of hepatic glucose production during the 3- to 4-hour period after glucose ingestion averages 50%. This is surprisingly less than what would be expected based on the combined portal hyperglycemia and hyperinsulinemia (see Fig. 10-5). Because circulating levels of insulin antagonistic hormones (except norepinephrine) do not change after oral glucose, it is likely that activation of the sympathetic nervous system, and specifically those nerves innervating the liver, keeps liver glucose outflow open.18 In Fig. 10-37, the observed arterial plasma glucose concentration is broken down into the component contributed by the appearance of oral glucose and that derived from hepatic glucose production.97,107 The resemblance of oral glucose appearance rate to the plasma glucose curve is readily evident, especially during the first 60 to 90 minutes. Less appreciated is the fact that absorption is still incomplete 3 to 4 hours after ingestion. After a lag of approximately 30 minutes, tissue glucose uptake is stimulated by 50% to 100% throughout the period of observation. Hyperglycemia (mass action effect of glucose to promote its own uptake) contributes more to whole-body glucose disposal during the first half hour; thereafter, hyperinsulinemia provides the predominant stimulus. Oral glucose also elicits a marked vasodilation of the splanchnic vascular bed, and this regional increase in splanchnic blood flow persists for at least 4 hours. Thus both the metabolic and the hemodynamic perturbations induced by oral glucose extend beyond the time that it takes for the plasma glucose concentration to return to its pre-ingestion level.
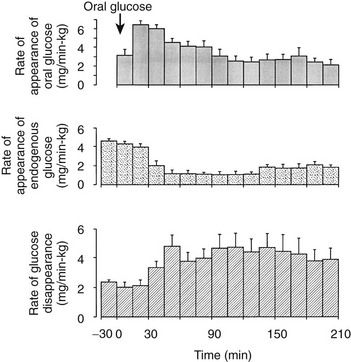
FIGURE 10-36 Glucose turnover after glucose ingestion. The rate of appearance of the oral glucose load (top), the rate of whole-body glucose disappearance (bottom), and the rate of endogenous (hepatic) glucose production (middle) are shown after the ingestion of 1 g/kg glucose in healthy adults. (Reproduced from Ferrannini E, Bjorkman O, Reichard GA et al: The disposal of an oral glucose load in healthy subjects: a quantitative study. Diabetes 34:580–588, 1985.)
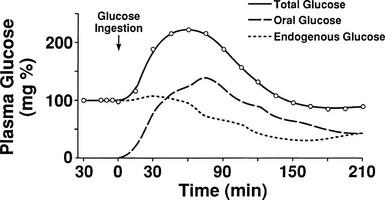
FIGURE 10-37 Separation of the actual arterial plasma glucose concentration (solid line) into its components, based on the amount of glucose that is contributed by endogenous (hepatic) glucose production (dotted line) and oral glucose ingestion (dashed line). (Reproduced from Ferrannini E, Bjorkman O, Reichard GA et al: The disposal of an oral glucose load in healthy subjects: a quantitative study. Diabetes 34:580–588, 1985.)
The tissue destination of absorbed glucose has been the subject of intense investigation. Although the liver was classically reputed to be responsible for the eventual disposal of the majority of an oral glucose load, more recent studies that have employed the hepatic vein catheter technique in combination with radioisotope methodology have demonstrated that peripheral tissues dispose of approximately two thirds of the ingested glucose, whereas the splanchnic tissues account for the remaining one third.108,109 However, it must be remembered that the splanchnic tissues (i.e., liver) also contribute to glucose conservation by reducing their output of glucose. When this amount of glucose is added to that which is taken up by the liver, it can be seen that splanchnic (hepatic) and peripheral tissues contribute approximately equally to the maintenance of normal glucose homeostasis. Obviously, these approximate proportions vary according to the period during which the study is conducted, as well as with the nature of individual responses to glucose ingestion. A robust insulin secretory response directs more posthepatic glucose to the peripheral tissues, whereas a large increase in splanchnic blood flow channels the delivery of incoming sugar to the liver. In humans, for example, a glucose drink sipped slowly over 3.5 hours rather than swallowed in one bolus generates the same overall glucose curve but a 50% smaller endogenous insulin response. Last, the route of glucose administration exerts an important influence on the metabolic fate of glucose in that the portosystemic glucose concentration gradient per se enhances hepatic glucose uptake independently of portal glycemia and total glucose delivery to the liver.10 In humans, the oral route of glucose administration also has been shown to enhance splanchnic (hepatic) glucose uptake.107 Recent studies also have shown that the liver takes up glucose in proportion to delivery.110
After glucose ingestion, glucose oxidation in the brain continues unabated during the absorptive period. Approximately 50% of the glucose that is taken up by peripheral tissues (muscle) is oxidized, and the remainder is stored as muscle glycogen or as lactate in the lactate pool. During absorption from the gastrointestinal tract, lactate release by the intestinal tissues into the portal vein is markedly increased. It has been estimated that approximately 5% of the ingested glucose load is converted into three carbon precursors (lactate, pyruvate, and alanine) that are passed on to the liver and synthesized into glycogen via the indirect pathway of gluconeogenesis. Because the lactate concentration in the hepatic vein also increases after glucose ingestion, it follows that the sum of hepatic lactate production and gut lactate formation must exceed hepatic lactate extraction. Liver glycogen formation during absorption of oral glucose occurs both directly from glucose and indirectly via gluconeogenesis.111 The relative contributions of the direct (from glucose) versus indirect (from gluconeogenic precursors) pathway to hepatic glycogen synthesis in humans remains uncertain owing to methodological difficulties. However, current data suggest that gluconeogenesis participates in liver glycogen repletion to a much lesser extent in humans than in rats.
Counterregulatory Hormones
A review of the role of the insulin counterregulatory hormones (glucagon, epinephrine, cortisol, growth hormone, and thyroid hormones) and their roles in intermediary metabolism is beyond the scope of this chapter, and the reader is referred to Chapter 21 and Ref. 16. The most important role of the counterregulatory hormones is in the defense against hypoglycemia. Glucagon and epinephrine play an important role in the acute recovery from hypoglycemia by stimulating both glycogenolysis and gluconeogenesis. When hypoglycemia is prolonged, cortisol and growth hormone contribute to the restoration of normoglycemia by impairing the tissue’s ability to respond to insulin. Epinephrine also is a potent peripheral insulin antagonist. Except for glucagon (whose concentration increases during fasting, leading to a stimulation of hepatic glucose production primarily by augmenting gluconeogenesis), it is unclear what role if any these insulin antagonistic hormones play in glucoregulation during the transition from the fed to the fasted state. More likely, these counterregulatory hormones contribute to the mobilization of competitive substrates, especially FFAs, from adipose depots to the liver and muscle, where they serve as an important energy source. Circulating levels of these counterregulatory hormones (except glucagon) do not increase during fasting. Rather, the plasma insulin concentration declines in response to the decrease in blood glucose, and the resultant hypoinsulinemia leaves the lipolytic and ketogenic activities of the counterregulatory hormones unopposed, thus facilitating the shift from glucose to FFA metabolism.
References
1. DeFronzo, RA. Lilly lecture: the triumvirate: β-cell, muscle, liver: A collusion responsible for NIDDM. Diabetes. 1988;37:667–687.
2. DeFronzo, RA. Pathogenesis of type 2 diabetes: Metabolic and molecular implications for identifying diabetes genes. Diabetes Rev. 1997;5:177–269.
3. Bays, H, Mandarino, L, DeFronzo, RA. Role of the adipocytes, FFA, and ectopic fat in the pathogenesis of type 2 diabetes mellitus: PPAR agonists provide a rational therapeutic approach. J Clin Endocrinol Metab. 2004;89:463–478.
4. Ruderman, NB, Tornheim, K, Goodman, MN. Fuel homeostasis and intermediary metabolism of carbohydrate, fat, and protein. In: Becker KL, ed. Principles and Practice of Endocrinology and Metabolism. Philadelphia: JB Lippincott; 1992:1054–1064.
5. Ferrannini, E, DeFronzo, RA. Insulin actions in vivo: Glucose metabolism. In: DeFronzo RA, Ferrannini E, Keen H, et al, eds. International Textbook of Diabetes Mellitus. Chichester, UK: John Wiley & Sons; 2004:277–318.
6. Bell, GI. Lilly Lecture. Molecular defects in diabetes mellitus. Diabetes. 1990;40:413–422.
7. Del Prato, S, Ferrannini, E, DeFronzo, RA. Evaluation of insulin sensitivity in man. In: Clarke WL, Larner J, Pohl SL, eds. Methods in Diabetes Research. Vol II. Clinical Methods. New York: John Wiley & Sons; 1986:19–43.
8. Ferrannini, E, Del Prato, S, DeFronzo, RA. Glucose kinetics: Tracer methods. In: Clarke WL, Larner J, Pohl SL, eds. Methods in Diabetes Research, Vol. II: Clinical Methods. New York: John Wiley & Sons; 1986:107–142.
9. DeFronzo, RA, Ferrannini, E. Regulation of hepatic glucose metabolism in humans. Diabetes Metab Rev. 1987;3:415–459.
10. Cherrington, AD. Control of glucose uptake and release by the liver. Diabetes. 1999;48:1198–1224.
11. Gerich, JE, Meyer, C, Woesle, HJ, et al. Renal gluconeogenesis. Its importance in human glucose homeostasis. Diabetes Care. 2001;24:382–391.
12. Landau, BR, Wahren, J, Chandramouli, V, et al. Contributions of gluconeogenesis to glucose production in the fasted state. J Clin Invest. 1996;98:378–385.
13. Felig, P, Sherwin, RS. Carbohydrate homeostasis, liver and diabetes. Prog Liver Dis. 1976;5:149–171.
14. Drucker, DJ. Minireview: The glucagon-like peptides. Endocrinology. 2001;142:521–527.
15. Cahill, GF, Jr. Starvation in man. N Engl J Med. 1970;282:668–675.
16. Gerich, JE, Campbell, PJ. Overview of counterregulation and its abnormalities in diabetes mellitus and other conditions. Diabetes Metab Rev. 1988;4:93–112.
17. Baron, AD, Schaeffer, L, Shragg, P, et al. Role of hyperglucagonemia in maintenance of increased rates of hepatic glucose output in type 2 diabetes. Diabetes. 1987;36:274–283.
18. Shimazu, T. Neuronal regulation of hepatic glucose metabolism in mammals. Diabetes Metab Rev. 1987;3:185–206.
19. DeFronzo, RA, Ferrannini, E, Hendler, R, et al. Regulation of splanchnic and peripheral glucose uptake by insulin and hyperglycemia in man. Diabetes. 1983;32:35–45.
20. Borg, MA, Borg, WP, Tamborlane, WV, et al. Chronic hyperglycemia and diabetes impair counterregulation induced by localized 2-deoxy-glucose perfusion of the ventromedial hypothalamus in rats. Diabetes. 1999;48:584–587.
21. Friedman, B, Goodman, EH, Jr., Weinhouse, S. Effects of insulin and fatty acids on gluconeogenesis in the rat. J Biol Chem. 1967;242:3620–3627.
22. Ferrannini, E, Barrett, EJ, Bevilacqua, S, et al. Effect of fatty acids on glucose production and utilization in man. J Clin Invest. 1983;72:1737–1747.
23. Rebrin, K, Steil, GM, Getty, L, et al. Free fatty acid as a link in the regulation of hepatic glucose output by peripheral insulin. Diabetes. 1995;44:1038–1045.
24. DeFronzo, RA, Jacot, E, Jequier, E, et al. The effect of insulin on the disposal of intravenous glucose: results from indirect calorimetry and hepatic and femoral venous catheterization. Diabetes. 1981;30:1000–1007.
25. Nishi, S, Susumu, S, Bell, GI. Human hexokinase: sequences of amino- and carboxyl-terminal halves are homologous. Biochem Biophys Res Commun. 1988;157:937–943.
26. Garvey, WT. Insulin action and insulin resistance: diseases involving defects in insulin receptors, signal transduction, and the glucose transport effector system. Am J Med. 1998;105:331–345.
27. DeFronzo, RA, Gunnarsson, R, Bjorkman, O, et al. Effects of insulin on peripheral and splanchnic glucose metabolism in non-insulin dependent diabetes mellitus. J Clin Invest. 1985;76:149–155.
28. Ferrannini, E. The theoretical bases of indirect calorimetry: a review. Metabolism. 1988;37:287–301.
29. Newsholme, EA, Leech, AR. Biochemistry for the Medical Sciences. Chichester, UK: John Wiley & Sons; 1983.
30. Denton, RM, Tavare, JM. Actions of insulin on intracellular processes. In: Alberti KGMM, DeFronzo RA, Keen H, et al, eds. International Textbook of Diabetes Mellitus. Chichester, UK: John Wiley & Sons; 1992:385–408.
31. Pilkis, SJ, El-Maghrabi, MR, Claus, TH. Fructose-2,6-biphosphate in control of hepatic gluconeogenesis. Diabetes Care. 1990;13:582–599.
32. Ferrannini, E, Barrett, E, Bevilacqua, S, et al. Sodium elevates the plasma glucose response to glucose ingestion in man. J Clin Endocrinol Metab. 1982;54:455–458.
33. DeFronzo, RA, Tobin, J, Andres, R. Glucose clamp technique: a method for quantifying insulin secretion and insulin resistance. Am J Physiol. 1979;237:E214–E223.
34. Nauck, MA, Homberger, E, Eberhard, GS, et al. Incretin effects of increasing glucose loads in man calculated from venous insulin and C-peptide responses. J Clin Endocrinol Metab. 1986;63:492–498.
35. Muscelli, E, Mari, A, Casolaro, A, et al. Separate impact of obesity and glucose tolerance on the incretin effect in normal subjects and type 2 diabetic patients. Diabetes. 2008;57:1340–1348.
36. DeFronzo, RA. Glucose intolerance and aging. Diabetes Care. 1993;4:493–501.
37. Ferrannini, E, Vichi, S, Beck-Nielsen, H, et al. Insulin action and age. European Group for the Study of Insulin Resistance (EGIR). Diabetes. 1996;45:947–953.
38. Ferrannini, E, Natali, A, Bell, P, et al. Insulin resistance and hypersecretion in obesity. European Group for the Study of Insulin Resistance (EGIR). J Clin Invest. 1997;100:1166–1173.
39. Schneider, SH, Morgado, A. Effects of fitness and physical training on carbohydrate metabolism and associated cardiovascular risk factors in patients with diabetes. Diabetes Rev. 1995;3:378–407.
40. Lillioja, S, Mott, DM, Zawadzki, JK, et al. In vivo insulin action is familial characteristic in nondiabetic Pima Indians. Diabetes. 1987;36:1329–1335.
41. Ferrannini, E. Insulin resistance versus insulin deficiency in non-insulin-dependent diabetes mellitus: problems and prospects. Endocr Rev. 1998;19:477–490.
42. Greco, AV, Mingrone, G, Giancaterini, A, et al. Insulin resistance in morbid obesity: reversal with intramyocellular fat depletion. Diabetes. 2002;51:144–151.
43. Ferrannini, E, Mari, A. Beta cell function and its relation to insulin action in humans: a critical appraisal. Diabetologia. 2004;47:943–956.
44. Gastaldelli, A, Ferrannini, E, Miyazaki, Y, et al. Beta-cell dysfunction and glucose intolerance: results from the San Antonio metabolism (SAM) study. Diabetologia. 2004;47:31–39.
45. Ferrannini, E, Gastaldelli, A, Miyazaki, Y, et al. Beta-cell function in subjects spanning the range from normal glucose tolerance to overt diabetes: a new analysis. J Clin Endocrinol Metab. 2005;90:493–500.
46. Mari, A, Schmitz, O, Gastaldelli, A, et al. Meal and oral glucose tests for assessment of beta-cell function: modeling analysis in normal subjects. Am J Physiol Endocrinol Metab. 2002;283:E1159–1166.
47. Lyssenko, V, Jonsson, A, Almgren, P, et al. Clinical risk factors, DNA variants, and the development of type 2 diabetes. N Engl J Med. 2008;359:2220–2232.
48. Pascoe, L, Frayling, TM, Weedon, MN, et al. Beta cell glucose sensitivity is decreased by 39% in non-diabetic individuals carrying multiple diabetes-risk alleles compared with those with no risk alleles. Diabetologia. 2008;51:1989–1992.
49. Walker, M, Mari, A, Jayapaul, MK, et al. Impaired beta-cell glucose sensitivity and whole-body insulin sensitivity as predictors of hyperglycaemia in non-diabetic subjects. Diabetologia. 2005;48:2470–2476.
50. Groop, LC, Bonadonna, RC, Del Prato, S, et al. Glucose and free fatty acid metabolism in non-insulin-dependent diabetes mellitus: evidence for multiple sites of insulin resistance. J Clin Invest. 1989;84:205–213.
51. Cobelli, C, Mari, A, Ferrannini, E. The non-steady-state problem: error analysis of Steele’s model and developments for glucose kinetics. Am J Physiol. 1987;252:E679–E687.
52. Iozzo, P, Geisler, F, Oikonen, V, et al. Insulin stimulates liver glucose uptake in humans: an 18F-FDG PET study. J Nuclear Med. 2003;44:682–689.
53. Basu, R, Basu, A, Johnson, CM, et al. Insulin dose-response curves for stimulation of splanchnic glucose uptake and suppression of endogenous glucose production differ in nondiabetic humans and are abnormal in people with type 2 diabetes. Diabetes. 2004;53:2042–2050.
54. Prager, R, Wallace, P, Olefsky, JM. In vivo kinetics of insulin action on peripheral glucose disposal and hepatic output in normal and obese subjects. J Clin Invest. 1986;78:472–481.
55. Thiebaud, D, Jacot, E, DeFronzo, RA, et al. The effect of graded doses of insulin on total glucose uptake, glucose oxidation, and glucose storage in man. Diabetes. 1982;31:957–963.
56. Shulman, GI, Rothman, DL, Jue, T, et al. Quantitation of muscle glycogen synthesis in normal subjects and subjects with non-insulin-dependent diabetes by 13C nuclear magnetic resonance spectroscopy. N Engl J Med. 1990;322:223–228.
57. Del Prato, S, Bonadonna, R, Bonora, E, et al. Characterization of cellular defects in insulin action in type 2 (non-insulin-dependent) diabetes mellitus. J Clin Invest. 1993;94:484–494.
58. Saltiel, AR, Kahn, CR. Insulin signaling and the regulation of glucose and lipid metabolism. Nature. 2001;414:799–806.
59. Pessin, JE, Saltiel, AR. Signaling pathways in insulin action: molecular targets of insulin resistance. J Clin Invest. 2000;106:165–169.
60. Whitehead, JP, Clark, SF, Urso, B, et al. Signaling through the insulin receptor. Curr Opin Cell Biol. 2000;12:222–228.
61. Shepherd, PR, Kahn, BB. Glucose transporters and insulin action. Implications for insulin resistance and diabetes mellitus. N Engl J Med. 1999;341:248–257.
62. Virkamaki, A, Ueki, K, Kahn, CR. Protein-protein interaction in insulin signaling and the molecular mechanisms of insulin resistance. J Clin Invest. 1999;103:931–943.
63. Bauman, CA, Ribon, V, Kanzaki, M, et al. CAP defines a second signaling pathway required for insulin-stimulated glucose transport. Nature. 2000;407:202–207.
64. Thomas, G, Hall, MN. TOR signaling and control of cell growth. Curr Opin Cell Biol. 1997;9:782–787.
65. Cusi, K, Maezono, K, Osman, A, et al. Insulin resistance differentially affects the PI 3-kinase and MAP kinase-mediated signaling in human muscle. J Clin Invest. 2000;105:311–320.
66. Hsueh, WA, Law, RE. Insulin signaling in the arterial wall. Am J Cardiol. 1999;84:21J–24J.
67. Dent, P, Lavoinne, A, Nakielny, S, et al. The molecular mechanisms by which insulin stimulates glycogen synthesis in mammalian skeletal muscle. Nature. 1990;348:302–307.
68. Cohen, P. The structure and regulation of protein phosphatases. Annu Rev Biochem. 1989;58:453–508.
69. Newgard, CB, Brady, MJ, O’Doherty, RB, et al. Organizing glucose disposal. Emerging roles of the glycogen targeting subunits of protein phosphatase-1. Diabetes. 2000;49:1967–1977.
70. Bell, GI, Kayano, T, Buse, JB, et al. Molecular biology of mammalian glucose transporters. Diabetes Care. 1990;13:198–200.
71. Joost, H-G, Bell, GI, Best, JD, et al. Nomenclature of the GLUT/SLG2A family of sugar/polyol transport facilitators. Am J Physiol. 2002;282:E974–E976.
72. Colowick, SP, The hexokinases. The Enzymes. Boyer, PD, eds. The Enzymes, vol. 9. New York: Academic Press, 1973:1–48.
73. Printz, RL, Koch, S, Potter, LR, et al. Hexokinase II mRNA and gene structure, regulation by insulin, and evolution. J Biol Chem. 1993;268:5209–5219.
74. Rogers, PA, Fisher, RA, Harris, H. An electrophoretic study of the distribution and properties of human hexokinases. Biochem Genet. 1975;13:857–866.
75. Magnuson, MA, Andreone, IL, Printz, RL, et al. The glucokinase gene: structure and regulation by insulin. Proc Natl Acad Sci U S A. 1989;86:4838–4842.
76. Mandarino, LJ, Printz, RL, Cusi, KA, et al. Regulation of hexokinase II and glycogen synthase mRNA, protein, and activity in human muscle. Am J Physiol. 1995;269:E701–E708.
77. Vogt, C, Yki-Jarvinen, H, Iozzo, P, et al. Effects of insulin on subcellular localization of hexokinase II in human skeletal muscle in vivo. J Clin Endocrinol Metab. 1998;83:230–234.
78. Virtanen, KA, Peltoniemi, P, Marjamaki, P, et al. Human adipose tissue glucose uptake determined using [(18)F]-fluoro-deoxy-glucose ([(18)F]FDG) and PET in combination with microdialysis. Diabetologia. 2001;44:2171–2179.
79. van der Werve, G, Jeanreanud, B. Liver glycogen metabolism: an overview. Diabetes Metab Rev. 1987;3:47–78.
80. Frame, S, Cohen, P. GSK3 takes centre stage more than 20 years after its discovery. Biochem J. 2001;359:1–16.
81. Cohen, P. The Croonian Lecture 1999. Identification of a protein kinase cascade of major importance in insulin signal transduction. Philos Trans R Soc Lond B Biol Sci. 1999;354:485–495.
82. Stralfors, P, Hiraga, A, Cohen, P. The protein phosphatases involved in cellular regulation: purification and characterization of the glycogen-bound form of protein phosphatase-1 from rabbit skeletal muscle. Eur J Biochem. 1985;149:295–303.
83. Mandarino, LJ, Wright, KS, Verity, LS, et al. Effects of insulin infusion on human skeletal muscle pyruvate dehydrogenase, phosphofructokinase, and glycogen synthase: evidence for their role in oxidative glucose metabolism. J Clin Invest. 1987;80:655–663.
84. Vestergaard, H, Lund, S, Larsen, FS, et al. Glycogen synthase and phosphofructokinase protein and mRNA levels in skeletal muscle from insulin-resistant patients with non-insulin-dependent diabetes mellitus. J Clin Invest. 1993;91:2342–2350.
85. Randle, PJ, Garland, PB, Hales, CN, et al. The glucose-fatty acid cycle: its role in insulin sensitivity and metabolic disturbances of diabetes mellitus. Lancet. 1961;1:785–789.
86. Prentki, M, Corkey, BE. Are the β-cell signaling molecules malonyl-CoA and cytosolic long-chain acyl-CoA implicated in multiple tissue defects of obesity and NIDDM? Diabetes. 1996;45:273–283.
87. Wititsuwannakul, D, Kim, K. Mechanism of palmityl coenzyme A inhibition or liver glycogen synthase. J Biol Chem. 1977;252:7812–7817.
88. Chalkley, SM, Hettiarachchi, M, Chisholm, DJ, et al. Five-hour fatty acid elevation increases muscle lipids and impairs glycogen synthesis in the rat. Metabolism. 1998;47:1121–1126.
89. Thiebaud, D, DeFronzo, RA, Jacot, E, et al. Effect of long-chain triglyceride infusion on glucose metabolism in man. Metabolism. 1982;21:1128–1136.
90. Bonadonna, RC, Zych, K, Boni, C, et al. Time dependence of the interaction between lipid and glucose in humans. Am J Physiol. 1989;257:E49–56.
91. Dresner, A, Laurent, D, Marcucci, M, et al. Effects of free fatty acids on glucose transport and IRS-1 associated phosphatidylinositol-3-kinase activity. J Clin Invest. 1999;103:253–259.
92. Itani, SI, Ruderman, NB, Schnieder, F, et al. Lipid-induced insulin resistance in human muscle is associated with changes in diacylglycerol, protein kinase C, and IkB-α. Diabetes. 2002;51:2005–2011.
93. Ellis, BA, Pognten, A, Lowry, AJ, et al. Long-chain acyl-CoA esters as indicators of lipid metabolism and insulin sensitivity in rat and human muscle. Am J Physiol. 2000;279:E554–E560.
94. Kelley, DE, Mandarino, LJ. Fuel selection in human skeletal muscle in insulin resistance. Diabetes. 2000;49:677–683.
95. Belfort, R, Mandarino, L, Kashyap, S, et al. Dose response effect of elevated plasma FFA on insulin signaling. Diabetes. 2005;54:1640–1648.
96. Natali, A, Buzzigoli, G, Taddei, S, et al. Effects of insulin on hemodynamics and metabolism in human forearm. Diabetes. 1990;39:490–500.
97. Ferrannini, E, Bjorkman, O, Reichard, GA, et al. The disposal of an oral glucose load in healthy subjects: a quantitative study. Diabetes. 1985;34:580–588.
98. Exton, JH, Corbin, JG, Park, CR. Control of gluconeogenesis in liver. IV. Differential effects of fatty acids and glucagon on ketogenesis and gluconeogenesis in the perfused rat liver. J Biol Chem. 1969;244:4095–4102.
99. Massillon, D, Barzailai, N, Hawkins, M, et al. Induction of hepatic G-6-Pase gene expression by lipid infusion. Diabetes. 1997;46:153–157.
100. Chen, X, Iqbal, N, Boden, G. The effect of free fatty acids on gluconeogenesis and glycogenolysis in normal subjects. J Clin Invest. 1999;103:365–372.
101. Jenssen, T, Nurjhan, N, Consoli, A, et al. Failure of substrate-induced gluconeogenesis to increase overall glucose appearance in normal humans: demonstration of hepatic autoregulation without a change in plasma glucose concentrations. J Clin Invest. 1990;86:489–497.
102. Bevilacqua, S, Bonadonna, R, Buzzigoli, G, et al. Acute elevation of free fatty acid levels leads to hepatic insulin resistance in obese subjects. Metabolism. 1987;36:502–506.
103. Bevilacqua, S, Buzzigoli, G, Bonadonna, R, et al. Operation of Randle’s cycle in patients with NIDDM. Diabetes. 1990;9:383–389.
104. Ferrannini, E, Bevilacqua, S, Lanzone, L, et al. Metabolic interactions of amino acids and glucose in healthy humans. Diabetes Nutr Metab. 1988;3:176–186.
105. Ferrannini, E, Barrett, EJ, Bevilacqua, S, et al. Effect of free fatty acids on blood amino acid levels in humans. Am J Physiol. 1986;250:E686–E694.
106. Katz, L, Glickman, MG, Rappaport, S, et al. Splanchnic and peripheral disposal of oral glucose in man. Diabetes. 1983;32:675–679.
107. Ferrannini, E, Wahren, J, Felig, P, et al. Role of fractional glucose extraction in the regulation of splanchnic glucose metabolism in normal and diabetic man. Metabolism. 1980;29:28–35.
108. DeFronzo, RA. Pathogenesis of type 2 (non-insulin dependent) diabetes mellitus. Diabetologia. 1992;35:389–397.
109. Kelley, D, Mitrakou, A, Marsh, H, et al. Skeletal muscle glycolysis, oxidation, and storage of an oral glucose load. J Clin Invest. 1988;81:1563–1571.
110. Ferrannini, E, Katz, LD, Glickman, MG, et al. Influence of combined intravenous and oral glucose administration on splanchnic glucose uptake in man. Clin Physiol. 1990;10:527–538.
111. Shulman, GI, DeFronzo, RA, Rossetti, HL. Differential effect of hyperglycemia and hyperinsulinemia on the pathway of hepatic glycogen repletion as assessed by 13C-NMR. Am J Physiol. 1991;260:E731–E735.