[level-membership-for-opthalmology-category]Chapter 12
Visual Fields in Retinal Disease
One need only review the classic atlas by Dr J. Donald M. Gass1 to recognize that most retinal diseases are readily diagnosed by careful ophthalmoscopic examination. However, for the ophthalmologist to understand and document visual consequences of retinal disease, qualitative and quantitative assessment is critical. In particular, visual field testing helps with the correlation of structural changes in the retina or elsewhere in the visual pathway with deficits in function. For example, AM is a 70-year-old woman diagnosed as having an old central retinal vein occlusion (CRVO) in the left eye and surface wrinkling retinopathy in both eyes. She also had been treated for elevated intraocular pressure. Fluorescein angiography of the left eye showed shunting vessels around the optic nerve head, thought to be consistent with the old vein occlusion. However, progressive bilateral visual field loss (Fig. 12.1) over 2 years suggested the need for further investigation. A computed tomography (CT) scan demonstrated a large subfrontal meningioma compressing both optic nerves (Fig. 12.2).
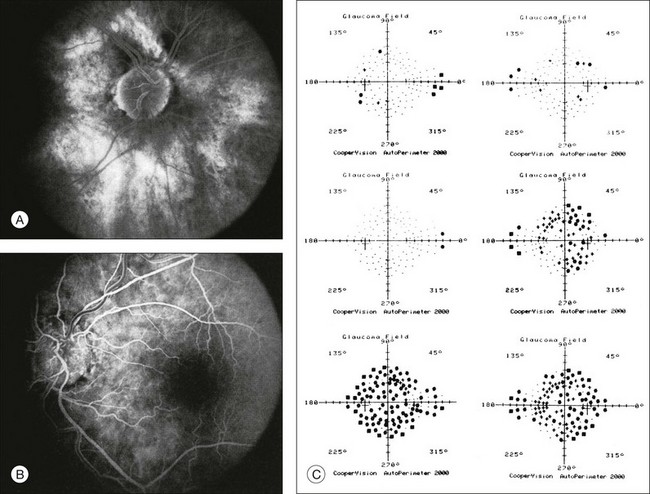
Fig. 12.1 (A, B) Fluorescein angiograms of a 70-year-old woman who has had progressive loss of vision in both eyes over 2 years. She has controlled ocular hypertension and surface-wrinkling retinopathy. The history of an old central retinal vein occlusion in the left eye is supported by the slightly dilated and tortuous retinal veins and the multiple shunting capillaries on the surface of the disc (B). (C) Progressive field loss, documented in both eyes over 3 years, is inconsistent with the ophthalmoscopic appearance. A computed tomographic scan was ordered, the results of which are shown in Fig. 12.2.
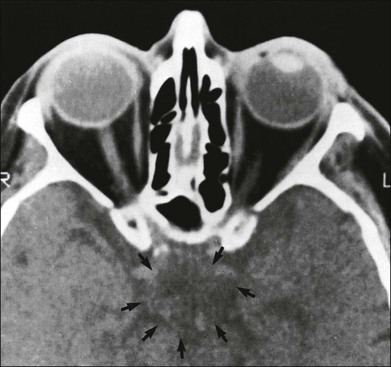
Fig. 12.2 Computed tomographic scan from the patient described in Fig. 12.1 demonstrates a large subfrontal meningioma with bilateral optic nerve compression. Surgical resection improved sensorium but not vision.
Principles of perimetry
The single most important concept in understanding the visual field is depicted by the island of Traquair, which is defined as a “hill of vision” surrounded by a “sea of blindness.”2 The shape of the normal visual field is oval. There is decreasing sensitivity with increasing eccentricity in the field, as the elevation corresponds to the sensitivity of the field, and the flat plane corresponds to location within the field (Fig. 12.3). From the point of fixation, the field extends 60° superiorly, 60° nasally, 70–75° inferiorly, and 100–110° temporally. The blind spot is represented by a hole in the “hill” about 15° temporal to the foveal “peak.”
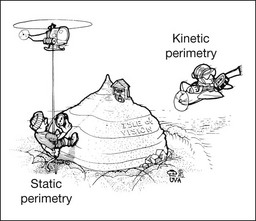
Fig. 12.3 The “island,” or “hill of vision,” proposed by Traquair is surrounded by a “sea of blindness.” The height of the island represents increasing sensitivity. Using kinetic perimetry, the island is intercepted by a moving target of fixed size. Using static perimetry, a target’s visibility is increased in size or luminosity until it descends on to the island. The blind spot located 15° temporal to fixation is absolute, creating a small “well” in the sensitivity contour. (Courtesy of Steven Newman, MD.)
Perimetric tests have been developed that systematically measure the level of light sensitivity in the visual field. Two basic types exist: kinetic perimetry and static perimetry. In kinetic perimetry a target is moved from outside the potentially seeing area toward the seeing area until it is detected. In static perimetry a target located within a potentially seeing area can be increased in size or intensity until it is detected. With either method a region of vision can be defined in relation to a test stimulus of given size, hue, brightness, and uniform level of background illumination. For instance, under standardized conditions, the central visual field of about 30° can be mapped with a moving white target of 3 mm at a distance of 2 meters.3
Methods of visual field testing
Qualitative techniques
Although the tangent screen can be used quantitatively, it is most effective as a qualitative tool for estimation of visual loss in the central field. A 1-meter screen can be used to evaluate suspected midperipheral field loss, but a 2-meter screen is essential if the intent is to map central scotomata or the physiologic blind spot. The sensitivity of the test can be increased with the use of smaller test objects and by seeking subjective responses about the quality (e.g., blurry, dim, flickering, faded) of seen targets. Most important, conical visual field constriction of retinal origin can be readily distinguished from tubular fields of nonorganic visual loss by using large test objects at varying distances. With a doubling of the distance to the screen, there must be a doubling in size of the test object used. Although not routinely available or performed in a retinal specialist’s office, no other form of perimetric evaluation is as effective in discriminating real from fictitious visual field constriction (Fig. 12.4).
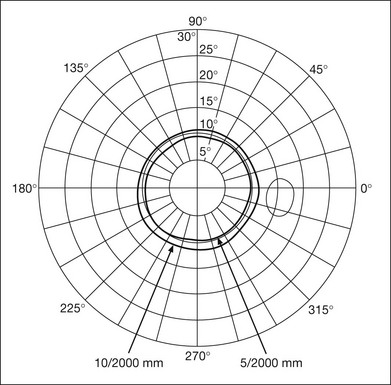
Fig. 12.4 A tangent screen field from a hysterical or malingering patient fails to show expansion of the visual field with doubling of both test object size and distance.
The Amsler grid is another extremely important qualitative tool for the evaluation of central vision. It is routinely used in regular self-monitoring of vision between eye exams by patients with macular degeneration or other progressive macular pathology to detect early signs of disease progression. In its original form, the patient fixates on the center dot of a white grid on a black background from a distance of 35.5 cm (14 inches) (Fig. 12.5). The patient describes the appearance of the grid pattern, especially in regard to missing areas (scotomata) and distortion (metamorphopsia). The sensitivity for detection of macular lesions can be increased with the use of red grids with or without the use of crossed polarizing lenses (Fig. 12.6) to decrease the light entering the patient’s eye.4
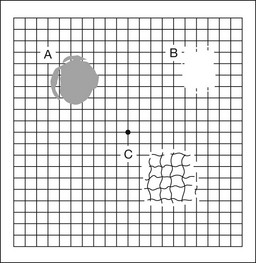
Fig. 12.5 The Amsler grid is viewed at 35.5 cm (14 inches), using the central dot for fixation. Regions of metamorphopsia (C), scotoma (B), and blur (A) are noted.
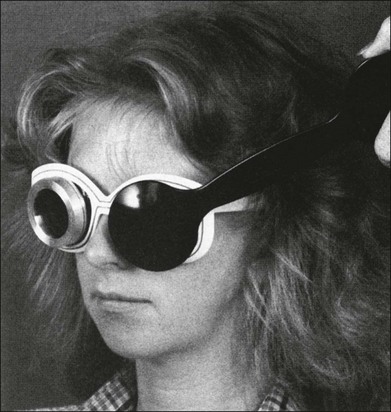
Fig. 12.6 The sensitivity of the Amsler grid test can be increased by using red lines on a black background rather than black or white lines on contrasting backgrounds. Further sensitivity may be achieved by using crossed-polarizing glasses that decrease the amount of light entering the eye. (Courtesy of Alfredo Sadun, MD.)
Quantitative techniques
Both Goldmann and Tübinger perimetry require examiners with a high degree of training. The Goldmann visual field (GVF) perimeter uses a kinetic strategy, although static perimetry is possible (Fig. 12.7). It is especially useful for monitoring peripheral visual field loss and large scotomata. It has limited capabilities for the evaluation of small central scotomata. The Tübinger perimeter uses a static strategy. It is a sensitive but time-consuming technique for identifying small or large relative field defects once the approximate region of the field loss has been determined. Laborious Tübinger profiles are usually made only across a single meridian of the visual field, limiting its screening capabilities (Fig. 12.8).
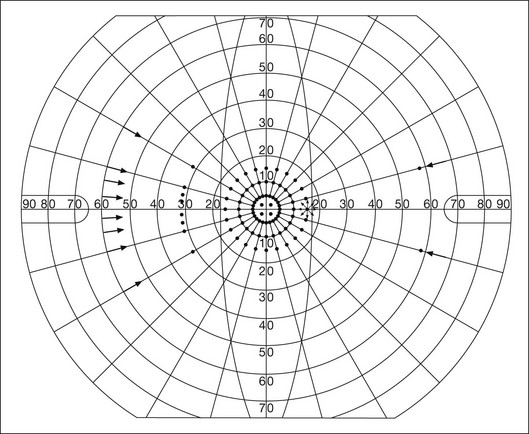
Fig. 12.7 The Goldmann visual field strategy developed by Armaly and Drance uses kinetic targets (arrows) to map the peripheral isopters and suprathreshold static targets (dots) to check central visual field function. (Reproduced with permission from Rock WJ, Drance SM, Morgan RW. Visual field screening in glaucoma. An evaluation of the Armaly technique for screening glaucomatous visual fields. Arch Ophthalmol 1973;89:287–90.)
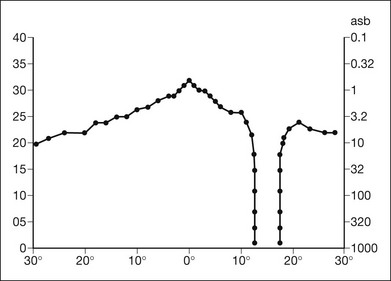
Fig. 12.8 The Tübinger perimeter produces a static profile of visual sensitivity through any chosen meridian. (Reproduced with permission from Harrington DO. The visual fields: a textbook and atlas of clinical perimetry. St Louis: Mosby, 1981.)
Quantitative perimetry received a tremendous boost with the advent of automated, computerized methodology. Suprathreshold automated visual screeners, such as the Fieldmaster 101 and the Dicon units, did much to popularize visual field testing in the ophthalmic community. Pseudothreshold algorithms have been developed for these machines to enhance their quantitative capabilities.5 However, threshold perimeters, such as the Octopus and the Humphrey visual field (HVF) analyzer, have surpassed the capabilities of even the Tübinger instrument. Automated, quantitative threshold perimetry is ideal for the evaluation of retinal disease. Randomized sequences for stimulus presentation within the visual field enhance the possibility of detecting small or irregular field defects. Density of points can be varied to characterize fully field losses that are either focal or diffuse. Although the HVF has the ability to test 60° of visual field, this protocol is very time-consuming. The standard protocols used are the 30-2, 24-2, and 10-2, which measure the central 30, 24, and 10° respectively. The choice of field is based on the region of pathology in the visual field. The dash 2 (-2) refers to protocol 2, the analysis which points on either side of the vertical and horizontal meridians rather than just on the vertical and horizontal axis as performed in protocol 1. Thus, both the 24-2 and 30-2 protocols test points 3° from the horizontal and vertical axis as well as points at 6° intervals beyond this region in the central 24 or 30° respectively. A 10-2 protocol tests points 1° from the horizontal and vertical meridian as well as points at 2° beyond this region in the central 10° and thus is more sensitive for detecting subtle field losses in the macular region.6
Newer algorithms such as the Swedish interactive threshold algorithm (SITA) have been developed to increase efficiency and decrease variability in the standard Humphrey strategy. This strategy uses normative and real-time data from patients during the test to update estimates of thresholds and adjust presentation times of stimuli continually. Short-wavelength automated perimetry (SWAP) is a variant on the usual white light stimulus used in standard threshold testing. SWAP isolates the S-cone system (blue–yellow pathway), using a blue stimulus on a yellow background. Normal, age-corrected retinal sensitivity values have been established, increasing the utility in clinical testing.7,8 Care must be taken when using this technique to correct for chromatic filtering effects from the crystalline lenses.9 Longer test duration, increased variability, and learning effects make SWAP most applicable to conditions for which early detection has important therapeutic implications and requires careful supervision of the patient by the tester during visual field testing.10 In each case, the ability to map statically determined threshold retinal sensitivity directly on to the retina with automated quantitative threshold perimetry with a high degree of accuracy is important in the evaluation of retinal disease.11 This ability has further been refined by techniques such as microperimetry. However, as with any repeated test used to follow changes over time, consistency in choice of testing method is important in accurately characterizing and following the progression of retinal diseases.
Other methodologies of visual field testing in retinal disease
Microperimetry is a relatively new methodology for assessing visual fields that is especially helpful for evaluating and following macular disease. It is used to correlate anatomic pathology with function of the visual system by integrating fundus imaging and computerized threshold perimetry at specific locations in the fundus. One technique of microperimetry uses a scanning laser ophthalmoscope (SLO) (e.g., Rodenstock, Ottobrunn, Germany) to plot field defects within geographically defined regions of the retina. A modulated helium-neon laser beam of variable intensity (0–21 dB) at 633 nm projects stimuli on to the retina during ophthalmoscopy performed with an infrared diode laser at 780 nm.7,12 Another type of microperimetry is Micro Perimeter 1 (MP 1, Nidek Instruments, Padova, Italy) which uses an infrared fundus camera that provides a 45° view and performs perimetry using a liquid crystal display with a special software. The MP-1 allows for eye tracking and real-color fundus image acquisition. Images from other tests, such as fluorescein angiogram, can be overlaid on to the microperimetry, which is not possible in SLO microperimetry. Moreover, as SLO microperimetry is also restricted to red laser light, comparison with standard perimetry or MP-1 is difficult.12
Both the SLO and MP-1 microperimetry devices allow for kinetic and static perimetric testing of the macula and permit simultaneous observation of the retina during perimetric testing. Similar to conventional perimetry, stimulus sizes range from Goldmann size I to V and the central 15–20° of visual field can be tested in both devices, although the MP-1 allows for a slightly larger field for testing. Rohrschneider and colleagues determined that for patients with retinal disease both the SLO and MP-1 microperimetry devices provided comparable results, with the SLO devices providing better-resolution fundus images and the MP-1 providing better fixation analysis with more accurate real-time image alignment.13 As efforts to correlate better anatomic and functional changes in the retina have advanced, more refined devices are being developed that combine techniques of visualizing the ultrastructure of the retina, such as three-dimensional spectral optical coherence tomography (OCT) and adaptive optics, with corresponding perimetric functional assessment.14,15
Perimetric tests are being developed to screen for early changes in retinal diseases affecting the macula. Rarebit testing, or the matching of test targets to receptive field sizes, has been used in select studies in the last decade to assess central functional vision in a variety of retinal diseases. A compact rarebit screening test has been developed and tested in patients with age-related macular degeneration (AMD).16 Preferential hyperacuity perimetry (PHP) is another screening device for detecting early visual field changes in retinal disease. PHP uses the phenomenon of hyperacuity (Vernier acuity), the ability to discern differences in the spatial location of two or more stimuli, to test one’s ability to identify local distortion of a series of dotted vertical or horizontal signals. The responses are correlated to a normative database and scored to generate a probability of deviation from normal. PHP has been found to be more sensitive than Amsler grid testing for the early detection of neovascular AMD in patients with intermediate AMD. Home monitoring devices using PHP, which allow for convenient and timely early detection of progression of AMD, have been developed and are currently being evaluated for more widespread clinical use.17
Reliability and reproducibility of visual field tests
Anatomic, physiologic, and psychological factors unrelated to the pathology in question can significantly affect measurement of the visual field. The nose, brow, and lid may constrict the nasal and superior fields artifactually. Numerous variables pertaining to both the patient and the environment must be controlled during testing if meaningful results are to be obtained. Even so, considerable short-term variability must be taken into account. Box 12.1 outlines a list of factors that must be controlled for optimal determination of the visual field. Perimetric testing has a degree of subjectivity and therefore ultimate reliability and repeatability of the testing rely on the patient and the test giver.18 Patients with retinal disease may be more prone to variability in testing over time, which can influence the validity of test results. Seiple and colleagues19 demonstrated that for patients with retinitis pigmentosa (RP) the results of repeated HVF testing performed at different time points were two times more variable when compared to similar fields performed in normal controls despite controlling for disease progression. Microperimetry has the added advantage of real-time retinal surface monitoring with eye tracking to correct for eye movements during testing. Weingessel and colleagues have demonstrated good interexaminer and intraexaminer reliability of microperimetry using the MP-1 device in eyes with and without retinal disease.20
Perimetry in specific retinal diseases
Retinal dystrophies
Visual fields have traditionally been used to characterize and monitor the progression of visual field loss in RP. The earliest field defect in RP is reported to be a group of isolated scotomata 20–25° from fixation.3 Eventually these isolated defects coalesce into a “ring scotoma” affecting the midperiphery of the visual field. Usually the peripheral field loss progresses and leaves a small, central island of vision. Eventually, complete visual loss may occur (Fig. 12.9).
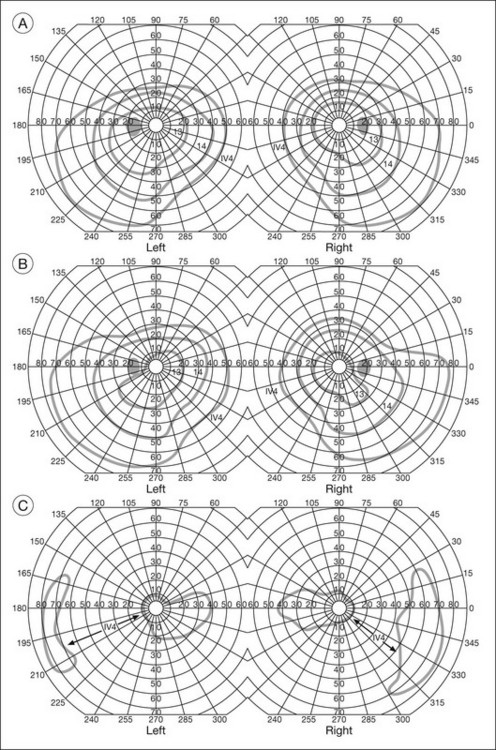
Fig. 12.9 Classic development of a ring scotoma with focal sparing of a peripheral temporal island seen in retinitis pigmentosa and cone–rod dystrophies. (A) Progressive depression of peripheral visual field in a patient with cone–rod degeneration at presentation. (B) Same patient after 1 year. (C) Same patient during fourth year of follow-up. (Reproduced with permission from Krauss HR, Heckenlively JR. Visual field changes in cone–rod degenerations. Arch Ophthalmol 1982;100:1784–90.)
Characterization and comparison of specific patterns of visual field loss in genotypically and phenotypically different forms of RP such as X-linked, dominant, pericentral, and Usher syndrome using GVF perimetry have been attempted to differentiate better subgroups of RP based on visual prognosis and genotype.21–23 Association of degree of visual field loss with different genotypes in syndromic associations of RP, including Bardet–Biedl syndrome 1, has also been studied.24 In addition, HVF measurements have been correlated with contrast sensitivity in RP and were found to be a sensitive predictor for central visual function in advanced RP.25,26 Visual field perimetry has been used to test outcomes of treatments for varieties of RP, including fundus albipunctatus.27
Visual fields have also been used in correlating photoreceptor anatomy and visual function in RP. Decreased retinal sensitivity on electroretinogram has been linked to visual field loss demonstrated by perimetry in RP.28 Recently, changes in GVF, HVF, and microperimetry have been correlated with anatomical changes at the cellular level using OCT and autofluorescence to identify abnormal photoreceptor morphology and damage to retinal pigment epithelial (RPE) cells.29–35
Perimetric changes occur in a variety of retinal dystrophies. Cone dystrophy produces progressive symmetric to slightly asymmetric central visual loss. This is associated with a macular pigmentary disturbance. The visual fields demonstrate central scotomata with relative sparing of the fovea (Fig. 12.10). A central or paracentral scotoma can also be seen in Stargardt disease. However, microperimetry identifies two types of scotoma in patients with Stargardt disease. In one type there is a dense ring scotoma associated with stable fixation. In the second type there is a dense central scotoma associated with fixation shift. The second type is also correlated with poorer acuity.36 In contrast, there is constriction of the visual field corresponding to the progressive peripheral retinal degeneration with scalloped margins in gyrate atrophy of the retina and choroid, a rare tapetoretinal degeneration caused by an inborn error of ornithine aminotransferase activity (Figs 12.11 and 12.12). Constricted GVF tests are also seen in Bietti crystalline dystrophy.37 Correlations between HVF sensitivity and multifocal electroretinogram (mERG) have been documented for eyes with central areolar choroidal dystrophy and North Carolina macular dystrophy.38,39 Functional changes as evidenced by perimetry and mERG have also been correlated with morphological changes documented by fundus autofluorescence in adult vitelliform macular dystrophy.40
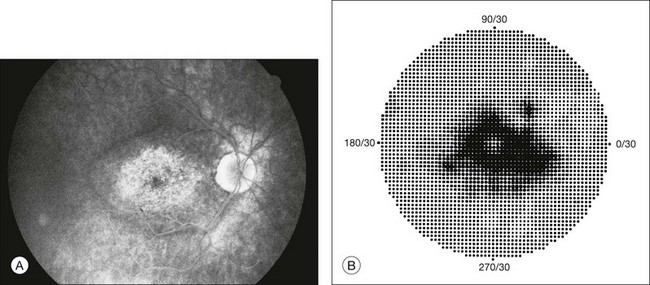
Fig. 12.10 (A) Fluorescein angiogram of the right eye of a 54-year-old man with a 5-year history of slowly progressive loss of central vision in each eye shows marked pigmentary disturbance of the macula. The left fundus showed similar changes. Electrophysiologic testing was diagnostic of cone dystrophy. (B) Octopus perimetry (program 31) demonstrates a dense central scotoma corresponding exactly to the region of macular pigmentary change. Note the relative sparing of foveal sensitivity.
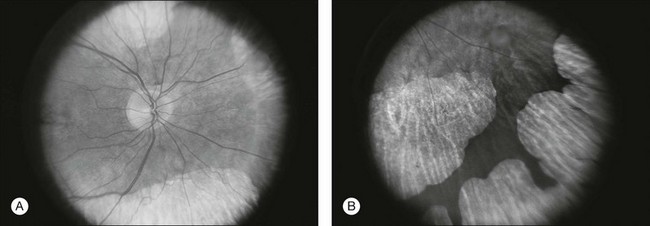
Fig. 12.11 Central (A) and peripheral (B) fundus appearance of a patient with gyrate atrophy of the retina. The visual field of this patient is shown in Fig. 12.12.
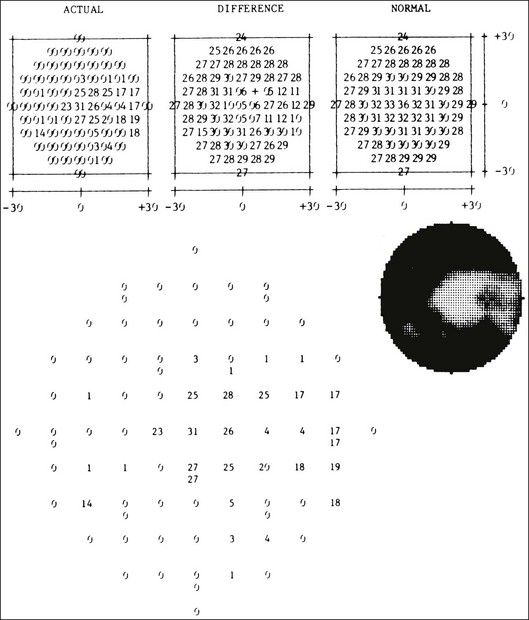
Fig. 12.12 Thirty-degree Octopus visual field (program 31) demonstrates marked peripheral constriction, with relative sparing in the centrocecal region. In addition, there are a few more peripheral islands of reduced sensitivity. (Reproduced with permission from Feldon SE. Computerized perimetry in selected disorders of the retina. In: Whalen WR, Spaeth GL, editors. Computerized visual fields: what they are and how to use them. Thorofare, NJ: Slack; 1985.)
Diabetic retinopathy
The diffuse retinal ischemia associated with diabetic retinopathy would seem to make visual field assessment an ideal method for follow-up of the disease. However, visual fields are not routinely used to evaluate this retinal disease, even though field defects may exist in the absence of observable retinopathy. Roth41 found central field defects in about 40% of eyes without visible retinopathy and in all diabetic patients with retinopathy. SWAP studies on patients with early diabetic maculopathy demonstrated a correlation between the decrease in mean thresholds and the increase in size of the foveal avascular zone and the perifoveal intercapillary area. These changes were not observed with standard white-on-white perimetry.42
In patients with clinically significant diabetic macular edema, Hudson and colleagues43 found all patients had abnormal SWAP 10–2 fields, but only one-third had abnormal standard perimetric fields. Further, the area of abnormal sensitivities was greater than that expected by clinical assessment. Using microperimetry, macular scotomata were also found in 74% of 19 patients with clinically significant macular edema.44 Furthermore, SWAP sensitivity in the central 10° of visual field of diabetic patients without macular edema was significantly reduced compared to standard white-on-white perimetry.45 A study of visual field defects in diabetic children without retinopathy by Mastropasqua and colleagues46 suggested that light sensitivity was impaired in the midperiphery of the visual field proportional to the degree of microalbuminuria.
Once diabetic retinopathy is present, visual field loss is readily documented. Gandolfo and colleagues47 studied 85 eyes with preproliferative diabetic retinopathy using the Goldmann perimeter. They were able to identify retinal hemorrhages and exudates of at least 3–4° in diameter as localized depressions in the visual field. Macular exudation and edema caused an irregular depression and flattening of static profiles of the central field. Wisznia and colleagues48 tried to correlate the degree of retinopathy with the amount of visual field loss. They hypothesized that a correlation might exist between retinal capillary perfusion and field loss. Bell and Feldon11 used Octopus static perimetry to show that visual sensitivity is quantitatively correlated with retinal perfusion in preproliferative diabetic retinopathy (Figs 12.13 and 12.14). Utilizing standard perimetry, Federman and Lloyd49 found the degree of perfusion to be more important in predicting field loss than the amount of proliferative retinopathy. This relationship between nonperfusion and regional field loss has been confirmed in other studies as well.47,50
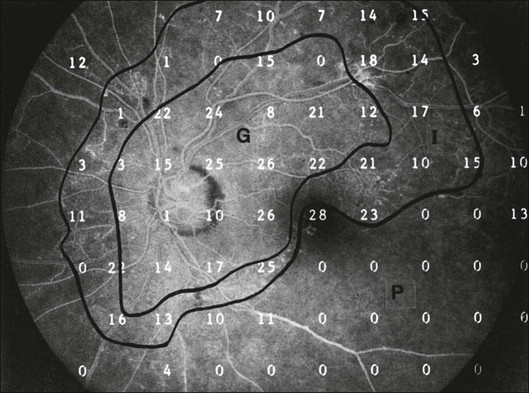
Fig. 12.13 Fluorescein angiogram of a patient with preproliferative diabetic retinopathy. Static sensitivities from Octopus perimetry are superimposed. Areas of good perfusion (G) have normal visual function. Areas of intermediate perfusion (I) have a moderate decrease of visual function, and nonperfused areas (P) have complete loss of visual function. (Reproduced with permission from Bell JA, Feldon SE. Retinal microangiopathy: correlation of Octopus perimetry with fluorescein angiography. Arch Ophthalmol 1984;102:1294–8.)
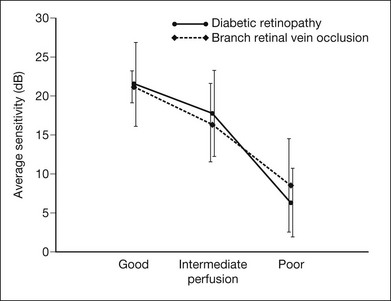
Fig. 12.14 Average sensitivity of the retina decreases with decreasing perfusion, both for diabetic retinopathy (dots) and for branch retinal vein occlusion (diamonds). (Reproduced with permission from Bell JA, Feldon SE. Retinal microangiopathy: correlation of Octopus perimetry with fluorescein angiography. Arch Ophthalmol 1984;102:1294–8.)
Lutze and Bresnick51 demonstrated a correlation between the degree of retinopathy in type I diabetic patients and visual field loss using SWAP. These findings were consistent with those of Zwas and coworkers and have been confirmed in more recent studies.9,52 In addition, automated perimetry was found to correlate better with severity of diabetic retinopathy than visual acuity.53A study by Agardh and colleagues demonstrated that SWAP sensitivity of visual field loss was correlated to ischemic changes in areas of macular edema, rather than to the severity of macular edema.54 SWAP analysis also demonstrated a greater decrease in mean sensitivity in menstruating diabetic women who were in the luteal phase, which was not seen in menstruating control patients.55 In a study by Stavrou and Wood,56 flicker perimetry appeared to be more sensitive than static perimetry in documenting early visual field changes in diabetic retinopathy, especially in a region of clinically significant diabetic macular edema.
In instances of vitreous hemorrhage and tractional retinal detachment due to high-risk proliferative diabetic retinopathy, visual acuity is often dramatically improved by vitrectomy; however, severely impaired visual fields due to extensive retinal ischemia may still preclude driving.57 Moreover, the treatment of diabetic retinopathy with either panretinal or focal photocoagulation may produce visual field defects, a fact that should be considered in overall patient management.58,59 In a study by Zingirian and colleauges,60 isolated photocoagulation of diabetic retinopathy results in small scotomata that are difficult to isolate by kinetic perimetry. Confluent lesions measuring one to two disc diameters cause correspondingly sized scotomata with sloping margins. Panretinal photocoagulation produces a marked concentric contraction of the visual field. Yoon et al.61 demonstrate preservation of retinal sensitivity in central visual field after panretinal photocoagulation in diabetic patients. At 1 week after treatment, there is significant depression, but recovery of up to 95% occurred within the ensuing 3 months. They attribute these encouraging findings to the use of burn sizes of 200 µm or less, as recommended by Hulbert and Vernon.62
Using automated perimetry, an initial loss of sensitivity seen after grid laser for diabetic macular edema was seen followed by improvement.63 Hudson and colleagues64 followed 24 diabetic patients with macular edema before grid laser treatment and up to 12 weeks following treatment with microperimetry. They found correlation between the edema index and visual function in some, but not all, patients. In another study of 30 patients, 8 eyes remained stable, 15 improved mean deviation after treatment, and laser scars corresponded to marked loss of function.65
Thus, retinal sensitivity tested by microperimetry appears to increase after micropulse diode laser, but to decrease after modified Early Treatment Diabetic Retinopathy Study focal laser in eyes with clinically significant diabetic macular edema. These perimetric changes are observed even though there is no difference in visual acuity or retinal thickness after either treatment.66 Recent studies highlight associations between morphological and functional alterations in diabetic macular edema using microperimetry. Microperimetry sensitivities are reduced in eyes with diabetic macular edema, and direct correlations have been made between decreased microperimetry sensitivity and increased cystoid edema, as evidenced by OCT and increased fundus autofluorescence.67–70
Other vascular diseases and nondiabetic macular edema
Many other vascular abnormalities of the choroid and retina have been evaluated with perimetry. For example, visual field defects corresponded to retinal vascular occlusions in sickle-cell disease.71 GVF perimetry showed a slight constriction of peripheral visual fields, thought to be visually insignificant, a decade after diode laser retinal ablative therapy for retinopathy of prematurity. This field construction was similar to peripheral field changes observed years after cryotherapy for retinopathy of prematurity.72 Mean deviation improvement recorded with automated static Octopus 500 perimetry was noted following carotid endarterectomy for clinically significant carotid stenosis.73
Microperimetry has been used to document functional improvement with resolution of absolute scotomata and improvement in vision to baseline in the setting of Purtscher’s retinopathy after treatment with oral steroids.74 Recovery of visual field loss was also seen using HVF and microperimetry after central and branch artery occlusions.75,76 In addition, greater decrease in scotopic macular sensitivity was shown with microperimetry fine matrix mapping of the macula in eyes with type 2 idiopathic macular telangiectasia. In similar eyes, Wong and colleagues77 demonstrated correlations between microperimetry sensitivities, OCT retinal morphology, and fundus autofluorescence.
After injection of intravitreal triamcinolone for treatment of branch retinal vein occlusion, improvement in macular sensitivity by microperimetry correlates with improvement in macular edema.78 According to the Branch Vein Occlusion Study guidelines, microperimetry is useful in assessing the benefit of laser treatment. Regression of the scotoma from the foveal avascular zone is observed in one-third of patients, but in one-half of treated patients an increase in total scotoma size occurs.79 In branch vein occlusions, Bell and Feldon11 show good correlation between residual capillary perfusion and threshold retinal sensitivity (Figs 12.14 and 12.15).
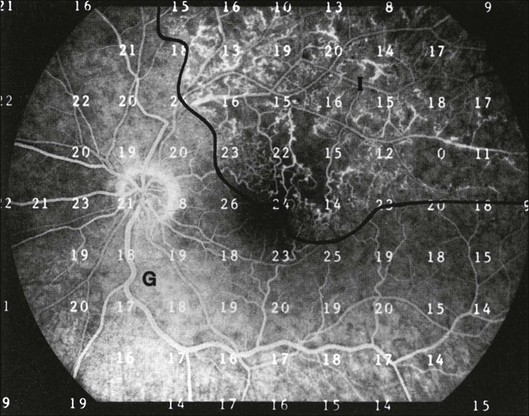
Fig. 12.15 Fluorescein angiogram from a patient with a superior branch retinal vein occlusion. Retinal sensitivities from Octopus perimetry are superimposed to show depressed function in the area of intermediate retinal perfusion (I). G, Area of good perfusion. (Reproduced with permission from Bell JA, Feldon SE. Retinal microangiopathy: correlation of Octopus perimetry with fluorescein angiography. Arch Ophthalmol 1984;102:1294–8.)
Visual fields may effectively document the effects of treatments for CRVO.80 For instance, microperimetry improves central fixation and retinal sensitivity following resolution of macular edema due to CRVO after treatment with intravitreal triamcinolone acetonide. Though microperimetry shows a benefit in macular function and field after radial optic neurotomy for CRVO, according to Tsujikawa and colleages,81 persistent peripheral field defects are documented by full-field perimetry corresponding to the incision site on the optic nerve head in similar eyes with CRVO that underwent the same treatment.82
Metamorphopsia on Amsler grid testing is characteristic of central serous retinopathy, but there is an accompanying mild central depression which varies in size from 2 to 5° (Fig. 12.16). The scotoma is usually substantially larger using SWAP relative to that detected with white-on-white perimetry.83 HVF and microperimetry central retinal sensitivity is reduced as subretinal fluid in central serous retinopathy increases, documented by OCT.84,85 Even after resolution of edema, the majority of patients have residual Amsler and perimetric defects86–88 (Fig. 12.17). Similar changes may result from other causes of fluid accumulation in the macula, such as diabetic retinopathy, Irvine–Gass syndrome, trauma (Berlin’s edema), and retinal vasculitis.3,89
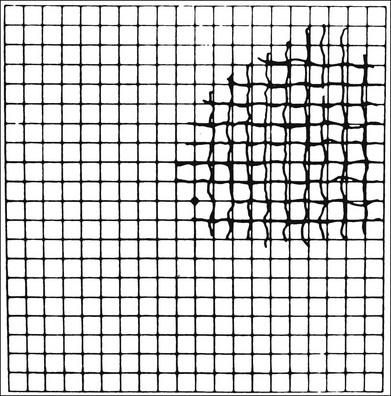
Fig. 12.16 An Amsler grid from a patient with long-standing metamorphopsia caused by central serous retinopathy. (Reproduced with permission from Natsikos VE, Hart JCD. Static perimetric and Amsler chart changes in patients with idiopathic central serous retinopathy. Acta Ophthalmol 1980;58:908–17.)
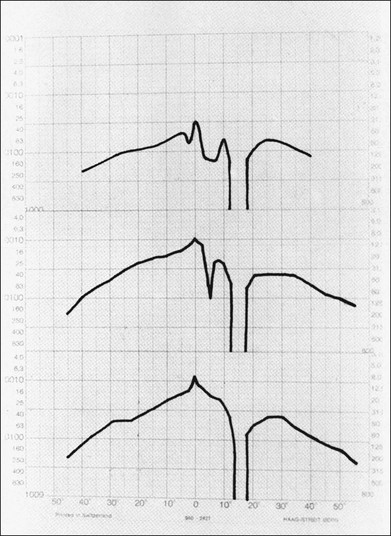
Fig. 12.17 A set of Tübinger static perimetric profiles showing pattern of recovery over 7 months in a patient with central serous retinopathy. (Reproduced with permission from Natsikos VE, Hart JCD. Static perimetric and Amsler chart changes in patients with idiopathic central serous retinopathy. Acta Ophthalmol 1980;58:908–17.)
Age-related macular degeneration and other maculopathies
Macular drusen are not usually associated with any reduction of retinal sensitivity using standard techniques. However, in a prospective study using SWAP, the mean sensitivity of patients with soft drusen and early AMD is significantly lower compared to patients without drusen.90,91 In this study the presence or absence of focal hyperpigmentation does not affect mean sensitivity. Microperimetry of macular drusen shows decreased overlying sensitivity in some, but not all, studies.92,93 Microperimetry is used to assess retinal sensitivities for a variety of other diseases affecting retinal function in the macula, including X-linked retinoschisis, S-cone syndrome, retinopathy of membranoproliferative glomerulonephritis type II, and atrophic maculopathy associated with spinocerebellar ataxia type 7.94–97
AMD of the pigmentary type usually causes irregularly shaped central scotomata with sloping margins and variable density. Field defects may be bilateral but often are asymmetric. Microperimetry retinal sensitivity correlates with alterations in fundus autofluorescence even in early stages of AMD.98 Perimetry is also used to evaluate macular retinal sensitivity after novel treatments for nonexudative AMD.99–101
Disciform subfoveal scarring from subretinal neovascularization, hemorrhage, and gliosis due to exudative AMD causes a dense central scotoma,3 as shown in Fig. 12.18. Detailed studies of subfoveal choroidal neovascularization in exudative AMD have been performed by microperimetry (Fig. 12.19). Of 179 eyes evaluated by Fujii and colleagues,102 135 (75%) had central fixation, 42% had stable fixation, and in 28% there was a dense central scotoma. The authors found that both central and stable fixation deteriorated over time. These fixational patterns were felt to be important in the selection of patients for macular translocation surgery.103 When microperimetry was utilized to evaluate the anatomic abnormalities associated with an absolute scotoma in subfoveal choroidal neovascularization, Tezel and associates found that the relative risk (RR) was highest in areas of chorioretinal scar (RR = 107.61) compared to areas of RPE atrophy (RR = 9.97), subretinal hemorrhage (RR = 2.88), and neovascular membrane (RR = 1.86).104 The majority of patients with stable fixation preferred an area of RPE hyperplasia. Using the HVF macular threshold protocol, improvement in macular visual field sensitivity occurred after treatment with intravitreal bevacizumab for exudative AMD, even in cases where visual acuity has not improved.105 Microperimetry has shown similar improvement in central retinal sensitivity after intravitreal ranibizumab treatment for exudative AMD.106,107 HVF 10–2 and microperimetry have also demonstrated improvements in macular visual fields after photodynamic therapy for exudative AMD and subfoveal polypoidal choroidal vasculopathy.108–110 Microperimetry has also been used to assess retinal sensitivity after autologous RPE choroid graft for exudative AMD.111
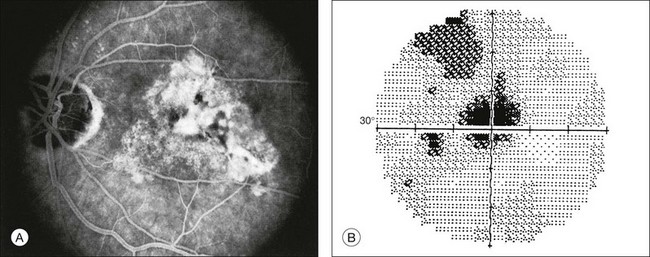
Fig. 12.18 (A) Fluorescein angiogram of a 60-year-old patient referred for evaluation of transient right homonymous hemianopia documents disciform macular degeneration of the left eye. (B) Dense central scotoma corresponding to the fundus lesion is shown by gray-scale printout from Humphrey perimeter (program 30–2).
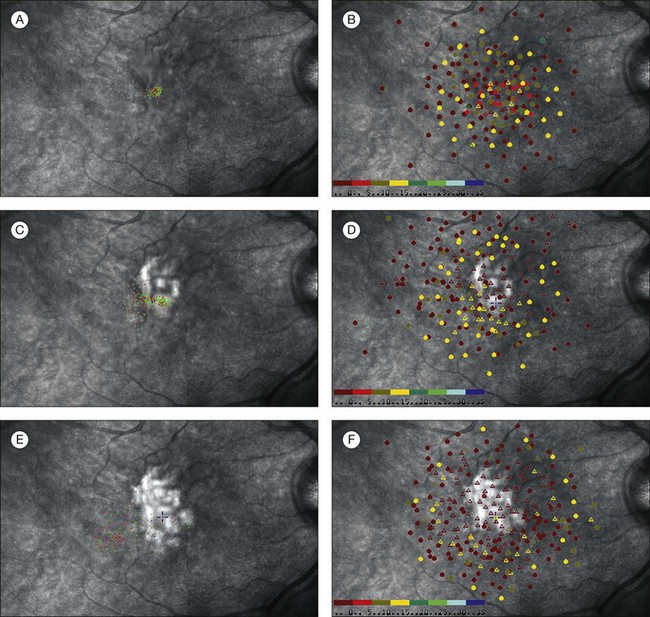
Fig. 12.19 A sequence of scanning laser ophthalmoscope (SLO) microperimetry shows the progressive functional deterioration in one eye with subfoveal choroidal neovascularization (CNV) secondary to age-related macular degeneration (AMD). The SLO testing demonstrated that eyes with subfoveal CNV secondary to AMD experienced a predictable and progressive loss of fixation stability, decreased central retinal sensitivity, and loss of central fixation location. A 65-year-old man presented with 20/150 vision and a 1-month history of decreased vision due to a predominantly classic subfoveal CNV secondary to AMD. (A) The SLO testing performed at presentation disclosed a pattern of predominantly central and stable fixation. (B) The balls indicate the areas where the patient could perceive the stimulus; the triangles indicate the areas where the patient could not perceive the stimulus. Each ball and triangle is color-coded to indicate the intensity of the stimulus. The SLO microperimetry also showed a mild decrease in central retinal sensitivity. The patient elected not to receive any treatment and had a follow-up visit 4 months after initial visual symptoms. (C) An SLO test was performed and demonstrated that the fixation pattern became poor central and relatively unstable. (D) The microperimetry also showed that retinal sensitivity was markedly affected with some central areas of dense scotoma. Best-corrected visual acuity at this visit was 20/200. Twelve months after onset of initial visual symptoms and no treatment, SLO microperimetry was performed and disclosed further functional deterioration. (E) The fixation became predominantly eccentric and unstable. (F) Retinal sensitivity testing demonstrated a large central area of dense central scotoma. (Reproduced with permission from Wong WT, Kam W, Cunnigham D, et al. Treatment of geographic atrophy by the topical administration of OT-551: results of a phase II clinical trial. Invest Ophthalmol Vis Sci 2010;51:6131–9.)
Patients with AMD or other macular pathology are routinely instructed to monitor their visual field in each eye with an Amsler grid regularly. Comparison of the original white lines on a black background Amsler grid proved to be superior at detecting metamorphopsia and central vision changes than the modified grid, which displays black lines on a white background.112 This is likely because of the increased contrast provided by the white lines on black background. However, due to ease in photocopying, the grid with black lines on a white background is most commonly used in the office setting and provided to patients for home use.
With the increasing prevalence of AMD and the ability to treat early neovascular AMD effectively, new perimetric tests that allow for patient self-monitoring of visual fields are being devised to detect early deficits. Nazemi and colleagues113 developed a three-dimensional automated computer-based threshold Amsler grid test that maps the visual field and records steep slopes in areas of nonexudative AMD and shallow slopes in regions corresponding to exudative AMD. As discussed at the beginning of this chapter, the psychophysical property of hyperacuity has been used to develop a device which detects progressive maculopathy and the early onset of exudative disease in AMD.114,115 The device, PreView PHP (Carl Zeiss Meditec, Dublin, CA), was evaluated as a home-based device in a multicenter trial and found to have a sensitivity and specificity of 85% to detect alterations in hyperacuity corresponding to exudative and intermediate nonexudative AMD.17 Other home-based perimetric devices for patients to monitor their vision routinely are expected in the near future. With the development of better algorithms to detect early disease progression, these home devices will hopefully ensure timely sight-saving treatment.
Macular holes and epiretinal membrane
Cysts may develop in the macula without producing appreciable scotomata. Macular holes, however, result in dense scotomata with steep margins (Figs 12.20 and 12.21). Microperimetry may be helpful in predicting the outcome of macular hole surgery. In a study by Amari and associates, visual outcome correlated with the maximum sensitivity adjacent to the hole.116 In another study, absolute scotomata disappeared completely in 18 of 28 eyes that achieved complete closure, became relative in five of six eyes with partial closure, and remained absolute in four eyes with atrophic closure.117 Ozedemir and colleagues118 suggested that MP-1 microperimetry may be more sensitive than visual acuity in measuring retinal function following closure of a macular hole with pars plana vitrectomy and internal limiting membrane (ILM) peeling. Increases in retinal sensitivity by microperimetry have also been correlated with the degree of fundus autofluorescence after macular hole closure.119 Perimetry has also been used to evaluate visual fields in eyes with epiretinal membrane (ERM). Binocular correspondence perimetry, a method akin to PHP, but which uses the principle of retinal correspondence and requires binocular testing, was used to quantify metamorphopsia in eyes with ERM.120 This study demonstrated focal areas of abnormal retinal correspondence in eyes with ERM compared to the normal fellow eye. Increased microperimetry retinal sensitivity without change in metamorphopsia as quantified by PHP following vitreoretinal surgery for ERM and macular hole was reported by Richter-Mueksch and colleagues.121
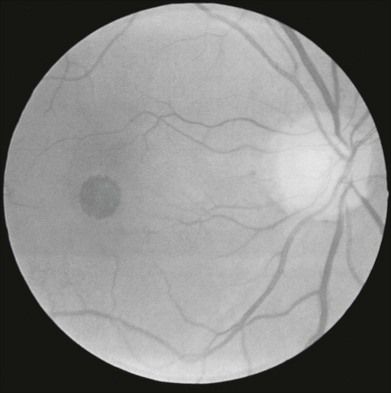
Fig. 12.20 Fundus photograph of an eye with a full-thickness macular hole. The visual field defect is shown in Fig. 12.21.
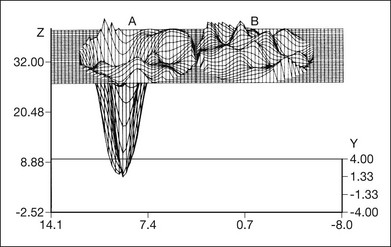
Fig. 12.21 Three-dimensional reconstruction of high-density macular grid (1° spacing) documenting steep absolute central scotoma of the left eye (A) and unaffected right eye (B). Retinal sensitivity is noted on the vertical axis and position is noted on the horizontal axis. (Copyright 1983, Wesley K. Herman, MD and Joseph M. DeFaller, Alcon Laboratories, Inc. Courtesy of Dr Herman.)
After uncomplicated repair of macular holes and ERM and using pars plana vitrectomy and ILM peeling, several investigators reported a high incidence of peripheral field defects infringing on the central visual field122–128 (Fig. 12.22). A majority of studies documented postoperative field defects only after patients complained of perceived field loss. Tsuiki and colleagues129 specifically compared pre- and postoperative GVF tests and found new peripheral field defects in 17 of 140 eyes postoperatively. In the majority of eyes, indocyanine green (ICG) was used to enhance visualization of the ILM during peeling. In vitro studies demonstrated the toxicity of ICG exposure to human retinal cell lines.130 The postsurgical visual defects are probably due to: (1) toxic effects of ICG; (2) alterations in the retina, such as damage to the peripapillary nerve fibers, during the pars plana vitrectomy; or (3) mechanical damage incurred with peeling of the ILM. Damage to the nerve fiber layer from intraocular gas tamponade in cases of macular hole repair must also be considered.121 Further studies that systematically and more accurately compare pre- and postoperative visual fields in eyes undergoing retinal surgery are needed to understand better the effects of the procedure and the adjuvant dyes or agents used to assist in the procedure on visual function.
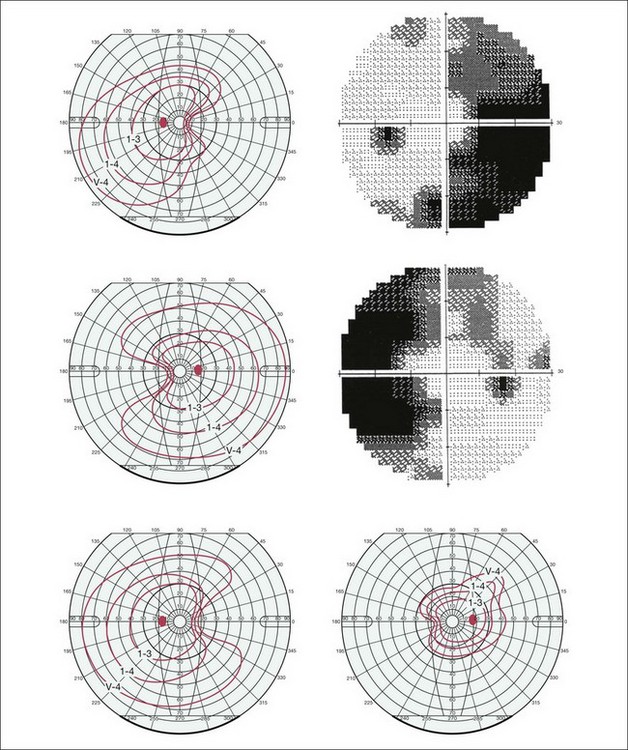
Fig. 12.22 Goldmann and Humphrey 30–2 visual field perimetry depicting peripheral wedge-like visual field loss encroaching on the central visual field in the eyes of 3 patients after pars plana vitrectomy, internal limiting membrane (ILM) peeling assisted by indocyanine green staining of the ILM for external limiting membrane. (Reproduced with permission from von Jagow B, Hoing A, Gandorfer A, et al. Functional outcome of indocyanine green-assisted macular surgery: 7-year follow-up. Retina 2009;29:1249–56.)
Toxic retinopathies
Toxic maculopathy is epitomized by chloroquine and hydroxychloroquine retinopathy. The most characteristic field defect caused by macular involvement is a ring-like central scotoma with a small island of slightly less visual loss in its center, commonly referred to as a “bull’s eye” (Fig. 12.23).131 GVF and HVF perimetry document visual field changes that can persist and worsen for decades even after stopping the medicines.132–134 Threshold Amsler grid testing, which uses variable light transmission through two cross-polarizing filters, and PHP hyperacuity may be useful in screening for early functional changes due to chloroquine and hydroxychloroquine.135,136
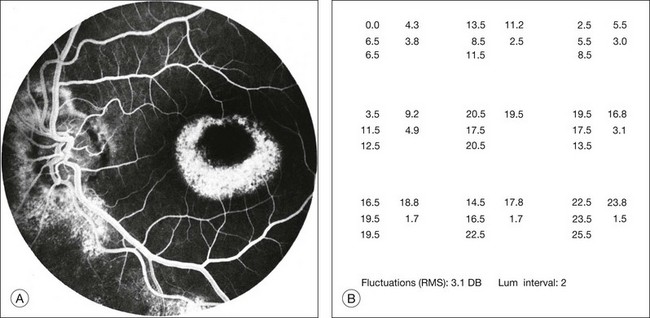
Fig. 12.23 (A) Fluorescein angiogram of a patient with perifoveal atrophy of the pigment epithelium corresponding to a bull’s eye maculopathy, typical of chloroquine retinopathy. (B) Central retinal sensitivities (Octopus program 11) at 3° spacing show depression superiorly and temporally, corresponding to areas of fluorescein angiogram with more marked depigmentation of the macula. Each cluster of five numbers represents a single test location. The three numbers at the left of each cluster are independently determined thresholds. The number at the upper right in each cluster is the mean of the three thresholds. The number at the lower right in each cluster is the standard deviation of the mean threshold value. (Reproduced with permission from Feldon SE. Computerized perimetry in selected disorders of the retina. In: Whalen WR, Spaeth GL, editors. Computerized visual fields: what they are and how to use them. Thorofare, NJ: Slack, 1985.)
To screen for chloroquine and hydroxychloroquine toxicity HVF, 10–2 white-on-white protocol is recommended. mERG is a helpful adjunct when early perimetric changes are seen, but may not be readily available in all retina practices. Recent screening guidelines advocate the addition of high-resolution imaging, such as spectral domain OCT and fundus autofluorescence, to correlate functional changes with structural alterations in the photoreceptor and RPE layers.137 In concert with other testing modalities, early perimetric changes that may be nonspecific for macular toxicity can be validated to allow for timely changes in medication with ultimate preservation of vision.
A number of medications are associated with retinal toxicity resulting in visual field loss. Thioridazine, a phenothiazine derivative, is a cause of pigmented maculopathy with associated central scotoma. Even in the absence of clinical tamoxifen retinopathy, SWAP fields show depressed mean deviations which correlated with duration of therapy.138 Peripheral visual field loss is detected in about 30% of patients using the antiepileptic drug vigabatrin.139–142 Sildenafil (Viagra) has been associated with nonarteritic ischemic optic neuropathy in individuals with pre-existing cardiovascular disease.143 Although visual field defects can occur in these cases, sildenafil has not been proven to cause retinal toxicity.144
Infectious and inflammatory retinopathies
Infectious and inflammatory retinopathies exhibit visual field defects corresponding to the area of pathology. Toxoplasmosis commonly produces focal chorioretinal destruction that causes corresponding dense, irregular, steep-margined, isolated scotomata.145 More disseminated types of inflammation, such as syphilitic choroiditis, produce a more diffuse depression of visual field function. In a patient with idiopathic retinal vasculitis, the inferior arcuate field defect corresponds to leakage from the superior temporal branch vein (Fig. 12.24). One unusual case report describes the use of microperimetry to determine the focal visual loss associated with nematode-induced unilateral subacute neuroretinitis.146
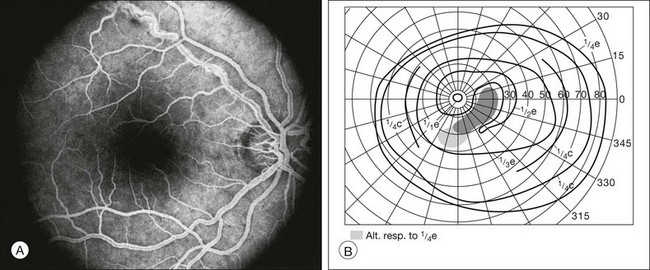
Fig. 12.24 (A) Fluorescein angiogram from a patient with idiopathic retinal vasculitis demonstrates leakage from the superotemporal retinal branch vein of the right eye. (B) Goldmann perimetry shows an inferior arcuate field defect that corresponds to the affected region of the retina.
Even in patients with no clinically evident infectious retinopathy, human immunodeficiency virus (HIV)-positive patients demonstrated significant localized as well as mean defects. These defects were more apparent in SWAP than in white-on-white automated perimetry.147 Correlation of HVF perimetry with mERG in similar eyes demonstrated involvement of the inner retina and sparing of the outer retina.148 Perimetric changes may also be related to HIV-related brain dysfunction.149 More marked changes in retinal sensitivity have been found in HIV-positive patients with low CD4 counts.149
In a small case series of patients with multiple evanescent white-dot syndrome, areas of decreased microperimetric sensitivity were shown to correlate with focal regions of inner and outer photoreceptor segment disruption documented by spectral domain OCT. Both the microperimetry and OCT findings changed location in keeping with the resolution and presence of new lesions during the disease course, and returned to normal by the end of clinical recovery.150,151 Similar correlation between function and structure was seen in eyes with acute posterior multifocal placoid pigment epitheliopathy.152 Microperimetry retinal sensitivity was also found to correlate with visual acuity in both serpiginous choroiditis and birdshot chorioretinopathy. Gordon and colleagues153 documented and analyzed HVF in patients with birdshot chorioretinopathy, in an attempt to determine characteristic patterns of field loss. The visual fields of this small series of patients exhibited diffuse loss, central sparing, and blind-spot enlargement. In addition, assessment of outcomes after valacyclovir treatment for acute zonal occult outer retinopathy using GVF demonstrated improved peripheral visual function.154
Retinal detachment
Typically, rhegmatogenous retinal detachments have sloping isopters on kinetic perimetry. Occasionally, this feature helps to differentiate a retinal detachment from a retinoschisis, which is characterized by dense defects with steep margins, usually located supranasally. However, long-standing retinal detachments may develop steep isopters. In the case of a shallow detachment, assessment of the visual field may be more accurate than ophthalmoscopy in identifying the border of detached retina.3
If the detachment is long-standing, recovery of visual field sensitivity is incomplete.155 Performing visual fields under conditions of both light and dark adaptation, Alexandridis and Janzarik156 report that cone function returns before rod function after successful surgical reattachment of the retina. Assessment of visual fields using SWAP is a sensitive measure of functional visual improvement in the macula following surgical repair for macula involving retinal detachment.157 One study suggests that central visual field defects occur following a high percentage of retinal detachment surgeries, especially if retinotomy for drainage of subretinal fluid (12 of 14, 86%) is performed. In this study, risk of visual field loss is more frequent if the retinotomy is relatively posterior (less than 5 disc diameters from fixation).158 Although visual field loss may recover initially after retinal detachment repair, GVF perimetry shows persistent decreased visual field following scleral buckle repair of retinal detachment despite continued improvement in visual acuity.159 In a recent report, microperimetry used in conjunction with spectral domain OCT and fundus autofluorescence demonstrates good correlation of visual function with retinal morphology after rhegmatogenous retinal detachment repair.160
Tumors
Retinoblastoma and choroidal melanoma are the most common malignant intraocular tumors in children and adults respectively. Long-term visual field defects that correspond to tumor size, location, and treatment modality have been documented in eyes with retinoblastoma.161 Anterior melanomas produce localized constriction of the visual field, whereas posterior melanomas produce dense scotomata with steep borders. Only a subtle field defect, if any, is associated with choroidal nevus. Thus fields may be important in distinguishing between these entities.
In Fig. 12.25 the Octopus visual field is superimposed on the fundus photograph of a patient with a small melanoma of the posterior pole. In this instance, loss of sensitivity is found only in the center of the mass. Use of a finer grid pattern would have facilitated a better correlation between the pathologic process and the degree of visual loss.
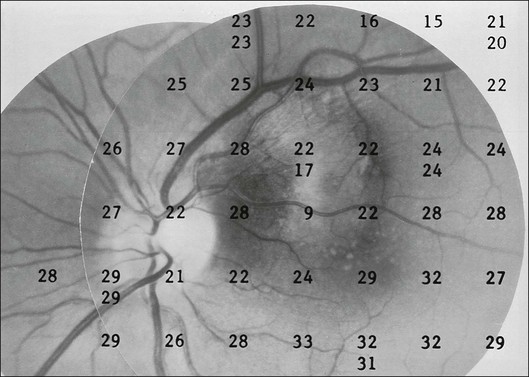
Fig. 12.25 A fundus photograph of a patient with a small malignant melanoma of the posterior pole has been superimposed on the visual field obtained by Octopus perimetry. Because of the relatively coarse (6°) grid pattern of the perimeter, sensitivity is markedly reduced only at the center of the lesion. (Reproduced with permission from Feldon SE. Computerized perimetry in selected disorders of the retina. In: Whalen WR, Spaeth GL, editors. Computerized visual fields: what they are and how to use them. Thorofare, NJ: Slack, 1985.)
Like melanomas, choroidal metastases also produce dense scotomata with steep borders. However, in a study by Rahhal and colleagues,162 HVF depression does not consistently correspond with tumor size or location. The visual fields shown in Fig. 12.26 are obtained from a patient with breast carcinoma whose fundus photograph is shown in Fig. 12.27. This patient demonstrates not only a dense inferonasal field defect corresponding to the choroidal metastasis, but also a bitemporal field defect. Subsequent CT scan demonstrated a suprasellar mass consistent with either a pituitary adenoma or metastasis (Fig. 12.28).
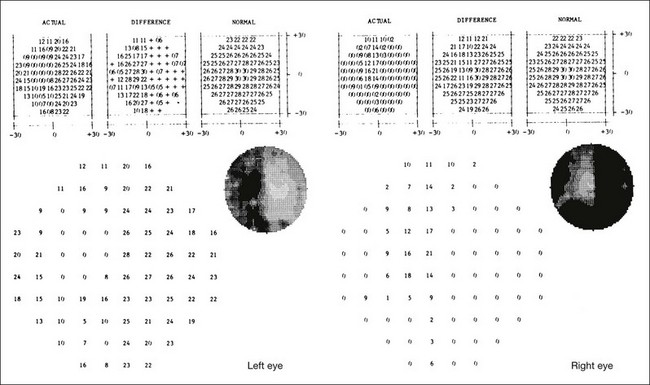
Fig. 12.26 Octopus perimetry (program 32) on the same patient as in Fig. 12.27. An inferonasal field defect in the right eye corresponds to the choroidal metastasis. There is also an unexpected dense bitemporal hemianopsia. A computed tomographic scan was requested for further evaluation. (Reproduced with permission from Feldon SE. Computerized perimetry in selected disorders of the retina. In: Whalen WR, Spaeth GL, editors. Computerized visual fields: what they are and how to use them. Thorofare, NJ: Slack, 1985.)
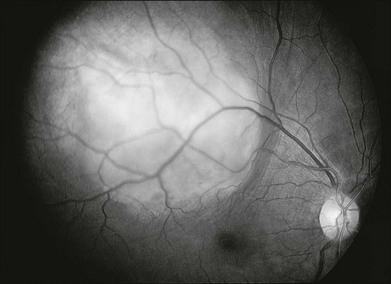
Fig. 12.27 A 50-year-old patient with known breast carcinoma is referred for evaluation of a mass in the posterior pole of the right eye. The visual fields are shown in Fig. 12.26. (Reproduced with permission from Feldon SE. Computerized perimetry in selected disorders of the retina. In: Whalen WR, Spaeth GL, editors. Computerized visual fields: what they are and how to use them. Thorofare, NJ: Slack, 1985.)
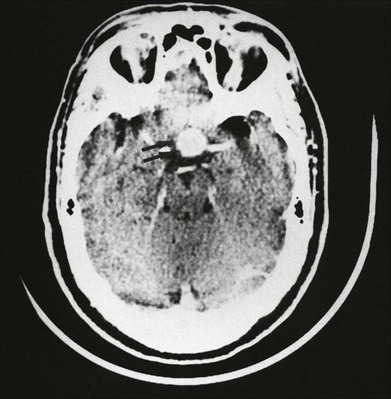
Fig. 12.28 Computed tomographic scan from the patient whose visual field and fundus photograph are shown in Figs 12.26 and 12.27. A suprasellar mass is shown that is consistent with either pituitary tumor or metastasis. (Reproduced with permission from Feldon SE. Computerized perimetry in selected disorders of the retina. In: Whalen WR, Spaeth GL, editors. Computerized visual fields: what they are and how to use them. Thorofare, NJ: Slack, 1985.)
Future of perimetry in retinal disease
Enoch, along with his collaborators Lawrence, Fitzgerald, and Campos,163–165 developed a clinical perimetric technique emphasizing the detection of a small luminous spot in a stationary (sustained) or flashing (transient) surround, based on analogies with the neural processing of the inner versus outer retinal layers. Graded or “sustained-like” electrical responses are obtained from the retinal receptor, bipolar, and horizontal cells. Transient or “spike” impulses are recorded from amacrine and ganglion cells. Enoch and colleagues investigated layer-by-layer perimetry in diabetic retinopathy, macular drusen, macular degeneration, and angioid streaks. However, layer-by-layer perimetry has not gained clinical acceptance. The relationship between retinal function and the testing parameters of this modality remains unconfirmed.
Color perimetry
Assessment of color vision may be helpful in screening for retinal disease and in separating neural from retinal causes of visual loss. Acquired diseases of the retina and choroid typically produce a tritan-like pattern of color confusion, and neural diseases typically produce a protan or deutan-like pattern of color confusion on Farnsworth–Munsell 100-hue discrimination testing.166 Thus color perimetry might be used to advantage in the identification and quantitative description of certain retinal and choroidal diseases. Although color contrast might be more sensitive in finding visual field defects, Hart and Burde167 demonstrate that colored test objects used in standard techniques of perimetry may be of little clinical value over small or low-contrast white test objects for detecting scotomata in a number of optic nerve and retinal disorders. Currently, there is no commercially available, standardized color perimeter.
High-resolution OCT and adaptive optics with microperimetry
The combined spectral domain OCT and SLO, introduced in 2006 (Spectral OCT/SLO; OPKO/OTI, Miami, FL, USA) is a significant achievement in advancing retinal imaging. The enhancement in accurate and real-time image capture with this system allows for integration with microperimetry. Thus, a functional spectral OCT/SLO allows assessment of retinal morphology and function at specific retinal loci. Landa and colleagues14 demonstrate the effectiveness of a three-dimensional spectral OCT/SLO topography and microperimetry in assessing functional and structural changes of the macula in a variety of retinal disease, including AMD and cystoid macular edema. Continued refinement of this functional imaging modality is expected to allow for better detection and monitoring of retinal disease.
Adaptive optics imaging of cones and other ultrastructural elements of the retina combined with ultrafine microperimetry shows promise in pinpointing finite areas of decreased retinal sensitivity. The ability to resolve cones and rods through adaptive optics allows for the reduction in the size of retinal image and, hence, the number of photoreceptors stimulated by adaptive optics microperimetry. Using microflashes in a patient with a genetic mutation for a cone photopigment and no clinical visual deficits, Williams and colleagues at the University of Rochester have detected retinal microscotomata representing early cone photoreceptor loss through adaptive optics microperimetry.168 In addition, Roorda and colleagues15 have demonstrated correlations between healthy and unhealthy RPE and microperimetry retinal sensitivity in patients with maculopathy and normal visual acuity. The precision of testing cellular function in the retina with this modality highlights its ability to detect early loss of function of a few photoreceptors. As this focal loss of retinal function is clinically compensated by the redundancy in the visual system, it is not noticed by patients or captured by standard perimetry and visual acuity tests. Detecting very early functional and structural pathology at the photoreceptor level before its clinical manifestation would allow for a better understanding of early pathophysiology and disease course. With this knowledge, refined screening algorithms and timely interventions for vision-threatening retinal disease might be developed.
References
1. Gass, JDM. Steroscopic atlas of macular diseases: diagnosis and treatment, 4th ed. St Louis: Mosby; 1997.
2. Traquair, HM. Introduction to clinical perimetry. London: Kimpton; 1927.
3. Harrington, DO. The visual fields: a textbook and atlas of clinical perimetry, 5th ed. St Louis: Mosby; 1981.
4. Wall, M, Sadun, AA. Threshold Amsler grid testing: cross-polarizing lenses enhance yield. Arch Ophthalmol. 1986;104:520–523.
5. Keltner, JL, Johnson, CA, Balestrery, FG. Suprathreshold static perimetry: initial clinical trials with the Fieldmaster automated perimeter. Arch Ophthalmol. 1979;97:260–272.
6. Wiggins, MN, Dersu, I, Understanding visual fields, part III: Which field should be performed? J Ophthalm Med Techno 2007;3 [Internet] www.JOMTonline.com.
7. Rohrschneider, K, Becker, M, Schumacher, N, et al. Normal values for fundus perimetry with the scanning laser ophthalmoscope. Am J Ophthalmol. 1998;126:52–58.
8. Mojon, DS, Zulauf, M. Normal values of short-wavelength automated perimetry. Ophthalmologica. 2003;217:260–264.
9. Zwas, F, Weiss, H, McKinnon, P. Spectral sensitivity measurements in early diabetic retinopathy. Ophthalm Res. 1980;12:87–96.
10. Wild, JM, Cubbidge, RP, Pacey, IE, et al. Statistical aspects of the normal visual field in short-wavelength automated perimetry. Invest Ophthalmol Vis Sci. 1998;39:54–63.
11. Bell, JA, Feldon, SE. Retinal microangiopathy: correlation of Octopus perimetry with fluorescein angiography. Arch Ophthalmol. 1984;102:1294–1298.
12. Rohrschneider, K, Bultmann, S, Springer, C. Use of fundus perimetry (microperimetry) to quantify macular sensitivity. Prog Retinal Eye Res. 2008;27:536–548.
13. Rohrschneider, K, Springer, C, Bultmann, S, et al. Microperimetry – comparison between micro perimeter 1 and scanning laser ophthalmoscope – fundus perimetry. Am J Ophthalmol. 2005;139:125–134.
14. Landa, G, Rosen, RB, Garcia, PM, et al. Combined three-dimensional spectral OCT/SLO topography and microperimetry: steps toward achieving functional spectral OCT/SLO. Ophthalm Res. 2010;43:92–98.
15. Roorda, A, Zhang, Y, Duncan, JL. High-resolution in vivo imaging of the RPE mosaic in eyes with retinal disease. Invest Ophthalmol Vis Sci. 2007;48:2297–2303.
16. Winther, C, Frisen, L. A compact rarebit test for macular diseases. Br J Ophthalmol. 2010;94:324–327.
17. Lowenstein, A, Ferencz, JR, Lang, Y, et al. Toward earlier detection of choroidal neovascularization secondary to age-related macular degeneration. Retina. 2010;30:1058–1064.
18. Norden, LC. Reliability in perimetry. J Am Optom Assoc. 1989;60:880–890.
19. Seiple, W, Clemens, CJ, Greenstein, VC, et al. Test–retest reliability of the multifocal electroretinogram and Humphrey visual fields in patients with retinitis pigmentosa. Doc Ophthalmol. 2004;109:255–272.
20. Weingessel, B, Sacu, S, Vecsei-Marlovits, PV, et al. Interexaminar and intraexaminer reliability of the microperimeter MP-1. Eye. 2009;23:1052–1058.
21. Sandberg, MA, Gaudio, AR, Berson, EL. Disease course of patients with pericentral retinitis pigmentosa. Am J Ophthalmol. 2005;140:100–106.
22. Sandberg, MA, Rosner, B, Weigel-DiFranco, C, et al. Disease course of patients with X-linked retinitis pigmentosa due to RPGR gene mutations. Invest Ophthalmol Vis Sci. 2007;48:1298–1304.
23. Schwartz, SB, Aleman, TS, Cideciyan, AV, et al. Disease expression in Usher syndrome caused by VLGR1 gene mutation (USH2C) and comparison with USH2A phenotype. Invest Ophthalmol Vis Sci. 2005;46:734–743.
24. Azari, AA, Aleman, TS, Cideciyan, AV, et al. Retinal disease expression in Bardet–Biedl syndrome-1 (BBS1) is a spectrum from maculopathy to retina-wide degeneration. Invest Ophthalmol Vis Sci. 2006;47:5004–5010.
25. Gerth, C, Wright, T, Heon, E, et al. Assessment of central retinal function in patients with advanced retinitis pigmentosa. Invest Ophthalmol Vis Sci. 2007;48:1312–1318.
26. Lodha, N, Westall, CA, Brent, M, et al. A modified protocol for the assessment of visual function in patients with retinitis pigmentosa. Adv Exp Med Biol. 2003;533:49–57.
27. Rotenstreich, Y, Harats, D, Shaish, A, et al. Treatment of a retinal dystrophy, fundus albipunctatus, with oral 9-cis-β-carotene. Br J Ophthalmol. 2010;94:616–621.
28. Iarossi, G, Falsini, B, Piccardi, M. Regional cone dysfunction in retinitis pigmentosa evaluated by flicker ERGs: relationship with perimetric sensitivity losses. Invest Ophthalmol Vis Sci. 2003;44:866–874.
29. Fischer, MD, Fleischhauer, JC, Gillies, MC, et al. A new method to monitor visual field defects caused by photoreceptor degeneration by quantitative optical coherence tomography. Invest Ophthalmol Vis Sci. 2008;49:3617–3621.
30. Rangaswamy, NV, Patel, HM, Locke, KG, et al. A comparison of visual field sensitivity to photoreceptor thickness in retinitis pigmentosa. Invest Ophthalmol Vis Sci. 2010;51:4213–4219.
31. Jacobson, SG, Roman, AJ, Aleman, TS, et al. Normal central retinal function and structure preserved in retinitis pigmentosa. Invest Ophthalmol Vis Sci. 2010;51:1079–1085.
32. Aizawa, S, Mitamura, Y, Hagiwara, A, et al. Changes of fundus autofluorescence, photoreceptor inner and outer segment junction line, and visual function in patients with retinitis pigmentosa. Clin Exp Ophthalmol. 2010;38:597–604.
33. Genead, MA, Fishman, GA, Stone, EM, et al. The natural history of Stargardt disease with specific sequence mutation in the ABCA4 gene. Invest Ophthalmol Vis Sci. 2009;50:5867–5871.
34. Wakabayashi, T, Sawa, M, Gomi, F, et al. Correlation of fundus autofluorescence with photoreceptor morphology and functional changes in eyes with retinitis pigmentosa. Acta Ophthalmol. 2010;88:e177–e183.
35. Popovic, P, Jarc-Vidmar, M, Hawlina, M. Abnormal fundus autofluorescence in relation to retinal function in patients with retinitis pigmentosa. Graefes Arch Clin Exp Ophthalmol. 2005;243:1018–1027.
36. Mori, F, Ishiko, S, Kitaya, N, et al. Scotoma and fixation patterns using scanning laser ophthalmoscope microperimetry in patients with macular dystrophy. Am J Ophthalmol. 2001;132:897–902.
37. Gaucher, D, Saleh, M, Sauer, A, et al. Spectral OCT analysis in Bietti crystalline dystrophy. Eur J Ophthalmol. 2010;20:612–614.
38. Gundogan, FC, Dinc, UA, Erdem, U, et al. Multifocal electroretinogram and central visual field testing in central areolar choroidal dystrophy. Eur J Ophthalmol. 2010;20:919–924.
39. Szlyk, JP, Paliga, J, Seiple, W, et al. Comprehensive functional vision assessment of patients with North Carolina macular dystrophy (MCDR1). Retina. 2005;25:489–497.
40. Renner, AB, Tillack, H, Kraus, H, et al. Morphology and functional characteristics in adult vitelliform macular dystrophy. Retina. 2004;24:929–939.
41. Roth, JA. Central visual field in diabetes. Br J Ophthalmol. 1969;53:16–25.
42. Remky, A, Arend, O, Hendricks, S. Short-wavelength automated perimetry and capillary density in early diabetic maculopathy. Inv Ophthalmol Vis Sci. 2000;41:274–281.
43. Hudson, C, Flanagan, JG, Turner, GS, et al. Short-wavelength sensitive visual field loss in patients with clinically significant diabetic macular oedema. Diabetologia. 1998;41:918–928.
44. Mori, F, Ishiko, S, Kitaya, N, et al. Use of scanning laser ophthalmoscope microperimetry in clinically significant macular edema in type 2 diabetes mellitus. Jpn J Ophthalmol. 2002;46:650–655.
45. Remky, A, Weber, A, Hendricks, S, et al. Short-wavelength automated perimetry in patients with diabetes mellitus without macular edema. Graefes Arch Clin Exp Ophthalmol. 2003;241:468–471.
46. Mastropasqua, L, Verrotti, A, Lobefalo, L, et al. Visual field defects in diabetic children without retinopathy: relation between visual function and microalbuminuria. Acta Ophthalmol Scand. 1995;73:125–128.
47. Gandolfo, E, Zingirian, M, Corrallo, G, et al. Diabetic retinopathy: perimetric findings. In: Greve EL, Heijl A, eds. Fifth International Visual Field Symposium. The Hague: Dr W Junk, 1983.
48. Wisznia, KI, Lieberman, TW, Leopold, IH. Visual fields in diabetic retinopathy. Br J Ophthalmol. 1971;55:183–188.
49. Federman, JL, Lloyd, J. Automated static perimetry to evaluate diabetic retinopathy. Trans Am Ophthalmol Soc. 1984;82:358–370.
50. Pahor, D. Automated static perimetry as a screening method for evaluation of retinal perfusion in diabetic retinopathy. Int Ophthalmol. 1997–1998;21:305–309.
51. Lutze, M, Bresnick, GH. Lens-corrected visual field sensitivity and diabetes. Invest Ophthalmol Vis Sci. 1994;35:649–655.
52. Remky, A, Weber, A, Hendricks, S, et al. Short-wavelength automated perimetry in patients with diabetes mellitus without macular edema. Graefes Arch Clin Exp Ophthalmol. 2003;241:468–471.
53. Bengtsson, B, Heijl, A, Agardh, E. Visual fields correlate better than visual acuity to severity of diabetic retinopathy. Diabetologia. 2005;48:2494–2500.
54. Agardh, E, Stjernquist, H, Heijl, A, et al. Visual acuity and perimetry as measures of visual function in diabetic macular oedema. Diabetologia. 2006;49:200–206.
55. Apaydin, KC, Akar, Y, Akar, ME, et al. Menstrual cycle dependent changes in blue-on-yellow visual field analysis of young diabetic women with severe non-proliferative diabetic retinopathy. Clin Exp Ophthalmol. 2004;32:265–269.
56. Stavrou, EP, Wood, JM. Central visual field changes using flicker perimetry in type 2 diabetes mellitus. Acta Ophthalmol Scand. 2005;83:574–580.
57. Barsam, A, Laidlaw, A. Visual fields in patients who have undergone vitrectomy for complications of diabetic retinopathy. A prospective study. BMC Ophthalmol. 2006;6:5.
58. Frank, RN. Visual fields and electroretinography following extensive photocoagulation. Arch Ophthalmol. 1975;93:591–598.
59. Wessing, A, Meyer-Schwickerath, G. Die Behandlung der Retinopathia diabetica mit Lichtkoagulation. Diabetologia. 1969;5:312–317.
60. Zingirian, M, Pisano, E, Gandolfo, E. Visual field damage after photocoagulative treatment for diabetic retinopathy. In: Greve EL, ed. Second International Visual Field Symposium. The Hague: Dr W Junk, 1977.
61. Yoon, YH, Lee, J, Kim, YJ. Preservation of retinal sensitivity in central visual field after panretinal photocoagulation in diabetics. Korean J Ophthalmol. 1996;10:48–54.
62. Hulbert, MFG, Vernon, SA. Passing the DVLC field regulations following bilateral panretinal photocoagulation in diabetics. Eye. 1992;6:456–460.
63. Hudson, C, Flanagan, JG, Turner, GS, et al. Correlation of a scanning laser derived oedema index and visual function following grid laser treatment for diabetic macular oedema. Br J Ophthalmol. 2003;87:455–461.
64. Hudson, C, Flanagan, JG, Turner, GS, et al. Correlation of a scanning laser derived oedema index and visual function following grid laser treatment for diabetic macular oedema. Br J Ophthalmol. 2003;87:455–461.
65. Rohrschneider, K, Bultmann, S, Gluck, R, et al. Scanning laser ophthalmoscope fundus perimetry before and after laser photocoagulation for clinically significant diabetic macular edema. Am J Ophthalmol. 2000;129:27–32.
66. Vujosevic, S, Bottega, E, Casciano, M, et al. Microperimetry and fundus autofluorescence in diabetic macular edema: subthreshold micropulse diode laser versus modified early treatment diabetic retinopathy study laser photocoagulation. Retina. 2010;30:908–916.
67. Deak, GG, Bolz, M, Ritter, M, et al. A systematic correlation between morphology and functional alterations in diabetic macular edema. Invest Ophthalmol Vis Sci. 2010;51:6710–6714.
68. Okada, K, Yamamoto, S, Mizunoya, S, et al. Correlation of retinal sensitivity measured with fundus-related microperimetry to visual acuity and retinal thickness in eyes with diabetic macular edema. Eye. 2006;20:805–809.
69. Vujosevic, S, Midena, E, Pilotto, E, et al. Diabetic macular edema: correlation between microperimetry and optical coherence tomography findings. Invest Ophthalmol Vis Sci. 2006;47:3044–3051.
70. Vujosevic, S, Casciano, M, Pilotto, E, et al. Diabetic macular edema: fundus autofluorescence and functional correlations. Invest Ophthalmol Vis Sci. 2011;52:442–448.
71. Cusick, M, Toma, HS, Hwang, TS, et al. Binasal visual field defects from simultaneous bilateral retinal infarctions in sickle cell disease. Am J Ophthalmol. 2007;143:893–896.
72. McLoone, E, O’Keefe, M, McLoone, S, et al. Effect of diode laser retinal ablative therapy for threshold retinopathy of prematurity on the visual field: results of goldmann perimetry at a mean age of 11 years. J Pediatr Ophthalmol Strabismus. 2007;44:170–173.
73. Kozobolis, VP, Detorakis, ET, Georgiadis, GS, et al. Perimetric and retrobulbar blood flow changes following carotid endarterectomy. Graefes Arch Clin Exp Ophthalmol. 2007;245:1639–1645.
74. Meyer, CH, Callizo, J, Schmidt, JC, et al. Functional and anatomical findings in acute Purtscher’s retinopathy. Ophthalmologica. 2006;220:343–346.
75. Imasawa, M, Tsumura, T, Kikuchi, T, et al. Humphrey perimetry as a predictor of visual improvement after photodynamic therapy. Jpn J Ophthalmol. 2009;53:281–282.
76. Chalam, KV, Agarwal, S, Gupta, SK, et al. Recovery of retinal sensitivity after transient branch retinal artery occlusion. Ophthalm Surg Lasers Imaging. 2007;38:328–329.
77. Wong, WT, Forooghian, F, Majumdar, Z, et al. Fundus autofluorescence in type 2 idiopathic macular telangiectasia: correlation with optical coherence tomography and microperimetry. Am J Ophthalmol. 2009;148:573–583.
78. Yamaike, N, Kita, M, Tsujikawa, A, et al. Perimetric sensitivity with the micro perimeter 1 and retinal thickness in patients with branch retinal vein occlusion. Am J Ophthalmol. 2007;143:342–344.
79. Barbazetto, IA, Schmidt-Erfurth, UM. Evaluation of functional defects in branch retinal vein occlusion before and after laser treatment with scanning laser perimetry. Ophthalmology. 2000;107:1089–1098.
80. Ageno, W, Cattaneo, R, Manfredi, E, et al. Parnaparin versus aspirin in the treatment of retinal vein occlusion. A randomized, double blind, controlled study. Thromb Res. 2010;125:137–141.
81. Tsujikawa, A, Hangai, M, Kikuchi, M, et al. Visual field defect after radial optic neurotomy for central retinal vein occlusion. Jpn J Ophthalmol. 2006;50:158–160.
82. Barak, A, Kesler, A, Gold, D, et al. Visual field defects after radial optic neurotomy for central retinal vein occlusion. Retina. 2006;26:549–554.
83. Afrashi, F, Erakgun, T, Uzunel, D, et al. Comparison of achromatic and blue-on-yellow perimetry in patients with resolved central serous chorioretinopathy. Ophthalmologica. 2005;219:202–205.
84. Sekine, A, Imasawa, M, Iijima, H. Retinal thickness and perimetric sensitivity in central serous chorioretinopathy. Jpn J Ophthalmol. 2010;54:578–583.
85. Dinc, UA, Yenerel, M, Tatlipinar, S, et al. Correlation of retinal sensitivity and retinal thickness in central serous chorioretinopathy. Ophthalmologica. 2010;224:2–9.
86. Baran, NV, Gurlu, VP, Esgin, H. Long-term macular function in eyes with central serous chorioretinopathy. Clin Experiment Ophthalmol. 2005;33:369–372.
87. Ozdemir, H, Karacorlu, SA, Senturk, F, et al. Assessment of macular function by microperimetry in unilateral resolved central serous chorioretinopathy. Eye. 2008;22:204–208.
88. Natsikos, VE, Hart, JCD. Static perimetric and Amsler chart changes in patients with idiopathic central serous retinopathy. Acta Ophthalmol. 1980;58:908–917.
89. Kiss, CG, Barisani-Asenbauer, T, Simader, C, et al. Central visual field impairment during and following cystoid macular oedema. Br J Ophthalmol. 2008;92:84–88.
90. Remky, A, Lichtenberg, K, Elsner, AE, et al. Short wavelength automated perimetry in age related maculopathy. Br J Ophthalmol. 2001;85:1432–1436.
91. Remky, A, Elsner, AE. Blue on yellow perimetry with scanning laser ophthalmoscopy in patients with age related macular disease. Br J Ophthalmol. 2005;89:464–469.
92. Takamine, Y, Shiraki, K, Moriwaki, M, et al. Retinal sensitivity measurement over drusen using scanning laser ophthalmoscope microperimetry. Graefes Arch Clin Exp Ophthalmol. 1998;236:285–290.
93. Iwama, D, Tsujikawa, A, Ojima, Y, et al. Relationship between retinal sensitivity and morphologic changes in eyes with confluent soft drusen. Clin Exp Ophthalmol. 2010;38:483–488.
94. Sohn, EH, Chen, FK, Rubin, GS, et al. Macular function assessed by microperimetry in patients with enhanced S-cone syndrome. Ophthalmology. 2010;117:1199–1206.
95. Biswas, S, Funnell, CL, Gray, J, et al. Nidek MP-1 microperimetry and Fourier domain optical coherence tomography (FD-OCT) in X linked retinoschisis. Br J Ophthalmol. 2010;94:949–950.
96. Shenoy, R, McCilvenny, S. Microperimetric evaluation of macula in retinopathy of membranoproliferative glomerulonephritis type II: a case report. Eur J Ophthalmol. 2006;16:634–636.
97. Ahn, JK, Seo, JM, Chung, H, et al. Anatomical and functional characteristics in atrophic maculopathy associated with spinocerebellar ataxia type 7. Am J Ophthalmol. 2005;139:923–925.
98. Midena, E, Vujosevic, S, Convento, E, et al. Microperimetry and fundus autofluorescence in patients with early age-related macular degeneration. Br J Ophthalmol. 2007;91:1499–1503.
99. Remky, A, Weber, A, Arend, O, et al. Topical dorzolamide increases pericentral visual function in age-related maculopathy: pilot study findings with short-wavelength automated perimetry. Acta Ophthalmol Scand. 2005;83:154–160.
100. Feher, J, Kovacs, B, Kovasc, I, et al. Improvement of visual functions and fundus alterations in early age-related macular degeneration treated with a combination of acetyl-L-carnithine, n-3 fatty acids, and coenzyme Q10. Ophthalmologica. 2005;219:154–166.
101. Wong, WT, Kam, W, Cunnigham, D, et al. Treatment of geographic atrophy by the topical administration of OT-551: results of a phase II clinical trial. Invest Ophthalmol Vis Sci. 2010;51:6131–6139.
102. Fujii, GY, de Juan, E, Jr., Humayun, MS, et al. Characteristics of visual loss by scanning laser ophthalmoscope microperimetry in eyes with subfoveal choroidal neovascularization secondary to age-related macular degeneration. Am J Ophthalmol. 2003;136:1067–1078.
103. Fujii, GY, de Juan, E, Hr., Sunness, J, et al. Patient selection for macular translocation surgery using the scanning laser ophthalmoscope. Ophthalmology. 2002;109:1737–1744.
104. Tezel, TH, Del Priore, LV, Flowers, BE, et al. Correlation between scanning laser ophthalmoscope microperimetry and anatomic abnormalities in patients with subfoveal neovascularization. Ophthalmol. 1996;103:1829–1836.
105. Lavinsky, F, Tolentino, MJ, Lavinsky, J. The macular threshold protocol of the Humphrey visual field analyzer: a superior functional outcome of intravitreal bevacizumab for the treatment of neovascular age-related macular degeneration. Arq Bras Oftalmol. 2010;73:111–115.
106. Squirrel, DM, Mawer, NP, Moody, CH, et al. Visual outcome after intravitreal ranibizumab for wet age-related macular degeneration: a comparison between best-corrected visual acuity and microperimetry. Retina. 2010;30:436–442.
107. Parravano, M, Oddone, F, Tedeschi, M, et al. Retinal functional changes measured by microperimetry in neovascular age-related macular degeneration treated with ranibizumab: 24-month results. Retina. 2010;30:1017–1024.
108. Schmidt-Erfurth, UM, Elsner, H, Terai, N, et al. Effects of verteporin therapy on central visual field function. Ophthalmology. 2004;111:931–939.
109. Yodoi, Y, Tsujikawa, A, Kameda, T, et al. Central retinal sensitivity measured with the micro perimeter 1 after photodynamic therapy for polypoidal choroidal vasculopathy. Am J Ophthalmol. 2007;143:984–994.
110. Imasawa, M, Tsumura, T, Kikuchi, T, et al. Humphrey perimetry as a predictor of visual improvement after photodynamic therapy. Jpn J Ophthalmol. 2009;53:281–282.
111. Chen, FK, Uppal, GS, MacLaren, RE, et al. Long-term visual and microperimetry outcomes following autologous retinal pigment epithelium choroid graft for neovascular age-related macular degeneration. Clin Exp Ophthalmol. 2009;37:275–285.
112. Augustin, AJ, Offermann, I, Lutz, J, et al. Comparison of the original Amsler grid with the modified Amsler grid: result for patients with age-related macular degeneration. Retina. 2005;25:443–445.
113. Nazemi, PP, Fink, W, Lim, JI, et al. Scotomas of age-related macular degeneration detected and characterized by means of a novel three-dimensional computer-automated visual field test. Retina. 2005;25:446–453.
114. Loewenstein, A, Malac, R, Goldstein, M, et al. Replacing the Amsler grid: a new method for monitoring patients with age-related macular degeneration. Ophthalmology. 2003;110:966–970.
115. Preferential Hyperacuity Perimetry Research Group. Preferential hyperacuity perimeter (PreView PHP) for detecting choroidals neoavascularization study. Ophthalmology. 2005;112:1758–1765.
116. Amari, F, Ohta, K, Kojima, H, et al. Predicting visual outcome after macular hole surgery using scanning laser ophthalmoscope microperimetry. Br J Ophthalmol. 2001;85:96–98.
117. Hikichi, T, Ishiko, S, Takamiya, A, et al. Scanning laser ophthalmoscope correlations with biomicroscopic findings and foveal function after macular hole closure. Arch Ophthalmol. 2000;118:193–197.
118. Ozdemir, H, Karacorlu, M, Senturk, F, et al. Retinal sensitivity and fixation changes 1 year after triamcinolone acetonide assisted internal limiting membrane peeling for macular hole surgery – a MP-1 microperimetric study. Acta Ophthalmol. 2010;88:e222–e227.
119. Chung, H, Shin, CJ, Kim, JG, et al. Correlation of microperimetry with fundus autofluorescence and spectral-domain optical coherence tomography in repaired macular holes. Am J Ophthalmol. 2011;151:128–136.
120. Kroyer, K, Jensen, OM, Larsen, M. Objective signs of photoreceptor displacement by binocular correspondence perimetry: a study of epiretinal membranes. Invest Ophthalmol Vis Sci. 2005;46:1017–1022.
121. Richter-Mueksch, S, Vecsei-Marlovits, PV, Sacu, SG, et al. Functional macular mapping in patients with vitreomacular pathologic features before and after surgery. Am J Ophthalmol. 2007;144:23–31.
122. Ezra, E, Arden, GB, Riordan-Eva, P, et al. Visual field loss following vitrectomy for stage 2 and 3 macular holes. Br J Ophthalmol. 1996;80:519–525.
123. Hutton, WL, Fuller, DG, Snyder, WB, et al. Visual field defects after macular hole surgery: a new finding. Ophthalmology. 1996;103:2152–2159.
124. Melberg, NS, Thomas, MA. Visual field loss after pars plana vitrectomy with air/fluid exchange. Am J Ophthalmol. 1995;120:386–388.
125. Hillenkamp, J, Saikia, P, Gora, F, et al. Macular function and morphology after peeling of idiopathic epiretinal membrane with and without the assistance of indocyanine green. Br J Ophthalmol. 2005;89:437–443.
126. von Jagow, B, Hoing, A, Gandorfer, A, et al. Functional outcome of indocyanine green-assisted macular surgery: 7-year follow-up. Retina. 2009;29:1249–1256.
127. Uemura, A, Kanda, S, Sakamoto, Y, et al. Visual field defects after uneventful vitrectomy for epiretinal membrane with indocyanine green-assisted internal limiting membrane peeling. Am J Ophthalmol. 2003;136:252–257.
128. Tari, SR, Vidne-Hay, O, Greenstein, VC, et al. Functional and structural measurement for the assessment of internal limiting membrane peeling in idiopathic macular pucker. Retina. 2007;27:567–572.
129. Tsuiki, E, Fujikawa, A, Miyamura, N, et al. Visual field defects after macular hole surgery with indocyanine green-assisted internal limiting membrane peeling. Am J Ophthalmol. 2007;143:704–705.
130. Balaiya, S, Brar, VS, Murthy, RK, et al. Comparative in vitro safety analysis of dyes for chromovitrectomy. Retina. 2011;31:1128–1136.
131. Hart, WM, Jr., Burde, RM, Johnston, GP, et al. Static perimetry in chloroquine retinopathy: perifoveal patterns of visual field depression. Arch Ophthalmol. 1984;102:377–380.
132. Michaelides, M, Stover, NB, Francis, PJ, et al. Retinal toxicity associated with hydroxychloroquine and chloroquine: risk factors, screening, and progression despite cessation of therapy. Arch Ophthalmol. 2011;129:30–39.
133. Salu, P, Uvijls, A, van den Brande, P, et al. Normalization of generalized retinal function and progression of maculopathy after cessation of therapy in a case of severe hydroxychloroquine retinopathy with 19 years follow-up. Doc Ophthalmol. 2010;120:251–264.
134. Xiaoyun, MA, Dongyi, HE, Linping, HE. Assessing chloroquine toxicity in RA patients using retinal nerve fibre layer thickness, multifocal electroretinography and visual field test. Br J Ophthalmol. 2010;94:1632–1636.
135. Almony, A, Garg, S, Peters, RK, et al. Threshold Amsler grid as a screening tool for asymptomatic patients on hydroxychloroquine therapy. Br J Ophthalmol. 2005;89:569–574.
136. Anderson, C, Pahk, P, Blaha, GR, et al. Preferential hyperacuity perimetry to detect hydroxychloroquine retinal toxicity. Retina. 2009;29:1188–1192.
137. Rodriguez-Padilla, JA, Hedges, TR, 3rd., Monson, B, et al. High-speed ultra-high-resolution optical coherence tomography findings in hydroxychloroquine retinopathy. Arch Ophthalmol. 2007;125:775–780.
138. Eisner, A, Austin, DF, Samples, JR. Short wavelength automated perimetry and tamoxifen use. Br J Ophthalmol. 2004;88:125–130.
139. Toggweiler, S, Wieser, HG. Concentric visual field restriction under vigabatrin therapy: extent depends on the duration of drug intake. Seizure. 2001;10:420–423.
140. Jensen, H, Sjo, O, Uldall, P, et al. Vigabatrin and retinal changes. Doc Ophthalmol. 2002;104:171–180.
141. Hosking, SL, Hilton, EJ. Neurotoxic effects of GABA-transaminase inhibitors in the treatment of epilepsy: ocular perfusion and visual performance. Ophthalm Physiol Optics. 2002;22:440–447.
142. Hilton, EJ, Cubbidge, RP, Hosking, SL, et al. Patients treated with vigabatrin exhibit central visual function loss. Epilepsia. 2002;43:1351–1359.
143. McGwin, G, Vaphiades, MS, Hall, TA, et al. Non-arteritic anterior ischaemic optic neuropathy and the treatment of erectile dysfunction. Br J Ophthalmol. 2006;90:154–157.
144. Jagle, H, Jagle, C, Serey, L, et al. Visual short-term effects of Viagra: double-blind study in healthy young subjects. Am J Ophthalmol. 2004;137:842–849.
145. Stanford, MR, Tomlin, EA, Comyn, O, et al. The visual field in toxoplasmic retinochoroiditis. Br J Ophthalmol. 2005;89:812–814.
146. Moraes, LR, Cialdini, AP, Avila, MP, et al. Identifying live nematodes in diffuse unilateral subacute neuroretinitis by using the scanning laser ophthalmoscope. Arch Ophthalmol. 2002;120:135–138.
147. Plummer, DJ, Sample, PA, Arevalo, JF, et al. Visual field loss in HIV-positive patients without infectious retinopathy. Am J Ophthalmol. 1996;122:542–549.
148. Falkenstein, I, Kozak, I, Kayikcioglu, O, et al. Assessment of retinal function in patients with HIV without infectious retinitis by multifocal electroretinogram and automated perimetry. Retina. 2006;26:928–934.
149. Plummer, DJ, Marcotte, TD, Sample, PA, et al. Neuropsychological impairment-associated visual field deficits in HIV infection. HNRC Group, HIV Neurobehavioral Research Center. Invest Ophthalmol Vis Sci. 1999;40:435–442.
150. Hangai, M, Fujimoto, M, Yoshimura, N. Features and function of multiple evanescent white dot syndrome. Arch Ophthalmol. 2009;127:1307–1313.
151. Forooghian, F, Stetson, PF, Gross, NE, et al. Quantitative assessment of photoreceptor recovery in atypical multiple evanescent white dot syndrome. Ophthalmic Surg Lasers Imaging. 2010;41(Suppl):S77–S80.
152. Souka, AA, Hillenkamp, J, Gora, F, et al. Correlation between optical coherence tomography and autofluorescence in acute posterior multifocal placoid pigment epitheliopathy. Graefes Arch Clin Exp Ophthalmol. 2006;244:1219–1223.
153. Gordon, LK, Goldhardt, R, Holland, GN, et al. Standardized visual field assessment for patients with birdshot chorioretinopathy. Ocul Immunol Inflamm. 2006;14:325–332.
154. Mahajan, VB, Stone, EM. Patients with an acute zonal occult outer retinopathy-like illness rapidly improve with valacyclovir treatment. Am J Ophthalmol. 2010;150:511–518.
155. Ozgur, S, Esgin, H. Macular function of successfully repaired macula-off retinal detachments. Retina. 2007;27:358–364.
156. Alexandridis, E, Janzarik, BI. Restitution of the retinal sensitivity after cured retinal detachment. In: Greve EL, ed. Second International Visual Field Symposium. The Hague: Dr W Junk, 1977.
157. Sakai, T, Iida, K, Tanaka, Y, et al. Evaluation of S-cone sensitivity in reattached macula following macula-off retinal detachment surgery. Jpn J Ophthalmol. 2005;49:301–305.
158. Bourke, RD, Dowler, JG, Milliken, AB, et al. Perimetric and angiographic effects of retinotomy. Aust NZ J Ophthalmol. 1996;24:245–249.
159. Sasoh, M, Ito, Y, Wakitani, Y, et al. 10-year follow-up of visual functions in patients who underwent scleral buckling. Retina. 2005;25:965–971.
160. Lai, WW, Leung, GY, Chan, CW, et al. Simultaneous spectral domain OCT and fundus autofluorescence imaging of the macula and microperimetric correspondence after successful repair of rhegmatogenous retinal detachment. Br J Ophthalmol. 2010;94:311–318.
161. Abramson, DH, Melson, MR, Servodidio, C. Visual fields in retinoblastoma survivors. Arch Ophthalmol. 2004;122:1324–1330.
162. Rahhal, FM, Abramson, DH, Servodidio, CA, et al. Automated perimetry in patients with choroidal metastases. Br J Ophthalmol. 1996;80:309–313.
163. Enoch, JM. Quantitative layer-by-layer perimetry: Proctor lecture. Invest Ophthalmol Vis Sci. 1978;17:208–257.
164. Enoch, JM, Fitzgerald, CR, Campos, EC. Quantitative layer-by-layer perimetry: an extended analysis. New York: Grune & Stratton; 1980.
165. Enoch, JM, Lawrence, B. A perimetric technique believed to test receptive field properties: sequential evaluation in glaucoma and other conditions. Am J Ophthalmol. 1975;80:734–758.
166. Dubois Poulsen, D. Acquired dyschromatopsias. Mod Probl Ophthalmol. 1972;11:84–93.
167. Hart, WM, Jr., Burde, RM. Color contrast perimetry: the spatial distribution of color defects in optic nerve and retinal diseases. Ophthalmology. 1985;92:768–776.
168. Makous, W, Carroll, J, Wolfing, JI, et al. Retinal microscotomas revealed with adaptive-optics microflashes. Invest Ophthalmol Vis Sci. 2006;47:4160–4167.
[/level-membership-for-opthalmology-category][not-level-membership-for-opthalmology-category]Chapter 12
Visual Fields in Retinal Disease
One need only review the classic atlas by Dr J. Donald M. Gass1 to recognize that most retinal diseases are readily diagnosed by careful ophthalmoscopic examination. However, for the ophthalmologist to understand and document visual consequences of retinal disease, qualitative and quantitative assessment is critical. In particular, visual field testing helps with the correlation of structural changes in the retina or elsewhere in the visual pathway with deficits in function. For example, AM is a 70-year-old woman diagnosed as having an old central retinal vein occlusion (CRVO) in the left eye and surface wrinkling retinopathy in both eyes. She also had been treated for elevated intraocular pressure. Fluorescein angiography of the left eye showed shunting vessels around the optic nerve head, thought to be consistent with the old vein occlusion. However, progressive bilateral visual field loss (Fig. 12.1) over 2 years suggested the need for further investigation. A computed tomography (CT) scan demonstrated a large subfrontal meningioma compressing both optic nerves (Fig. 12.2).
Fig. 12.1 (A, B) Fluorescein angiograms of a 70-year-old woman who has had progressive loss of vision in both eyes over 2 years. She has controlled ocular hypertension and surface-wrinkling retinopathy. The history of an old central retinal vein occlusion in the left eye is supported by the slightly dilated and tortuous retinal veins and the multiple shunting capillaries on the surface of the disc (B). (C) Progressive field loss, documented in both eyes over 3 years, is inconsistent with the ophthalmoscopic appearance. A computed tomographic scan was ordered, the results of which are shown in Fig. 12.2.
Fig. 12.2 Computed tomographic scan from the patient described in Fig. 12.1 demonstrates a large subfrontal meningioma with bilateral optic nerve compression. Surgical resection improved sensorium but not vision.
Principles of perimetry
The single most important concept in understanding the visual field is depicted by the island of Traquair, which is defined as a “hill of vision” surrounded by a “sea of blindness.”2 The shape of the normal visual field is oval. There is decreasing sensitivity with increasing eccentricity in the field, as the elevation corresponds to the sensitivity of the field, and the flat plane corresponds to location within the field (Fig. 12.3). From the point of fixation, the field extends 60° superiorly, 60° nasally, 70–75° inferiorly, and 100–110° temporally. The blind spot is represented by a hole in the “hill” about 15° temporal to the foveal “peak.”
Fig. 12.3 The “island,” or “hill of vision,” proposed by Traquair is surrounded by a “sea of blindness.” The height of the island represents increasing sensitivity. Using kinetic perimetry, the island is intercepted by a moving target of fixed size. Using static perimetry, a target’s visibility is increased in size or luminosity until it descends on to the island. The blind spot located 15° temporal to fixation is absolute, creating a small “well” in the sensitivity contour. (Courtesy of Steven Newman, MD.)
Perimetric tests have been developed that systematically measure the level of light sensitivity in the visual field. Two basic types exist: kinetic perimetry and static perimetry. In kinetic perimetry a target is moved from outside the potentially seeing area toward the seeing area until it is detected. In static perimetry a target located within a potentially seeing area can be increased in size or intensity until it is detected. With either method a region of vision can be defined in relation to a test stimulus of given size, hue, brightness, and uniform level of background illumination. For instance, under standardized conditions, the central visual field of about 30° can be mapped with a moving white target of 3 mm at a distance of 2 meters.3
Methods of visual field testing
Qualitative techniques
Although the tangent screen can be used quantitatively, it is most effective as a qualitative tool for estimation of visual loss in the central field. A 1-meter screen can be used to evaluate suspected midperipheral field loss, but a 2-meter screen is essential if the intent is to map central scotomata or the physiologic blind spot. The sensitivity of the test can be increased with the use of smaller test objects and by seeking subjective responses about the quality (e.g., blurry, dim, flickering, faded) of seen targets. Most important, conical visual field constriction of retinal origin can be readily distinguished from tubular fields of nonorganic visual loss by using large test objects at varying distances. With a doubling of the distance to the screen, there must be a doubling in size of the test object used. Although not routinely available or performed in a retinal specialist’s office, no other form of perimetric evaluation is as effective in discriminating real from fictitious visual field constriction (Fig. 12.4).
Fig. 12.4 A tangent screen field from a hysterical or malingering patient fails to show expansion of the visual field with doubling of both test object size and distance.
The Amsler grid is another extremely important qualitative tool for the evaluation of central vision. It is routinely used in regular self-monitoring of vision between eye exams by patients with macular degeneration or other progressive macular pathology to detect early signs of disease progression. In its original form, the patient fixates on the center dot of a white grid on a black background from a distance of 35.5 cm (14 inches) (Fig. 12.5). The patient describes the appearance of the grid pattern, especially in regard to missing areas (scotomata) and distortion (metamorphopsia). The sensitivity for detection of macular lesions can be increased with the use of red grids with or without the use of crossed polarizing lenses (Fig. 12.6) to decrease the light entering the patient’s eye.4
Fig. 12.5 The Amsler grid is viewed at 35.5 cm (14 inches), using the central dot for fixation. Regions of metamorphopsia (C), scotoma (B), and blur (A) are noted.
Fig. 12.6 The sensitivity of the Amsler grid test can be increased by using red lines on a black background rather than black or white lines on contrasting backgrounds. Further sensitivity may be achieved by using crossed-polarizing glasses that decrease the amount of light entering the eye. (Courtesy of Alfredo Sadun, MD.)
Quantitative techniques
Both Goldmann and Tübinger perimetry require examiners with a high degree of training. The Goldmann visual field (GVF) perimeter uses a kinetic strategy, although static perimetry is possible (Fig. 12.7). It is especially useful for monitoring peripheral visual field loss and large scotomata. It has limited capabilities for the evaluation of small central scotomata. The Tübinger perimeter uses a static strategy. It is a sensitive but time-consuming technique for identifying small or large relative field defects once the approximate region of the field loss has been determined. Laborious Tübinger profiles are usually made only across a single meridian of the visual field, limiting its screening capabilities (Fig. 12.8).
Fig. 12.7 The Goldmann visual field strategy developed by Armaly and Drance uses kinetic targets (arrows) to map the peripheral isopters and suprathreshold static targets (dots) to check central visual field function. (Reproduced with permission from Rock WJ, Drance SM, Morgan RW. Visual field screening in glaucoma. An evaluation of the Armaly technique for screening glaucomatous visual fields. Arch Ophthalmol 1973;89:287–90.)
Fig. 12.8 The Tübinger perimeter produces a static profile of visual sensitivity through any chosen meridian. (Reproduced with permission from Harrington DO. The visual fields: a textbook and atlas of clinical perimetry. St Louis: Mosby, 1981.)
Quantitative perimetry received a tremendous boost with the advent of automated, computerized methodology. Suprathreshold automated visual screeners, such as the Fieldmaster 101 and the Dicon units, did much to popularize visual field testing in the ophthalmic community. Pseudothreshold algorithms have been developed for these machines to enhance their quantitative capabilities.5 However, threshold perimeters, such as the Octopus and the Humphrey visual field (HVF) analyzer, have surpassed the capabilities of even the Tübinger instrument. Automated, quantitative threshold perimetry is ideal for the evaluation of retinal disease. Randomized sequences for stimulus presentation within the visual field enhance the possibility of detecting small or irregular field defects. Density of points can be varied to characterize fully field losses that are either focal or diffuse. Although the HVF has the ability to test 60° of visual field, this protocol is very time-consuming. The standard protocols used are the 30-2, 24-2, and 10-2, which measure the central 30, 24, and 10° respectively. The choice of field is based on the region of pathology in the visual field. The dash 2 (-2) refers to protocol 2, the analysis which points on either side of the vertical and horizontal meridians rather than just on the vertical and horizontal axis as performed in protocol 1. Thus, both the 24-2 and 30-2 protocols test points 3° from the horizontal and vertical axis as well as points at 6° intervals beyond this region in the central 24 or 30° respectively. A 10-2 protocol tests points 1° from the horizontal and vertical meridian as well as points at 2° beyond this region in the central 10° and thus is more sensitive for detecting subtle field losses in the macular region.6
Newer algorithms such as the Swedish interactive threshold algorithm (SITA) have been developed to increase efficiency and decrease variability in the standard Humphrey strategy. This strategy uses normative and real-time data from patients during the test to update estimates of thresholds and adjust presentation times of stimuli continually. Short-wavelength automated perimetry (SWAP) is a variant on the usual white light stimulus used in standard threshold testing. SWAP isolates the S-cone system (blue–yellow pathway), using a blue stimulus on a yellow background. Normal, age-corrected retinal sensitivity values have been established, increasing the utility in clinical testing.7,8 Care must be taken when using this technique to correct for chromatic filtering effects from the crystalline lenses.9 Longer test duration, increased variability, and learning effects make SWAP most applicable to conditions for which early detection has important therapeutic implications and requires careful supervision of the patient by the tester during visual field testing.10 In each case, the ability to map statically determined threshold retinal sensitivity directly on to the retina with automated quantitative threshold perimetry with a high degree of accuracy is important in the evaluation of retinal disease.11 This ability has further been refined by techniques such as microperimetry. However, as with any repeated test used to follow changes over time, consistency in choice of testing method is important in accurately characterizing and following the progression of retinal diseases.
Other methodologies of visual field testing in retinal disease
Microperimetry is a relatively new methodology for assessing visual fields that is especially helpful for evaluating and following macular disease. It is used to correlate anatomic pathology with function of the visual system by integrating fundus imaging and computerized threshold perimetry at specific locations in the fundus. One technique of microperimetry uses a scanning laser ophthalmoscope (SLO) (e.g., Rodenstock, Ottobrunn, Germany) to plot field defects within geographically defined regions of the retina. A modulated helium-neon laser beam of variable intensity (0–21 dB) at 633 nm projects stimuli on to the retina during ophthalmoscopy performed with an infrared diode laser at 780 nm.7,12 Another type of microperimetry is Micro Perimeter 1 (MP 1, Nidek Instruments, Padova, Italy) which uses an infrared fundus camera that provides a 45° view and performs perimetry using a liquid crystal display with a special software. The MP-1 allows for eye tracking and real-color fundus image acquisition. Images from other tests, such as fluorescein angiogram, can be overlaid on to the microperimetry, which is not possible in SLO microperimetry. Moreover, as SLO microperimetry is also restricted to red laser light, comparison with standard perimetry or MP-1 is difficult.12
Both the SLO and MP-1 microperimetry devices allow for kinetic and static perimetric testing of the macula and permit simultaneous observation of the retina during perimetric testing. Similar to conventional perimetry, stimulus sizes range from Goldmann size I to V and the central 15–20° of visual field can be tested in both devices, although the MP-1 allows for a slightly larger field for testing. Rohrschneider and colleagues determined that for patients with retinal disease both the SLO and MP-1 microperimetry devices provided comparable results, with the SLO devices providing better-resolution fundus images and the MP-1 providing better fixation analysis with more accurate real-time image alignment.13 As efforts to correlate better anatomic and functional changes in the retina have advanced, more refined devices are being developed that combine techniques of visualizing the ultrastructure of the retina, such as three-dimensional spectral optical coherence tomography (OCT) and adaptive optics, with corresponding perimetric functional assessment.14,15
Perimetric tests are being developed to screen for early changes in retinal diseases affecting the macula. Rarebit testing, or the matching of test targets to receptive field sizes, has been used in select studies in the last decade to assess central functional vision in a variety of retinal diseases. A compact rarebit screening test has been developed and tested in patients with age-related macular degeneration (AMD).16 Preferential hyperacuity perimetry (PHP) is another screening device for detecting early visual field changes in retinal disease. PHP uses the phenomenon of hyperacuity (Vernier acuity), the ability to discern differences in the spatial location of two or more stimuli, to test one’s ability to identify local distortion of a series of dotted vertical or horizontal signals. The responses are correlated to a normative database and scored to generate a probability of deviation from normal. PHP has been found to be more sensitive than Amsler grid testing for the early detection of neovascular AMD in patients with intermediate AMD. Home monitoring devices using PHP, which allow for convenient and timely early detection of progression of AMD, have been developed and are currently being evaluated for more widespread clinical use.17
Reliability and reproducibility of visual field tests
Anatomic, physiologic, and psychological factors unrelated to the pathology in question can significantly affect measurement of the visual field. The nose, brow, and lid may constrict the nasal and superior fields artifactually. Numerous variables pertaining to both the patient and the environment must be controlled during testing if meaningful results are to be obtained. Even so, considerable short-term variability must be taken into account. Box 12.1 outlines a list of factors that must be controlled for optimal determination of the visual field. Perimetric testing has a degree of subjectivity and therefore ultimate reliability and repeatability of the testing rely on the patient and the test giver.18 Patients with retinal disease may be more prone to variability in testing over time, which can influence the validity of test results. Seiple and colleagues19 demonstrated that for patients with retinitis pigmentosa (RP) the results of repeated HVF testing performed at different time points were two times more variable when compared to similar fields performed in normal controls despite controlling for disease progression. Microperimetry has the added advantage of real-time retinal surface monitoring with eye tracking to correct for eye movements during testing. Weingessel and colleagues have demonstrated good interexaminer and intraexaminer reliability of microperimetry using the MP-1 device in eyes with and without retinal disease.20
Perimetry in specific retinal diseases
Retinal dystrophies
Visual fields have traditionally been used to characterize and monitor the progression of visual field loss in RP. The earliest field defect in RP is reported to be a group of isolated scotomata 20–25° from fixation.3 Eventually these isolated defects coalesce into a “ring scotoma” affecting the midperiphery of the visual field. Usually the peripheral field loss progresses and leaves a small, central island of vision. Eventually, complete visual loss may occur (Fig. 12.9).
Fig. 12.9 Classic development of a ring scotoma with focal sparing of a peripheral temporal island seen in retinitis pigmentosa and cone–rod dystrophies. (A) Progressive depression of peripheral visual field in a patient with cone–rod degeneration at presentation. (B) Same patient after 1 year. (C) Same patient during fourth year of follow-up. (Reproduced with permission from Krauss HR, Heckenlively JR. Visual field changes in cone–rod degenerations. Arch Ophthalmol 1982;100:1784–90.)
Characterization and comparison of specific patterns of visual field loss in genotypically and phenotypically different forms of RP such as X-linked, dominant, pericentral, and Usher syndrome using GVF perimetry have been attempted to differentiate better subgroups of RP based on visual prognosis and genotype.21–23 Association of degree of visual field loss with different genotypes in syndromic associations of RP, including Bardet–Biedl syndrome 1, has also been studied.24 In addition, HVF measurements have been correlated with contrast sensitivity in RP and were found to be a sensitive predictor for central visual function in advanced RP.25,26 Visual field perimetry has been used to test outcomes of treatments for varieties of RP, including fundus albipunctatus.27
Visual fields have also been used in correlating photoreceptor anatomy and visual function in RP. Decreased retinal sensitivity on electroretinogram has been linked to visual field loss demonstrated by perimetry in RP.28 Recently, changes in GVF, HVF, and microperimetry have been correlated with anatomical changes at the cellular level using OCT and autofluorescence to identify abnormal photoreceptor morphology and damage to retinal pigment epithelial (RPE) cells.29–35
Perimetric changes occur in a variety of retinal dystrophies. Cone dystrophy produces progressive symmetric to slightly asymmetric central visual loss. This is associated with a macular pigmentary disturbance. The visual fields demonstrate central scotomata with relative sparing of the fovea (Fig. 12.10). A central or paracentral scotoma can also be seen in Stargardt disease. However, microperimetry identifies two types of scotoma in patients with Stargardt disease. In one type there is a dense ring scotoma associated with stable fixation. In the second type there is a dense central scotoma associated with fixation shift. The second type is also correlated with poorer acuity.36 In contrast, there is constriction of the visual field corresponding to the progressive peripheral retinal degeneration with scalloped margins in gyrate atrophy of the retina and choroid, a rare tapetoretinal degeneration caused by an inborn error of ornithine aminotransferase activity (Figs 12.11 and 12.12). Constricted GVF tests are also seen in Bietti crystalline dystrophy.37 Correlations between HVF sensitivity and multifocal electroretinogram (mERG) have been documented for eyes with central areolar choroidal dystrophy and North Carolina macular dystrophy.38,39 Functional changes as evidenced by perimetry and mERG have also been correlated with morphological changes documented by fundus autofluorescence in adult vitelliform macular dystrophy.40
Fig. 12.10 (A) Fluorescein angiogram of the right eye of a 54-year-old man with a 5-year history of slowly progressive loss of central vision in each eye shows marked pigmentary disturbance of the macula. The left fundus showed similar changes. Electrophysiologic testing was diagnostic of cone dystrophy. (B) Octopus perimetry (program 31) demonstrates a dense central scotoma corresponding exactly to the region of macular pigmentary change. Note the relative sparing of foveal sensitivity.
Fig. 12.11 Central (A) and peripheral (B) fundus appearance of a patient with gyrate atrophy of the retina. The visual field of this patient is shown in Fig. 12.12.
Fig. 12.12 Thirty-degree Octopus visual field (program 31) demonstrates marked peripheral constriction, with relative sparing in the centrocecal region. In addition, there are a few more peripheral islands of reduced sensitivity. (Reproduced with permission from Feldon SE. Computerized perimetry in selected disorders of the retina. In: Whalen WR, Spaeth GL, editors. Computerized visual fields: what they are and how to use them. Thorofare, NJ: Slack; 1985.)
Diabetic retinopathy
The diffuse retinal ischemia associated with diabetic retinopathy would seem to make visual field assessment an ideal method for follow-up of the disease. However, visual fields are not routinely used to evaluate this retinal disease, even though field defects may exist in the absence of observable retinopathy. Roth41 found central field defects in about 40% of eyes without visible retinopathy and in all diabetic patients with retinopathy. SWAP studies on patients with early diabetic maculopathy demonstrated a correlation between the decrease in mean thresholds and the increase in size of the foveal avascular zone and the perifoveal intercapillary area. These changes were not observed with standard white-on-white perimetry.42
In patients with clinically significant diabetic macular edema, Hudson and colleagues43 found all patients had abnormal SWAP 10–2 fields, but only one-third had abnormal standard perimetric fields. Further, the area of abnormal sensitivities was greater than that expected by clinical assessment. Using microperimetry, macular scotomata were also found in 74% of 19 patients with clinically significant macular edema.44 Furthermore, SWAP sensitivity in the central 10° of visual field of diabetic patients without macular edema was significantly reduced compared to standard white-on-white perimetry.45 A study of visual field defects in diabetic children without retinopathy by Mastropasqua and colleagues46 suggested that light sensitivity was impaired in the midperiphery of the visual field proportional to the degree of microalbuminuria.
Once diabetic retinopathy is present, visual field loss is readily documented. Gandolfo and colleagues47 studied 85 eyes with preproliferative diabetic retinopathy using the Goldmann perimeter. They were able to identify retinal hemorrhages and exudates of at least 3–4° in diameter as localized depressions in the visual field. Macular exudation and edema caused an irregular depression and flattening of static profiles of the central field. Wisznia and colleagues48 tried to correlate the degree of retinopathy with the amount of visual field loss. They hypothesized that a correlation might exist between retinal capillary perfusion and field loss. Bell and Feldon11 used Octopus static perimetry to show that visual sensitivity is quantitatively correlated with retinal perfusion in preproliferative diabetic retinopathy (Figs 12.13 and 12.14). Utilizing standard perimetry, Federman and Lloyd49 found the degree of perfusion to be more important in predicting field loss than the amount of proliferative retinopathy. This relationship between nonperfusion and regional field loss has been confirmed in other studies as well.47,50
Fig. 12.13 Fluorescein angiogram of a patient with preproliferative diabetic retinopathy. Static sensitivities from Octopus perimetry are superimposed. Areas of good perfusion (G) have normal visual function. Areas of intermediate perfusion (I) have a moderate decrease of visual function, and nonperfused areas (P) have complete loss of visual function. (Reproduced with permission from Bell JA, Feldon SE. Retinal microangiopathy: correlation of Octopus perimetry with fluorescein angiography. Arch Ophthalmol 1984;102:1294–8.)
Fig. 12.14 Average sensitivity of the retina decreases with decreasing perfusion, both for diabetic retinopathy (dots) and for branch retinal vein occlusion (diamonds). (Reproduced with permission from Bell JA, Feldon SE. Retinal microangiopathy: correlation of Octopus perimetry with fluorescein angiography. Arch Ophthalmol 1984;102:1294–8.)
Lutze and Bresnick51 demonstrated a correlation between the degree of retinopathy in type I diabetic patients and visual field loss using SWAP. These findings were consistent with those of Zwas and coworkers and have been confirmed in more recent studies.9,52 In addition, automated perimetry was found to correlate better with severity of diabetic retinopathy than visual acuity.53A study by Agardh and colleagues demonstrated that SWAP sensitivity of visual field loss was correlated to ischemic changes in areas of macular edema, rather than to the severity of macular edema.54 SWAP analysis also demonstrated a greater decrease in mean sensitivity in menstruating diabetic women who were in the luteal phase, which was not seen in menstruating control patients.55 In a study by Stavrou and Wood,56 flicker perimetry appeared to be more sensitive than static perimetry in documenting early visual field changes in diabetic retinopathy, especially in a region of clinically significant diabetic macular edema.
In instances of vitreous hemorrhage and tractional retinal detachment due to high-risk proliferative diabetic retinopathy, visual acuity is often dramatically improved by vitrectomy; however, severely impaired visual fields due to extensive retinal ischemia may still preclude driving.57 Moreover, the treatment of diabetic retinopathy with either panretinal or focal photocoagulation may produce visual field defects, a fact that should be considered in overall patient management.58,59 In a study by Zingirian and colleauges,60 isolated photocoagulation of diabetic retinopathy results in small scotomata that are difficult to isolate by kinetic perimetry. Confluent lesions measuring one to two disc diameters cause correspondingly sized scotomata with sloping margins. Panretinal photocoagulation produces a marked concentric contraction of the visual field. Yoon et al.61 demonstrate preservation of retinal sensitivity in central visual field after panretinal photocoagulation in diabetic patients. At 1 week after treatment, there is significant depression, but recovery of up to 95% occurred within the ensuing 3 months. They attribute these encouraging findings to the use of burn sizes of 200 µm or less, as recommended by Hulbert and Vernon.62
Using automated perimetry, an initial loss of sensitivity seen after grid laser for diabetic macular edema was seen followed by improvement.63 Hudson and colleagues64 followed 24 diabetic patients with macular edema before grid laser treatment and up to 12 weeks following treatment with microperimetry. They found correlation between the edema index and visual function in some, but not all, patients. In another study of 30 patients, 8 eyes remained stable, 15 improved mean deviation after treatment, and laser scars corresponded to marked loss of function.65
Thus, retinal sensitivity tested by microperimetry appears to increase after micropulse diode laser, but to decrease after modified Early Treatment Diabetic Retinopathy Study focal laser in eyes with clinically significant diabetic macular edema. These perimetric changes are observed even though there is no difference in visual acuity or retinal thickness after either treatment.66
[/not-level-membership-for-opthalmology-category]
