Electrogenesis of the Electroretinogram
Introduction
This chapter will review current knowledge of the cellular origins and mechanisms of generation of the various ERG component waves, progressing from distal retina to proximal retina. As will be described, the ERG is generated by radial currents arising either directly from retinal neurons, or as a result of the effect on retinal glia of changes in extracellular potassium concentration ([K+]o) brought about by retinal neuronal activity. Our understanding of the electrogenesis of the ERG was initially based on studies in a variety of cold-blooded vertebrate and as well as some mammalian species, described in more detail in previous reviews.1,2 Studies in a nonhuman primate model (macaque monkey) whose retina and ERG are very similar to that of humans (Fig. 7.1),3 and particularly those over the past two decades, have improved our understanding of the electrogenesis of the ERG in humans. This work will be highlighted wherever possible in this chapter. Clinical applications of the ERG will be described in the following chapter (Chapter 8, Clinical electrophysiology). Another recent review has examined the electrogenesis of a common animal model for retinal disease, the mouse.3
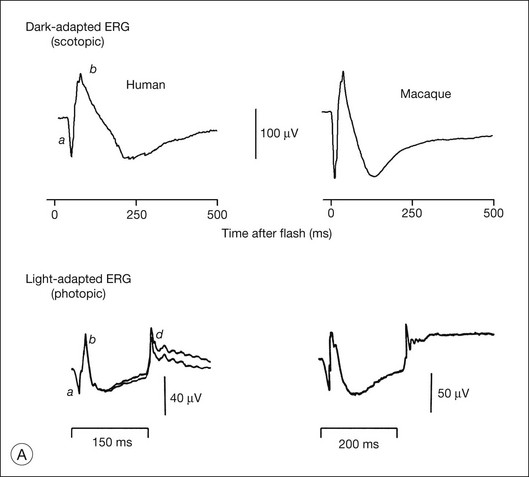
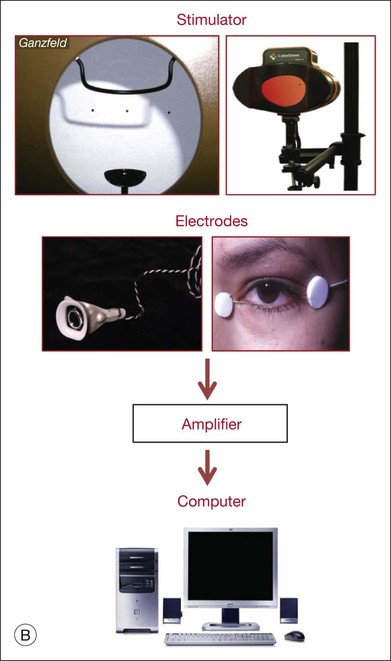
Fig. 7.1 Dark- and light-adapted full-field flash electroretinograms (ERGs) of human subjects and macaque monkeys. (A) Top: Dark-adapted (scotopic) ERGs in response to brief high-energy flashes from darkness occurring at time zero for a normal human subject (left) and an anesthetized macaque monkey (right). The stimulus energy was ~400 sc td/s. Bottom: Light-adapted (photopic) flash ERGs in response to longer-duration flashes on a rod-saturating background for a normal human subject (left) and a macaque monkey (right). For the human subject the stimulus was a 150-ms white full-field flash of 4.0 log ph td presented on a steady background of 3.3 log sc td. For the macaque, the same stimulus was used, but the flashes were 200 ms in duration. (Adapted from Sieving PA, Murayama K, Naarendorp F. Push–pull model of the primate photopic electroretinogram: a role for hyperpolarizing neurons in shaping the b-wave. Vis Neurosci 1994;11:519–32.) (B) ERG recording setup: recordings are made using a traditional ganzfeld bowl (left) or more modern light-emitting diode-based full-field stimulator. Burian-Allen and DTL fiber electrodes4 are illustrated. ERG recordings are amplified and sent to a computer for averaging, display, and analysis.
Generation of extracellular potentials: general concepts
An important factor affecting a given cell’s contribution to the ERG is its orientation in the retina. Radially oriented neurons in the retina (photoreceptors and bipolar cells) and glial cells (Müller cells and retinal pigment epithelial (RPE) cells) make larger contributions to the ERG than cells that are oriented more irregularly or laterally (e.g., horizontal and amacrine cells) (Fig. 7.2). The currents around cells that underlie the ERG enter the ECS at one retinal depth (the current source), and return into the cell at another depth (the current sink), creating a current dipole. Although most of the extracellular current flowing from source to sink traverses the ECS within the retina, some travels extraretinally – through the vitreous humor, extraocular tissues, sclera, choroid, the high resistance of the RPE (R-membrane), and back into the neural retina.
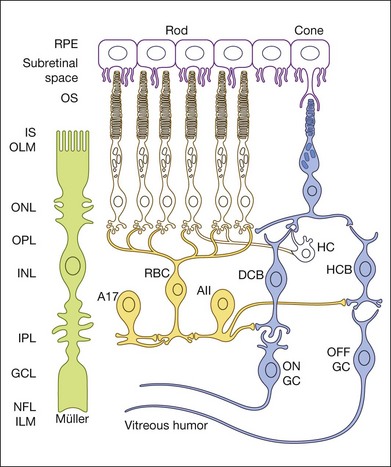
Fig. 7.2 Schematic of rod and cone pathways of the mammalian retina. The blue-filled cells indicate the cone pathways; the yellow-filled cells indicate the primary rod pathway. RPE, retinal pigment epithelium; OS, outer segment; IS, inner segment; HC, horizontal cell; RBC, rod bipolar cell; DCB, depolarizing (ON) cone bipolar cell; HCB, hyperpolarizing (OFF) bipolar cell; A, amacrine cell; GC, ganglion cell; OLM, outer limiting membrane; ONL, outer nuclear layer; OPL, outer plexiform layer; INL, inner nuclear layer; IPL, inner plexiform layer; GCL, ganglion cell layer; NFL, nerve fiber layer; ILM, inner limiting membrane. Scale bar = 20 µm.
The polarity and amplitude of the recorded ERG will depend upon the location of the active and reference electrodes. In noninvasive studies, a common location for the active electrode is on the cornea via a contact lens electrode, e.g., as illustrated in Fig. 7.1B, a Burian-Allen electrode, or jet electrode, or another type of surface conductive electrode (e.g., a DTL fiber electrode,4 H–K loop,5 or gold foil electrode). For comfort, skin electrodes, which yield smaller signals, are sometimes used instead. In invasive studies of ERG components in animals, the active electrode may be positioned anywhere in the current path, including at different retinal depths, near particular cell types. The reference electrode also can be positioned anywhere in the path, but is often placed behind the RPE in studies of isolated retina, or retrobulbar in intact eyes. In noninvasive and clinical applications, the reference is positioned either under the eyelids, such as the speculum of the Burian-Allen electrode for bipolar recording between the contact lens electrode and the reference on the same eye, or remote from the eye (e.g., on the temple) for monopolar recording. The exact position of the remote reference is of minor consequence except for possible contamination of the retinal signal by other sources.
Other factors that influence the magnitude of the contribution to the ERG of a particular cell type include stimulus conditions, such as the strength of the stimulus and its wavelength (spectrum), the background illumination (that determines adaptation level of the retina), the duration and spatial extent of the stimulus, and the location of the stimulus within the visual field, as these stimulus parameters have different effects on the responses of the different cells. For example, the relative contributions of various cell types are different under dark-adapted (scotopic) and light-adapted (photopic) conditions when rod and cone pathways, respectively, are involved in generating responses. Spatially extended diffuse stimuli, i.e., full-field (ganzfeld) flashes that fill the retina evenly, using stimulators such as those illustrated in Fig. 7.1B, are commonly used to elicit the major ERG waves (a-, b-, and d-waves) from photoreceptors and bipolar cells. Contributions from these cells generally increase with the area of the retina stimulated as the number of cells, and hence the total extracellular current, is increased. In contrast, contributions of retinal ganglion cells (and other cells with antagonistic regions within their receptive fields) to the full-field flash ERG will be limited by the strength of surround antagonism. For photopic ERGs, particularly from subjects with trichromatic color vision, such as the macaque and human, stimulus wavelength also affects contributions from cells whose responses are dependent upon spectral antagonism.6,7
Spatial buffering by glial cells
[K+]o spatial buffering is important for maintaining the electrochemical gradients across cell membranes necessary for normal neuronal activity and for minimizing the changes in local [K+]o that occur as a consequence of neuronal activation. Membrane depolarization leads to the leak of K+ from neurons, causing [K+]o to be elevated, particularly in synaptic layers of the retina (Fig. 7.3); membrane hyperpolarization leads to reduced [K+]o as the leak conductance is reduced, but the Na+–K+ ATPase in the membranes continues to pump K+ into (and Na+ out of) cells. K+ from the ECS enters the Müller cells via inwardly rectifying K+ channels and is carried radially as an intracellular (spatial buffer) current to regions of lower [K+]o. Thus a current loop is set up: the current inside the Müller cell is carried by K+ and, to complete the circuit, the dominant extracellular ions, Na+ and Cl–, carry the extracellular return current. Because the magnitude of the [K+]o changes depends upon the integral of K+ flow rate into the ECS, ERG components that reflect this glial current will be slower than components that reflect the currents around neurons. This “slowing” would be equivalent to low-pass filtering of the neuronal signal.
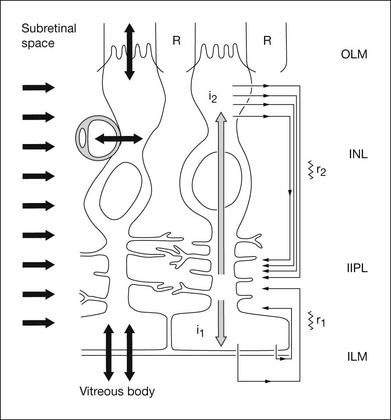
Fig. 7.3 Model of K+-induced flow of current through Müller cells and extracellular space. The Müller cell K+ currents (grey arrows) are induced by [K+]o increases in the inner plexiform layer or [K+]o decreases in the subretinal space (SRS); the return currents in the extracellular space are carried by Na+ and Cl– ions. K+ enters the Müller cell via strongly rectifying Kir 2.1 channels in and around the synaptic layers (short arrows on the left) and leave the cell via weakly rectifying Kir 4.1 channels near the vitreous body, blood vessels, and subretinal space (bidirectional arrows on the bottom). The I2 current generates slow PIII. (Adapted from Frishman LJ, Steinberg RH. Light-evoked increases in [K+]o in proximal portion of the dark-adapted cat retina. J Neurophysiol 1989;61:1233–43 and Kofuji P, Biedermann B, Siddharthan V, et al. Kir potassium channel subunit expression in retinal glial cells: implications for spatial potassium buffering. Glia 2002;39:292–3.)
The electrical properties of the Müller cell membrane are important for the creation of spatial buffer currents. The membrane is selectively permeable to K+,8,9 but the K+ conductance is not distributed evenly over the cell surface. Instead, it is concentrated in the vicinity of extracellular sinks (i.e., the vitreous body, subretinal space, and blood vessels). This regional distribution facilitates “K+ siphoning” from synaptic areas where [K+]o is high, to those regions of high K+ conductance where [K+]o is lower.10,11 In mouse retina, as indicated in Fig. 7.3, strongly inward rectifying Kir 2.1 channels have been localized to synaptic layers (small arrows on the left) where K+ moves from the ECS into Müller cells, whereas less strongly rectifying Kir 4.1 channels at the extracellular sinks allow K+ to leave the Müller cell.12
Approaches for determining the origins of the electroretinogram
Intraretinal depth recordings
A microelectrode positioned at some locus in the retinal ECS records a field potential called the “local” or “intraretinal” ERG.13 The recorded potential reflects electrical activity of the cells located near the microelectrode tip, and when a local stimulus, such as a small spot of light, is used, the local activity will be the entire signal. However, when full-field diffuse flashes are used, currents can be sufficiently large to produce a corneal ERG simultaneously with the local ERG. Local potentials with a similar timecourse to that of the corneal ERG components can be helpful in locating the cells of origin. However, this type of analysis has some complications:
1. Field potentials that spread over long distances will superimpose in space and time, making it difficult to locate the cells of origin with certainty.
2. Retinal resistivity varies between and within retinal layers,14,15 which causes currents passing through layers of different resistance to set up complex voltages.
Both of these problems occur in the intact eye when a scleral reference is used, and the local signal recorded with a microelectrode is contaminated by the diffuse ERG, due to the high resistance of the RPE and sclera. Some of this contamination can be eliminated by using a vitreal reference.16
Current source density (CSD) or “source-sink” analysis can provide a solution to these problems. Local field potentials are measured and analyzed, but in addition, radial resistance is taken into account to obtain direct estimates of radial current.17 The result is a spatiotemporal profile of relatively well-localized current sources and sinks that can be compared with the retinal structure (layers) and physiology. CSD analysis has elucidated the origins of particular ERG components (e.g., for the bipolar cell origin of the b-wave).18,19
For ERG components believed to depend specifically on glial K+ spatial buffer currents, intraretinal depth recordings with ion-selective microelectrodes have been used to locate the retinal layer(s) where neurally induced changes of [K+]o were largest and most similar in timecourse to a particular component.20–25 Application of barium (Ba2+) to block Kir channels in glial cell membranes,26,27 and the ERG components dependent upon the spatial buffer currents, or genetic inactivation of Kir4.1 channels in mice,28 have been used to provide evidence for the role of Müller cells in generating certain slow waves of the ERG.
Correlation of ERG with single-cell recordings
Correlations of the ERG with single-cell electrophysiology are most useful when the light-evoked currents from a particular cell type are the primary determinant of an ERG component, as is the case for rod photoreceptors and the currents around the photoreceptor that generate the scotopic a-wave,29 or rod bipolar cells and the scotopic b-wave in mammals.30,31 Correlation also may be useful for identifying the origin of a response property, such as oscillatory potentials (OPs) in the ERG, and the light-evoked oscillatory behavior in amacrine cells as a possible source for the potentials. However, if currents from several cell types contribute to a local field potential, the relationship between field potential and local cellular responses may be difficult to determine without using other tools, such as pharmacologic agents.
Pharmacologic dissection
The use of pharmacologic agents that have specific effects on cellular functions has been very helpful in determining origins of ERG components. In Granit’s classical pharmacologic study of the dark-adapted ERG of the cat, he observed that components disappeared sequentially during induction of ether anesthesia.32 He called the components “processes” and numbered them in the order of disappearance: PI, the positive c-wave, was first to leave, then PII, the positive b-wave, disappeared, and finally, PIII, the negative a-wave. We now know that these processes correspond roughly to RPE, bipolar, and photoreceptor cell contributions to the ERG respectively. The terms PII and PIII are still used.
In recent years, much has been learned about retinal microcircuitry and biophysics, including information at cellular and molecular levels about retinal neurotransmitters (their identity, release mechanisms, and receptors), signal transduction cascades, ion channels, and other cellular proteins. This knowledge has allowed better use of pharmacologic tools in isolating ERG components and in interpreting experimental observations. For example, specific knowledge about glutamatergic neurotransmission in the retina and appropriate agonists and antagonists for specific receptors has improved our understanding of the major waves of the ERG, including the ERG in primates.33–35 Use of the voltage-gated Na+ channel blocker tetrodotoxin (TTX) has made it possible to identify ERG components resulting from the Na+-dependent spiking activity of inner retinal cells.
Modeling of cellular responses and ERG components
As our understanding of the function of retinal cell types has improved, it has been possible to develop quantitative models that predict the light responses of those cells, and to apply the models to the analysis of the ERG. Models based on suction electrode recordings from single photoreceptor outer segments have been used to predict the leading edge of the a-wave,36–38 although more proximal portions of the photoreceptor cell will also participate in its generation.39 The models have been extended to predict the leading edge of the scotopic b-wave.30 Models of stimulus–response relations of specific retinal cells can be used to analyze amplitude versus energy curves obtained from ERG measurements into components related to the different cell types.40,41
Standard ERG tests in the clinic
Standard and more specialized tests for use in the clinic that examine key aspects of light- and dark-adapted retinal (and more central visual) function have been described in various publications by the International Society for the Clinical Electrophysiology of Vision (ISCEV), with the most recent update for the flash and flicker ERG in 2008.42 The “standard” tests advocated by ISCEV for basic ERG testing are listed in Box 7.1, and typical responses to these tests are illustrated in Fig. 7.4. The standards were developed so that ERGs recorded in clinics around the world would be comparable. The ISCEV publications, which now cover several other ERG tests as well, i.e., the ones with an asterisk in Box 7.1, describe basic technology and clinical protocols.
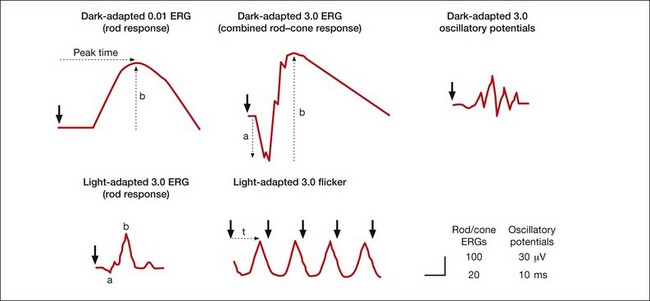
Fig. 7.4 Five standard electroretinogram (ERG) tests with full-field stimulation recommended by the International Society for the Clinical Electrophysiology of Vision (ISCEV) for use worldwide in clinical electrodiagnostic facilities. This figure shows examples, but not norms, of ERG responses in the recommended tests in normal humans. Light calibrations in candela seconds per meter squared (cd s/m2) for each test are indicated above the ERGs. Large arrowheads indicate time at which the stimulus flash occurred. Dotted arrows show common ways to measure the time-to-peak (t, implicit time), and a- and b-wave amplitude. (Reproduced with permission from Marmor MF, Fulton AB, Holder GE, et al. ISCEV standard for full-field clinical electroretinography (2008 update). Doc Ophthalmol 2009;118:69–77.)
Distal retinal components: slow PIII, C-wave, fast oscillation trough, and light peak
After the onset of a step of light, the early waves of the dark-adapted ERG, the a- and b-waves, are followed by the c-wave and then by a succession of slower responses that include the fast oscillation trough (FOT), which is a negative deflection, and the light peak, which is a large slow positive deflection (Fig. 7.5A). Because these responses are so slow, lasting seconds to minutes, patients cannot keep their eyes steady long enough for them to develop. Therefore, in the clinic, these slower responses are generally recorded by using electro-oculography.
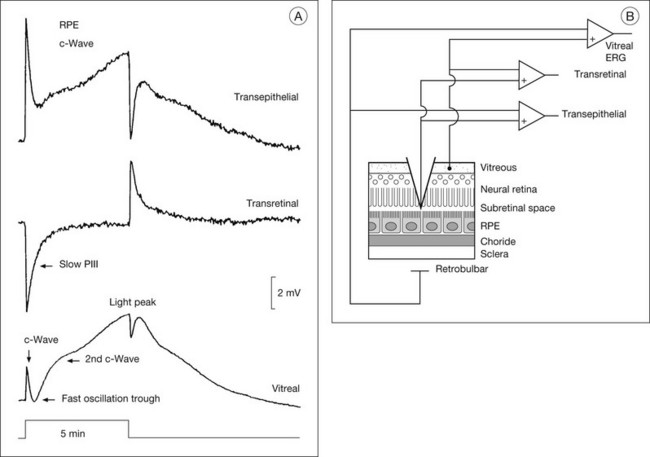
Fig. 7.5 Subretinal recordings from the intact cat eye. (A) The vitreal, transretinal, and transepithelial potentials were recorded simultaneously in response to a 5-minute period of illumination. The a- and b-waves cannot be seen using this compressed timescale. In the vitreal electroretinogram (ERG), the c-wave is followed by the fast oscillation trough (FOT) and then the light peak. The intraretinal recordings show that the c-wave is composed of two (sub)components: the larger cornea-positive retinal pigment epithelial (RPE) transepithelial response, and the slightly smaller cornea-negative transretinal component, the Müller cell-generated slow PIII response. For the light peak, only an RPE component is present. (Reproduced with permission from Steinberg RH, Linsenmeier RA, Griff ER. Retinal pigment epithelial cell contributions to the electroretinogram and electrooculogram. Prog Retin Res 1985;4:33–66.) (B) Schematic showing the recording arrangement for transretinal and transepithelial recordings in the intact eye. The transretinal ERG is recorded between a vitreal reference and a retrobulbar reference. The microelectrode is referenced to the vitreal reference for the transretinal recording and to the retrobulbar reference for the transepithelial recording. Double-barreled microelectrodes were used to measure field potentials and changes in [K+]o. (Reproduced with permission from Frishman LJ, Steinberg RH. Light-evoked increases in [K+]o in proximal portion of the dark-adapted cat retina. J Neurophysiol 1989;61:1233–43.)
The electro-oculogram (EOG) is an eye movement-dependent voltage recorded between electrodes placed near the eye at the inner and outer canthus. The patient is asked to look back and forth between a pair of fixation lights separated by 30° of visual angle, situated in a ganzfeld bowl. The source of the voltage is a corneofundal potential, also called the “standing potential” that renders the cornea positive with respect to the back of the eye. Light-evoked changes in the EOG reflect changes in the transepithelial potential (TEP) of the RPE. These changes have been studied experimentally in human and animal preparations using direct current electroretinography (dc-ERG43), and these studies will be reviewed briefly here.
Electrogenesis of the c-wave, FOT, and light peak of the dc-ERG involves ion concentration changes in the subretinal space between photoreceptors and the RPE that in turn produce slow membrane responses in the Müller and RPE cells that face the space. The Müller and/or RPE component voltages overlap in time and sum to produce the recorded dc-ERG components. The (sub)component voltages from Müller cells and RPE have been recorded in anesthetized animals by placing a microelectrode in the subretinal space, and simultaneously recording the potentials across neural retina and the RPE, as illustrated in the schematic in Fig. 7.5B. Such experiments have provided a good understanding of the origins and mechanisms of generation of the c-wave and other slow potentials from distal retina.
c-Wave
The cornea-positive c-wave that follows the b-wave is the sum of two major (sub)component voltages: a cornea-negative voltage, generated by the neural retina, and a cornea-positive voltage of similar latency and timecourse, generated by the RPE (Figs 7.5 and 7.6). The c-wave is cornea-positive when the RPE component is larger than the neural retinal component. If the two components are equal in amplitude, the c-wave will be absent, as observed in some monkeys.44
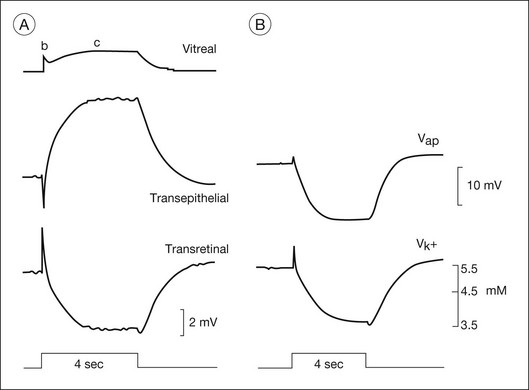
Fig. 7.6 The components of c-wave of the dark-adapted cat (DC) electroretinogram (ERG): the (sub)components, and correlation of recorded [K+]o and the retinal pigment epithelial (RPE) apical membrane hyperpolarization. Stimuli were 4-second flashes at 8.3 log q deg2/s2. (A) The vitreal c-wave consists of a transepithelial component (TEP c-wave) and a transretinal component (slow PIII). B-wave deflections can be seen in both recordings; the b-wave current generated in neural retina creates a passive voltage drop across the large resistance of the RPE and sclera. (B) RPE apical membrane and subretinal [K+]o in response to the same stimulus as in part A, recorded in a separate experiment. The apical membrane potential was derived by subtracting an intracellular recording of the basal membrane potential from the transepithelial potential. (Reproduced with permission from Steinberg RH, Linsenmeier RA, Griff ER. Retinal pigment epithelial cell contributions to the electroretinogram and electrooculogram. Prog Retin Res 1985;4:33–66.)
There is long-standing evidence that two components of opposite polarity form the ERG c-wave. For example, intravenous injection of sodium iodate in rabbit, which poisons primarily the RPE, abolishes the cornea-positive c-wave and leaves a cornea-negative potential,45 as occurs in vitro when recording from an isolated neural retina preparation.46 Microelectrode recordings in retinas of several species,43 including monkey,47 have confirmed the presence of the two components. An example of such recordings in intact cat eye is shown in Fig. 7.6. The component from the neural retina is commonly termed slow PIII, to distinguish it from fast PIII, the photoreceptor current. The component from the RPE is the RPE c-wave.
Both slow PIII and the RPE c-wave are responses to the light-evoked decrease in [K+]o in the subretinal space that occurs in response to intense light stimulation of the dark-adapted retina. When measurements of [K+]o were made with ion-selective microelectrodes, either in intact eyes or in vitro preparations, the timecourse of the [K+]o decrease was found to predict that of the ERG c-wave and its component parts (Fig. 7.6). Blocking K+ conductance (via Kir channels) with various agents eliminated both the slow PIII48 and the RPE c-wave.49
Müller cell contribution (slow PIII)
Intraretinal recording at various depths50 have shown that slow PIII is generated by a radially oriented current across the neural retina. A Müller cell generator, rather than a neuronal generator, was suggested because slow PIII persisted after treatment with aspartate, a nonselective glutamate agonist, to suppress all responses of postreceptoral neurons.51
Studies in amphibia and mammals have shown that slow PIII is initiated when the distal ends of the Müller cells are passively hyperpolarized by a photoreceptor-dependent decrease in subretinal [K+]o. This sets up a transretinal “K+ spatial buffer” current,25 and the current drop across the extracellular resistance produces the slow PIII voltage.50,52,53 The slow hyperpolarization recorded in Müller cells was observed to be similar in timecourse to both the subretinal [K+]o decrease and to slow PIII.20,21,53 Further, when Ba2+ was used to block Müller cell Kir channel conductances, slow PIII was suppressed but there was little effect on the light-evoked subretinal K+ decrease.22,27,54 Finally, slow PIII was not present in ERGs of mice with Kir 4.1 channels, the dominant Kir channels in Müller cells, genetically inactivated.28
Distal versus proximal PIII
Intraretinal depth recordings in isolated rabbit retina have identified a component of similar timecourse and polarity to slow PIII that is eliminated by aspartate, and therefore, unlike slow PIII, is generated by cells proximal to the photoreceptors.55 Proximal PIII is now thought to originate from Müller cell K+ currents that flow in the same direction in the retina as slow PIII currents. However, the proximal PIII currents are initiated by an increase in [K+]o due to neuronal activation in proximal retina, rather than the decrease in [K+]o in the subretinal space. The term “proximal PIII” is not commonly used now that responses have been identified that are Müller cell, or perhaps astrocyte-mediated responses to [K+]o changes in proximal retina, e.g., STR and PhNR (described in later sections).
Retinal pigment epithelial component
The RPE c-wave is a cornea-positive potential that reflects an increase in the TEP of the RPE, a major component of the standing potential of the eye. The TEP exists because the apical and basal membranes of RPE cells are electrically separated by high-resistance tight junctions that encircle the monolayer of cells (the “R membrane”). The TEP is equal to the difference between the apical (Vap) and basal (Vba) membrane potentials.43 Vap is generally more hyperpolarized than Vba, making the TEP cornea-positive. During c-wave generation in response to an increase in light, the TEP increases (becomes even more positive). This is initiated by a hyperpolarization of the apical membrane, and passive shunting of current to the basal membrane, resulting in a (smaller) hyperpolarization of basal membrane, and a greater difference in potential between the two membranes.43
As was observed for Müller cells, the slow hyperpolarization of the apical membrane, with its large K+ conductance,56 and the RPE c-wave have a timecourse that is very similar to the subretinal [K+]o decrease, as illustrated in Fig. 7.6. In an isolated RPE preparation (where only the apical bath [K+] was altered), Oakley et al.57 demonstrated that the RPE c-wave was due solely to the [K+]o decrease.
The fast oscillation trough
The FOT (usually measured by EOG) is a change in the corneoretinal potential – it decreases and increases in synchrony with an alternating light/dark stimulus. The response in the dc-ERG that corresponds to the EOG decrease (trough) also is termed the FOT. The FOT response to maintained illumination follows the c-wave peak, and, when a light peak occurs, it appears as a dip between the c-wave and the light peak (Fig. 7.5A).
The FOT originates from both neural retina and RPE. It involves recovery of Müller and RPE cells from their peak polarizations as subretinal K+ reaccumulates following the reduction in concentration caused by light. This recovery may be greater than predicted by the reaccumulation, particularly for the RPE component. Light initially elicits a hyperpolarization of the apical membrane that increases the TEP and then produces a delayed basal hyperpolarization that decreases the TEP. This extra decrease in TEP underlies most of the cornea-negative potential of the FOT.43
The ionic mechanisms of the basal membrane hyperpolarization involve Cl– conductances.58 In intact sheets of RPE/choroid from human fetal eyes, the Miller lab distinguished two types of basal membrane Cl– channels: a 4,4’-diisothiocyanostilbene-2, 2’-disulfonate (DIDS)-inhibitable Ca2+-sensitive Cl– channel, and a cyclic AMP-dependent channel that is inhibited by DIDS as well as by 5-nitro-2-(3phenylpropylamino) benzoate (NPPB), which identifies it as a cystic fibrosis transmembrane regulator (CFTR) channel.59 In CF patients, the FOT, but not the light peak (see below) is reduced, implicating CFTR in generation of the FOT.
The light peak
Maintained illumination causes a slow increase in the standing potential in the dc-ERG called the light peak that can be recorded as a slow oscillation of the EOG (Fig. 7.6). Intraretinal recordings in several species,43,58 including monkey,47 have shown that this cornea-positive potential originates solely from an increase in the TEP (Fig. 7.5A). Intracellular RPE recordings localized the origin of the increase to a slow depolarization of the basal membrane caused by an increase in basal Cl– conductance. In both chick RPE and human RPE cell sheets the Cl– conductance increase was suppressed by DIDS.58,59 In mouse, the light peak is also dependent on a Cl– conductance, and it is regulated by voltage-dependent Ca2+ channel CaV1.3 subunits.60
Although the light peak voltage originates from the RPE basal membrane, it is then initiated in neural retina via the photoreceptors.61 Light stimulation leads to a change in concentration of a “light peak substance” which then affects the basal membrane via a second-messenger system. The identities of the “light peak substance” and the second messenger(s) involved in producing the light peak are unresolved. Although dopamine affected the light peak in the perfused cat eye,62 studies in chick did not support its being the “light peak substance.”61 Epinephrine also has been proposed as a candidate, and a role for ligands binding to adrenergic alpha-1 receptors on the apical membrane is likely.59 Cyclic AMP has been investigated as a second messenger in light peak generation but, as described above, it may be involved in generation of the FOT, rather than the light peak.59
Origin of the a-wave
Fig. 7.7 shows the dark- and light-adapted flash ERG of macaque monkey, a good animal model for studying the origins of the human response, as illustrated in Fig. 7.1. The a-wave in the dark-adapted ERG is the initial negative wave that occurs in response to strong stimuli from darkness (Fig. 7.7, top left column) and it is primarily rod-driven (scotopic), but contains a cone contribution when flashes are very strong. When the background is rod-saturating the a-wave is cone-driven (photopic; right column). Under both dark- and light-adapted conditions, the a-wave is truncated by the rise of the positive-going b-wave that originates primarily from ON bipolar cells,30 as reviewed below. The slow negative wave in the dark-adapted ERG in response to the weakest stimuli, called the STR, is not the a-wave, but instead is initiated by amacrine and/or ganglion cell activity. This is known because STR is eliminated when postreceptoral activity is blocked pharmacologically.63,64
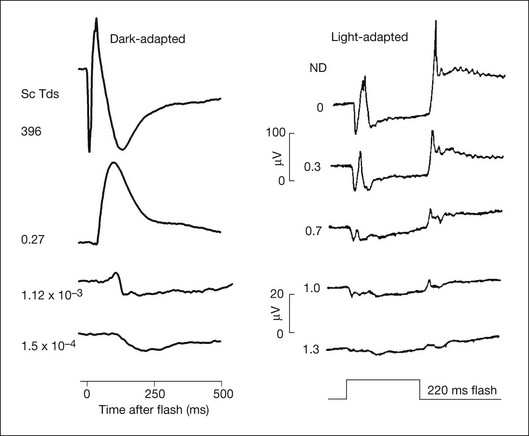
Fig. 7.7 Dark- and light-adapted electroretinograms (ERGs) of the macaque retina. (Left) Dark-adapted full-field ERGs of anesthetized macaque monkeys were measured in response to brief (<5 ms) flashes from darkness generated by computer-controlled light-emitting diodes (LEDs). Responses were recorded differentially between DTL fibers on the two eyes. Flash strength was increased over a 6-log-unit range. Responses to the weakest stimuli were rod-driven (scotopic), whereas for the strongest stimuli there were mixed rod–cone responses. (Reproduced with permission from Robson JG, Frishman LJ. Dissecting the dark-adapted electroretinogram. Doc Ophthalmol 1998;95:187–215.) (Right) Light-adapted full-field ERGs of anesthetized macaques were measured using Burian-Allen electrodes. Stimulus strength was controlled with neutral-density (ND) filters. Stimulus strength increased over a 1.3-log-unit range to a maximum at 0 ND of 4.0 log ph td for 220-ms flashes. Stimuli were presented on a steady rod-saturating background of 3.3 log sc td. The 20 µV calibration bar applies both to the dark-adapted ERG responses to weak stimuli and to the light-adapted ERGs. (Reproduced with permission from Sieving PA, Murayama K, Naarendorp F. Push–pull model of the primate photopic electroretinogram: a role for hyperpolarizing neurons in shaping the b-wave. Vis Neurosci 1994;11:519–32.)
The a-wave as a reflection of rod and cone receptor photocurrent
Early intraretinal depth studies in intact cat eyes13,65 found that the signal at the timecourse of the a-wave was largest in the vicinity of the photoreceptors. The case for a receptoral origin for PIII was strengthened by microelectrode recordings in macaque monkey retina, with the inner retinal circulation clamped to suppress retinal activity proximal to the photoreceptors.66
Penn and Hagins67 in CSD analyses of the isolated rat retina demonstrated that light suppressed the circulating (dark) current of the photoreceptors, and proposed that this suppression was seen in the ERG as the a-wave. Figure 7.8 provides a schematic of the photoreceptor layer current from a review by Pugh et al.68 The figure shows that, in the dark, cation channels (Na+, Ca2+, and Mg2+) in the receptor outer segment (ROS) are open, current flows into the ROS (a current sink with respect to the ECS), and K+ leaks out of the inner segment (a current source), creating dipole current. This dipole current produces a corneal (and vitreal) potential that is positive with respect to the scleral side of the retina. Suppression of the dark current reduces the cornea-positive potential, creating the negative-going a-wave. Consistent with this view, as illustrated in Fig. 7.9, intraretinal recordings and CSD analyses in the intact macaque retina have localized current sources and sinks for a local potential, corresponding to the a-wave, to the distal third of the retina.18
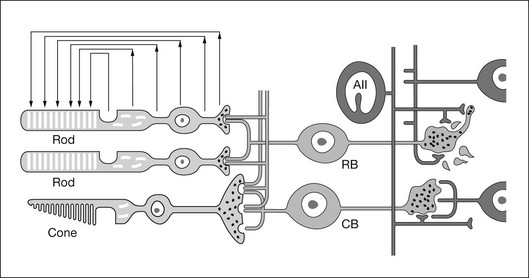
Fig. 7.8 Schematic of a longitudinal section of the mammalian retina illustrating how circulating currents in the photoreceptor layer create an extracellular field potential, in which the vitreal side of the retina has a more positive potential than the scleral side. A very bright flash will suppress the circulating current around the photoreceptor, leading to a vitreal or corneal response which is negative relative to the resting preflash baseline. (Reproduced with permission from Pugh EN Jr, Falsini B, Lyubarsky A. The origin of the major rod- and cone-driven components of the rodent electroretinogram and the effects of age and light-rearing history on the magnitude of these components. Photostasis and related phenomena. New York: Plenum Press; 1998. p 93–128.)
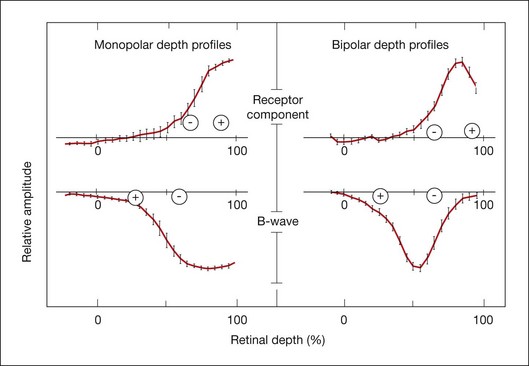
Fig. 7.9 Depth profiles and current source density results in anesthetized macaque monkey retina for the a-wave and the b-wave. Left: Monopolar depth profiles using an intraretinal microelectrode referenced to the forehead. Right: bipolar depth profiles using a coaxial electrode with a distance of 25 µm between the tips to measure field potential amplitudes at the peak time of the receptor component, the b-wave and the dc component of the macaque light-adapted electroretinogram. The pluses and minuses indicate the current sources (+) and sinks (–) for the components, as calculated from current source density analyses based on the coaxial electrode recordings and resistance measurements. The a-wave source and sink are in the distal quarter of the retina. The b-wave has a large sink near the outer nuclear layer and a distributed source extending to the vitreal surface of the retina. Plots represent means of 26 penetrations. (Adapted from Heynen H, van Norren D. Origin of the electroretinogram in the intact macaque eye – II. Current source-density analysis. Vision Res 1985;25:709–15.)
Hood and Birch38 sought to relate the timecourse of the leading edge of the ERG a-wave directly to the leading edge of the photoreceptor outer-segment response to light. They demonstrated that both the linear and the nonlinear (i.e., saturating) behavior of the leading edge of the a-wave in the human ERG could be predicted by a model of photoreceptor function derived from in vitro suction electrode recordings of currents around the outer segments of primate rod photoreceptors.69 Subsequently a simplified kinetic model of the leading edge of the photoreceptor response (in vitro current recordings) that took into account the stages of the biochemical phototransduction cascade was developed by Lamb and Pugh.70 This model could be fit to the leading edge of the human a-wave generated by strong stimuli and it has been used in noninvasive studies of human rod36,71 and cone photoreceptor72 function. Recent analyses suggest that the a-wave generated in response to strong stimuli includes additional currents associated with more proximal regions of the photoreceptor cell that form a sharp “nose” on the leading edge of the response that quickly relaxes to the level of the photocurrent.39
Postreceptoral contributions to the a-wave
The receptoral origins of the a-wave (Granit’s PIII),32 as well as postreceptoral contributions of similar timecourse, have been clarified in pharmacological studies. In early in vitro studies of the isolated retina (amphibian and human), the nonspecific glutamate agonist aspartate in the perfusate suppressed all postreceptoral responses, and isolated the a-wave, revealing its presence under the b-wave.51,73 Our understanding of the receptoral and postreceptoral contributions to the light-adapted a-wave, as well as other waves of the macaque monkey photopic ERG, was greatly advanced by studies of Sieving and colleagues in which they utilized more specific glutamate analogs than aspartate to dissect retinal circuits, and particularly ON versus OFF circuits set up by depolarizing and hyperpolarizing bipolar cells, respectively (Fig. 7.2).33,35 They made intravitreal injections in anesthetized macaques of an mGluR6 receptor agonist, 2-amino-4-phosphonobutyric acid (APB, L isomer, also called L-AP4) to block metabotropic glutamatergic neurotransmission to depolarizing (ON) bipolar cells. This eliminated light-evoked responses of ON bipolar cells as well as contributions from more proximal cells of the retinal ON pathway. Alternatively, they injected cis-2,3-piperidine dicarboxylic acid (PDA) (or kynurenic acid) to block major ionotropic glutamate receptors in the retina (α-amino-3-hydroxy-5-methyl-4-isoxazolepropionic acid (AMPA) and kainate receptors).74 These ionotropic receptors, blocked by PDA, mediate signal transmission to hyperpolarizing (OFF) bipolar cells and horizontal (Hz) cells, as well as to amacrine and ganglion cells of both OFF and ON pathways. Results of such experiments are illustrated in Fig. 7.10A for responses to fairly weak stimuli presented on a rod-suppressing background; functions relating a-wave amplitude and stimulus strength over a wider range of stimuli in the same study are shown in Fig. 7.10B. The a-wave was reduced in amplitude by PDA (or kynurenic acid, not shown), but not by APB. Fig. 7.10 also shows that PDA had a similar effect to that of aspartate, or to cobalt (Co2+), which was used to block the voltage-gated Ca2+ channels which are essential for vesicular release of glutamate.
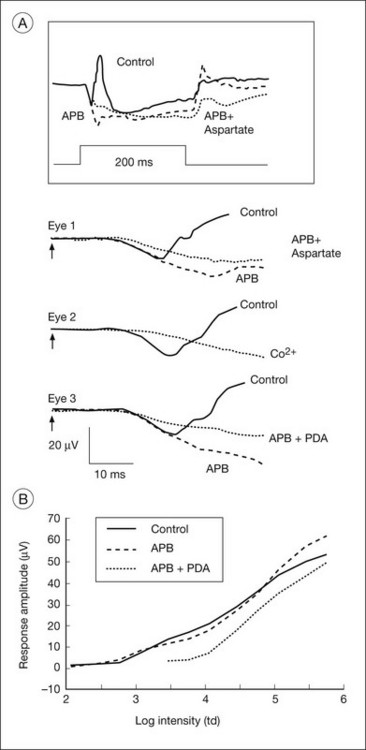
Fig. 7.10 Postreceptoral contributions to the a-wave of the macaque electroretinogram (ERG). (A) Comparison of the effects of 2-amino-4-phosphonobutyric acid (APB:1 mM vitreal concentration) and APB + cis-2,3-piperidine dicarboxylic acid (PDA: 5 mM) with those of aspartate (50 mM) and cobalt (10 mm, CO2+) on the photopic ERG a-wave of three different eyes of two anesthetized monkeys. The inset at the top shows the response of eye number 1 to the 200-ms stimulus of 3.76 log td (2.01 log cd/m2) on a steady background of 3.3 log td (1.55 cd/m2). The a-waves for eyes 1, 2, and 3 were all in response to the same stimulus. For this stimulus, most of the small a-wave (10 µV) that was elicited was postreceptoral in origin. In the clinic the a-wave elicited by brief flashes often is larger, 20 µV or more, and therefore also will include several microvolts of photoreceptor contribution, as shown in part B. (B) Stimulus response function (V log I plot) of the photopic a-wave of the macaque measured at times corresponding to the a-wave peak in the control responses (solid line). Amplitudes after APB (broken line) and after APB + PDA (dotted line) were measured at the same latency as the trough of the control a-waves measured at the same stimulus intensity. The points are connected by solid lines. In this figure, as in part A, APB had no effect on the a-wave amplitude. In contrast, PDA reduced the amplitude, and the postreceptoral contribution was maximally between 10 and 15 µV, about 50% of a 20 µV a-wave, but less than 25% of a saturated a-wave of about 65 µV. (Reproduced with permission from Bush RA, Sieving PA. A proximal retinal component in the primate photopic ERG a-wave. Invest Ophthalmol Vis Sci 1994;35:635–45.)
When the effects of PDA versus APB on the photopic a-wave amplitude were evaluated over a wider range of stimuli, PDA-sensitive postreceptoral neurons, rather than photoreceptors, or APB-sensitive contributions from ON pathway, were found to generate the leading edge for the first 1.5 log units of flash strengths that elicited a measurable a-wave (Fig. 7.10B). Postreceptoral cells in the OFF pathway and inner retina continued to contribute 10–15 µV to the total a-wave amplitude when photoreceptoral contributions also were present. Postreceptoral contributions to the a-wave in alert humans have also been demonstrated, by analysis of ERGs.75
Postreceptoral contributions to the dark-adapted a-wave have been observed as well in the monkey.34,76 For weak to moderate stimuli from darkness, a-waves are dominated by rod signals, but a strong flash elicits a mixed rod–cone ERG like the macaque ERG illustrated in Fig. 7.11. To study purely rod-driven responses it is therefore necessary to separate the rod- and cone-driven responses to strong stimuli when investigating their relative contributions to the ERG.
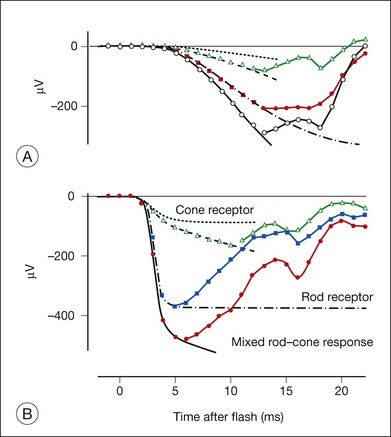
Fig. 7.11 Dark-adapted electroretinogram (ERG) of a macaque showing the mixed rod–cone a-wave and separate components measured (symbols) and modeled (solid lines fit to the leading edge of the a-wave) for two stimulus strengths. (A) Responses of an anesthetized macaque to a brief blue light-emitting diode (LED) flash of 188 sc td/s (57 ph td/s) and (B) responses to a xenon white flash of 59 000 sc td/s, (34 000 ph td/s). In both parts, the largest response (open circles) is the entire mixed rod–cone a-wave; the green solid line restricted to the leading edge shows the modeled mixed rod–cone response. The second largest response is the (isolated) rod-driven response (filled circles); the red solid line through the leading edge is the modeled rod photoreceptor contribution. The second to smallest response (open triangles) is the (isolated) cone-driven response, including the postreceptoral contribution; the cyan solid line through the leading edge shows the modeled cone-driven response. The smallest response is the modeled cone photoreceptor contribution, based on post cis-2,3-piperidine dicarboxylic acid (PDA) findings for the cone-driven response. Given the animal’s 8.5-mm pupil, the stimulus for part A was about 1 cd s/m2, i.e., about three times less intense (for cones) than the International Society for the Clinical Electrophysiology of Vision (ISCEV) standard flash of 3 cd s/m2, whereas the stimulus for part B is about 2000 times stronger. ISCEV also suggests flashes of 10 and 30 cd s/m2 for mixed rod–cone ERG. (Adapted from Robson JG, Saszik SM, Ahmed J, et al. Rod and cone contributions to the a-wave of the electroretinogram of the macaque. J Physiol 2003;547:509–30.)
The rod-driven response can be extracted by subtracting the isolated cone-driven response to the same stimulus from the mixed rod–cone response. Isolated cone-driven responses in Fig. 7.11 (triangles) were obtained by briefly suppressing the rod response with an adapting flash, and then measuring the response to the original test stimulus presented a few hundred milliseconds (300 ms) after offset of the adapting flash. Cone-driven responses in primates recover to full amplitude within about 300 ms whereas rod-driven responses take at least a second, making it possible to isolate the cone-driven response.34
The effect of PDA on the rod-isolated a-wave of the macaque is shown in Fig. 7.12 for a range of stimulus strengths.34 Most of the leading edge of the a-wave in response to the weakest stimulus was eliminated (Fig. 7.12A), and much of the leading edge that occurred later than 15 ms after the flash was removed in response to stronger stimuli (Fig. 7.12B), and even for stimuli that saturated the response (not shown). When APB was injected along with PDA, to eliminate remaining ON bipolar cell contributions as well (Fig. 7.13B), the shape of the early portion of PIII could be seen to form a nose, generally obscured by negative-going signals removed by PDA, and the b-wave removed by APB (Fig. 7.12C).
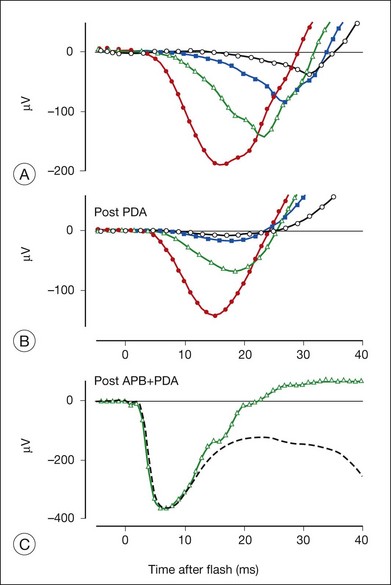
Fig. 7.12 Postreceptoral contribution to rod-driven dark-adapted macaque electroretinogram (ERG). Rod-driven responses from an anesthetized macaque were obtained after subtracting isolated cone-driven response from the mixed rod–cone ERG. Rod-driven responses are shown to a range of stimulus energies (15.8–509 sc td/s) before (A) and after (B) intravitreal injection of cis-2,3-piperidine dicarboxylic acid (PDA) (4 mM). For comparison, the ERG remaining after adding PDA and 2-amino-4-phosphonobutyric acid (APB) is shown in part C. The stimulus was a xenon white flash of 59 000 sc td/s, and cone signals were not removed in this recording. The control response is shown by the green line, the post PDA+APB by the dashed black line. (A and B, adapted from Robson JG, Saszik SM, Ahmed J, et al. Rod and cone contributions to the a-wave of the electroretinogram of the macaque. J Physiol 2003;547:509–30; C, from unpublished data.)
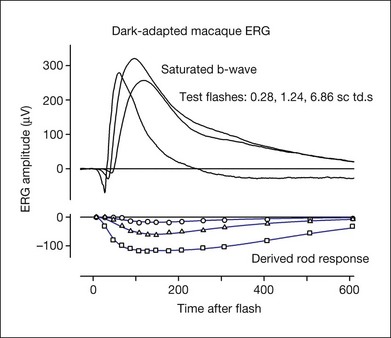
Fig. 7.13 Dark-adapted electroretinogram response of the anesthetized macaque monkey to three different test stimulus strengths (0.28, 1.24, and 6.86 sc td/s) and the derived rod photoreceptor response for each test stimulus. The photoreceptor response was derived using the paired-flash approach of Pepperberg et al.,78 in which a rod-saturating probe flash follows a test flash at fixed intervals after its onset, and the residual response of the probe is subtracted from the probe alone to derive the rod receptor response at each time point (data points). The model lines used modifications of equations from Robson et al.34 (Frishman LJ, Robson JG, unpublished observations.)
PDA blocks signal transmission not only to hyperpolarizing bipolar and horizontal cells, but also to amacrine and ganglion cells of the inner retina. In order to test whether the effect of PDA on the a-wave was due to OFF bipolar cells or more proximal cells, it was necessary selectively to suppress amacrine and ganglion cell activity. This was done using N-methyl-D-aspartate (NMDA), as only the proximal retinal neurons have functional NMDA (ionotropic glutamate) receptors. Results (not shown) were similar in the dark-adapted ERG to those after PDA alone, indicating a proximal retinal origin for most of the rod-driven postreceptoral contributions to the dark-adapted a-wave, rather than a contribution from OFF bipolar cells.77
The timecourse of the photoreceptor response
The leading edge of the a-wave is the only visible portion of the photoreceptor response in the normal ERG. In order to see the entire timecourse of the photoreceptor response it is necessary to remove postreceptoral contributions, as was done pharmacologically for the ERGs in Figs 7.11 and 7.12. However, such a manipulation is invasive, and does not eliminate slow PIII and the c-wave, should they be present. Another approach is to use the paired-flash technique developed by Pepperberg and colleagues78 to derive, in vivo, the photoreceptor response. The derived photoreceptor response (underneath) and the full ERG responses to three stimuli of the same strength are shown for a macaque monkey in Fig. 7.13. The timecourse of the derived response is similar to that of current recordings in vitro from individual rod photoreceptor outer segments in the macaque, although it reaches its peak a little earlier in vivo in the ERG than in vitro. However, the amplitude of the derived response is rather large, perhaps twice that expected for the photocurrent. The large amplitude of the derived response may occur because the method for deriving responses uses measurements in the “nose” portion of saturated a-wave (Fig. 7.12C), which reflects currents from more proximal regions of the photoreceptor in addition to outer-segment currents.39
Origin of the b-wave
The cornea-positive b-wave, Granit’s PII, is the largest component of the dark-adapted diffuse-flash ERG. There is general consensus that the neuronal generator of the b-wave is primarily the depolarizing (ON) bipolar cells.30,31,79,80 APB (L-AP4), which binds to mGluR6 receptors of ON bipolar cells and removed the cone b-wave in experiments of Sieving et al., also removed the dark-adapted b-wave in several species, including primates.30,80 The b-wave is also absent, causing a negative ERG (Fig. 7.12C). Negative ERGs also occur in patients and murine models with complete congenital stationary night blindness (CSNB) who have mutations that cause a breakdown in the signal transduction cascade in ON bipolar cells.81,82 However, experimental support also exists for a Müller cell contribution, likely due to K+ currents as a consequence of bipolar cell depolarization, particularly at times past the leading edge of the response, as described below.
Resolving the role of bipolar cells and Müller cells in generating the b-wave has been difficult. Early intraretinal depth recordings demonstrated a negative-going intraretinal b-wave with a (negative) peak amplitude in distal retina, near the outer plexiform layer (OPL), and the largest change in amplitude across the inner nuclear layer (INL).13,65 These results suggested that the b-wave was generated by current flowing through a radially oriented cell that acted as a dipole. Bipolar cells, the only radially oriented neurons that span the INL, and Müller cells, the radially oriented glial cells, were implicated.
Müller cell hypothesis
CSD profiles for the b-wave from intraretinal recordings in frog retina83 showed an OPL current sink and a current source extending from the OPL almost all the way to the vitreal surface, and this also was found in monkey retina (Fig. 7.9).18 Due to the extensive radial spread of sinks and sources, it was hypothesized that Müller cells generate b-wave currents, and supporting this, Miller and Dowling84 found that intracellularly recorded Müller cell responses in amphibian resemble b-wave responses to the same stimuli. However studies of local changes in [K+]o and Müller K+ conductances were not fully consistent with the Müller cell hypothesis.
Measurements using intraretinal K+-selective microelectrodes of local changes in light-evoked [K+]o skate,85 amphibian,20,86 and rabbit21 retinas demonstrated only small transient [K+]o increases in the OPL at light onset, presumably from dendrites of ON bipolar cells. The Müller cell hypothesis required a large sink activity in the OPL. In contrast, a large sustained inner plexiform layer (IPL) [K+]o increase was recorded in the proximal retina of several species at the onset, or at onset and offset of a light stimulus.87 The large proximal [K+]o increase reflected activation of amacrine and ganglion cells as well, and is now understood to contribute strongly to Müller cell or astrocyte-mediated ERG components of proximal retinal origin, e.g., M-wave, STR, or PhNR.
As described in the section on spatial buffering, above, the selective permeability of the Müller cell membrane to K+ and the nonuniform distribution of K+ conductances (Fig. 7.3) provide the opportunity for K+ siphoning from synaptic layers where [K+]o is high to regions of lower [K+]o. In species with avascular retinas, e.g., amphibian and rabbit, the Müller cell endfoot adjacent to the vitreous humor has more than 90% of the K+ conductance in the cell, as shown in the Newman lab study of enzymatically isolated Müller cells subjected to puffs of K+ (Fig. 7.14). K+ entering the Müller cell via strongly inward rectifying Kir channels in synaptic regions will exit predominantly from the vitreal endfoot where the K+ conductance is only weakly rectifying (Fig. 7.3).28 The OPL [K+]o increase could establish a current loop that extends all the way to the vitreal surface. The IPL [K+]o increase would contribute to the same current loop, creating a vitreal positive proximally generated potential in addition to the bipolar cell-dependent b-wave. However, as noted above, the OPL increases in [K+]o were small, and because of this, did not predict the large b-wave recorded in the ERG.
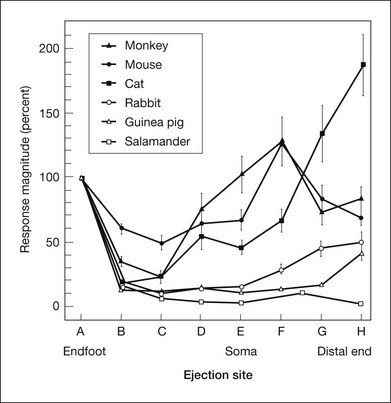
Fig. 7.14 Distribution of K+ conductance over the surface of enzymatically dissociated Müller cells. The magnitude of depolarizations in response to focal K+ ejections is plotted as a function of ejection location along the Müller cell surface. Responses are normalized to response magnitude at the endfoot. In species with avascular retinas (salamander, rabbit, guinea pig), K+ conductance is largest at the endfoot. In vascularized species, conductance is largest near the cell soma (mouse, monkey) or at the distal end of the cell (cat). (Reproduced with permission from Newman EA. Distribution of potassium conductance in mammalian Müller (glial) cells: a comparative study. J Neurosci 1987;7:2423–32.)
In contrast, in species with vascularized retinas such as mouse and monkey, K+ conductance, although high at the endfoot, is greatest in the INL, near capillaries. In cat, K+ conductance is greatest near the subretinal space (Fig. 7.14). In these species with vascularized retinas the Müller cell current that arises as a consequence of the proximal [K+]o increase contributes to a distally directed current loop (like slow PIII), thereby producing a cornea-negative potential (e.g., m-wave or negative STR), rather than positive b-wave.
ON bipolar cells as the generator of the b-wave
Experiments using Ba2+ to block Kir channels have not supported the Müller cell hypothesis for generation of the b-wave. Although Ba2+ blocks slow PIII48 as well other responses associated with Müller cell K+ currents, it is far less effective in blocking the b-wave.23,54,88,89 In CSD studies in frog88 and rabbit,89 only the proximal sink source activity associated with the inner retinal M-wave was removed by Ba2+. At least two-thirds of the OPL sink was retained, and the IPL source involved in generating the b-wave was enhanced. These results indicated that the major b-wave generator is the bipolar cell itself.
Scotopic b-wave (PII) in mammals
In the mammalian retina, the scotopic ERG response to weak stimuli reflects activity of the sensitive primary rod circuit, including rods, the main interneuron, rod bipolar cells, AII amacrine cells, cone bipolar cell terminals, and ganglion cells (Fig. 7.2). Given the simplicity of the circuit, with contributions from amacrine and ganglion cells pharmacologically suppressed, the isolated b-wave (Granit’s PII) should reflect the rod bipolar cell response, either directly as the bipolar cell current, or via Müller cell K+ currents resulting from K+ outflow from bipolar cells. Only for strong stimuli would the underlying photoreceptor PIII be a significant factor in the ERG. Figure 7.15A shows pharmacologically isolated PII from ERGs, recorded in vivo, of four normal C57BL/6 mice, in response to a weak stimulus. An intravitreal injection of the inhibitory neurotransmitter γ-aminobutyric acid (GABA) was used to suppress inner retinal activity.31,90 Also included in the figure is PII isolated from human ERG using weak adapting backgrounds to suppress the very sensitive STRs.91 The isolated PII responses have been superimposed on an average of several patch electrode current recordings in a mouse retinal slice preparation of rod bipolar cell responses to a stimulus of similar effect on the rods. The timecourse of the ERG and the single cell currents is very similar, supporting the view that isolated PII reflects rod bipolar cell activity. If Müller cell currents had generated PII, the signal would have been delayed relative to the bipolar cell responses recorded in the slice, due to the time necessary for accumulation of K+ ions in the ECS.
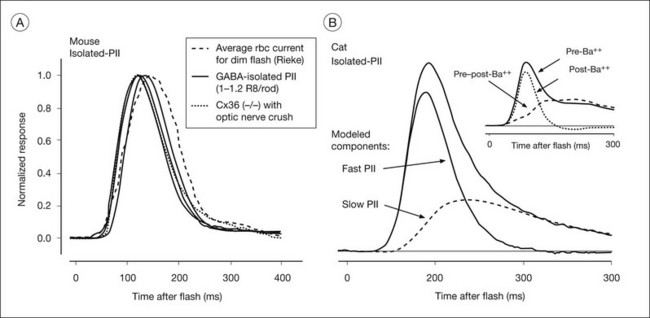
Fig. 7.15 Rod bipolar cell component (PII) of the dark-adapted electroretinogram (ERG) of mouse, cat, and human. (A) (left) Comparison of rod bipolar cell current from patch recordings in mouse retinal slice (courtesy of F. Rieke) with isolated PII (by weak light adaptation) from humans, isolated PII from ERGs of six C57BL/6 mice by intravitreal injection of γ-aminobutyric acid (GABA: 32–46 mM) and additionally from a Cx36(–/–) mouse lacking ganglion cells that lacked scotopic threshold responses. (Reproduced with permission from Cameron AM, Mahroo OA, Lamb TD. Dark adaptation of human rod bipolar cells measured from the b-wave of the scotopic electroretinogram. J Physiol 2006;575:507–26, with permission.) (B) (right) Pharmacologically isolated cat PII (by inner retinal blockade). The response has been analyzed into a fast component, proposed to be a direct reflection of the postsynaptic current, and a slow component, that is a low-pass filtered version of the faster component, believed to be the Müller cell response, contributing mainly to the tail of the response. Identification of the Müller cell component is supported by the observation (shown in the inset) that intravitreal injection of Ba2+, used to block Kir channels in Müller cells removed a similar portion of the total PII response. For stronger stimuli, in order to isolate the bipolar cell response, it would be necessary also to remove the underlying negative (photoreceptor) PIII signal. (Reproduced with permission from Robson JG, Frishman LJ. Dissecting the dark-adapted electroretinogram. Doc Ophthalmol 1998;95:187–215, and from LJ Frishman, JG Robson, unpublished observations.)
Pharmacologically isolated PII of cat (Fig. 7.15B) revealed a response similar to that in mouse in its rising phase, but recovered more slowly to baseline. The cat PII response to a brief flash can be analyzed into a fast component and a slow component that is a low-pass filtered version of the fast component, as indicated by the lines in Fig. 7.15B. The inset to Fig. 7.15B shows that intravitreal Ba2+ eliminated a slow portion of the response that was very similar in timecourse to the modeled slow component, but did not alter the fast component, suggesting that bipolar cell current provides the leading edge of PII in the cat, and the Müller cell current contributes at later times. Although the slow component (in response to a brief flash) was lower in amplitude than the fast component, the area under the two curves was similar. With longer stimulus durations such as those used in early studies of the b-wave origins, the contribution to the ERG of the two sources would be about equal.85 Pharmacologic isolation of macaque PII showed a similar waveform to that in cat.3
Cone-driven b-wave
The photopic ERG is commonly measured in the presence of a rod-suppressing background. Depth profiles of the rod b-wave measured under dark-adapted conditions and the cone b-wave, under light-adapted conditions, are similar in cat92,93 and monkey retinas, suggesting a similar origin for the two responses, but in the case of the photopic ERG, depolarizing cone rather than rod bipolar cells are involved.
Sieving and colleagues33,35 studied the origins of the photopic b-wave in monkeys using glutamate analogs in the same series of experiments as those in which the a-wave was studied. Figure 7.16 shows, on the right, the macaque photopic ERG response to long-duration flashes, before and after APB was injected into the vitreal cavity (eye 1, left). APB removed the transient b-wave supporting ON bipolar cells as the generators (although the possibility of glial mediation was not eliminated in these studies). However, when PDA was injected first in another eye (eye 2, right), to remove the OFF pathway (and horizontal cell inhibitory feedback), a much larger and more sustained b-wave was revealed. These findings indicate that the normally transient nature of the cone b-wave is due to truncation of a more prolonged depolarizing bipolar cell response. This truncation is due to some combination of (PDA-sensitive) OFF pathway response of opposite polarity to the ON bipolar cell contribution to the ERG (a push–pull effect28), and inhibition via (PDA-sensitive) horizontal cells of ON bipolar cell signals. The isolated photoreceptor response remaining after all postreceptoral activity was eliminated either by APB followed by PDA, or PDA followed by APB, was similar.
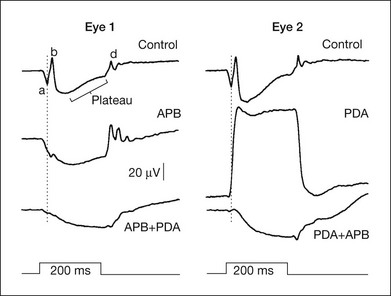
Fig. 7.16 Effects of 2-amino-4-phosphonobutyric acid (APB) and cis-2,3-piperidine dicarboxylic acid (PDA) on the light-adapted photopic electroretinogram of two monkey eyes. Drugs were given sequentially, APB followed by PDA for eye 1, and PDA followed by APB for eye 2. The vertical line shows the time of the a-wave trough in the control response. The 200-ms stimulus was 3.76 log td (2.01 log cd/m2) on a steady rod-saturating background of 3.3 log td (1.55 cd/m2). (Reproduced with permission from Bush RA, Sieving PA. A proximal retinal component in the primate photopic ERG a-wave. Invest. Ophthalmol Vis Sci 1994;35:635–45.)
Origin of the d-wave
The d-wave is a positive-going deflection at light offset that occurs in the photopic ERG. It is best seen when the light step is prolonged. In mammals, the d-wave is very prominent in the all-cone retina of the ground squirrel, as seen in the response to a long-duration stimulus in Fig. 7.17, and in the monkey retina, with its mixture of rods and cones, the d-wave, although less prominent, is easily identified when stimulus duration is extended, e.g., Figs 7.1 and 7.7. Although d-waves have been described in scotopic ERG of mammals, they are probably not “true” d-waves that, as described below, include a strong contribution from the offset of the cone photoreceptor, and the depolarization at light offset of OFF cone bipolar cells. In the predominantly rod-driven cat ERG, the small positive deflection that Granit32 called a “d-wave” occurred only in response to offset of very intense and long-duration stimuli for which the decay of the rod receptor potential appeared as a small positive deflection that followed, at light offset, the negative-going offset of PII.
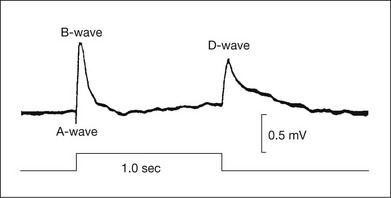
Fig. 7.17 Electroretinogram from the all-cone retina of the ground squirrel in response to a 1-second step. Recordings were made under light-adapted conditions between a contact lens electrode on the cornea and an electrode on the forehead. (Reproduced with permission from Arden GB, Tansley K. The spectral sensitivity of the pure-cone retina of the grey squirrel (Sciurus carolinensis leucotis). J Physiol 1955;127:592–602.)
Intraretinal analysis in monkey retina indicated that the corneal d-wave represents a combination of the rapid positive-going offset of the cone receptor potential followed by the negative-going offset of the b-wave.16,66 Although the early work on primate ERG cited above did not identify OFF bipolar cells as major contributors to the d-wave, more recent studies using intravitreal injection of glutamate analogs have demonstrated that these cells provide a significant portion of the response.35,94 Figs 7.10 and 7.16 both show that PDA, which blocks OFF bipolar cell responses, reduced the d-wave, eliminating it entirely when a large b-wave was present. The effect of PDA was not replicated by NMDA blockade of inner retinal cells, that also would have been affected by PDA, confirming a role of the OFF bipolar cells themselves. PDA, but not the blockade of inner retinal cells, also eliminated a small positive wave that occurs in the falling phase of the b-wave, or just after it, in the brief flash ERG in monkeys and humans, called the “i-wave.”95
Photopic hill
The stimulus response function acquired by measuring b-wave peak amplitudes in response to brief flashes over a range of increasing stimulus strengths has a characteristic inverted “U” shape. More specifically, Peachey et al.96 observed that the b-wave amplitude increased with increasing stimulus strength until it reached a peak and then decreased for stronger stimuli. This function was later named the “photopic hill” by Wali and Leguire.97 A model of the stimulus response function has indicated that the positive peak of the function is formed by addition of a saturating b-wave from ON pathway,98 and an early d-wave from OFF pathway, and this has been confirmed in experiments using glutamate analogs in macaques.99
Origin of the photopic fast-flicker ERG
Bush and Sieving100 used glutamate analogs to remove selectively postreceptoral ON and OFF pathway responses, as was done in studies of a-, b-, and d-waves. Intravitreal injection of APB to remove the b-wave left a delayed flicker response, reflecting OFF bipolar contribution. When both APB and PDA were used, the flicker response was practically eliminated. From experiments of this type they concluded that postreceptoral cells that normally produce the b- and d-waves are strong contributors to the fast-flicker response. Further experiments in macaques have more thoroughly investigated the interaction of the ON and OFF pathways over a wide range of temporal frequencies and stimulus conditions.101 The amplitude in both humans and macaques dips around 12 Hz, as ON and OFF inputs cancel, and it reaches a peak around 50 Hz. Other studies have demonstrated a small inner retinal contribution to the flicker response, and particularly to the second harmonic component of the response, which has a strong input from TTX-sensitive sodium-dependent spiking activity of ganglion and perhaps amacrine cells.102
Origin of the multifocal ERG
Multifocal electroretinography (mfERG) was developed by Sutter and Tran103 as a means of recording many focal retinal responses simultaneously in a brief time period (e.g., 7 minutes) to achieve a topographical array of little ERGs. Recording ERGs from many different focal regions of the retina otherwise would be impractical, due to the time involved in averaging of the small signals. The common mfERG stimulus is an array of hexagons (e.g., 64 or 103 hexagons over 30–40° of central visual field). In the standard mode for stimulation each hexagon reverses in contrast, according to a predetermined random “m-sequence,” at the frame rate of the visual display monitor, often 75 Hz for CRTs and 60 Hz for LCD displays. At any given time, each hexagon has a 50% chance of being light or dark. The m-sequence for all hexagons is the same, except for a specific and unique lag (number of frames) in initiation of the sequence for each hexagon, to allow extraction of the locally generated response by a correlation approach. The resulting “first-order” focal ERGs to the rapidly changing stimulation look similar but not identical to full-field flash ERGs that integrate responses over a longer period of time. The mfERG is generally recorded under photopic conditions, for which the foveal response is large, and is useful for detecting local changes in function that may not be detected in a full-field ERG, such as those that occur in macular dystrophies.
Experiments using intravitreal injections of glutamate analogs, APB, and PDA in macaques showed that, despite differences in the mfERG and full-field flash ERG, the cellular origins of the major negative and positive waves are essentially the same in two types of ERG.104 The outcome of such experiments is shown in Fig. 7.18, where the findings from the experiments on macaque mfERG were applied to the human response. When blank frames were interposed so that flashes occurred every 100 or 200 ms, a complete ERG including OPs could form before the next m-frame. For this slow-sequence ERG, experiments in macaques again yielded origins similar to full-field flash ERG, and provided some evidence for spike-dependent oscillatory activity related to the optic nerve head component in the mfERG, proposed by Sutter and Bearse.105–107
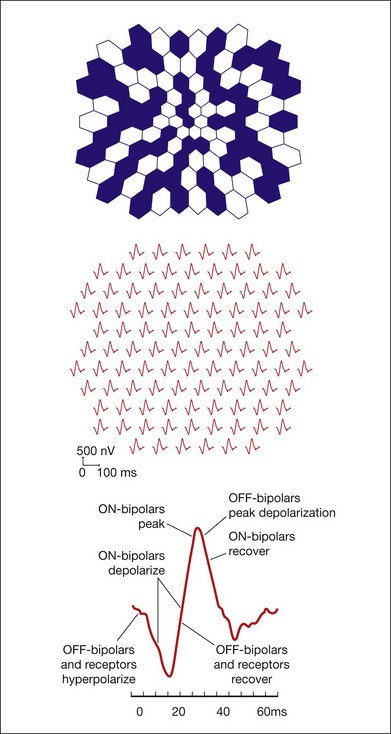
Fig. 7.18 Major components of the multifocal electroretinogram (mfERG). (A) mfERG trace array (field view) using 103 hexagons scaled with eccentricity and covering about 35° of visual angle, as illustrated above the traces. (B) Model for the retinal contributions to the human mfERG based on results from the macular region of a macaque after pharmacological separation of components. (Reproduced with permission from Hood DC, Frishman LJ, Saszik S, et al. Retinal origins of the primate multifocal ERG: implications for the human response. Invest Ophthalmol Vis Sci 2002;43:1673–85.)
ERG waves from proximal retina
Origin of the proximal negative response and the M-wave
The proximal negative response (PNR) is a light-evoked field potential recorded intraretinally in proximal retina, named and most fully described by Burkhardt.108 The PNR consists of a sharp, negative-going transient at onset and again at offset of a small light spot centered on the microelectrode tip placed in the IPL. It can be recorded in a range of vertebrate retinas, including the cat109 and primate.110 A PNR contribution to the transretinal ERG is necessarily small because the intraretinal response, which is largest in response to small spots, will be shunted through adjacent low-resistance retinal regions that are not activated by the light.
The M-wave, like the PNR, is a light-evoked field potential, recorded in proximal retina with microelectrodes in response to the onset and offset of a small well-centered spot, but it has a slower timecourse than the PNR. The M-wave was initially described in studies of amphibians,87 but also has been identified in the cat,23,92 as illustrated in Fig. 7.19.
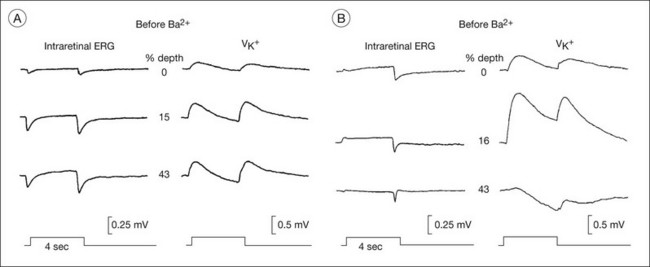
Fig. 7.19 Effect of Ba2+ on the M-wave of the light-adapted cat retina. Effect of intravitreal barium chloride (BaCl2+, 3 mM vitreal concentration) on the depth distribution of field potentials and [K+]o changes in light-adapted retina. Recordings were made before (A) and 30–60 minutes after (B) BaCl2+ was injected. The stimulus was a small spot (0.8° in diameter); steady background illumination was 10.5 log q deg2/s; flash illumination was 11.6 log q deg2/s. (Adapted from Frishman LJ, Yamamoto F, Bogucka J, et al. Light-evoked changes in [K+]o in proximal portion of light-adapted cat retina. J Neurophysiol 1992;67:1201–12.)
In retinas in which both an M-wave and a PNR can be recorded (amphibia and cats), the PNR is thought to be the transient neuronally generated portion of the proximal retinal response, while the slower M-wave reflects spatial buffer currents in Müller cells, generated as a consequence of K+ release from the same proximal neurons.23,87 As illustrated in Fig. 7.19, for cat, changes in [K+]o recorded in proximal retina show a similar timecourse to the simultaneously recorded field potentials. In isolated amphibian retina it was shown that the Kir channel blocker Ba2+ had only minor effects on light-evoked neural activity (PNR) and the proximal retinal [K+]o increase, but it blocked the M-wave and K+ spatial buffer currents.25 Similar findings in intact cat retina are illustrated in Fig. 7.19. Note that after intravitreal Ba2+ injection, the proximal [K+]o increase was larger, but the more distal increase seen in control records was absent. This is consistent with blockade by Ba2+ of spatial buffer currents that normally would carry the K+ away from proximal retina to the distal extracellular sinks where [K+]o was lower.
The local M-wave’s contribution to the transretinal ERG would be small. The contribution of the M-wave may be greater when periodic stimuli such as grating patterns that stimulate large regions of retina are used. Sieving and Steinberg111 showed that the M-wave is tuned to a spot diameter similar to the bar width of the optimal spatial frequency for the intraretinal pattern ERG (PERG) in the cat. The contribution of the proximal retina to the ERG can also be enhanced by using full-field stimulation.
Origin of the photopic negative response
In contrast to the PNR and M-wave, which provide small contributions at most to the transretinal ERG, negative-going responses from proximal retina to full-field stimulation are present in the corneal ERGs of several species, including cats, monkeys, and humans.40,63,92,93,112–114 These responses, called the PhNR, and STR are generated by mechanisms similar to those documented above for the M-wave.
The PhNR is a negative-going wave in the photopic ERG that occurs after the b-wave in response to a brief flash, and again after the d-wave in response to a long flash. It is more prominent in primates than in rodents. In humans and monkeys, the PhNR is thought to reflect spiking activity of retinal ganglion cells.113,114 As shown in Fig. 7.20, the PhNR is reduced in macaque eyes with experimental glaucoma (also after TTX injection)113 and in humans with primary open angle glaucoma. It is reduced in several other disorders affecting inner retina and optic nerve head as well. The slow timecourse of the PhNR suggests glial involvement, perhaps via K+ currents in astrocytes in the optic nerve head or Müller cells set up by increased [K+]o due to spiking of ganglion cells. In intraretinal microelectrode recordings in cats, local signals of the same timecourse as the PhNR were largest in and around the optic nerve head and the PhNR was disrupted in cats by Ba2+, indicating glial involvement in generation of the response (Viswanathan and Frishman, unpublished observations).
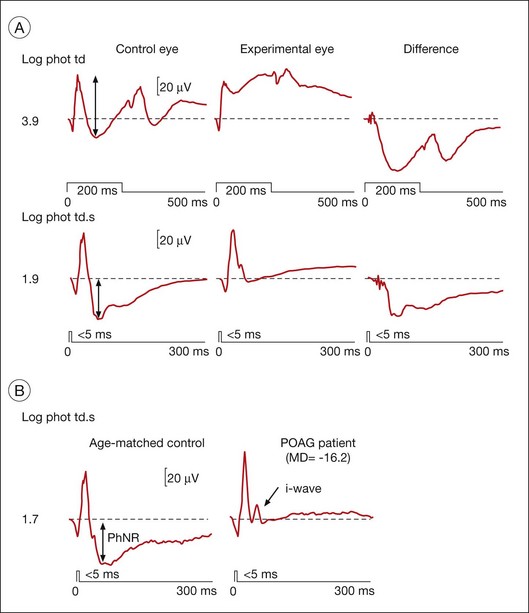
Fig. 7.20 Photopic negative response (PhNR) in macaque monkey and human in normal and glaucomatous eyes. (A) Full-field flash electroretinogram (ERG) showing the PhNR of a macaque in response to long (top) and brief (middle) red light-emitting diode (LED) flashes on a rod-saturating blue background (3.7 log sc td) from the control (left) and “experimental” (middle) fellow eye with laser-induced glaucoma, and the difference between control and experimental records (right). Arrows mark the amplitude of the PhNR. The mean deviation (MD, static perimetry, C24–2 full threshold program) for the experimental eye was −2.65 dB. (Adapted from Viswanathan S, Frishman LJ, Robson JG, et al. The photopic negative response of the macaque electroretinogram: reduction by experimental glaucoma. Invest Ophthalmol Vis Sci 1999;40:1124-36, with permission.) (B) Full-field flash ERGs of an age-matched 63-year-old normal human subject and a patient with primary open angle glaucoma (POAG) under similar stimulus conditions to those used above for monkeys. The MD (static perimetry, C24–2 full threshold program) for the patient’s eye was −16.2 dB. (Adapted from Viswanathan S, Frishman LJ, Robson JG, et al. The photopic negative response of the flash electroretinogram in primary open angle glaucoma. Invest Ophthalmol Vis Sci 2001;42:514–22.)
PhNRs can be evoked using white flashes on a white background, if the flash is strong enough. However a red LED flash on a blue background, as was used for ERGs shown in Fig. 7.20, elicits PhNRs over a wider range of stimulus strengths. The red flash may minimize spectral opponency that would reduce ganglion cell responses, and use of a blue background suppresses rods while minimizing light adaptation of L-cone signals.7 Blue stimuli on a yellow background which minimize spectral antagonism are good stimuli as well. The PhNR can be enhanced relative to other major ERG components, and can dominate the ERG when using focal stimuli in the region of the macula.115–117
Relation to the pattern ERG
The PERG has been the most commonly used noninvasive retinal measure of ganglion cell activity. It is a small response of a few microvolts elicited by contrast reversal of a bar grating or checkerboard pattern that shows some spatial tuning, consistent with a ganglion cell origin. In response to pattern stimulus, in which mean luminance does not change, the linear signals that produce a- and b-waves cancel, leaving only the nonlinear (mainly second harmonic) signals in the ERG. The PERG is eliminated by loss of ganglion cells as a consequence of optic nerve section.118 It has been used widely in clinical studies assessing ganglion cell function in eyes with glaucoma and other diseases of inner retina (see reviews by Holder117 and by Bach and Hoffmann116).
PERGs can be recorded as a transient response to low reversal frequencies (1–2 Hz) or as a steady-state response to higher frequencies, i.e., 8 Hz. For 1–2-Hz reversals of the pattern stimulus, a positive wave occurs within about 50 ms of each reversal (P50) and a negative wave, N95, is maximal at about 95 ms. The N95 is often reduced in glaucomatous eyes (the effects on the smaller P50 response are less consistent). Because the PhNR has a similar implicit time to the N95, Viswanathan et al.119 compared effects of experimental glaucoma and of TTX on the two responses in macaques, and found similar effects on both, indicating common retinal origins. Furthermore, the PERG waveform for a given stimulation frequency (2 or 8 Hz) could be simulated by adding together the ERGs at onset and offset of a uniform field, with strong contributions of PhNRs in generation of N95. More recent work using glutamate analogs and simulations has found that both ON and OFF pathways contribute equally to the transient PERG, but the ON pathway dominates the 8 Hz PERG.120
Origin of the scotopic threshold response
For very weak flashes from darkness, near psychophysical threshold in humans,33,90 small negative (n) and positive (p) STR dominate the ERG of most mammals that have been studied. This response, which is more sensitive than the b-wave (or a-wave) and saturates at a lower light level than either component, was thus named because of its sensitivity.63 As shown in Fig. 7.7, for the monkey and human, the nSTR at stimulus onset dominates the dark-adapted diffuse flash ERG in response to the weakest stimuli. The nSTR is distinct from the scotopic a-wave, although it can appear as a “pseudo a-wave” at light levels where it can be removed by suppressing inner retinal activity pharmacologically.121,122 The STRs occur in response to stimuli much weaker than those that elicit more distally generated waves of the ERG because convergence of the rod signal in the retinal circuitry increases the gain of responses generated by inner retinal neurons.
The nSTR was initially observed to be generated more proximally (IPL) than PII (INL) in intraretinal depth analysis studies in cats.63 As shown in Fig. 7.21, the field potential recorded in proximal retina in response to a weak diffuse stimulus was negative-going for the duration of the stimulus, and returned slowly to baseline after light offset. For stimuli too weak to elicit PII, the nSTR reversed polarity in midretina and became a positive-going signal in the mid- and distal retina. This reversal suggests a source proximal to, and a sink distal to, the reversal point (see description of the Müller cell mechanism, below). For stronger stimuli, the reversed nSTR in mid- and distal retina was replaced by PII, which then dominated the ERG. The similarity of the onset times and timecourse of the proximal retinal STR and the negative STR in the cat vitreal ERG can be seen in Fig. 7.21.
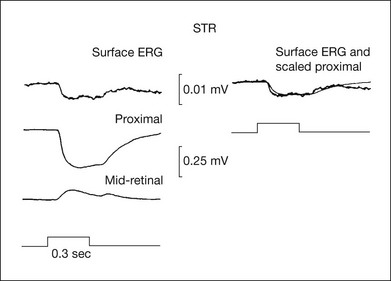
Fig. 7.21 The scotopic threshold response (STR) dominates intraretinal recordings and the electroretinogram (ERG) at low stimulus intensities below the threshold for the b-wave (PII). On the left, the top trace is the surface ERG recorded about 25 µm from the retinal surface, and the bottom two traces are recordings of the STR in the proximal retina (about 6% retinal depth) and the inverted STR around 50% retinal depth. On the right, the scaled STR recorded in the proximal retina is superimposed on the surface ERG to show the similarity of the responses. For the surface ERG, a microelectrode was referenced to a wire in the vitreous in order to reduce the effects of stray light. This minimized contributions to the ERG of retinal regions distant from the recording site of the intraretinal signals (spot diameter, 9.9°; spot illumination, 4.8 log q deg2/s). (Adapted from Sieving PA, Frishman LJ, Steinberg RH. Scotopic threshold response of proximal retina in cat. J Neurophysiol 1986;56:1049–61.)
The nSTR also can be separated from PII using pharmacologic agents (GABA, glycine, or NMDA30,90,121) to suppress responses of the amacrine and ganglion cells proximal to bipolar cells. These agents remove the STR, but not PII (Fig. 7.15). In contrast, APB eliminates both the scotopic b-wave (PII) and STR, indicating that the STR will not be generated if the primary rod circuit is no longer mediated by rod bipolar cells (Fig. 7.2).
There is a similarly sensitive positive STR in the scotopic ERG of animals that have a negative STR.40,90 Because the pSTR is small and of opposite polarity to the nSTR, it can easily be cancelled out in the ERG. An instance of this can be seen in the dark-adapted macaque ERG in Fig. 7.7. The delayed onset of nSTR for the weakest stimulus is due to the presence of a pSTR that is slightly larger than the nSTR at early times. In response to a stimulus about 1 log unit higher (just above), the pSTR rides on the emerging PII as an early positive potential. Most pharmacologic agents that eliminate the nSTR also eliminate the pSTR.40,90 For example, NMDA eliminated both the nSTR and pSTR in the macaque ERG for responses such as those seen for the two weakest stimuli in Fig. 7.7 (Frishman, unpublished observations).
A linear model of the contributions of pSTR, nSTR, and PII to the dark-adapted cat ERG is shown in Fig. 7.22. The model assumes that each ERG component initially rises in proportion to stimulus strength, and then saturates in a characteristic manner, as has been demonstrated in single-cell recordings in mammalian retinas, as well as for ERG a- and b-waves in numerous studies. Only with the inclusion of a small pSTR does the model accurately predict the whole ERG at a given “fixed” time in response to a weak stimulus. The model was fit in Fig. 7.22 to responses measured at 140 ms after a brief full-field flash (<5 ms), which was the peak of the nSTR in the cat scotopic ERG. Similar models have been applied to mouse90 and human ERG.40
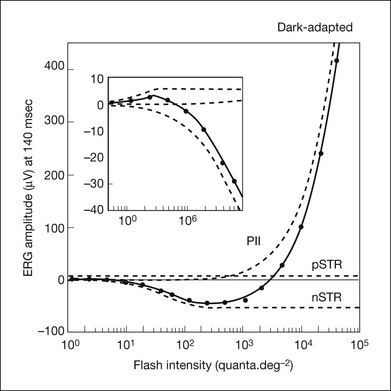
Fig. 7.22 Amplitude of cat dark-adapted electroretinogram responses measured 140 ms after a brief flash at the maximum negativity of the negative scotopic threshold response (nSTR). Dashed lines show model curves for the positive scotopic threshold response (pSTR), nSTR, and PII. Explicitly, the pSTR rises as a linear function that saturates abruptly at Vmax, while the exponential saturation of the nSTR is defined by:
 where Vmax is the maximum saturated amplitude, and Io is the intensity for an amplitude of (1 – 1/e)Vmax, while the hyperbolic relation used for PII is defined by:
where Vmax has the same meaning but Io is the intensity at which the amplitude is Vmax/2. The inset shows the pSTR and nSTR at the lowest light levels that were used. (1 q deg2 is equivalent to ~–7.5 log sc cd m2/s). (Adapted from Frishman LJ, Robson JG. Processing, adaptation to environmental light. In: Archer SN, Djamgoz MBA, Loew ER, et al., editors. Adaptive mechanisms in the ecology of vision. Dordrecht: Kluwer Academic.; 1999. p. 383–412, with permission.)
K+ Müller cell mechanism for generation of the STR
The STR, like the M-wave, is associated with Müller cell responses to [K+]o released by proximal retinal neurons. In intraretinal studies in cat, a proximal increase in [K+]o was observed that had clear similarities to the local STR that was simultaneously recorded: the dynamic range from “threshold” to saturation of the light-evoked proximal [K+]o increase was similar to that of the field potentials, and the retinal depth maxima for the two responses were the same.22,54 A causative role for the [K+]o increase in generating the nSTR (and a slow negative response in the vitreal ERG following the initial STR) was supported by the finding (Fig. 7.23) that Ba2+ removed the proximal retinal field potential and the nSTR in the ERG but did not, initially, eliminate the light-evoked increase in [K+]o. The cornea-negative polarity of the nSTR suggests a distally directed Müller cell K+ current (similar to M-wave and PIII currents in the vascularized cat retina). As noted above for the light-adapted M-wave, in the dark-adapted retina Ba2+ also appears to block K+ siphoning by the Müller cells. Whereas the proximal [K+]o increase remained intact when related field potentials were abolished, the distal [K+]o increase was eliminated by Ba2+.
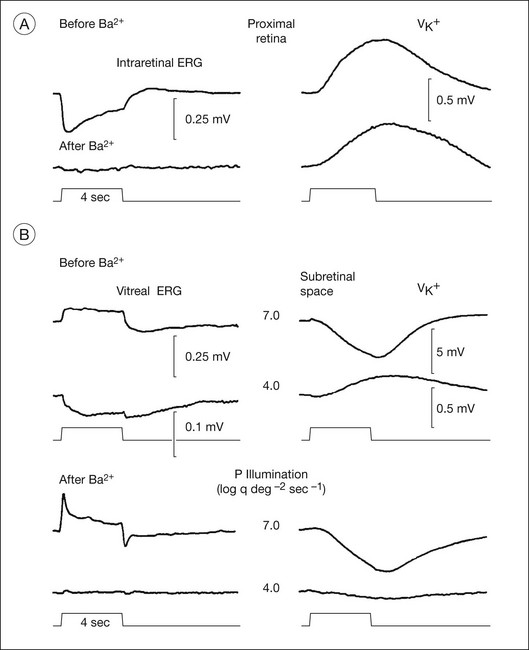
Fig. 7.23 Effect of Ba2+ on the scotopic threshold response (STR) and b-wave (PII) in scotopic electroretinogram (ERG) of the cat. (A) Effect of intravitreal Ba2+ (BaCl2, 3.9 mM vitreal concentration) on the intraretinal STR and slower K+-related negative response in response to a 4-second stimulus and the simultaneously recorded light-evoked decrease in [K+]o (VK+) in the proximal retina measured at 10% retinal depth, proximal to the peak K+ change at 17% depth. Top response was measured before Ba2+ and the bottom response 56 minutes after Ba2+ injection. (B) Effect of intravitreal BaCl2 (3.9 mM vitreal concentration) on the STR and slow negative response in the vitreal ERG (left) and the simultaneously recorded change in [K+]o in the subretinal space. Measurements of the amplitude of dark-adapted responses in the proximal retina and the light-evoked increase in [K+]o in proximal and distal retina before and after intravitreal injection of Ba2+ were made with double-barreled K+-sensitive microelectrodes. (Reproduced with permission from Frishman LJ, Steinberg RH. Light-evoked increases in [K+]o in proximal portion of the dark-adapted cat retina. J Neurophysiol 1989;61:1233–43.)
Neuronal origins of the STR
Whether the neurons involved in the genesis of the nSTR and pSTR are amacrine or ganglion cells is species-dependent. In monkeys it is likely that the nSTR arises predominantly from ganglion cells. It was absent in eyes in which the ganglion cells were eliminated as a consequence of experimental glaucoma112 and by intravitreal injection of TTX to block Na+-dependent spiking activity of those neurons; the pSTR remained intact. In contrast, in cats and humans122 as well as in rodents,3 the nSTR is not eliminated by ganglion cell loss, and thus may be more amacrine cell-based. In rodents the pSTR relies upon the integrity of ganglion cells. A characteristic of Müller/glial cell-mediated ERG components is their slow timecourse. Glial cell mediation of the nSTR was demonstrated most directly in cat, but the timecourse of the nSTR is slow in all species. Glial mediation may explain the similarity in timecourse of nSTR across species regardless of the particular type of neuron producing the local changes in proximal [K+]o that generate the response.
Origin of oscillatory potentials
The OPs of the ERG consist of a series of high-frequency, low-amplitude wavelets, mainly superimposed on the b-wave, that occur in response to strong stimulation. OPs are present under light- and dark-adapted conditions, with contributions from both rod- and cone-driven signals.123 The mixed rod–cone ERG in humans in the ISCEV standards in Fig. 7.4 shows at least four OPs that can be extracted with a filter with a low-frequency cutoff of 75 Hz. OPs are of postreceptoral origin, and occur in isolated retinas in the absence of the RPE.73 The number of OPs induced by a flash of light varies between about 4 and 10 depending upon species and stimulus conditions; the temporal frequency of the OPs varies as well. Figure 7.24 shows the photopic flash ERG of a macaque monkey (top); at least five OPs at frequency of about 150 Hz can be seen by filtering the response to extract the high-frequency signals.
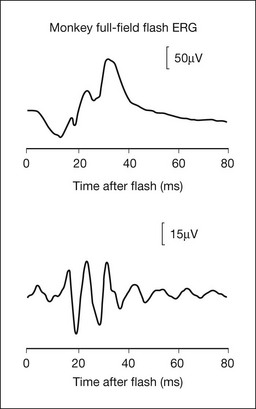
Fig. 7.24 Full-field flash photopic electroretinogram of a macaque monkey (top) and the oscillatory potentials (OPs) extracted from these records. Filtering was between 90 and 300 Hz for OPs that occurred between 100 and 200 Hz. The stimulus was a xenon flash presented on a rod-saturating blue background. (Adapted from Rangaswamy NV, Hood DC, Frishman LJ. Regional variations in local contributions to the primate photopic flash ERG: revealed using the slow-sequence mfERG. Invest Ophthalmol Vis Sci 2003;44:3233–47).
Do all the OPs have the same origin?
In amphibia, where early studies were done, the various OPs do not all have the same origin. Depth profiles from isolated frog retina showed that the earliest OPs in the response arose near the IPL whereas the later OPs arose more distally, perhaps in the INL. Studies of Wachmeister124 in amphibian retina also found that earlier OPs were depressed by GABA antagonists, the dopamine antagonist haloperidol, β-alanine, and substance P, whereas later OPs were depressed by the glycine antagonist strychnine and by ethanol.
In primates, intraretinal studies using stimuli that would elicit responses from both rod and cone systems did not find differences in the depth profiles of the different OPs.44,125 Considering the complexity of inner retinal circuitry, the similarity in depth profiles does not necessarily mean that the same neurons were involved in all cases. For example, in the photopic flash ERG response to brief stimuli, the major OPs are APB-sensitive in primates and other mammals, indicating an origin in the ON pathways, but later OPs and at light offset originate in the OFF pathway.105,126 Such a difference could lead to differences in the depth distribution in the IPL which is stratified in outer OFF sublamina and inner ON sublamina.
Pharmacologic agents that block inner retinal activity, such as glycine and GABA, remove OPs in mammals, as does PDA,105 but the effects were not reported to be specific for given OPs. On the other hand, genetic deletion of a major GABA receptor in the IPL, the GABAC receptor, enhances the OPs.127
Which cells generate the OPs?
The observations described above indicate that amacrine or perhaps, in some instances, retinal ganglion cells are involved in generating OPs. A study of rabbit ERG indicates a distal to proximal progression in origin, with the late but not early OPs having input from spiking cells.126 The role of ganglion cells in the generation of OPs has been controversial, with inconsistent reports on the effects of ganglion cell loss on OPs. In Ogden’s studies in primates, optic nerve section resulted in ganglion cell degeneration and disappearance of the OPs, and antidromic stimulation of the optic nerve reduced OP amplitudes.125 Further, in the primate photopic ERG elicited using a multifocal paradigm with a slow sequence to allow formation of OPs, both TTX and experimental glaucoma removed or reduced a high-frequency band of OPs, while affecting a lower-frequency band less.105,106 It is possible in primates that high-frequency OPs (centered around 150 Hz, compared to >100 Hz for the lower-frequency band) under fully photopic conditions reflect activity in ganglion cell axons, and the manifestation of an optic nerve head component of the ERG. Under conditions where rod signals are also involved, the ganglion cell contribution may be less prominent. In other mammals, TTX-sensitive OPs may be among the late ones.
What mechanisms are involved in generating OPs?
Neuronal interaction; inhibitory feedback circuits: Two mechanisms are commonly proposed for generating OPs: neuronal interactions/feedback circuits, and the intrinsic membrane properties of cells, both of which implicate amacrine cells. The case for an inhibitory feedback mechanism is supported by involvement of receptors for GABA and glycine, which are prominent in feedback circuits in the inner retina. Gap junctions between inner retinal neurons can also be involved in feedforward mechanism.
OPs in intracellular responses from neurons: In retinal intracellular recordings from many different species, high-frequency oscillations have rarely been observed in responses of photoreceptors, horizontal, or bipolar cells. In contrast, membrane oscillations have been observed in recordings from amacrine cells, especially in turtle and fish retina. For example, GABAergic wide-field ACs isolated from white bass retina generated oscillatory membrane potentials in response to extrinsic depolarization, as illustrated in Fig. 7.25, that reached more than 100 Hz for strong depolarization. Analysis of the mechanism of generation of the oscillatory membrane potentials in these isolated cells indicated that they arose from “a complex interplay between voltage-dependent Ca2+ currents and voltage- and Ca2+-dependent K+ currents.”128
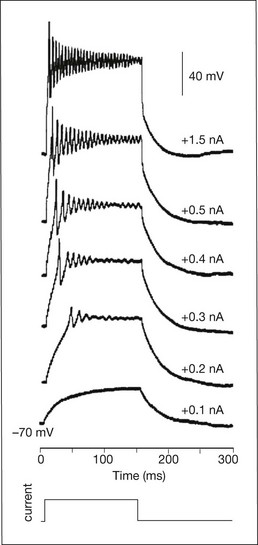
Fig. 7.25 Oscillatory potentials of isolated wide-field amacrine cells in the white perch retina. Oscillatory membrane potentials (OMPs) were elicited by depolarizing current steps of increasing amplitude obtained in whole-cell recordings from isolated amacrine cells that were maintained in culture. The duration and frequency of the OMPs increased with depolarization. Voltage traces are shifted vertically for visibility. Bottom: application of depolarizing pulse. The magnitude of depolarizing current is indicated with each trace. Holding potential was –70 mV. (Reproduced with permission from Vigh J, Solessio E, Morgans CW, et al. Ionic mechanisms mediating oscillatory membrane potentials in wide-field retinal amacrine cells. J Neurophysiol 2003;90:431–43.)
Closing remarks
This chapter has reviewed the increasingly specific information about the electrogenesis of the ERG that has become available as our understanding of retinal microcircuitry and cellular and synaptic mechanisms has increased. Due to the extensive research on ERG, it has become feasible to use it to assess retinal function at every level, from the RPE to the optic nerve head; also see other recent reviews on this subject.3,129–131 Tables 7.1 and 7.2 summarize our current understanding of the origins of ERGs recorded in standard and specialized tests. Continued refinement of stimuli, protocols, and analysis will further enhance the power of this noninvasive tool in the laboratory and the clinic.
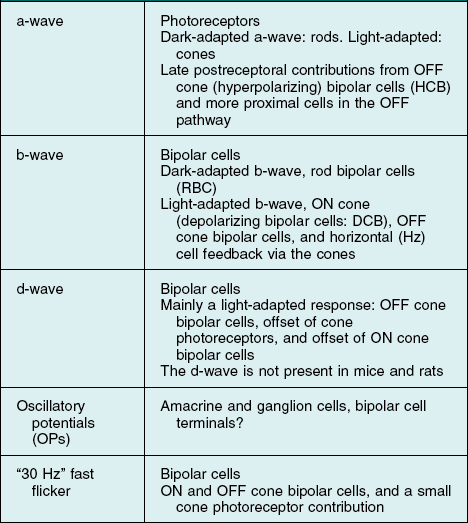
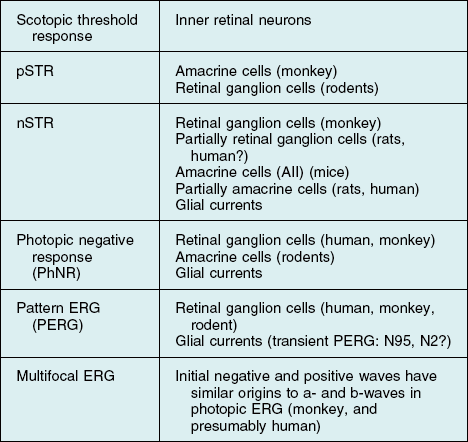
References
1. Frishman, LJ. Origins of the ERG. In: Heckenlively J, Arden GB, eds. Principles and practice of clinical electrophysiology of vision. 2nd ed. Cambridge, MA: MIT Press; 2006:139–183.
2. Frishman, LJ. Electrogenesis of the ERG. In: Ryan SJ, ed. Retina. 4th ed. St Louis, MO: Elsevier/Mosby; 2005:103–135.
3. Frishman, LJ, Wang, MH. Electroretinogram of human, monkey and mouse. In: Kaufman PL, Alm A, eds. Adler’s physiology of the eye. 11th ed. Edinburgh: Elsevier; 2011:480–501.
4. Dawson, WW, Trick, GL, Litzkow, CA. Improved electrode for electroretinography. Invest Ophthalmol Vis Sci. 1979;18:988–991.
5. Hawlina, M, Konec, B. New noncorneal HK-loop electrode for clinical electroretinography. Doc Ophthalmol. 1992;81:253–259.
6. Evers, HU, Gouras, P. Three cone mechanisms in the primate electroretinogram: two with, one without off-center bipolar responses. Vision res. 1986;26:245–254.
7. Rangaswamy, NV, Shirato, S, Kaneko, M, et al. Effects of spectral characteristics of Ganzfeld stimuli on the photopic negative response (PhNR) of the ERG. Invest Ophthalmol Vis Sci. 2007;48:4818–4828.
8. Newman, EA. Membrane physiology of retinal glial (Müller) cells. J Neurosci. 1985;5:2225–2239.
9. Connors, NC, Kofuji, P. Potassium channel Kir4.1 macromolecular complex in retinal glial cells. Glia. 2006;53:124–131.
10. Newman, EA, Frambach, DA, Odette, LL. Control of extracellular potassium levels by retinal glial cell K+ siphoning. Science. 1984;225:1174–1175.
11. Newman, E, Reichenbach, A. The Müller cell: a functional element of the retina. Trends Neurosci. 1996;19:307–312.
12. Kofuji, P, Biedermann, B, Siddharthan, V, et al. Kir potassium channel subunit expression in retinal glial cells: implications for spatial potassium buffering. Glia. 2002;39:292–303.
13. Brown, KT, Wiesel, TN. Localization of origins of electroretinogram components by intraretinal recording in the intact cat eye. J Physiol. 1961;158:257–280.
14. Ogden, TE, Ito, H. Avian retina. II. An evaluation of retinal electrical anisotropy. J Neurophysiol. 1971;34:367–373.
15. Karwoski, CJ, Frambach, DA, Proenza, LM. Laminar profile of resistivity in frog retina. J Neurophysiol. 1985;54:1607–1619.
16. Brown, KT. The electroretinogram: its components and their origins. Vision res. 1968;8:633–677.
17. Freeman, JA, Nicholson, C. Experimental optimization of current source-density technique for anuran cerebellum. J Neurophysiol. 1975;38:369–382.
18. Heynen, H, van Norren, D. Origin of the electroretinogram in the intact macaque eye–II. Current source-density analysis. Vision Res. 1985;25:709–715.
19. Xu, X, Karwoski, CJ. Current source density (CSD) analysis of retinal field potentials. I. Methodological considerations and depth profiles. J Neurophysiol. 1994;72:84–95.
20. Dick, E, Miller, RF. Extracellular K+ activity changes related to electroretinogram components. I. Amphibian (I-type) retinas. J Gen Physiol. 1985;85:885–909.
21. Dick, E, Miller, RF, Bloomfield, S. Extracellular K+ activity changes related to electroretinogram components. II. Rabbit (E-type) retinas. J Gen Physiol. 1985;85:911–931.
22. Frishman, LJ, Steinberg, RH. Light-evoked increases in [K+]o in proximal portion of the dark-adapted cat retina. J Neurophysiol. 1989;61:1233–1243.
23. Frishman, LJ, Yamamoto, F, Bogucka, J, et al. Light-evoked changes in [K+]o in proximal portion of light-adapted cat retina. J Neurophysiol. 1992;67:1201–1212.
24. Oakley, B, 2nd., Green, DG. Correlation of light-induced changes in retinal extracellular potassium concentration with c-wave of the electroretinogram. J Neurophysiol. 1976;39:1117–1133.
25. Karwoski, CJ, Lu, HK, Newman, EA. Spatial buffering of light-evoked potassium increases by retinal Müller (glial) cells. Science. 1989;244:578–580.
26. Halgrimson, CG, Wilson, CB, Dixon, FJ, et al. Goodpasture’s syndrome. Treatment with nephrectomy and renal transplantation. Arch Surg. 1971;103:283–289.
27. Newman, EA. Potassium conductance block by barium in amphibian Müller cells. Brain Res. 1989;498:308–314.
28. Kofuji, P, Ceelen, P, Zahs, KR, et al. Genetic inactivation of an inwardly rectifying potassium channel (Kir4.1 subunit) in mice: phenotypic impact in retina. J Neurosci. 2000;20:5733–5740.
29. Penn, RD, Hagins, WA. Signal transmission along retinal rods and the origin of the electroretinographic a-wave. Nature. 1969;223:201–204.
30. Robson, JG, Frishman, LJ. Response linearity and kinetics of the cat retina: the bipolar cell component of the dark-adapted electroretinogram. Vis Neurosci. 1995;12:837–850.
31. Robson, JG, Maeda, H, Saszik, SM, et al. In vivo studies of signaling in rod pathways of the mouse using the electroretinogram. Vision Res. 2004;44:3253–3268.
32. Granit, R. The components of the retinal action potential in mammals and their relation to the discharge in the optic nerve. J Physiol. 1933;77:207–239.
33. Bush, RA, Sieving, PA. A proximal retinal component in the primate photopic ERG a-wave. Invest Ophthalmol Vis Sci. 1994;35:635–645.
34. Robson, JG, Saszik, SM, Ahmed, J, et al. Rod and cone contributions to the a-wave of the electroretinogram of the macaque. J Physiol. 2003;547:509–530.
35. Sieving, PA, Murayama, K, Naarendorp, F. Push-pull model of the primate photopic electroretinogram: a role for hyperpolarizing neurons in shaping the b-wave. Vis Neurosci. 1994;11:519–532.
36. Breton, ME, Schueller, AW, Lamb, TD, et al. Analysis of ERG a-wave amplification and kinetics in terms of the G-protein cascade of phototransduction. Invest Ophthalmol Vis Sci. 1994;35:295–309.
37. Hood, DC, Birch, DG. A quantitative measure of the electrical activity of human rod photoreceptors using electroretinography. Vis Neurosci. 1990;5:379–387.
38. Hood, DC, Birch, DG. The A-wave of the human electroretinogram and rod receptor function. Invest Ophthalmol Vis Sci. 1990;31:2070–2081.
39. Robson, JG, Frishman, LJ. The a-wave of the electroretinogram: importance of axonal currents. ARVO E-abstracts. 2011:692.
40. Frishman, LJ, Reddy, MG, Robson, JG. Effects of background light on the human dark-adapted electroretinogram and psychophysical threshold. J Opt Soc Am A Opt Image Sci Vis. 1996;13:601–612.
41. Saszik, S, Alexander, A, Lawrence, T, et al. APB differentially affects the cone contributions to the zebrafish ERG. Vis Neurosci. 2002;19:521–529.
42. Marmor, MF, Fulton, AB, Holder, GE, et al. ISCEV standard for full-field clinical electroretinography (2008 update). Doc Ophthalmol. 2009;118:69–77.
43. Steinberg, RH, Linsenmeier, RA, Griff, ER. Retinal pigment epithelial cell contributions to the electroretinogram and electrooculogram. Prog Retin Res. 1985;4:33–66.
44. Heynen, H, Wachtmeister, L, van Norren, D. Origin of the oscillatory potentials in the primate retina. Vision Res. 1985;25:1365–1373.
45. Noell, W. Studies on the electrophysiology and the metabolism of the retina. USAF SAM project no 21-2101-004. United States Airforce: Randolph Field, TX; 1953.
46. Sillman, AJ, Ito, H, Tomita, T. Studies on the mass receptor potential of the isolated frog retina. I. General properties of the response. Vision Res. 1969;9:1435–1442.
47. Valeton, JM, van Norren, D. Intraretinal recordings of slow electrical responses to steady illumination in monkey: isolation of receptor responses and the origin of the light peak. Vision Res. 1982;22:393–399.
48. Bolnick, DA, Walter, AE, Sillman, AJ. Barium suppresses slow PIII in perfused bullfrog retina. Vision Res. 1979;19:1117–1119.
49. Hu, KG, Marmor, MF. Selective actions of barium on the c-wave and slow negative potential of the rabbit eye. Vision Res. 1984;24:1153–1156.
50. Witkovsky, P, Dudek, FE, Ripps, H. Slow PIII component of the carp electroretinogram. J Gen Physiol. 1975;65:119–134.
51. Sillman, AJ, Ito, H, Tomita, T. Studies on the mass receptor potential of the isolated frog retina. II. On the basis of the ionic mechanism. Vision Res. 1969;9:1443–1451.
52. Faber, D. Analysis of slow transretinal potentials in response to light. PhD thesis. Buffalo: University of New York; 1969.
53. Karwoski, CJ, Proenza, LM. Relationship between Müller cell responses, a local transretinal potential, and potassium flux. J Neurophysiol. 1977;40:244–259.
54. Frishman, LJ, Steinberg, RH. Intraretinal analysis of the threshold dark-adapted ERG of cat retina. J Neurophysiol. 1989;61:1221–1232.
55. Hanitzsch, R. Intraretinal isolation of P3 subcomponents in the isolated rabbit retina after treatment with sodium aspartate. Vision Res. 1973;13:2093–2102.
56. Miller, SS, Steinberg, RH. Passive ionic properties of frog retinal pigment epithelium. J Membr Biol. 1977;36:337–372.
57. Oakley, B, 2nd., Steinberg, RH, Miller, SS, et al. The in vitro frog pigment epithelial cell hyperpolarization in response to light. Invest Ophthalmol Vis Sci. 1977;16:771–774.
58. Gallemore, RP, Steinberg, RH. Light-evoked modulation of basolateral membrane Cl– conductance in chick retinal pigment epithelium: the light peak and fast oscillation. J Neurophysiol. 1993;70:1669–1680.
59. Quinn, RH, Quong, JN, Miller, SS. Adrenergic receptor activated ion transport in human fetal retinal pigment epithelium. Invest Ophthalmol Vis Sci. 2001;42:255–264.
60. Wu, J, Marmorstein, AD, Striessnig, J, et al. Voltage-dependent calcium channel CaV1.3 subunits regulate the light peak of the electroretinogram. J Neurophysiol. 2007;97:3731–3735.
61. Gallemore RP, Hughes BA, Miller SS, eds. Light-induced responses of the retinal pigment epithelium. New York: Oxford University Press, 1998.
62. Dawis, SM, Niemeyer, G. Dopamine influences the light peak in the perfused mammalian eye. Invest Ophthalmol Vis Sci. 1986;27:330–335.
63. Sieving, PA, Frishman, LJ, Steinberg, RH. Scotopic threshold response of proximal retina in cat. J Neurophysiol. 1986;56:1049–1061.
64. Wakabayashi, K, Gieser, J, Sieving, PA. Aspartate separation of the scotopic threshold response (STR) from the photoreceptor a-wave of the cat and monkey ERG. Invest Ophthalmol Vis Sci. 1988;29:1615–1622.
65. Brown, KT, Wiesel, TN. Analysis of the intraretinal electroretinogram in the intact cat eye. J Physiol. 1961;158:229–256.
66. Brown, KT, Watanabe, K, Murakami, M. The early and late receptor potentials of monkey cones and rods. Cold Spring Harbor Symposia Quant Biol. 1965;30:457–482.
67. Penn, RD, Hagins, WA. Kinetics of the photocurrent of retinal rods. Biophys J. 1972;12:1073–1094.
68. Pugh, EN, Jr., Falsini, B, Lyubarsky, A. The origin of the major rod- and cone-driven components of the rodent electroretinogram and the effects of age and light-rearing history on the magnitude of these components. Photostasis and related phenomena. New York: Plenum Press; 1998.
69. Baylor, DA, Nunn, BJ, Schnapf, JL. The photocurrent, noise and spectral sensitivity of rods of the monkey Macaca fascicularis. J Physiol. 1984;357:575–607.
70. Lamb, TD, Pugh, EN, Jr. A quantitative account of the activation steps involved in phototransduction in amphibian photoreceptors. J Physiol. 1992;449:719–758.
71. Hood, DC, Birch, DG. Light adaptation of human rod receptors: the leading edge of the human a-wave and models of rod receptor activity. Vision Res. 1993;33:1605–1618.
72. Hood, DC, Birch, DG. Human cone receptor activity: the leading edge of the a-wave and models of receptor activity. Vis Neurosci. 1993;10:857–871.
73. Yonemura, D, Kawasaki, K, Shibata, N. The electroretinographic PIII component of the human excised retina. Jpn J Ophthalmol. 1974;18:322–333.
74. Slaughter, MM, Miller, RF. An excitatory amino acid antagonist blocks cone input to sign-conserving second-order retinal neurons. Science. 1983;219:1230–1232.
75. Friedburg, C, Allen, CP, Mason, PJ, et al. Contribution of cone photoreceptors and post-receptoral mechanisms to the human photopic electroretinogram. J Physiol. 2004;556:819–834.
76. Jamison, JA, Bush, RA, Lei, B, et al. Characterization of the rod photoresponse isolated from the dark-adapted primate ERG. Vis Neurosci. 2001;18:445–455.
77. Robson, JG, Frishman, LJ. Dissecting the dark-adapted electroretinogram. Doc Ophthalmol. 1998;95:187–215.
78. Pepperberg, DR, Birch, DG, Hood, DC. Photoresponses of human rods in vivo derived from paired-flash electroretinograms. Vis Neurosci. 1997;14:73–82.
79. Stockton, RA, Slaughter, MM. B-wave of the electroretinogram. A reflection of ON bipolar cell activity. J Gen Physiol. 1989;93:101–122.
80. Knapp, AG, Schiller, PH. The contribution of on-bipolar cells to the electroretinogram of rabbits and monkeys. A study using 2-amino-4-phosphonobutyrate (APB). Vision Res. 1984;24:1841–1846.
81. Bech-Hansen, NT, Naylor, MJ, Maybaum, TA, et al. Mutations in NYX, encoding the leucine-rich proteoglycan nyctalopin, cause X-linked complete congenital stationary night blindness. Nature genet. 2000;26:319–323.
82. McCall, MA, Gregg, RG. Comparisons of structural and functional abnormalities in mouse b-wave mutants. J Physiol. 2008;586:4385–4392.
83. Newman, EA, Odette, LL. Model of electroretinogram b-wave generation: a test of the K+ hypothesis. J Neurophysiol. 1984;51:164–182.
84. Miller, RF, Dowling, JE. Intracellular responses of the Müller (glial) cells of mudpuppy retina: their relation to b-wave of the electroretinogram. J Neurophysiol. 1970;33:323–341.
85. Kline, RP, Ripps, H, Dowling, JE. Light-induced potassium fluxes in the skate retina. Neuroscience. 1985;14:225–235.
86. Wen, R, Oakley, B, 2nd. K(+)-evoked Müller cell depolarization generates b-wave of electroretinogram in toad retina. Proc Natl Acad Sci USA. 1990;87:2117–2121.
87. Karwoski, CJ, Proenza, LM. Neurons, potassium, and glia in proximal retina of Necturus. J Gen Physiol. 1980;75:141–162.
88. Xu, X, Karwoski, CJ. Current source density analysis of retinal field potentials. II. Pharmacological analysis of the b-wave and M-wave. J Neurophysiol. 1994;72:96–105.
89. Karwoski, CJ, Xu, X. Current source-density analysis of light-evoked field potentials in rabbit retina. Vis Neurosci. 1999;16:369–377.
90. Saszik, SM, Robson, JG, Frishman, LJ. The scotopic threshold response of the dark-adapted electroretinogram of the mouse. J Physiol. 2002;543:899–916.
91. Cameron, AM, Mahroo, OA, Lamb, TD. Dark adaptation of human rod bipolar cells measured from the b-wave of the scotopic electroretinogram. J Physiol. 2006;575:507–526.
92. Sieving, PA, Frishman, LJ, Steinberg, RH. M-wave of proximal retina in cat. J Neurophysiol. 1986;56:1039–1048.
93. Sieving, PA, Nino, C. Scotopic threshold response (STR) of the human electroretinogram. Invest Ophthalmol Vis Sci. 1988;29:1608–1614.
94. Ueno, S, Kondo, M, Ueno, M, et al. Contribution of retinal neurons to d-wave of primate photopic electroretinograms. Vision Res. 2006;46:658–664.
95. Rangaswamy, NV, Frishman, LJ, Dorotheo, EU, et al. Photopic ERGs in patients with optic neuropathies: comparison with primate ERGs after pharmacologic blockade of inner retina. Invest Ophthalmol Vis Sci. 2004;45:3827–3837.
96. Peachey, NS, Alexander, KR, Fishman, GA, et al. Properties of the human cone system electroretinogram during light adaptation. Appl Opt. 1989;28:1145–1150.
97. Wali, N, Leguire, LE. The photopic hill: a new phenomenon of the light adapted electroretinogram. Doc Ophthalmol. 1992;80:335–345.
98. Hamilton, R, Bees, MA, Chaplin, CA, et al. The luminance-response function of the human photopic electroretinogram: a mathematical model. Vision Res. 2007;47:2968–2972.
99. Ueno, S, Kondo, M, Niwa, Y, et al. Luminance dependence of neural components that underlies the primate photopic electroretinogram. Invest Ophthalmol Vis Sci. 2004;45:1033–1040.
100. Bush, RA, Sieving, PA. Inner retinal contributions to the primate photopic fast flicker electroretinogram. J Opt Soc Am A Opt Image Sci Vis. 1996;13:557–565.
101. Kondo, M, Sieving, PA. Primate photopic sine-wave flicker ERG: vector modeling analysis of component origins using glutamate analogs. Invest Ophthalmol Vis Sci. 2001;42:305–312.
102. Viswanathan, S, Frishman, LJ, Robson, JG. Inner-retinal contributions to the photopic sinusoidal flicker electroretinogram of macaques. Macaque photopic sinusoidal flicker ERG. Doc Ophthalmol. 2002;105:223–242.
103. Sutter, EE, Tran, D. The field topography of ERG components in man–I. The photopic luminance response. Vision Res. 1992;32:433–446.
104. Hood, DC, Frishman, LJ, Saszik, S, et al. Retinal origins of the primate multifocal ERG: implications for the human response. Invest Ophthalmol Vis Sci. 2002;43:1673–1685.
105. Rangaswamy, NV, Hood, DC, Frishman, LJ. Regional variations in local contributions to the primate photopic flash ERG: revealed using the slow-sequence mfERG. Invest Ophthalmol Vis Sci. 2003;44:3233–3247.
106. Rangaswamy, NV, Zhou, W, Harwerth, RS, et al. Effect of experimental glaucoma in primates on oscillatory potentials of the slow-sequence mfERG. Invest Ophthalmol Vis Sci. 2006;47:753–767.
107. Sutter, EE, Bearse, MA, Jr. The optic nerve head component of the human ERG. Vision Res. 1999;39:419–436.
108. Burkhardt, DA. Proximal negative response of frog retina. J Neurophysiol. 1970;33:405–420.
109. Frishman, LJ, Steinberg, RH. Origin of negative potentials in the light-adapted ERG of cat retina. J Neurophysiol. 1990;63:1333–1346.
110. Ogden, TE. The proximal negative response of the primate retina. Vision Res. 1973;13:797–807.
111. Sieving, PA, Steinberg, RH. Proximal retinal contribution to the intraretinal 8-Hz pattern ERG of cat. J Neurophysiol. 1987;57:104–120.
112. Frishman, LJ, Shen, FF, Du, L, et al. The scotopic electroretinogram of macaque after retinal ganglion cell loss from experimental glaucoma. Invest Ophthalmol Vis Sci. 1996;37:125–141.
113. Viswanathan, S, Frishman, LJ, Robson, JG, et al. The photopic negative response of the macaque electroretinogram: reduction by experimental glaucoma. Invest Ophthalmol Vis Sci. 1999;40:1124–1136.
114. Viswanathan, S, Frishman, LJ, Robson, JG, et al. The photopic negative response of the flash electroretinogram in primary open angle glaucoma. Invest Ophthalmol Vis Sci. 2001;42:514–522.
115. Kondo, M, Kurimoto, Y, Sakai, T, et al. Recording focal macular photopic negative response (PhNR) from monkeys. Invest Ophthalmol Vis Sci. 2008;49:3544–3550.
116. Bach, M, Hoffmann, MB. Update on the pattern electroretinogram in glaucoma. Optom Vis Sci. 2008;85:386–395.
117. Holder, GE. Pattern electroretinography (PERG) and an integrated approach to visual pathway diagnosis. Prog Retin Eye Res. 2001;20:531–561.
118. Maffei, L, Fiorentini, A, Bisti, S, et al. Pattern ERG in the monkey after section of the optic nerve. Exp Brain Res. 1985;59:423–425.
119. Viswanathan, S, Frishman, LJ, Robson, JG. The uniform field and pattern ERG in macaques with experimental glaucoma: removal of spiking activity. Invest Ophthalmol Vis Sci. 2000;41:2797–2810.
120. Luo, X, Frishman, LJ. Retinal pathway origins of the pattern electroretinogram (PERG). Invest Ophthalmol Vis Sci. 2011;52:8571–8584.
121. Naarendorp, F, Sieving, PA. The scotopic threshold response of the cat ERG is suppressed selectively by GABA and glycine. Vision Res. 1991;31:1–15.
122. Sieving, PA. Retinal ganglion cell loss does not abolish the scotopic threshold response (STR) of the cat and human ERG. Clin Vis Sci. 1991;2:149–158.
123. Peachey, NS, Alexander, KR, Fishman, GA. Rod and cone system contributions to oscillatory potentials: an explanation for the conditioning flash effect. Vision Res. 1987;27:859–866.
124. Wachtmeister, L. Oscillatory potentials in the retina: what do they reveal. Prog retinal eye res. 1998;17:485–521.
125. Ogden, TE. The oscillatory waves of the primate electroretinogram. Vision Res. 1973;13:1059–1074.
126. Dong, CJ, Agey, P, Hare, WA. Origins of the electroretinogram oscillatory potentials in the rabbit retina. Vis Neurosci. 2004;21:533–543.
127. McCall, MA, Lukasiewicz, PD, Gregg, RG, et al. Elimination of the rho1 subunit abolishes GABA(C) receptor expression and alters visual processing in the mouse retina. J Neurosci. 2002;22:4163–4174.
128. Vigh, J, Solessio, E, Morgans, CW, et al. Ionic mechanisms mediating oscillatory membrane potentials in wide-field retinal amacrine cells. J Neurophysiol. 2003;90:431–443.
129. Heckenlively, J, Arden, GB. Principles and practice of clinical electrophysiology of vision, 2nd ed. Cambridge, MA: MIT Press; 2006.
130. Fishman, GA, Birch, DG, Holder, GE, et al. Electrophysiological testing in disorders of the retina, optic nerve, and visual pathways, 2nd ed. Singapore: American Academy of Ophthalmology; 2001.
131. Lam, BL. Electrophysiology of vision; clinical testing and applications. Boca Raton, FL: Taylor and Francis Group; 2005.