Visual Acuity and Contrast Sensitivity
Visual acuity tests
Given the variety of its applications, it is not surprising that many different types of visual acuity tests have evolved. Generally, these tests were developed with little concern for standardization. Since the 1980s, several attempts have been made to formulate standards for test design and administration. The Committee on Vision of the National Academy of Sciences-National Research Council (NAS-NRC)1 has published standards for clinical testing of visual acuity that are widely adopted in the USA, and the British Standards Institution2 has published similar standards for the UK. The NAS-NRC standards are used as the basis of this chapter.
Chart design
Most familiar acuity tests require the subject to identify letters arrayed in rows of decreasing size. The so-called Snellen acuity test is the prime example, although Snellen acuity now usually refers to a way of reporting test results rather than to any particular type of chart. To facilitate testing of young children and people unfamiliar with the Latin alphabet, other optotype tests based on the tumbling E, Landolt C, numerals, or simple pictures of familiar objects are also used. Visual acuity can also be assessed with grating patterns, but grating acuity often overestimates Snellen acuity in patients with age-related maculopathy,3 typically by a factor of 2 or more.
There are several advantages to the Landolt C test, including equal difficulty of all targets (unlike letters that vary in degree of difficulty), sensitivity to astigmatic refractive error, and suitability for use with illiterate subjects. However, the Landolt C test is not widely used because it has a guessing rate of 25%, so an alternative is to standardize another optotype set by comparing acuities obtained with it to Landolt C test acuities. The Sloan letters,4 a set of 10 upper-case sans serif letters, are the most popular substitute. An acuity chart based on Sloan letters was developed for the Early Treatment Diabetic Retinopathy Study (ETDRS)5 and is illustrated in Fig. 11.1. The original ETDRS chart has been replaced by the 2000 series revised ETDRS chart that more accurately equates the difficulty of letters on all lines. The ETDRS charts are the most widely used acuity charts for clinical research.
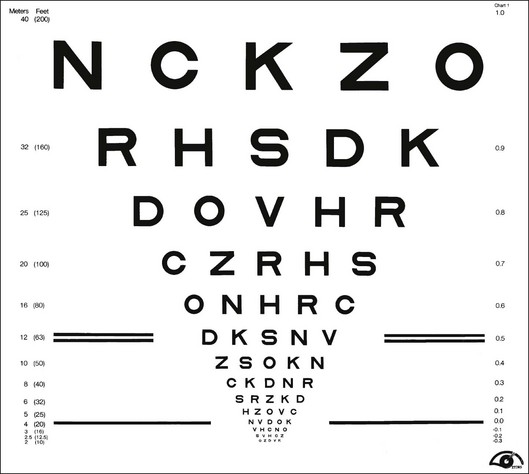
Chart layout
Careful attention must be paid to the layout of the acuity chart. The chart should follow a uniform progression of letter sizes, typically a 0.1 log unit (or 26%) reduction in size from line to line. The uniform progression ensures that a one-line loss will have the same meaning at any point on the chart and at any viewing distance. The same number of letters should appear on each line, and the spacing should be uniform, both within and between lines. The spacing requirement results in a large chart, with the letters forming an inverted triangle. The NAS-NRC recommends 8–10 letters per line, but studies6 suggest that as few as three letters are required for an accurate estimate of visual function. The ETDRS chart uses five letters per line.
Concern about uncontrolled “crowding” effects has led to further modifications of the ETDRS chart. Crowding refers to the reduced visibility of letters when they are surrounded by other letters. Crowding has a larger effect in some types of visual dysfunction, notably amblyopia7 and macular degeneration.8 For most acuity charts, letters at either the end of a line or at the top or bottom of the chart are less subject to crowding than are internal letters. To equalize crowding effects, contour interaction bars may be added around the perimeter of the chart.9
Testing procedure
ETDRS charts are available for a range of test distances from 4 meters (13 feet) to 2 meters (6.5 feet) and when used at the designated distance can measure acuities from 20/10 to 20/200. However, given the logarithmic progression of letter sizes, they can be used at any distance with an appropriate correction of the reported results. For patients with very poor acuity, the clinician may resort to finger counting or hand motion. This strategy is strongly discouraged by low-vision practitioners because it can be demeaning and depressing for the patient to be left with the impression that their vision is so poor it cannot even be measured with an eye chart. Instead, it is recommended that the patient be moved closer to the chart. Using a test distance of 50 cm and appropriate refractive correction it is possible to reliably measure “counting finger” acuity with an ETDRS chart (approximately 20/1460 ± 10%).10 “Hand motions” can be measured with some electronic acuity tests (see below). Distance itself should have little effect on visual acuity, provided that the subject’s accommodative state and pupil size are controlled. However, one study11 found that acuity changed by as much as seven letters (more than one ETDRS line) when the test distance was reduced to less than 2 meters. The reason for this discrepancy remains unexplained.
Luminance and contrast
Whatever the test distance, the chart must be adequately illuminated and of high contrast. Illumination standards vary from 100 cd/m2 in the USA to 300 cd/m2 in Germany. Increasing chart luminance improves visual acuity in normal subjects, but reaches a plateau at about 200 cd/m2.12 Various types of visual dysfunction can change the effects of luminance on acuity. For example, patients with retinitis pigmentosa may show a decrease in acuity at higher luminance, whereas patients with age-related macular degeneration often continue to improve at luminances well above the normal plateau.13 A luminance standard of 100 cd/m2 can be justified because it represents good room illumination for ordinary reading material. Furthermore, most of the currently proposed standards would yield the same acuity scores, plus or minus one letter (assuming five letters per line and a 0.1 log unit size progression) in normal subjects.
The relationship of visual acuity to letter contrast follows a square-root law.14 For example, decreasing contrast by a factor of 2 would decrease acuity by roughly a factor of 1.4. The NAS-NRC recommends that letter contrast be at least 0.85. Transilluminated, projection, and reflective charts (wall charts) can all meet these standards, but some transilluminated charts are deficient in luminance, and some projection systems lack sufficient luminance and contrast. Accurate calibration requires a spot photometer, for which procedures are described in the NAS-NRC document.1
Test administration
Administration of visual acuity tests is simple and straightforward. However, one detail often overlooked in clinical testing is that the test must be administered in a “forced-choice” manner. Rather than allowing the patient to decide when the letters become indistinguishable, the patient should be required to guess the identity of each letter until a sufficient number of errors are made to justify terminating the test. People differ in their willingness to respond to questions when they are not confident about the answers. A person with a conservative criterion answers only when absolutely certain about the identity of the letter, whereas a person with a liberal criterion ventures a guess for any letter that is even barely discernible. These two people may receive different acuity scores because of differences in their criteria rather than because of variations in visual function. This is not merely a theoretical concern. Several studies15,16 have shown that criterion-dependent test procedures lead to inaccurate and unreliable test results. Forced-choice procedures are criterion-free because the examiner, rather than the observer, determines whether the letter is correctly identified.
Scoring
Until recently, visual acuity tests were usually scored line by line with the patient being given credit for a line when a criterion number of letters were identified correctly. The NAS-NRC recommends that at least two-thirds of the letters on a line be correctly identified to qualify for passing. Allowing a small proportion of errors improves test reliability.17 For tests that follow the recommended format of an equal number of letters on each line and a constant progression of letter sizes, it is preferable to give partial credit for each letter correctly identified. This is commonly done by counting the number of letters read correctly on the entire chart and converting this to an acuity score by means of a simple formula that values each letter as L/N, where L = difference in acuity between adjacent lines and N = number of letters per line. So for a chart with five letters per line and a 0.1 logMAR (see below) progression from line to line (such as the standard ETDRS chart) each correct letter is worth 0.1/5 = 0.02 logMAR. Although differences between scoring methods are usually small, it has been shown2,6,18 that letter-by-letter scoring is more reproducible than line-by-line scoring.
Near and reading acuity tests
Near acuity is usually tested to evaluate reading vision. These tests are particularly important for prescribing visual aids for persons with low vision. Near acuity has been shown to be a better predictor of the optimal magnification needed by visually impaired readers than traditional distance acuity.19
Specifying letter size
As with all acuity tests, the most critical parameter is the visual angle subtended by the optotype. Many systems have been devised for specification of print size. One of the most common is the Jaeger J notation. Jaeger notation is based on a numeric scale (J1, J2, and so on) that follows no logical progression except that larger numbers correspond to larger print sizes. Furthermore, print with the same J specification can vary by as much as 90% from one test manufacturer to another.20
Alternatives to the Jaeger notation are the typesetter’s point system, the British N system, and the M notation introduced by Sloan. The typesetter’s point is commonly used to specify letter size for printed text and is equal to 0.32 mm (1/72 inch). However, the measurement refers to the size of the metal slug that contains the letter and varies from one font to another. A study21 of the effect of font on reading speed showed that the nominal sizes of printed text can be very misleading. Of four fonts, all labeled as 12 point, one was much more legible than the other three. But it turned out that the more legible font was actually larger than the others and when equated for real size there was no difference in legibility.
The British N system standardized the point size specification by adopting the Times Roman font. Sloan’s M notation,4 widely used in the USA, is standardized according to the height of a lower-case “x.” A lower-case 1M letter subtends 5 minarc at a 1-meter viewing distance and corresponds roughly to the size of ordinary newsprint. None of the print size specifications can be used for quantitative comparisons unless viewing distance is also specified. For example, 1M print read at a distance of 40 cm would be recorded as 0.40/1.00M.
Words versus continuous text
One issue that remains unresolved is whether near acuity tests should be based on unrelated words or meaningful text. An argument in favor of unrelated words is that contextual information promotes guessing and may lead to an overestimate of near acuity.22 In addition, the presence of semantic context introduces variability because of cognitive intellectual factors that may mask the visual factors of primary concern.23 On the other side it is argued that the main reason for measuring near acuity is to gain information about reading performance. Since context is normally available to the reader, a reading test that includes meaningful text will be a better indicator of everyday performance. Fortunately, reading speed for meaningful text is highly correlated with reading speed for unrelated words.24
The MNREAD test25 uses meaningful text to evaluate near acuity. The test is composed of 19 standardized sentences in a logarithmic progression of sizes. Each sentence is 55 characters and the words are drawn from a controlled vocabulary. The test can be used to measure reading acuity (the smallest print size that can be read), maximum reading speed, and critical print size (the smallest print size for maximum reading speed). The test–retest variability for the MNREAD test has been assessed in patients with macular disease26 and the coefficient of repeatability was found to be greater than 65 words/minute. The high level of variability may be due, in part, to the short sentences. The International Reading Speed Test (IReST)27 uses 150-word paragraphs of continuous text to measure reading speed, which should yield more reproducible measures. The IReST is available in 17 languages.
Electronic acuity tests
Electronic tests offer several potential advantages over paper-based tests:
1. multiple types of test, such as acuity, contrast sensitivity, and stereoacuity, with one instrument
2. better randomization of optotypes. Each test administration can use a different arrangement of letters instead of being constrained to two or three printed charts
3. easier standardization of luminance and contrast, although if calibration instructions are ignored, luminance and contrast errors can be greater than for paper tests
4. the promise of advanced testing algorithms that reduce testing time and/or increase measurment accuracy and precision. So far the electronic systems have not lived up to this promise with test times as long as or longer and measurement accuracy and precision no better than conventional chart tests.28 One test, the E-ETDRS system used in clinical trials for treatment of central retinal vein occlusion,29 is reported to take longer without any increase in reliability.28
Contrast sensitivity tests
Utility of contrast sensitivity tests
For people with normal vision, contrast sensitivity and visual acuity are correlated. However, various types of visual dysfunction, including cerebral lesions,30 optic neuritis related to multiple sclerosis,31 glaucoma,32 diabetic retinopathy,33 and cataract,34 may cause a reduction in contrast sensitivity despite near-normal visual acuity. This led to the suggestion that contrast sensitivity might serve as a tool for differential diagnosis and screening. However, there is no pattern of CSF loss that is unique to any particular vision disorder. The types of CSF measured in patients with macular disease or glaucoma can be similar to the CSFs measured in cataract patients, although detailed analyses with targets of different size or at different retinal eccentricities may help distinguish between various causes of the loss. It is argued that contrast sensitivity tests are more sensitive to early eye disease than visual acuity. While this may be true, much of the apparent difference in sensitivity is due to careless measurement of visual acuity (poorly designed charts and test procedures). Even if the test were more sensitive, its lack of specificity for distinguishing between ocular and retinal/neural disorders limits its usefulness as a screening test.35
The real value of clinical contrast sensitivity testing is to gain a better understanding of the impact of visual impairment on functional ability. Several studies have demonstrated that contrast sensitivity is useful for understanding the difficulties in performing everyday visual tasks faced by older people with essentially normal vision36 and by patients with retinal disease.37,38 Studies have shown that contrast sensitivity loss leads to mobility problems and difficulty recognizing signs or faces,39 even when adjusted for loss of acuity.40
The association of contrast sensitivity with functional ability argues in favor of including contrast sensitivity measurements in clinical trials. Although visual acuity is the most common primary visual outcome measure, several studies have included contrast sensitivity as a secondary outcome. Considering both visual acuity and contrast sensitivity when assessing the outcomes of clinical trials may provide a more complete picture of the effects of treatment on vision than either measure alone. Examples where contrast sensitivity has been used as a secondary outcome include the Optic Neuritis Treatment Trial,41 the TAP study of photodynamic therapy for age-related macular degeneration (AMD),42 and the ABC trial of bevacizumab for AMD.43
Methods
Common contrast sensitivity tests
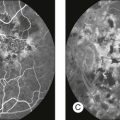
Traditional methods for measuring contrast sensitivity require relatively expensive and sophisticated equipment – typically a computer-controlled video monitor – and employ time-consuming psychophysical procedures. However, several simpler contrast sensitivity tests have been developed primarily for clinical use. These include the Functional Acuity Contrast Test44 (FACT, replacement for the popular Vistech VCTS chart) and the CSV-1000,45 sine-wave grating tests in chart form, and various low-contrast optotype tests such as the Lea test,46 the Pelli–Robson letter chart,17 the Melbourne Edge Test47 and the Mars Letter Contrast Sensitivity Test.48 Examples of three of the most commonly used clinical contrast sensitivity tests are illustrated in Fig. 11.2.
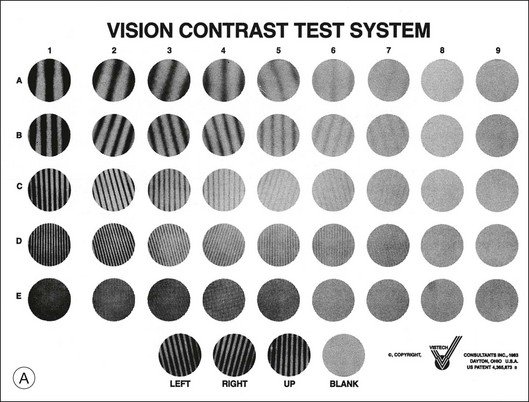
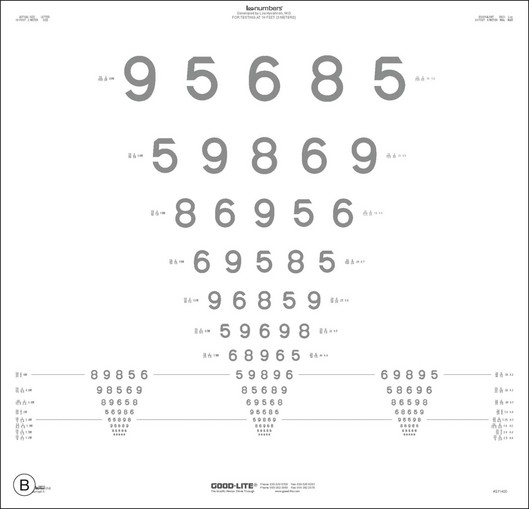
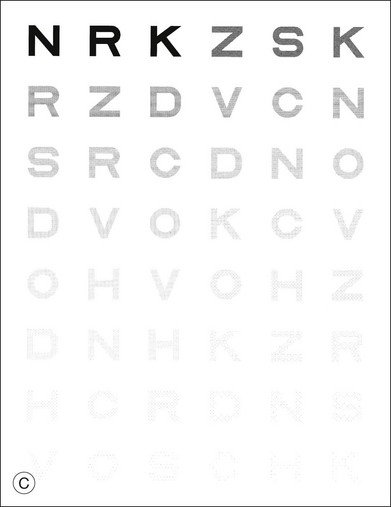
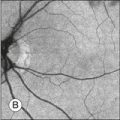
Fig. 11.2 Commonly used clinical contrast sensitivity tests. (A) Vistech VCTS 6500. (Courtesy of Vistech Consultants, Dayton, OH.) (B) Lea numbers low-contrast acuity test. (Courtesy of Good-Lite, Streamwood, IL.) (C) Pelli–Robson letter sensitivity chart. (Reproduced with permission from Pelli DG, Robson JG, Wilkins AJ. The design of a new letter chart for measuring contrast sensitivity. Clin Vis Sci 1988;2:187–200.)
Gratings versus optotypes
A thorough discussion of the relative merits of the various tests is beyond the scope of this chapter; however, a few salient points are worth noting. Various investigators disagree about whether measurement of an entire CSF is necessary or whether a single measure of contrast sensitivity is adequate for clinical purposes. Proponents of the sine-wave grating tests argue that visual dysfunction can cause reductions in contrast sensitivity over a limited range of spatial frequencies, which would be missed by more global measures of contrast sensitivity. On the other hand, advocates of global measures note that contrast sensitivities at specific spatial frequencies tend to be highly correlated with one another, and they maintain that overall changes in contrast sensitivity are clinically more important than subtle bumps and wiggles in the CSF. Data from large-scale studies of vision impairment indicate that global measures of contrast sensitivity are valuable predictors of difficulty in everyday life.39
Test design and procedure
In order to be useful, contrast sensitivity must be measured accurately and reliably. Many of the same principles of test design previously discussed for visual acuity tests apply to contrast sensitivity tests. Most important, the test should employ a criterion-free procedure, a uniform progression of contrasts, and an adequate number of trials at each contrast to make a reliable estimate of sensitivity. Most of the optotype tests conform to good design principles and produce reliable results, with the Mars test outperforming the very popular Pelli–Robson test.49 Sine-wave grating charts tend to be less reliable because they have a limited number of trials to make measurements at several spatial frequencies.50
Some of the electronic acuity testing systems can also measure contrast sensitivity, including the Vision Test 2000 and FrACT. However, it is difficult to display a wide-enough range of contrasts to measure normal thresholds, and accurate calibration of the display monitor is critical. One study found that the computer-based test was less reliable than paper charts,49 presumably due to problems generating low-contrast patterns with LCD displays.
Interpretation of clinical versus statistical significance: an example from the literature
One of the vexing problems with contrast sensitivity testing is how to interpret the clinical significance of test scores. After many decades of acuity testing, we have arrived at a consensus that a doubling of the MAR (increase of 0.3 logMAR or 15 ETDRS letters) represents a meaningful change in acuity. Recent data from large population-based studies suggest that a doubling of contrast threshold (reducing sensitivity by 0.3 logCS units or six letters on the Pelli–Robson chart) has a comparable impact on task performance and quality of life.36,39
References
1. NAS-NRC. Recommended standard procedures for the clinical measurement and specification of visual acuity. Report of working group 39. Adv Ophthalmol. 1980;41:103–148.
2. British Standards Institution. Specification for test charts determining distance visual acuity. London: British Standards House.
3. White, JM, Loshin, DS. Grating acuity overestimates Snellen acuity in patients with age-related maculopathy. Optom Vis Sci. 1989;66:751–755.
4. Sloan, LL, Rowland, WM, Altman, A. Comparison of three types of test target for the measurement of visual acuity. Q Rev Opthalmol. 1952;8:4–16.
5. Ferris, FL, Kassoff, A, Bresnick, GH, et al. New visual acuity charts for clinical research. Am J Ophthalmol. 1982;94:91–96.
6. Raasch, T, Bailey, I, Bullimore, M. Repeatability of visual acuity measurement. Optom Vis Sci. 1998;75:342–348.
7. Flom, MC, Bedell, HE. Identifying amblyopia using associated conditions, acuity, and nonacuity features. Am J Optom Physiol Opt. 1985;62:153–160.
8. Kitchin, JE, Bailey, I. Task complexity and visual acuity in senile macular degeneration. Aust J Optom. 1981;64:235–242.
9. Strong, G, Woo, GC. A distance visual acuity chart incorporating some new design features. Arch Ophthalmol. 1985;102:44.
10. Schulze-Bonsel, K, Feltgen, N, Burau, H, et al. Visual acuities “hand motion” and “counting fingers” can be quantified with the Freiburg visual acuity test. Invest Ophthalmol Vis Sci. 2006;47:1236–1240.
11. Dong, LM, Hawkins, BS, Marsh, MJ. Consistency between visual acuity scores obtained at different test distances: theory vs observations in multiple studies. Arch Ophthalmol. 2002;120:1523–1533.
12. Sheedy, JE, Bailey, IL, Raasch, TW. Visual acuity and chart luminance. Am J Optom Physiol Opt. 1984;61:595–600.
13. Sloan, LL, Habel, A, Feiock, K. High illumination as an auxiliary reading aid in diseases of the macula. Am J Ophthalmol. 1973;76:745–757.
14. Legge, GE, Rubin, GS, Luebker, A. Psychophysics of reading. V. The role of contrast in normal vision. Vision Res. 1987;27:1165–1177.
15. Higgins, KE, Jaffe, MJ, Coletta, NJ, et al. Spatial contrast sensitivity. Importance of controlling the patient’s visibility criterion. Arch Ophthalmol. 1984;102:1035–1041.
16. Rubin, GS. Reliability and sensitivity of clinical contrast sensitivity tests. Clin Vis Sci. 1988;2:169–177.
17. Pelli, DG, Robson, JG, Wilkins, AJ. The design of a new letter chart for measuring contrast sensitivity. Clin Vis Sci. 1988;2:187–199.
18. Arditi, A, Cagenello, R. On the statistical reliability of letter-chart visual acuity measurements. Invest Ophthalmol Vis Sci. 1993;34:120–129.
19. Lovie-Kitchin, JE, Whittaker, SG. Prescribing near magnification for low vision patients. Clin Exp Optom. 1999;82:214–224.
20. Jose, RT, Atcherson, RM. Type-size variability for near-point acuity tests. Am J Optom Physiol Opt. 1977;54:634–638.
21. Rubin, GS, Feely, M, Perera, S, et al. The effect of font and line width on reading speed in people with mild to moderate vision loss. Ophthalm Physiol Opt. 2006;26:545–554.
22. Sloan, LL, Brown, DJ. Reading cards for selection of optical aids for the partially sighted. Am J Ophthalmol. 1963;55:1187–1199.
23. Baldasare, J, Watson, GR, Whittaker, SG, et al. The development and evaluation of a reading test for low vision individuals with macular loss. J Visual Impairment Blindness. 1986;1986:785–789.
24. Legge, GE, Ross, JA, Luebker, A, et al. Psychophysics of reading. VIII. The Minnesota Low-Vision Reading Test. Optom Vis Sci. 1989;66:843–853.
25. Mansfield, JS, Legge, GE, Bane, MC. Psychophysics of reading. XV: Font effects in normal and low vision. Invest Ophthalmol Vis Sci. 1996;37:1492–1501.
26. Patel, PJ, Chen, FK, Da Cruz, L, et al. Test–retest variability of reading performance metrics using MNREAD in patients with age-related macular degeneration. Invest Ophthalmol Visual Sci. 2011;52:3854–3859.
27. Hahn, GA, Penka, D, Gehrlich, C, et al. New standardised texts for assessing reading performance in four European languages. Br J Ophthalmol. 2006;90:480–484.
28. Laidlaw, DA, Tailor, V, Shah, N, et al. Validation of a computerised logMAR visual acuity measurement system (COMPlog): comparison with ETDRS and the electronic ETDRS testing algorithm in adults and amblyopic children. Br J Ophthalmol. 2008;92:241–244.
29. Scott, IU, Ip, MS, VanVeldhuisen, PC, et al. A randomized trial comparing the efficacy and safety of intravitreal triamcinolone with standard care to treat vision loss associated with macular edema secondary to branch retinal vein occlusion: the Standard care vs Corticosteroid for Retinal Vein Occlusion (SCORE) study report 6. Arch Ophthalmol. 2009;127:1115–1128.
30. Bodis-Wollner, I. Visual acuity and contrast sensitivity in patients with cerebral lesions. Science. 1972;178:769–771.
31. Regan, D, Silver, R, Murray, TJ. Visual acuity and contrast sensitivity in multiple sclerosis-hidden visual loss: an auxiliary diagnostic test. Brain. 1977;100:563–579.
32. Bron, AJ. Contrast sensitivity changes in ocular hypertension and early glaucoma. Surv Ophthalmol. 1989;33(Suppl):405–406.
33. Howes, SC, Caelli, T, Mitchell, P. Contrast sensitivity in diabetics with retinopathy and cataract. Aust J Ophthalmol. 1982;10:173–178.
34. Rubin, GS, Adamsons, IA, Stark, WJ. Comparison of acuity, contrast sensitivity, and disability glare before and after cataract surgery. Arch Ophthalmol. 1993;111:56–61.
35. Legge, GE, Rubin, GS. The contrast sensitivity function as a screening test: A critique. Am J Optom Physiol Opt. 1986;63:265–270.
36. West, SK, Rubin, GS, Broman, AT, et al. How does visual impairment affect performance on tasks of everyday life? The SEE project. Salisbury Eye Evaluation. Arch Ophthalmol. 2002;120:774–780.
37. Lennerstrand, G, Ahlström, CO. Contrast sensitivity in macular degeneration and the relation to subjective visual impairment. Acta Ophthalmol (Copenh). 1989;67:225–233.
38. Rubin, GS, Legge, GE. Psychophysics of reading. VI. The role of contrast in low vision. Vision Res. 1989;29:79–91.
39. Rubin, GS, Bandeen-Roche, K, Huang, GH, et al. The association of multiple visual impairments with self-reported visual disability: SEE project. Invest Ophthalmol Vis Sci. 2001;42:64–72.
40. Rubin, GS, Bandeen-Roche, K, Prasada-Rao, P, et al. Visual impairment and disability in older adults. Optom Visual Sci. 1994;71:750–760.
41. Beck, RW, Cleary, PA, Anderson, MM, Jr., et al. A randomized, controlled trial of corticosteroids in the treatment of acute optic neuritis. N Engl J Med. 1992;326:581–588.
42. Rubin, GS, Bressler, NM. Effects of verteporfin therapy on contrast on sensitivity: results from the Treatment of Age-related macular degeneration with Photodynamic therapy (TAP) investigation – TAP report no 4. Retina. 2002;22:536–544.
43. Patel, PJ, Chen, FK, Da Cruz, L, et al. Contrast sensitivity outcomes in the ABC trial: a randomized trial of bevacizumab for neovascular age-related macular degeneration. Invest Ophthalmol Vis Sci. 2011;52:3089–3093.
44. Ginsburg, A. Next generation contrast sensitivity testing. In: Rosenthal BP, Cole R, eds. Functional assessment of low vision. St Louis: Mosby Year Book; 1996:77–88.
45. Pomerance, GN, Evans, DW. Test–retest reliability of the CSV-1000 contrast test and its relationship to glaucoma therapy. Invest Ophthalmol Vis Sci. 1994;35:3357–3361.
46. Jarvinen, P, Hyvarinen, L. Contrast sensitivity measurement in evaluations of visual symptoms caused by exposure to triethylamine. Occup Environ Med. 1997;54:483–486.
47. Verbaken, JH, Johnston, AW. Population norms for edge contrast sensitivity. Am J Optom Physiol Opt. 1986;63:724–732.
48. Arditi, A. Improving the design of the letter contrast sensitivity test. Invest Ophthalmol Vis Sci. 2005;46:2225–2229.
49. Thayaparan, K, Crossland, MD, Rubin, GS. Clinical assessment of two new contrast sensitivity charts. Br J Ophthalmol. 2007;91:749–752.
50. Pesudovs, K, Hazel, CA, Doran, RM, et al. The usefulness of Vistech and FACT contrast sensitivity charts for cataract and refractive surgery outcomes research. Br J Ophthalmol. 2004;88:11–16.