[level-membership-for-cardiovascular-category]
Chapter 24 Verapamil-Sensitive (Fascicular) Ventricular Tachycardia
Pathophysiology
The exact nature of the reentry circuit in verapamil-sensitive VT has provoked considerable interest. Some investigators have suggested that it is a microreentry circuit in the territory of the left posterior fascicle (LPF). Others have suggested that the circuit is confined to the Purkinje system, which is insulated from the underlying ventricular myocardium. False tendons or fibromuscular bands that extend from the posteroinferior LV to the basal septum have also been implicated in the anatomical substrate of this tachycardia. Less often, the reentry circuit is located in fibers distal to the left anterior fascicle (LAF) or may arise from fascicular locations high in the septum.1
Currently, overwhelming evidence suggests that the VT is caused by a reentrant circuit incorporating the posterior Purkinje system with an excitable gap and a slow conduction area.2–4 The VT substrate can be a small macroreentrant circuit consisting of the LPF serving as one limb and abnormal Purkinje tissue with slow, decremental conduction serving as the other limb. The anterograde limb may be associated with longitudinal dissociation of the LPF or contiguous tissue that is directly coupled to the LPF (such as a false tendon) or, alternatively, has ventricular myocardium interposed. The zone of slow conduction appears to depend on the slow inward calcium current, because the degree of slowing of tachycardia CL in response to verapamil is entirely attributed to its negative dromotropic effects on the area of slow conduction.
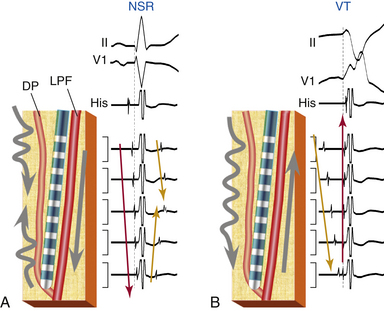
The entrance site to the slow conduction zone is thought to be located closer to the base of the LV septum. From there, activation propagates anterogradely (from basal to apical along the LV septum) over the abnormal Purkinje tissue with decremental conduction properties and verapamil sensitivity, which serves as the anterograde limb of the circuit and appears to be insulated from the nearby ventricular myocardium. The lower turnaround point of the reentrant circuit is located in the lower third of the septum, where the wavefront captures the fast conduction Purkinje tissue from or contiguous to the LPF, and retrograde activation occurs over the LPF from the apical to basal septum forming the retrograde limb of the reentrant circuit. Also, at the lower turnaround point anterograde activation occurs down the septum to break through (at the exit of the tachycardia circuit) in the posterior septal myocardium below. The upper turnaround point of the reentrant circuit occurs over a zone of slow conduction located close to the main trunk of the left bundle branch (LB) in the basal interventricular septum (Fig. 24-1). The estimated distance between the entrance and exit of the circuit is approximately 2 cm.3,5
Clinical Considerations
Epidemiology
Age at presentation is typically 15 to 40 years (unusual after 55 years). Males are more commonly affected (60% to 80%). Verapamil-sensitive VT is the most common form of idiopathic LV VT, and it accounts for 10% to 15% of all idiopathic VTs.2,6
Clinical Presentation
Most patients present with mild to moderate symptoms of palpitations and lightheadedness. Occasionally, symptoms are debilitating, and include fatigue, dyspnea, and presyncope. Syncope and sudden cardiac death are very rare. The VT is typically paroxysmal and can last for minutes to hours. Although idiopathic LV VT can occur at rest, it is sensitive to catecholamines and often occurs during exercise, after exercise, or emotional distress. Occasionally, the VT can be incessant, may be sustained for a long period (days), and does not revert spontaneously to normal sinus rhythm (NSR). Patients with incessant tachycardia can develop cardiomyopathy.7 The clinical course is benign and the prognosis is excellent. Spontaneous remission of the VT may occur with time.
Principles of Management
Acute Management
Intravenous verapamil is typically successful in acutely terminating the VT. Termination with adenosine is rare, except for patients in whom isoproterenol is used for induction of the tachycardia in the EP laboratory.
Chronic Management
Long-term therapy with verapamil is useful in mild cases; however, it has little effect in patients with severe symptoms and the efficacy of oral verapamil in preventing tachycardia relapse is variable. Radiofrequency (RF) ablation is highly effective (success rate of 85% to 90%) and is recommended for patients with severe symptoms.2
Electrocardiographic Features
ECG during Ventricular Tachycardia
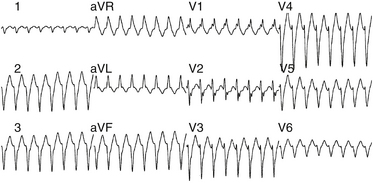
The QRS during VT typically has RBBB with LAF block configuration. The R/S ratio is less than 1 in leads V1 and V2 (Fig. 24-2).3 VTs arising more toward the middle at the region of the posterior papillary muscle have a left superior axis and RS in leads V5 and V6, whereas those arising closer to the apex have a right superior axis with a small “r” and deep S (or even QS) in leads V5 and V6. In contrast to VT associated with structural heart disease, the QRS duration during fascicular VT is relatively narrow (<140 to 150 milliseconds), and the RS interval (the duration from the beginning of the QRS to the nadir of the S wave) in the precordial leads is relatively short (60 to 80 milliseconds); thus, the VT is frequently called “fascicular” VT. The VT rate is approximately 150 to 200 beats/min (range, 120 to 250 beats/min). Alternans in the CL is frequently noted during the VT; otherwise, the VT rate is stable.
Fascicular VT can be classified into three subtypes: (1) left posterior fascicular VT with an RBBB and superior axis configuration (common form); (2) left anterior fascicular VT with RBBB and right-axis deviation configuration (uncommon form); and (3) upper septal fascicular VT with a narrow QRS and normal axis configuration (rare form).1
Electrophysiological Testing
Tachycardia Features
Site of Earliest Ventricular Activation
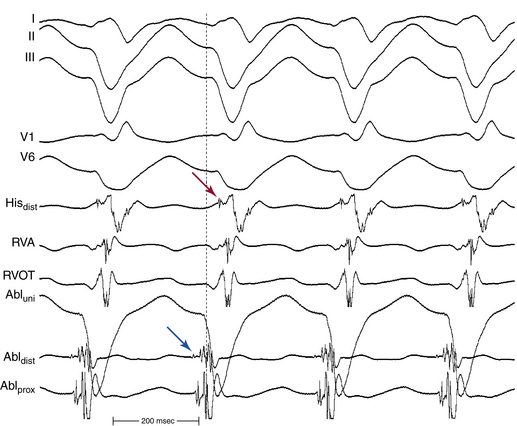
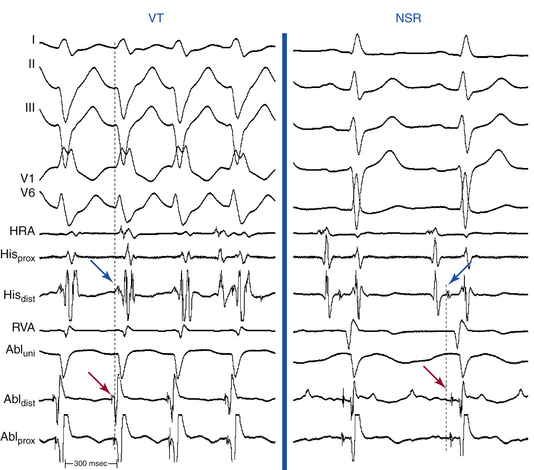
The site of earliest ventricular activation during VT (which represents the exit of the reentrant circuit) is in the region of the LPF (inferoposterior LV septum) in 90% to 95% of LV VTs (explaining the RBBB–superior axis configuration of the QRS), and in the region of the LAF (anterosuperior LV septum) in 5% to 10% of LV VTs (explaining the RBBB–right axis configuration of the QRS). In most cases, ventricular electrograms are discrete during both NSR and VT. The His bundle (HB) is not a component of the reentrant circuit, because a retrograde His potential is often recorded 20 to 40 milliseconds after the earliest ventricular activation (Fig. 24-3).
Purkinje Potential
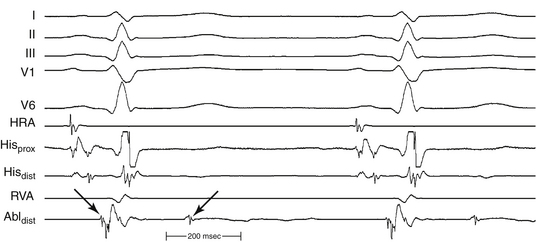
The Purkinje potential (PP or P2) is a discrete, high-frequency potential that precedes the site of earliest ventricular activation by 15 to 42 milliseconds and is recorded in the posterior third of the LV septum during VT and NSR (Fig. 24-4; see also Fig. 24-3).3,4 Because this potential also precedes ventricular activation during NSR, it is believed to originate from activation of a segment of the LPF, and to represent the lower turnaround point in the reentrant circuit. The earliest ventricular activation site (exit) during VT is identified more apically in the septum than the region with the earliest recorded PP.
Late Diastolic Potential
The late diastolic potential (LDP, P1, or pre-PP) is a discrete potential that precedes the PP during VT, and is recorded at the basal, middle, or apical LV septum. The LDP is thought to originate from activation at the entrance to the abnormal Purkinje tissue (the specialized, verapamil-sensitive zone), which is thought to serve as the anterograde limb of the reentrant circuit. The LDP differs in morphology from the PP and has a relatively small amplitude and low-frequency component. The area with LDP recording is confined to a small region (0.5 to 1.0 cm2) and is included in the larger area where the PP is recorded (2 to 3 cm2); hence, the LDP often is recorded simultaneously with the PP by the same electrode. The LDP is recorded within an area proximal to the earliest PP recording site, and is activated from the basal to apical septum toward the earliest PP site. The relative activation times of the LDP, PP, and local ventricular potential at the LDP recording site to the onset of QRS complex are –50.4 ± 18.9, –15.2 ± 9.6, and 3.0 ± 13.3 milliseconds, respectively (see Fig. 24-3). The earliest ventricular activation site (exit) during VT is identified at the posteroapical septum and is more apical in the septum than the region with LDP.3,4
Ventricular Activation Sequence
During NSR, conduction propagates anterogradely (proximal to distal or basal to apical) and rapidly down the LPF, generating an anterograde PP followed by ventricular activation (see Fig. 24-1). In parallel, the impulse slowly conducts anterogradely over the abnormal Purkinje tissue, and such slow conduction, block in the proximal segment, or both allow the anterograde wavefront traveling rapidly over the LPF to conduct retrogradely up the slow pathway, resulting in fusion of delayed (late) ascending and descending potentials that follow or are buried in local ventricular depolarization, which likely represent the LDPs recorded during VT (see Fig. 24-4). Those late potentials have been found only in patients with idiopathic LV VT and not in control subjects, and have been recorded in the midinferior septum within or contiguous to the LPF.3
During ventricular pacing, the LPF is activated retrogradely, generating a retrograde PP. In parallel, the impulse produces bidirectional activation of the abnormal Purkinje pathway in a manner similar, but in reverse direction, to that during NSR.2
During VT, activation propagates anterogradely (from the basal to the apical site of the LV septum) over the abnormal Purkinje tissue, giving rise to an anterograde LDP; hence, the earliest LDP is seen in the basal septum and the latest LDP is seen in the apical septum. The reentrant wavefront then turns around in the lower third of the septum and activates the fast conduction Purkinje fibers along the LPF, generating a retrograde PP. Subsequently, the wavefront propagates anterogradely down the septum to exit the reentrant circuit and activate the posterior septal myocardium, and retrogradely over the LPF from apical to basal septum, forming the retrograde limb of the tachycardia, with an upper turnaround point of the reentrant wavefront occurring over a zone of slow conduction (between LDP and PP areas) located close to the main trunk of the LB (see Fig. 24-1).3,5
Response to Pharmacological and Physiological Maneuvers
Intravenous verapamil slows the rate of VT progressively and then terminates it. Diltiazem is equally effective. Nonsustained VT may continue to occur for a while after termination. VT is usually rendered noninducible after verapamil. Verapamil significantly prolongs the VT CL, LDP-PP interval, and PP-LDP interval during VT. However, the interval from PP to the onset of the QRS complex remains unchanged.3,7
Diagnostic Maneuvers during Tachycardia
Entrainment
Ventricular pacing can entrain the VT with antidromic or orthodromic capture.3 Manifest entrainment is more frequently achieved when pacing is performed from the right ventricular outflow tract (RVOT), because the RVOT is closer to the entrance site of the area of slow conduction in the reentrant circuit, located near the base of the LV septum. On the other hand, pacing from the RV apex is less likely to demonstrate entrainment and, when it does, it is unlikely to demonstrate manifest fusion because of the distance from the entrance site of the circuit and because of the narrow excitable gap of the reentrant circuit. During entrainment, the LDP (representing the entrance of the circuit) is orthodromically captured and, as the pacing rate is increased, the LDP-PP interval (representing an area of decremental Purkinje tissue) prolongs, whereas the stimulus-to-LDP and PP-QRS intervals typically remain constant. Entrainment can usually be demonstrated with ventricular pacing at a CL approximately 10 to 30 milliseconds shorter than the tachycardia CL.2,3 Analysis of entrainment from different ventricular sites helps identify the relationship of those sites to the VT circuit (Table 24-1).
TABLE 24-1 Entrainment Mapping of Verapamil-Sensitive Left Ventricle Ventricular Tachycardia
• Manifest ventricular fusion on the surface ECG (fixed fusion at a single pacing CL and progressive fusion on progressively shorter pacing CLs)
• PPI – tachycardia CL <30 msec
• Interval between stimulus artifact to onset of QRS on surface ECG equals the interval between local ventricular electrogram on pacing lead to onset of QRS on surface ECG (±20 msec)
• Concealed ventricular fusion (i.e., paced QRS is identical to the VT QRS)
• PPI – tachycardia CL <30 msec
• Interval between stimulus artifact to onset of QRS on surface ECG equals the interval between PP to onset of QRS on surface ECG (±20 msec)
• Stimulus-to-LDP interval is long and LDP is orthodromically captured from proximal to distal sites during activation
CL = cycle length; LDP = late diastolic potential; LV = left ventricle; PP = Purkinje potential; PPI = post-pacing interval; RV = right ventricle; RVOT = right ventricular outflow tract; VT = ventricular tachycardia.
Resetting
VT can be reset by VES, with an increasing or mixed resetting response (characteristic of reentrant circuit with an excitable gap).3
Exclusion of Other Arrhythmia Mechanisms
Recently, VT originating from the LV papillary muscles in patients with or without prior myocardial infarction has been described. In contrast to fascicular VT, papillary muscle VT has a broader QRS complex (150 ± 15 milliseconds versus 127 ± 11 milliseconds). Additionally, all fascicular VTs, versus none of papillary muscle VTs, had an rsR′ pattern in lead V1. An R/S ratio less than or equal to 1 in lead V6 for VTs in the LV anterolateral region also suggests papillary muscle VT.8 Furthermore, spontaneous variations in QRS morphology occur relatively frequently during VTs originating from the LV papillary muscles, a feature that can help distinguish these VTs from LV fascicular VT; the latter being a reentrant tachycardia with a consistent QRS morphology.9–11
Ablation
Target of Ablation
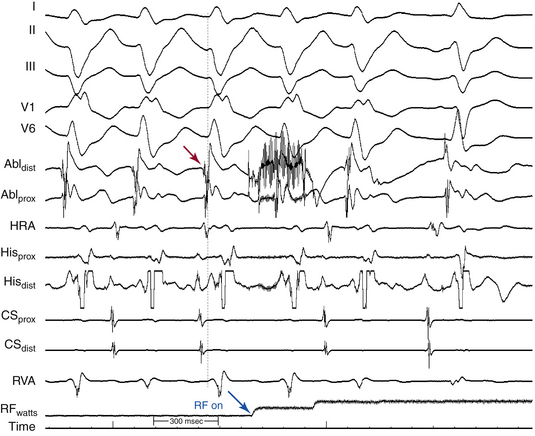
Definition of the appropriate ablation target has evolved with better understanding of the anatomical substrate of the VT. Initially, the ablation target site was defined as the site where the best pace map and the earliest endocardial ventricular activation time could be obtained during VT. Subsequently, in combination with pace mapping, the earliest PP potential preceding QRS onset during VT (considered to be the lower turnaround point of the reentrant circuit) in the posterior third of the LV septum was reported to be a marker for successful ablation. Successful ablation is achieved at sites where PP is recorded 30 to 40 milliseconds before QRS onset (Fig. 24-5). Entrainment mapping at this location helps confirm the relationship to the reentrant circuit. Of note, this area is located more basally than the LV area that shows the earliest ventricular activation during VT (the exit point of the circuit into the ventricular septum), suggesting that the location of the earliest ventricular activation during tachycardia is not an ideal site for ablation of this arrhythmia.
Later on, the LDP recorded during VT, which likely reflects the excitation within the critical slow conduction area participating in the reentry circuit, was reported to be a useful marker in guiding successful ablation.3,4
Currently, ablation is targeted to a site over the middle or inferoapical portion of the LV septum where the earliest PP and LDP are recorded (Fig. 24-6). Verification of these sites can be achieved with entrainment mapping demonstrating concealed fusion and progressive prolongation of the LDP-PP interval with increasing pacing rate. In addition, pressure applied to the catheter tip at the LDP region occasionally results in VT termination with conduction block between LDP and PP. Pace mapping can also be used as an adjunct to verify this site, but because of poor sensitivity, is less helpful than in focal VTs.
It is important to recognize that successful ablation is not necessarily predicted by targeting the earliest (most proximal) LDP. Success can actually be achieved by ablating an LDP distal to the earliest potential. This approach helps reduce the risk of damaging the trunk of the LB. If such an LDP cannot be detected, the site with the earliest ventricular activation with a fused PP may then be targeted.3
Ablation Technique
Once the target site is identified, a test RF current is applied for 20 seconds with an initial power of 20 to 35 W, targeting a temperature of 60°C.3,12 If the VT is terminated or slowed within 15 seconds, additional current is applied for another 60 to 120 seconds and power is increased up to 40 W to reach the target temperature if necessary. If the test RF current is ineffective despite adequate catheter contact, ablation should be directed to another site after additional mapping. This approach helps limit RF damage to the area of LPF and LB.
Successful ablation sites are often associated with progressive prolongation of the LDP-PP interval, with termination of VT coincident with conduction block between the two potentials.3 Rarely, if ever, does one need more than 50 W or the use of irrigated or large-tip electrodes to ablate these VTs successfully. After successful ablation, the LDP appears after the QRS complex during sinus rhythm.
Outcome
The acute success rate is more than 90%, even when different mapping methods are used. The recurrence rate is approximately 7% to 10%, with most recurrences occurring in the first 24 to 48 hours after the ablation procedure. Complications are rare and include different degrees of fascicular block, LBBB, cardiac tamponade, aortic regurgitation, and mitral regurgitation caused by torn chordae that may result from entrapment of the ablation catheter in a chorda of the mitral leaflet.12
Ablation of Noninducible Ventricular Tachycardia
Conventional activation mapping, guided by either the earliest PP or the LDP, although effective, depends on the inducibility and endurance of fascicular VT. However, the VT may not be inducible in the EP laboratory. Additionally, the critical substrate of LV VT is amenable to mechanical injury because of catheter manipulation, which will render the tachycardia noninducible. In these cases, substrate mapping and ablation during NSR have been suggested to eradicate LV VT.
Two approaches have been used for substrate mapping during sinus rhythm: (1) ablation of the site where the earliest LDP is recorded during sinus rhythm (occurring 15 to 45 milliseconds after the PP). The PP-QRS interval at the successful ablation site with LDP is relatively short (mean, 13 ± 8 milliseconds); and (2) anatomical linear ablation to transect the involved middle to distal LPF and destroy the substrate of LV VT.3,13
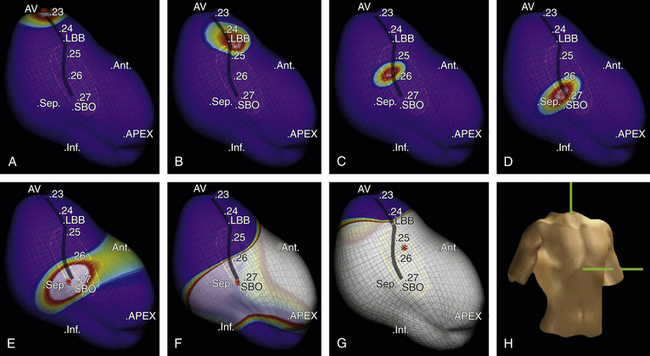
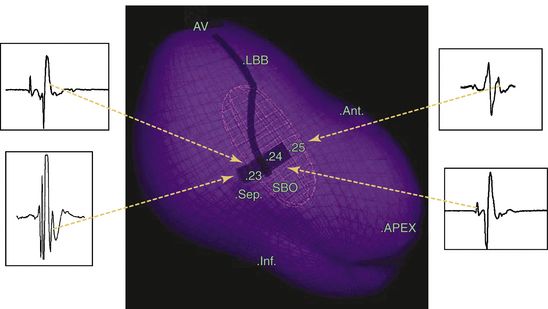
The EnSite 3000 noncontact mapping system (St. Jude Medical, St. Paul, Minn.) has been used to identify the sinus breakout point (i.e., the LV site with the earliest local activation during NSR), and that point has been used to guide linear ablation perpendicular to the conduction direction of LPF.13,14 Particular attention is paid to the geometric detail in the areas of the HB, septum, and apex of the LV. Once the ventricular geometry has been generated, the system can then calculate electrograms from more than 3000 endocardial points simultaneously by reconstructing far-field signals to create the isopotential map of sinus rhythm using a single cardiac cycle. The HB, LB, fascicles, and sinus breakout point are tagged as special landmarks in the geometry. The sinus breakout point is located in the midposterior septum and the local virtual electrogram presents with QS morphology (Fig. 24-7). Virtual electrograms at points from the HB down to the sinus breakout point show a sharp, low-amplitude potential preceding the ventricular potential. The interval between these two potentials becomes progressively shorter as the activation propagates from the HB to the sinus breakout point, until the two potentials finally fuse together at the sinus breakout point. Virtual electrograms recorded from the points placed in the pattern of block above the sinus breakout point show the whole Purkinje network in the LPF area. An ablation line is created perpendicular to the activation direction of LPF and 1 cm above the sinus breakout point (Fig. 24-8). A small Purkinje potential preceding the ventricular activation is observed at its starting and ending points (see Fig. 24-8). The mean length of the deployed line is usually 2.0 ± 0. 4 cm, requiring a mean of 5.5 ± 1.6 RF applications. A significant rightward shift of the QRS axis in the surface limb leads can be observed after the ablation procedure.13,14
1. Nogami A. Idiopathic left ventricular tachycardia: assessment and treatment. Card Electrophysiol Rev. 2002;6:448-457.
2. Lerman B.B. Ventricular tachycardia in patients with structurally normal hearts. In: Zipes D.P., Jalife J., editors. Cardiac electrophysiology: from cell to bedside. ed 5. Philadelphia: WB Saunders; 2009:657-668.
3. Nogami A., Naito S., Tada H., et al. Demonstration of diastolic and presystolic Purkinje potentials as critical potentials in a macroreentry circuit of verapamil-sensitive idiopathic left ventricular tachycardia. J Am Coll Cardiol. 2000;36:811-823.
4. Tsuchiya T., Okumura K., Honda T., et al. Effects of verapamil and lidocaine on two components of the re-entry circuit of verapamil-sensitive idiopathic left ventricular tachycardia. J Am Coll Cardiol. 2001;37:1415-1421.
5. Ramprakash B., Jaishankar S., Rao H.B., Narasimhan C. Catheter ablation of fascicular ventricular tachycardia. Indian Pacing Electrophysiol J. 2008;8:193-202.
6. Iwai S., Lerman B.B. Management of ventricular tachycardia in patients with clinically normal hearts. Curr Cardiol Rep. 2000;2:515-521.
7. Wu D., Wen M.S., Yeh S.J. Ablation of idiopathic left ventricular tachycardia. In: Huang S.K.S., Wilber D.J., editors. Radiofrequency catheter ablation of cardiac arrhythmias: basic concepts and clinical applications. ed 2. Armonk, NY: Futura; 2000:601-620.
8. Yamada T., McElderry H.T., Doppalapudi H., et al. Idiopathic ventricular arrhythmias originating from the aortic root prevalence, electrocardiographic and electrophysiologic characteristics, and results of radiofrequency catheter ablation. J Am Coll Cardiol. 2008;52:139-147.
9. Yamada T., Doppalapudi H., McElderry H.T., et al. Electrocardiographic and electrophysiological characteristics in idiopathic ventricular arrhythmias originating from the papillary muscles in the left ventricle: relevance for catheter ablation. Circ Arrhythm Electrophysiol. 2010;3:324-331.
10. Bogun F., Desjardins B., Crawford T., et al. Post-infarction ventricular arrhythmias originating in papillary muscles. J Am Coll Cardiol. 2008;51:1794-1802.
11. Good E., Desjardins B., Jongnarangsin K., et al. Ventricular arrhythmias originating from a papillary muscle in patients without prior infarction: a comparison with fascicular arrhythmias. Heart Rhythm. 2008;5:1530-1537.
12. Li D., Guo J., Xu Y., Li X. The surface electrocardiographic changes after radiofrequency catheter ablation in patients with idiopathic left ventricular tachycardia,. Int J Clin Pract. 2004;58:11-18.
13. Chen M., Yang B., Zou J., et al. Non-contact mapping and linear ablation of the left posterior fascicle during sinus rhythm in the treatment of idiopathic left ventricular tachycardia. Europace. 2005;7:138-144.
14. Friedman P.A., Asirvatham S.J., Grice S., et al. Noncontact mapping to guide ablation of right ventricular outflow tract tachycardia. J Am Coll Cardiol. 2002;39:1808-1812.
[/level-membership-for-cardiovascular-category][not-level-membership-for-cardiovascular-category]
Chapter 24 Verapamil-Sensitive (Fascicular) Ventricular Tachycardia
Pathophysiology
The exact nature of the reentry circuit in verapamil-sensitive VT has provoked considerable interest. Some investigators have suggested that it is a microreentry circuit in the territory of the left posterior fascicle (LPF). Others have suggested that the circuit is confined to the Purkinje system, which is insulated from the underlying ventricular myocardium. False tendons or fibromuscular bands that extend from the posteroinferior LV to the basal septum have also been implicated in the anatomical substrate of this tachycardia. Less often, the reentry circuit is located in fibers distal to the left anterior fascicle (LAF) or may arise from fascicular locations high in the septum.1
Currently, overwhelming evidence suggests that the VT is caused by a reentrant circuit incorporating the posterior Purkinje system with an excitable gap and a slow conduction area.2–4 The VT substrate can be a small macroreentrant circuit consisting of the LPF serving as one limb and abnormal Purkinje tissue with slow, decremental conduction serving as the other limb. The anterograde limb may be associated with longitudinal dissociation of the LPF or contiguous tissue that is directly coupled to the LPF (such as a false tendon) or, alternatively, has ventricular myocardium interposed. The zone of slow conduction appears to depend on the slow inward calcium current, because the degree of slowing of tachycardia CL in response to verapamil is entirely attributed to its negative dromotropic effects on the area of slow conduction.
The entrance site to the slow conduction zone is thought to be located closer to the base of the LV septum. From there, activation propagates anterogradely (from basal to apical along the LV septum) over the abnormal Purkinje tissue with decremental conduction properties and verapamil sensitivity, which serves as the anterograde limb of the circuit and appears to be insulated from the nearby ventricular myocardium. The lower turnaround point of the reentrant circuit is located in the lower third of the septum, where the wavefront captures the fast conduction Purkinje tissue from or contiguous to the LPF, and retrograde activation occurs over the LPF from the apical to basal septum forming the retrograde limb of the reentrant circuit. Also, at the lower turnaround point anterograde activation occurs down the septum to break through (at the exit of the tachycardia circuit) in the posterior septal myocardium below. The upper turnaround point of the reentrant circuit occurs over a zone of slow conduction located close to the main trunk of the left bundle branch (LB) in the basal interventricular septum (Fig. 24-1). The estimated distance between the entrance and exit of the circuit is approximately 2 cm.3,5
Clinical Considerations
Epidemiology
Age at presentation is typically 15 to 40 years (unusual after 55 years). Males are more commonly affected (60% to 80%). Verapamil-sensitive VT is the most common form of idiopathic LV VT, and it accounts for 10% to 15% of all idiopathic VTs.2,6
Clinical Presentation
Most patients present with mild to moderate symptoms of palpitations and lightheadedness. Occasionally, symptoms are debilitating, and include fatigue, dyspnea, and presyncope. Syncope and sudden cardiac death are very rare. The VT is typically paroxysmal and can last for minutes to hours. Although idiopathic LV VT can occur at rest, it is sensitive to catecholamines and often occurs during exercise, after exercise, or emotional distress. Occasionally, the VT can be incessant, may be sustained for a long period (days), and does not revert spontaneously to normal sinus rhythm (NSR). Patients with incessant tachycardia can develop cardiomyopathy.7 The clinical course is benign and the prognosis is excellent. Spontaneous remission of the VT may occur with time.
Principles of Management
Acute Management
Intravenous verapamil is typically successful in acutely terminating the VT. Termination with adenosine is rare, except for patients in whom isoproterenol is used for induction of the tachycardia in the EP laboratory.
Chronic Management
Long-term therapy with verapamil is useful in mild cases; however, it has little effect in patients with severe symptoms and the efficacy of oral verapamil in preventing tachycardia relapse is variable. Radiofrequency (RF) ablation is highly effective (success rate of 85% to 90%) and is recommended for patients with severe symptoms.2
Electrocardiographic Features
ECG during Ventricular Tachycardia
The QRS during VT typically has RBBB with LAF block configuration. The R/S ratio is less than 1 in leads V1 and V2 (Fig. 24-2).3 VTs arising more toward the middle at the region of the posterior papillary muscle have a left superior axis and RS in leads V5 and V6, whereas those arising closer to the apex have a right superior axis with a small “r” and deep S (or even QS) in leads V5 and V6. In contrast to VT associated with structural heart disease, the QRS duration during fascicular VT is relatively narrow (<140 to 150 milliseconds), and the RS interval (the duration from the beginning of the QRS to the nadir of the S wave) in the precordial leads is relatively short (60 to 80 milliseconds); thus, the VT is frequently called “fascicular” VT. The VT rate is approximately 150 to 200 beats/min (range, 120 to 250 beats/min). Alternans in the CL is frequently noted during the VT; otherwise, the VT rate is stable.
Fascicular VT can be classified into three subtypes: (1) left posterior fascicular VT with an RBBB and superior axis configuration (common form); (2) left anterior fascicular VT with RBBB and right-axis deviation configuration (uncommon form); and (3) upper septal fascicular VT with a narrow QRS and normal axis configuration (rare form).1
Electrophysiological Testing
Tachycardia Features
Site of Earliest Ventricular Activation
The site of earliest ventricular activation during VT (which represents the exit of the reentrant circuit) is in the region of the LPF (inferoposterior LV septum) in 90% to 95% of LV VTs (explaining the RBBB–superior axis configuration of the QRS), and in the region of the LAF (anterosuperior LV septum) in 5% to 10% of LV VTs (explaining the RBBB–right axis configuration of the QRS). In most cases, ventricular electrograms are discrete during both NSR and VT. The His bundle (HB) is not a component of the reentrant circuit, because a retrograde His potential is often recorded 20 to 40 milliseconds after the earliest ventricular activation (Fig. 24-3).
Purkinje Potential
The Purkinje potential (PP or P2) is a discrete, high-frequency potential that precedes the site of earliest ventricular activation by 15 to 42 milliseconds and is recorded in the posterior third of the LV septum during VT and NSR (Fig. 24-4
[/not-level-membership-for-cardiovascular-category]
