VENTILATION OF THE RESPIRATORY SYSTEM
THE IMPORTANCE OF ITS LACK OF UNIFORMITY IN DISEASE
Introduction
 ) is:
) is:
 , has a dot over the V to show it is a rate. The volume breathed out is approximately equal to the volume breathed in (tidal volume, VT), therefore the net flow over a complete cycle is zero. This is not a very helpful way of expressing ventilation if we want to express changes in breathing, as the result of exercise or disease, for example. We therefore measure the flow in one direction only – conventionally the volume breathed out per minute (
 ) – to give us minute ventilation.
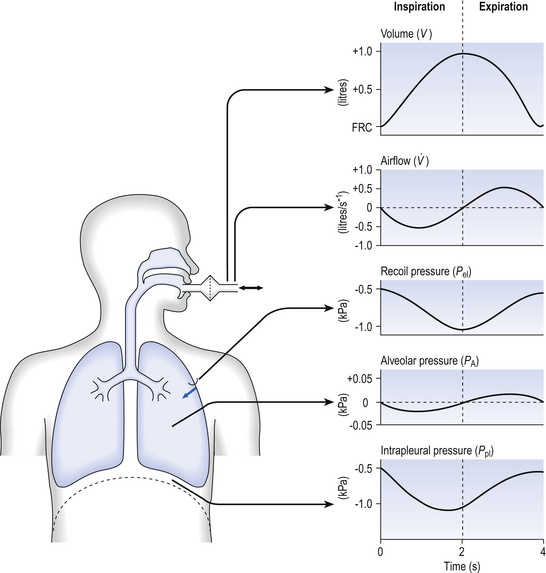
In respiratory medicine ventilation is the rate of flow of air into or out of the lungs, and results from the expanding and contracting of the lungs by the changes in intrapleural pressure described in Chapter 4 (pp. 41, 42) and illustrated in Figure 5.1.
We all know we can consciously alter the volume of our lungs, breathing in or breathing out more than normal: what is frequently not realized is that we cannot totally empty our lungs.
The anatomy (size) of an individual’s chest, the elasticity of his lungs and chest wall and the strength of his respiratory muscles determine these volumes. Changes in lung volume can easily be measured using a spirometer, as illustrated in Figure 5.2. This instrument, which comes in many forms, consists of a closed space from which the subject breathes. In the type illustrated a hollow bell is supported in a trough of water; as the subject breathes in, air is drawn from the bell and it sinks slightly; when he breathes out the bell rises. Movements of the bell are recorded as changes in lung volume on a moving chart.
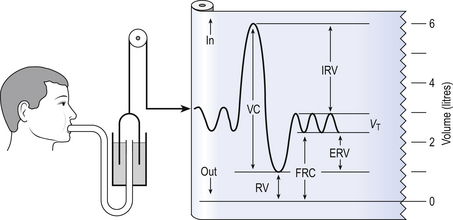
Except for RV and FRC (which depends on RV), these volumes can be measured using a spirometer in the living subject. If the lungs are taken out of the body and allowed to collapse there will still be a little air left in them: the minimal air; these lungs will float (see ‘lights’ Chapter 2, p. 19). The lungs of a stillborn baby who has not taken a breath will not float because they contain no air; this test is important in forensic investigations.
The names of these volumes and their abbreviations are intimidating to students, but reference to Figure 5.2 should make all clear.
• body size – all are larger in large people.
• age – all volumes are smaller in children, only partially due to their smaller body size. In old age VC is decreased and RV increased because of degenerative changes.
• sex – all volumes are smaller in women than in men the same size.
• muscle training – increases all the lung volumes and allows greater maximal ventilation during exercise.
• disease – changes in these lung volumes from the normal values, which have been measured in numerous extensive surveys, are used in the diagnosis of many diseases of the lungs and respiratory system.
Spirometric abnormalities in disease
Lung disease changes many of the lung volumes in Figure 5.2. It is usual, for diagnostic purposes, to exaggerate these changes by stressing the respiratory system by asking the patient to breathe in as deeply as he can and out as hard as he can for the single breath of a test. The forced expiratory volume in 1 second (FEV1) is frequently abbreviated to forced expired volume (FEV), but is still the same creature: the volume of air forced out in the first second of such a test. Similarly, forced vital capacity is the total volume of air a patient can breathe out after a maximal inspiration. It is usual to express FEV1 as a percentage of FVC: this takes into account the fact that larger people normally have larger lungs and therefore a larger FVC. Often VC is used in place of FVC in this ratio.
Diseases of the thoracic cage, such as ankylosing spondylitis, diseases of the nerves and muscles of respiration, e.g. poliomyelitis, diseases that restrict expansion of the lungs, such as fibrosis, or diseases that cause airway collapse during expiration all limit these spirometric measurements. Examples of the modifications produced by diseases of the lungs on spirometric traces are shown in Chapter 11, and can be summarized in a very general way as follows:
| Variable | Restrictive disease | Obstructive disease |
| FVC | − − | − |
| FEV1 | − − | − − |
| FEV1/FVC | 0 | − − |
| FRC | − | + |
| RV | − | + |
| TLC | − | + |
0 = no change; + =increase; − =decrease.
NB: some of these changes are not seen to any degree until the disease is very advanced.
Uneven distribution
These considerations of the various volumes that make up breathing still give an impression of uniformity of distribution which is far from true. In Chapter 2 we described the anatomy of the bronchial tree as blind-ended sacks connected to the outside through a system of tubes. Some thought enables us to see that the composition of gas in this arrangement may be different at its entrance (the lips) from that at its ends (the alveoli) – differences in series with each other; also, the composition in different alveoli may be different – differences in parallel; or a combination of both. Differences in the composition of air in different parts of the lung depend largely on how well that part is ventilated and how much gas exchange between air and blood and blood and air takes place there. In the ideal situation just the right amount of both air and blood are supplied to a particular region, so there is no ‘waste’ of either. One particular kind of inequality between air and blood supply is known as dead space.
Dead space
Essentially all exchange of gas between air and blood only takes place at the alveolar surface. The system of tubes connecting this surface to the atmosphere takes little part in this exchange and can be considered anatomical dead space. These tubes are essential to bring air to the respiratory surface, but ventilating these connecting tubes is an inescapable waste of effort as far as gas exchange is concerned. To understand anatomical dead space you must understand that the lungs fill and empty in a sequential fashion (Fig. 5.3).
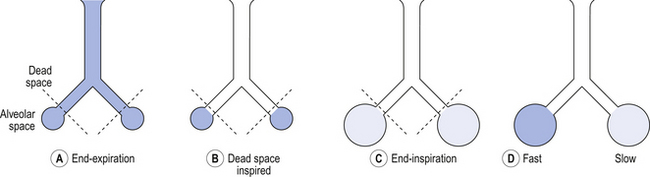
At the end of inspiration the contents of the alveoli have been diluted by inspired room air, which now also fills the anatomical dead space (Fig. 5.3C). As the lungs then empty during expiration, the rule of ‘last in first out’ applies and the dead space containing unmodified room air is exhaled first. At the end of expiration the anatomical dead space is filled with alveolar air, and this partly used air is inhaled first in the next inspiration (Fig. 5.3A,B). If some regions of the lung expand before others in the process of inspiration they will receive an inappropriately large part of this dead space gas, and the regions receiving air later in inspiration will receive more fresh air (Fig. 5.3C,D). So the timing of inflation of a part of the lung during inspiration will affect the composition of the gas it receives.
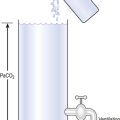
This type of dead space is called ‘anatomical’ because it measures the anatomical volume of the conducting airways. The strict definition of anatomical dead space is ‘the volume of an inspired breath which has not mixed with the gas in the alveoli’. Because gas exchange effectively only takes place in the alveoli there is no CO2 excreted into the dead space, and a scientist called Fowler pointed out that anatomical dead space can be measured as the volume of expired gas leaving the mouth and nose before CO2 appears at the lips (Fig. 5.4).
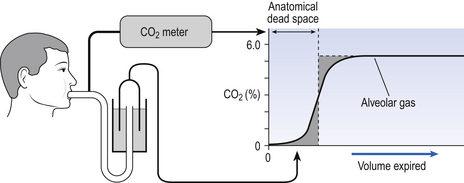
We will see in a little while that this ‘cunning plan’ for measuring anatomical dead space is fraught with difficulty, mainly because the alveolar gas appearing at the lips does not have the constant composition shown in Figure 5.4. More often there is a considerable slope, particularly when the subject is breathing vigorously, or when alveoli empty at different rates. This makes deciding where to draw the vertical line difficult.
Alveolar dead space in disease
It would be wrong to think of alveolar dead space as an absolute term, i.e. to imagine areas of the lung that are supplied with air by breathing but which have absolutely no blood supply to exchange O2 and CO2 with this air. We will see in Chapter 7 that most of the lung is ‘on target’, getting lots of blood to regions that are well ventilated and less blood to poorly ventilated regions. This ‘ matching’ is of course very important, and it is the major defect in diseases as varied as emphysema and pulmonary fibrosis, in which areas of the lung may be expanded, but, because there is only a slow change of air within that space, are poorly ventilated.
Case 5.1 Ventilation in the respiratory system: 2
What causes a pneumothorax?
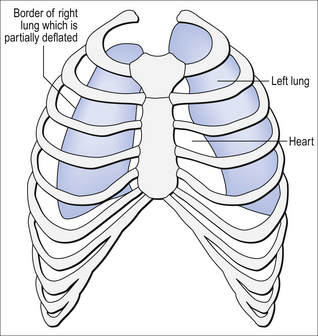
A pneumothorax occurs when a lung collapses away from the chest wall and air enters the intrapleural space.
The pressure within the intrapleural space is negative with respect to the atmosphere and with respect to alveolar gas. If any connection is made between the alveoli and the pleura or between the atmosphere and the pleura, gas will flow into the intrapleural space. As gas flow takes place, the pressure in the intrapleural space approaches atmospheric. The lung partially collapses and the chest wall expands a little (see Fig. 5.5).
The Bohr equation
The definition of physiological dead space as ‘the volume of inspired air which has not taken part in gas exchange’ enables dead space to be calculated using a more analytical approach than that of Figure 5.4.

Case 5.1 Ventilation in the respiratory system: 3
Diagnosis of a pneumothorax
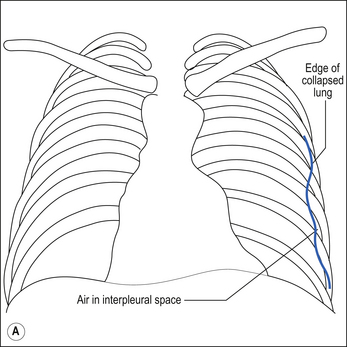
The diagnosis of a pneumothorax is made from the history, clinical examination and chest X-ray. The patient complains of pleuritic chest pain, and if there is a moderate or large pneumothorax the patient may complain of breathlessness as the affected lung is not well ventilated.
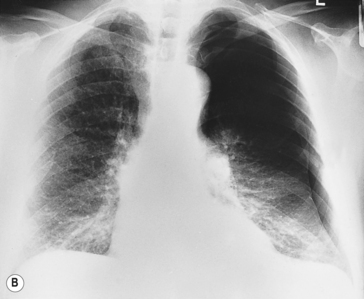
The definitive diagnosis of a pneumothorax is made with a chest X-ray. On a chest X-ray of a healthy individual there is no gap between the lungs fields and the inside of the chest wall. Figure 5.6B is a chest X-ray of a patient with a left-sided pneumothorax. On the right, the lung field fills the space within the ribcage, but on the left-hand side the border of the partially collapsed lung is clearly visible and there is a dark gap between the lung and the rib cage caused by air in the intrapleural space.
If there is none of the gas (e.g. CO2) in the dead space, FD = 0 and the equation becomes:
or
or
or
This is the simplified Bohr equation for CO2.
The volume of air expired and the concentration of CO2 in it can easily be measured using a spirometer and CO2 analyser. A modification of the procedure shown in Figure 5.4 demonstrates the essentials of how to obtain a sample of end-tidal air. The subject breathes out as far as possible into the long thin tube; he then blocks the end of the tube with his tongue, and the gas in the tube nearest him is alveolar air. Because conditions vary so much in different alveoli the air collected this way is not a very accurate average of alveolar air, and for CO2 arterial Pco2 is a better index of mixed alveolar CO2, although obtaining arterial blood from a subject is a very different proposition from asking him to blow down a tube!
which gives us the important information that the size of tidal volume influences dead space.
Alveolar ventilation and respiratory exchange

This is the effective ventilation that brings about the exchange of O2 and CO2.
Room air contains virtually no CO2 and the alveolar gas contains 5.5%, giving an output of:
The ratio of CO2 output divided by O2 uptake is called the respiratory exchange ratio (or respiratory quotient, when used to describe the exchange in tissues or cells). It is usually given the symbol R and can range from 1, when only carbohydrates are being metabolized, to 0.7 when fats are being used. The ratio depends on the amount of oxygen already in the molecule being oxidized: the more oxygen the molecule contains the less has to be ‘brought in’ to complete the oxidation. For the figures above:
where K is a constant which takes into account the air is being warmed and moistened within the lungs,  is partial pressure in the alveoli or arterial blood,
  is the rate of production of CO2 by the body and
  is alveolar ventilation.
The alveolar gas equation
 has been calculated
  can be calculated using what is known as the alveolar gas equation. If the respiratory exchange ratio was 1, then for each molecule of O2 taken up one molecule of CO2 would be released, and:
However, R is seldom 1, and  is computed using the slightly intimidating alveolar gas equation:
A simplified form of this equation is:
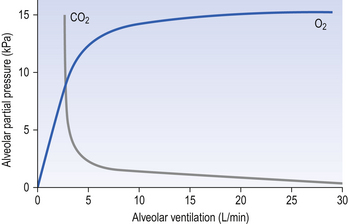
The effect of changing alveolar ventilation on alveolar partial pressure of O2 and CO2 is shown graphically in Figure 5.7. It is clear that increased or decreased ventilation has opposite effects on the alveolar concentrations of these two gases. You will see later (Chapter 8, Gas transport) that this does not mean that the amount of O2 carried into the circulation can increase or decrease in a linear fashion, as does CO2, because in the case of O2 the carriage is limited by the capacity of a carrier rather than the amount flowing into the lungs.
Distribution of inspired gas
Series differences
You can see from Figure 5.4 that the concentration of CO2 in an expired breath does not rise as a sudden step to its alveolar value, as you might have expected from the series arrangement of anatomical dead space and alveolar space described so far. In other words, there is not a clear-cut boundary between the two spaces. This is due to several factors:
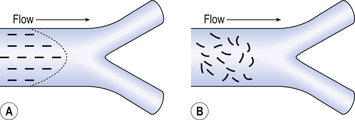
• The flow may be laminar or turbulent (Fig. 5.8) and both cause a gradient of concentration along the tube. In laminar flow the front is not square because of axial streaming, and in turbulent flow the square front mixes with the original air as it advances.
• Turbulent eddies at the points of branching of the airways and the churning action of the beating heart mix gas in the airways.
• Unequal pathway lengths from the respiratory surface to the lips mean alveolar gas has different distances to go to reach the lips.
• Differences in compliance and resistance of different regions mean they have different ‘time constants’ and take different lengths of time to fill and empty.
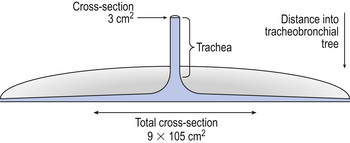
As inspired air approaches the alveoli it moves into a region of rapidly increasing cross-sectional area and volume (see Fig. 2.5 and Fig. 5.9). The airways can be likened to a trumpet with a very wide mouth. The consequence of this is that the forward velocity of the gas slows down almost to a standstill, and the gas moves more by diffusion than by bulk flow. This slowing down of the advancing front allows concentration gradients to build up along the smaller airways. This stratification of inspired gas reduces the concentration of fresh air near the respiratory surface, but is not dangerously important in healthy lungs. However, in some lung diseases (e.g., emphysema) the geometry of the airways is changed, increasing the distance for diffusion and hence the effects of stratification to unacceptable levels.
Regional differences
1. differences in regional ventilation causing different dilutions of alveolar gas by inspired air, and
2. different blood flows exchanging O2 and CO2 with the alveolar gas at different rates (this effect is dealt with in Chapter 7).
To explain this vertical difference in regional ventilation we first must remember that:
• ventilation is the amount of gas moved into and out of a region, irrespective of the initial volume of that region;
• the motive force which brings about ventilation is change in the intrapleural pressure around the lungs, which becomes more negative (compared to the atmosphere) during inspiration, expanding the lungs (Chapter 3, pp. 30, 39);
• the effect of gravity on the contents of the chest is to cause intrapleural pressure to be less negative at the BOTTOM of the lungs than at the TOP. It increases (gets less negative) by about 0.025 kPa for every centimetre you move towards the base of the lung (see Chapter 3, pp. 30–31).
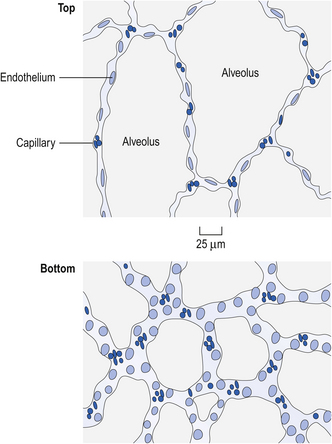
The effect of this gravity-induced gradient of intrapleural pressure is clearly seen if the structure of the lungs of man or other mammal in the upright position at the end of expiration (FRC) is looked at under the microscope (Fig. 5.11). We see that the alveoli at the top are expanded to nearly their full size, whereas those at the bottom are only slightly expanded.
The radioactive gas was used to inflate isolated lungs suspended in a pressure gradient that mimicked that found in the upright human chest, i.e. increasing by 0.025 kPa for every centimetre moved towards the base. This can be achieved by placing the lungs in a foam of appropriate density. The amount of radioactive gas in a region at any time during the inflation can be measured by radioactivity counters placed over the surface of the lungs (Fig. 5.12).
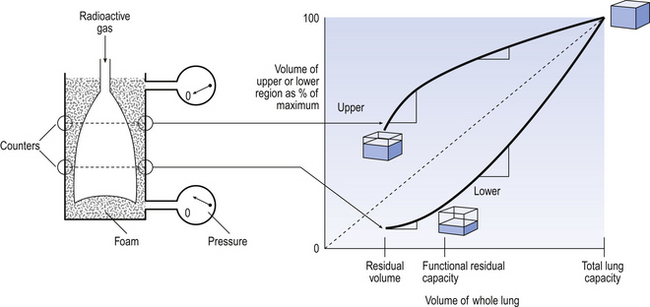
The vertical axis of Figure 5.12 gives the volume of the upper and lower regions of the isolated lungs as a percentage of their ultimate volume when fully inflated. The horizontal axis gives the volume of the whole lungs, i.e. that of all regions. If the lungs were free of any gradient of pressure, both the upper and the lower regions would expand at the same rate and the points representing these volumes would fall along the same line, shown as a dotted line in Figure 5.12. With a pressure gradient applied over the lungs, the two regions behave differently. The slope of the lines in Figure 5.12 represents the rate of change of volume: the steeper the slope the greater the rate of inflation. The cubes represent the fraction of its maximum achievable volume a cube of lung from top or bottom has achieved at that moment.
Case 5.1 Ventilation in the respiratory system: 4
Treatment of a pneumothorax
Mr Price’s pneumothorax was treated using a chest drain. This consists of a length of plastic tubing inserted into the intrapleural space through a small incision made under local anaesthetic between two of Mr Price’s ribs. The chest drain allows air to escape from the intrapleural space so that the underlying lung can reinflate.
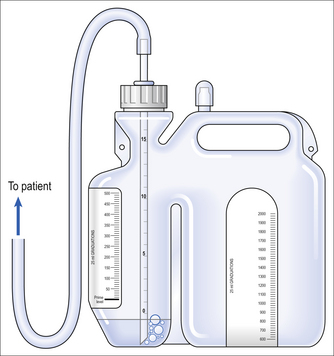
So that the chest drain removes air from the intrapleural space rather than allowing more air to enter, it is necessary to place a one-way valve on the end of the drain. This usually takes the form of an underwater seal (Fig. 5.10). An underwater seal consists of a container of water with a tube extending below the surface of the water. Gas can pass from the tube into the atmosphere by forming bubbles in the water, but no gas can pass back up the tube and the water effectively acts as a one-way valve at the end of the tube.
• The lower lobe starts at a smaller percentage of maximal volume because it is compressed by the greater external pressure.
• It follows that the ventilatory capacity of the upper region is smaller than that of the lower, i.e. it operates in the range between 40% and 100% of its total volume range, whereas the lower lobe operates in the 15–100% range. This is because the upper region is more inflated initially.
• At volumes well below FRC there is proportionally more rapid inflation of the upper regions (compare the slopes of the lines in Figure 5.12). This is because at these volumes some of the airways to the lower lobes close, and it takes a critical pressure to re-expand them.
• At larger lung volumes the situation reverses and there is more ventilation of the lower region.
• In deflation of the lungs the points in Figure 5.12 representing the volumes of the two lung regions move down the two curves, reversing the effects described.
• It should be remembered that human lungs are roughly cone shaped, there being more tissue at the base than at the apex. This amplifies the effect of greater ventilation going to the base of the lung.
Other factors influencing distribution
Airways muscle tone
Substances that increase airways smooth muscle tone and cause bronchoconstriction, e.g. histamine, increase non-uniform distribution of ventilation by non-uniformly changing the mechanical properties of regions of the lungs. Abolition of airways muscle tone also reduces uniformity of distribution. This suggests that normal muscle tone minimizes non-uniform distribution. The pharmacological management of bronchoconstriction is dealt with in Chapter 4, pp. 36, 50.
Posture
Patterns of both lung ventilation and perfusion change with changes in posture, owing to changes in the direction in which gravity is acting. If the lung in Figure 5.12 were to be ‘stood on its head’, or if a subject stands on his head, the best-ventilated region of the lung now becomes what was the apex, because it has become the base.
Case 5.1 Ventilation in the respiratory system: 5
Tension pneumothorax – a medical emergency
As we have seen, pneumothoraces are caused when gas enters the intrapleural space. In the majority of cases, gas flow stops when the pressure in the intrapleural space reaches atmospheric. Very rarely, the pressure within the intrapleural space continues to rise above atmospheric. This is usually because the defect in the lung wall behaves like a valve, allowing gas to enter the intrapleural space without allowing it to leave. Gas enters the intrapleural space when the pressure within the alveoli is positive: this is particularly a problem in patients whose lungs are being artificially ventilated, either in an intensive care unit or in an operating theatre.
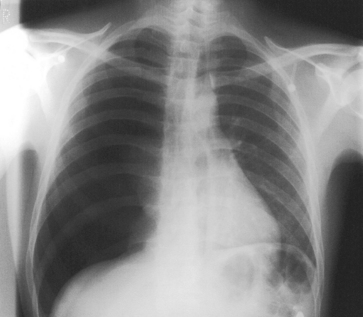
As the pressure within the intrapleural space rises, the mediastinum is pushed away from the affected side (remember that in a pneumothorax that is not under tension, the mediastinum is deviated towards the affected side). Pressure on the heart and the major vessels within the mediastinum results in cardiac output being reduced, and the displacement of the other lung may result in gas exchange being compromised. In severe cases, cardiovascular collapse occurs. Figure 5.13 shows an X-ray of a tension pneumothorax. The right lung is almost completely collapsed and the heart and mediastinum are deviated away from the affected side.
This tidy explanation of distribution of ventilation in terms of the direction in which gravity is acting has recently received a blow. Astronauts under conditions of zero gravity would be expected to have uniform ventilation over the whole of their lungs. Not so. Although the differences in ventilation are markedly reduced, there still remains a slight top-to-bottom gradient of ventilation. This may be the result of the subjects spending most of their lives under normal gravity before they became astronauts. Gravity may have left a permanent mark on the regional mechanical properties of their lungs. We must wait until we can test the first individual to be born and spend his whole life in zero gravity before we can completely describe the effects of gravity on the lungs.
Case 5.1 Ventilation in the respiratory system: 7
The diagnosis of pneumonia
Pneumonia essentially means an infection of the lung. It is not a rare condition and affects about two adults per 1000 in the community. It is responsible for far more deaths than all other types of infection put together. Pneumonia is usually caused by bacterial infections, and the most common bacterium to cause pneumonia outside hospitals is Streptococcus pneumoniae, which causes about half of all such pneumonias. Other bacteria that cause pneumonia include:
• Haemophilus influenzae, which is particularly common in patients with pre-existing lung disease such as chronic bronchitis
• Staphylococcus aureus, which is more common in children and intravenous drug abusers.
About one-fifth of pneumonias are caused by unusual agents such as:
• Mycoplasma pneumoniae, the second commonest bacterial cause of pneumonia
• Chlamydia psittaci, which causes psittacosis, a pneumonia caught from caged birds
• Coxiella burnetti, which causes Q fever, a pneumonia acquired from animal hides
• Legionella pneumophila, which causes legionnaire’s disease, a pneumonia which was first identified in 1976. The disease was caught by several members of the American Legion (an ex-servicemen’s association) who were attending a conference at a hotel in Philadelphia. Legionella, which had not previously been identified, had infected the water in the hotel’s air-conditioning unit. Droplets of infected water in the air in the hotel were inhaled by the legionnaires, causing the disease.
Pneumonias caused by these agents are often known as atypical pneumonias.
Mrs O’Donnell’s chest X-ray is shown in Figure 5.15 and shows an area of right upper lobe consolidation (fluid-filled lung) caused by her right upper lobe pneumonia. Note that the infection has a clearly defined lower border. This is because the area of infection lies completely within the upper lobe. The lower border of the opacification on the chest X-ray is the lower border of the upper lobe.
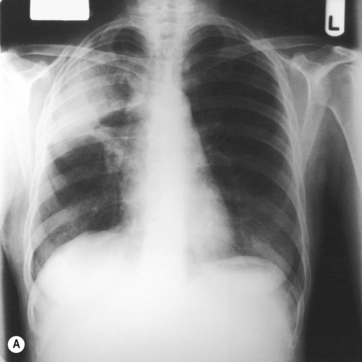
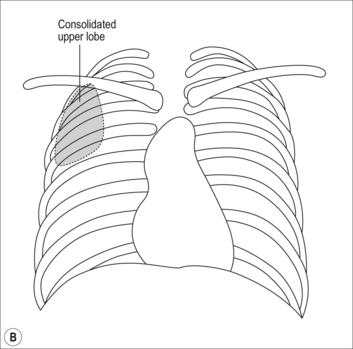
Fig. 5.15
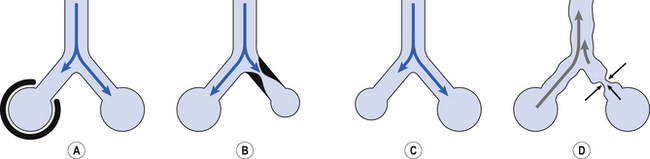
Pathological changes
Dramatic and acute changes, such as pneumothorax (see Boxes 1–5), can affect the distribution of ventilation between and within the lungs, in that case by limiting the expansion of one lung (Fig. 5.14A). Normal ageing, and less dramatic conditions, alters the distribution of ventilation and, to a greater or lesser extent, perfusion. Airway obstruction (Fig. 5.14B), found in asthma and bronchitis, restricts supply to the region served by the airway, and diseases such as emphysema change the compliance (Fig. 5.14C) and collapse of airways (Fig. 5.14D).