LUNG FUNCTION TESTS
MEASURING DISABILITY
After studying this chapter you should be able to:
1. Appreciate that lung function tests quantify disability of function; diagnosis is usually on the basis of clinical history.
2. Explain spirometry and outline the changes in static and dynamic measurements caused by restrictive and obstructive disease.
3. Describe how flow/volume loops are obtained and what changes you would expect to COPD.
4. Outline the principles and advantages of plethysmography.
5. Explain blood gas analysis.
 inequalities.
Spirometry
A simple spirometer (Fig. 5.2, p. 63) will provide much useful information about a patient’s lungs. Large people have larger lungs than small people and age exerts its malign effect. Extensive study of these relationships has provided us with tables which, for example, relate vital capacity to height (see Appendix).
Measurements made on a spirometer may be classified as:
• static, where the only consideration is the volume exhaled, or
• dynamic, where the time taken to exhale a certain volume is what is being measured.
Although such measurements as inspiratory reserve volume (IRV) and expiratory reserve volume (ERV) can be informative, the most usual and useful static spirometric test is the forced vital capacity (FVC). This is ‘forced’ because the subject is enthusiastically urged to breathe in as far as he can and out as far as he can (Fig. 11.1). This test, which can be classed as static because it does not involve an element of time, is often combined with a dynamic test, the FEV1:
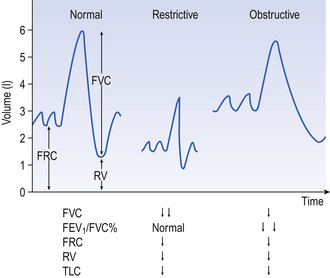
• Forced expired volume in one second (FEV1). The subject is urged to breathe in as far as he can and breathe out as fast and far as he can. The volume he breathes out in 1 second is the FEV1.
Characteristic traces in normals and patients with chronic obstructive (emphyzematous/bronchitic) or restrictive (fibrotic) lung disease are shown in Figure 11.1.
• Functional residual capacity (FRC) and residual volume (RV). Because a subject cannot breathe out all the air in his lungs plethysmographic (see below) and dilution methods have to be used to measure these two lung volumes. RV and FRC are frequently increased in diseases such as asthma, bronchitis and emphysema, when airways resistance is increased, and RV is particularly increased in air-trapping emphysema.
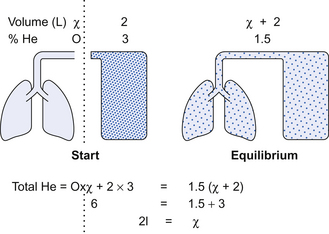
In the helium dilution method the principle is simple. The patient breathes out to FRC or RV, whichever is being measured, and is connected to a spirometer of known volume containing helium (He) at known concentration. The patient breathes normally for an appropriate length of time and the dilution of the He by the RV or FRC in his lungs is measured. The level of the trace of his breathing is carefully watched and oxygen added at the same rate as it is used up to keep the overall volume in lungs + spirometer constant (Fig. 11.2).
Flow measurements
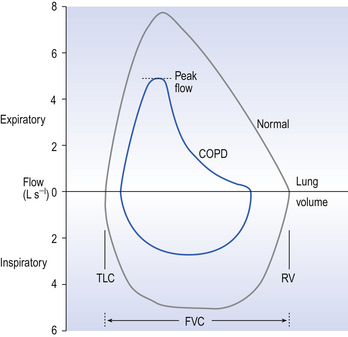
Flow-volume loops. With the subject breathing through a pneumotachograph (Fig. 4.6, p. 45) which measures flow, and by integrating that flow to provide volume, loops of inspiratory and expiratory flowvolume relationships can be recorded. (Fig. 11.3). These loops are constructed by having the patient breathe from total lung capacity down to residual volume several times. They are particularly useful in assessing chronic obstructive pulmonary disease (COPD) where the inspiratory part of the loop has a normal shape, although being of reduced volume, while the expiratory part of the loop has a characteristic ‘scooped out’ shape as flow is restricted by airway collapse.
Plethysmography
This instrument is described in Chapter 4 and consists of an airtight box in which the subject sits. To understand the principles on which this instrument works, consider the subject’s chest as a syringe with the diaphragm represented by the plunger.
The subject first pants against a closed shutter – the neck of the syringe is blocked.
In terms of gas law the situation is as in Figure 11.4A, where a large enclosed volume of gas (the contents of the box) surrounds a small enclosed volume of gas (the air in the lungs) which increases and decreases in volume as it is compressed or decompressed. This change in volume of the syringe compresses and decompresses the air in the box, and so the pressure in the box changes proportionately and in the opposite sense to the pressure in the lungs.
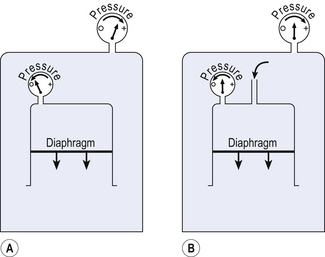
Measuring the pressure changes in the box while the subject pants against a closed shutter enables us to calculate pressure within the lungs (Fig. 11.4) and therefore from the gas laws calculate lung volume, and is usually used to measure functional residual capacity (FRC) and residual volume (RV).
Plethysmography is also used to measure lung volumes (TLC) in patients with severe airflow obstruction in preference to the usual helium (He) dilution technique. This is because in these patients air trapping is so bad that the He cannot get to closed off volumes in the lungs, which are therefore not registered. In plethysmography, however, these closed off volumes are still subject to the gas laws (see the Appendix) on which this technique is based.
The principle of the relationship between box pressure and lung airway pressure does not depend on the ‘syringe’, which represents the lungs, being closed. In Figure 11.4B the narrow tube represents the resistance of the airways, and although air is being forced in to or out of the syringe the relationship between this driving pressure and box pressure still holds. In this case, measuring the driving alveolar pressure (by measuring box pressure) and flow (using a pneumotachograph), we can measure airways resistance.
Lung mechanics
Compliance
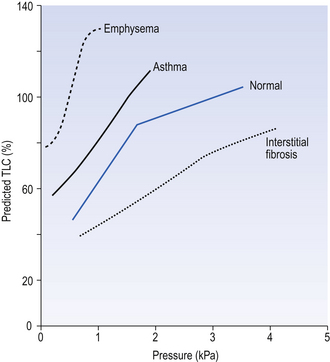
Because compliance depends on lung size, because the curves are not linear (Fig. 11.5) and because there is hysteresis between the inflation and deflation curves, it is conventional to measure volume as a percentage of predicted TLC and to report compliance on the deflation limb of the curve 1 L above predicted FRC.
Resistance
The most usual way of measuring airways resistance these days is using a whole-body plethysmograph, as described above. Alternatively, the variables needed to measure resistance (airflow and the pressure producing that flow) can be obtained with a pneumotachograph (flow) and an oesophageal balloon (pressure), as used to measure compliance. Flow, oesophageal pressure and lung volume are usually measured, so that the contribution made by the elastic recoil of the lungs can be included. This type of measurement is usually called pulmonary resistance, and includes the effect of tissue resistance.
Transfer factor (diffusing capacity)
The theory behind the method of measuring transfer factor was outlined in Chapter 6 (p. 82). Methods of indirectly measuring transfer factor for O2 which are based on a number of questionable assumptions have been developed, but are really only of theoretical interest.
Single-breath method
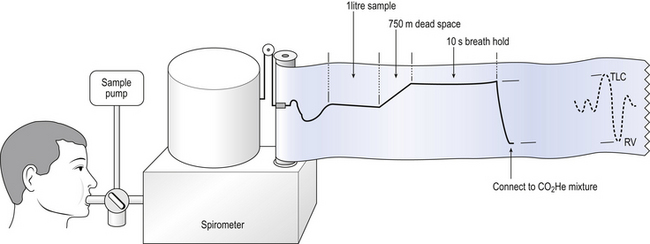
In this method the subject exhales to residual volume then inhales a vital capacity breath containing 0.2% of CO and a known percentage (about 10%) of helium (He). The subject holds his breath for 10 s and then breathes out through a gas analyser (Fig. 11.6). The first 750 mL of the expirate is abandoned to clear the dead space and the sample analysed for CO and He. The dilution of the CO by gas already in the lung is obtained from the fall in He concentration.
Interpretation of a low transfer factor is difficult because a number of factors, such as uneven ventilation, uneven perfusion, uneven emptying and diffusion properties, may be involved. This emphasizes the fact that lung function tests are more important for quantifying disability than for making an accurate diagnosis. In general, however, we find that transfer factor is reduced in emphysema, where respiratory surface has been lost, but less affected in bronchitis, where there has been little destruction of tissue.
Gas washouts
Single-breath washout curves
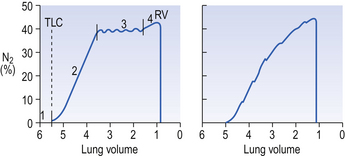
In this test a single breath of O2 is inspired and the N2 concentration is continuously measured at the lips during the following expiration. Better-ventilated regions of the lung will have their residual volume (which contains air from the breath before the single breath of O2) more diluted by O2 than poorly ventilated regions. In healthy subjects residual N2 in the expiration starts at zero (dead-space gas, phase 1; Fig. 11.7).
Multiple-breath washout curves
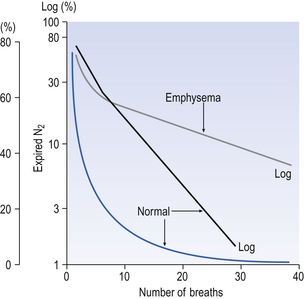
In this test the subject, after breathing room air, is connected to a system of one-way valves which cause him to inhale from a bag of pure O2 and exhale through an N2 meter. With each breath the concentration of N2 is seen to fall as the residual N2 is washed out of the lungs. This is the same process as repeatedly rinsing a piece of cloth which has been dyed: the colour of the water in each successive rinse becomes lighter and lighter. The concentration of N2 (or dye) falls in an exponential curve. If we plot the log of concentration against the number of breaths of O2 taken, the graph is nearly a straight line for healthy subjects, with complete washout of N2 in 5–7 minutes (Fig. 11.8).
Inert gas washout
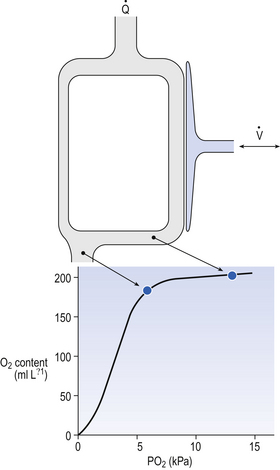
An important concept in uneven distribution of blood flow is that of the virtual shunt. This concept deals with the different degrees of uneven distribution as if they were a single ‘shunt’ of blood from one side of the lungs to the other without coming into contact with alveolar air (Fig. 11.9). The important point is that a subject with such a shunt will not improve the oxygenation of his arterial blood even if he is given pure O2 to breathe. Blood in the shunt cannot be reached by the O2 and continues to make a ‘venous admixture’ to the arterial blood.
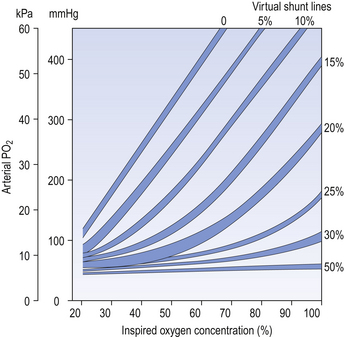
 ratios than this extreme condition, nevertheless virtual shunt is a concept used to construct isoshunt diagrams which help clinicians to estimate how much oxygen to add to a patient’s inspired air.
Blood in the alveolar capillaries, on the other hand, is fully loaded and cannot take much more O2. Therefore, because of the flat upper part of the O2 dissociation curve the Pao2 is considerably depressed, irrespective of whether the subject is breathing air or pure O2. Normograms are used clinically to estimate the ‘virtual shunt’ a patient is suffering from (Fig. 11.10). This is the calculated shunt based on the assumption that the arterial/mixed venous O2 content difference is 50 mL/L.
Multiple inert gas washout
 ratios (in terms of how much of the lungs has a particular ratio) throughout the lungs. This would provide valuable information as to the nature of a defect resulting from disease.
A method of measuring how much blood flow and how much ventilation goes to ‘compartments’ with different  ratios has been developed using inert gases. In this method the lung is considered as consisting of a number of compartments (usually 50). Each compartment is considered independent of all others. A mixture of several (usually six) inert gases of different solubilities is continuously infused into the blood, and their concentrations are measured or calculated in expired air and arterial and venous blood. The gases will partition themselves between the alveolar air and the blood of each compartment. The retention (ratio of arterial to venous concentration) and excretion (ratio of expired to venous concentration) for each gas is plotted against the solubility of the gas in question. The retention/solubility plot yields the distribution of blood flow with respect to
  , and independently the excretion/solubility plot yields the distribution of ventilation with respect to
  . A plot for a normal subject is shown in Figure 11.11A. Note that the
  ratios for the lung compartments are on a log scale, which spreads out the low
  ratios. The distribution of ratios for the patient (Fig. 11.11B) shows many compartments with low
  ratios, and 5% of the total blood flow (calculated separately) going to unventilated compartments (shunt).
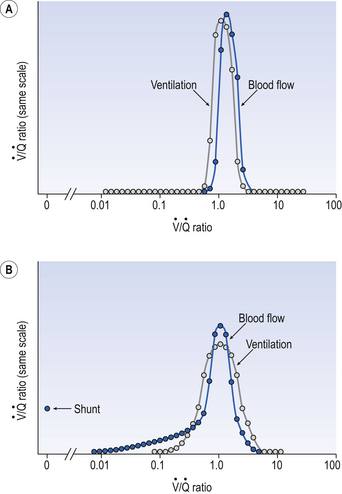
 ratio of that particular compartment. A plot for a normal subject is shown (A) with one for a patient (B) in which 5% of total blood flow is shunted (
 ratio 0) and many compartments have low
  ratios.
Exercise testing
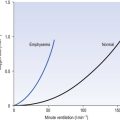
 . This is obtained directly by increasing the exercise level until the patient can no longer continue. Because the relationship between heart rate, cardiac output and oxygen consumption is linear this information can be projected from submaximal responses in vulnerable patients.
The most usual reason for performing an exercise test is to determine whether the symptoms of breathlessness that the patient complains of are of cardiac or respiratory origin. To do this it is useful to compare the ventilation and heart rate obtained with predicted values from age and size matched normals.
Challenge tests
• Washout curves measure uneven distribution of ventilation.
• The concept of ‘virtual shunt’ is used to represent uneven perfusion.
• Multiple inert gas washout curves illustrate the distribution of  inequalities.
• Exercise and inhaled substances are used to stress the respiratory system for diagnostic purposes.