Chapter 3 Ultrasonography in Airway Management
II The Ultrasound Image and how to Obtain It
Ultrasound refers to sound frequencies beyond 20,000 Hz; frequencies from 2 to 15 MHz are typically used for medical imaging. Ultrasound transducers act as both transmitters and receivers of reflected sound. Tissues exhibit differing acoustic impedance values, and sound reflection occurs at the interfaces between different types of tissues. The impedance difference is greatest at interfaces of soft tissue with bone or air. Some tissues give a strong echo (e.g., fat, bone); these are called hyperechoic structures, and they appear white. Other tissues let the ultrasound beam pass easily (e.g., fluid collections, blood in vessels) and therefore create only a weak echo; these are hypoechoic structures and appear black on the screen. When the ultrasound beam reaches the surface of a bone, a strong echo (i.e., a strong white line) appears, and there is a strong absorption of ultrasound, resulting in depiction of only a limited depth of the bony tissue. Nothing is seen beyond the bone because of acoustic shadowing. Cartilaginous structures such as the thyroid cartilage, the cricoid cartilage, and the tracheal rings, appear homogeneously hypoechoic (black), but the cartilages tend to calcify with age.1
Muscles and connective tissue membranes are hypoechoic but have a more heterogeneous, striated appearance than cartilage does. Glandular structures such as the submandibular and thyroid glands are homogeneous and mildly to strongly hyperechoic in comparison with adjacent soft tissues. Air is a very weak conductor of ultrasound, so when the ultrasound beam reaches the border between a tissue and air, a strong reflection (strong white line) appears, and everything on the screen beyond that point represents only artifacts, especially reverberation artifacts, which create multiple parallel white lines on the screen. However, the artifacts that arise from the pleura/lung border often reveal useful information. Visualization of structures such as the posterior pharynx, posterior commissure, and posterior wall of the trachea is prevented by intraluminal air.1 In B-mode USG, an array of transducers simultaneously scans a plane through the body that can be viewed as a two-dimensional image on the screen, depicting a “slice” of tissue.
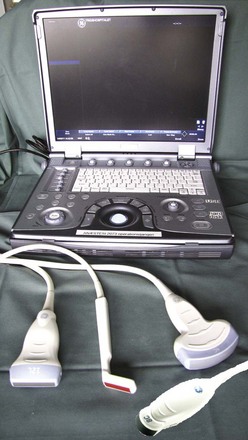
The higher the frequency of the ultrasound wave, the higher the image resolution and the less penetration in depth. All modern ultrasound transducers used in airway management have a range of frequencies that can be adjusted during scanning to optimize the image. The linear high-frequency transducer (Fig. 3-1) is the most suitable for imaging superficial airway structures (within 2 to 3 cm from the skin). The curved low-frequency transducer is most suitable for obtaining sagittal and parasagittal views of structures in the submandibular and supraglottic regions, mainly because of its wider field of view.1 The micro convex transducer gives a wide view of the pleura between two ribs. If only one transducer must be chosen, then a linear high-frequency transducer will enable performance of most ultrasound examinations that are relevant for airway management.
Because air does not conduct ultrasound, the probe must be in full contact with the skin or mucosa without any interfacing air.2 This is achieved by applying judicious amounts of conductive gel between the probe and the skin. Because of the prominent thyroid cartilage, it is sometimes a challenge to avoid air under the probe when performing a sagittal midline scan from the hyoid bone to the suprasternal notch in a male patient. Portable machines can provide accurate answers to basic questions and are sufficient for airway USG.3
III Visualizing the Airway and the Adjacent Structures
A Mouth and Tongue
USG is a simple method for examination of the mouth and its contents. The tongue is composed of an anterior mobile part situated in the oral cavity and a fixed pharyngeal portion. The lingual musculature is divided into the extrinsic muscles (which have a bony insertion and alter the position of the tongue) and intrinsic muscles, whose fibers alter the shape of the tongue.4 The tongue can be visualized from within the mouth, but the image may be difficult to interpret.5,6
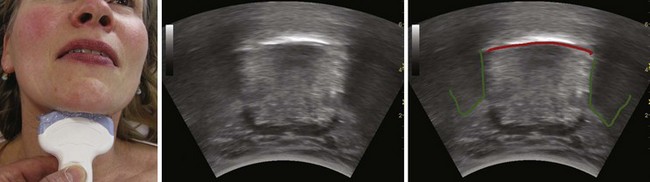
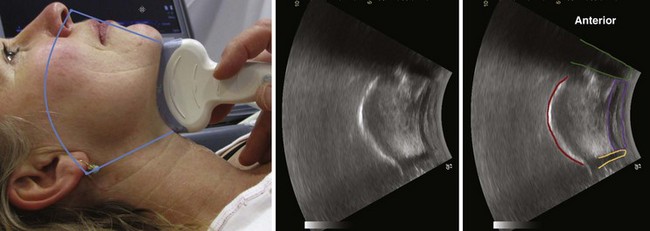
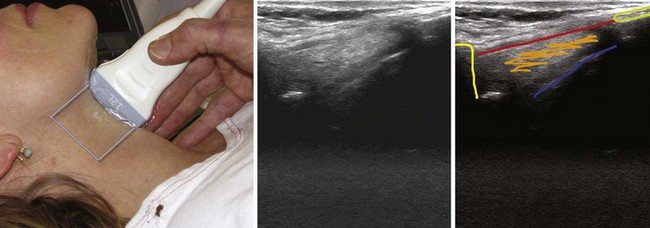
The floor of the mouth and the tongue are easily visualized by placing the transducer submentally. If the transducer is placed in the coronal plane just posterior to the mentum and from there moved posteriorly until the hyoid bone is reached, one can perform a thorough evaluation of all the layers of the floor of the mouth, the muscles of the tongue, and any possible pathologic processes (Fig. 3-2). The scanning image will be flanked by the acoustic shadow of the mandible on each side. The dorsal lingual surface is clearly identified.7 The width of the tongue base can be measured in a standardized way by locating the two lingual arteries with Doppler ultrasound and measuring the distance between these arteries where they enter the tongue base at its lower lateral borders.8 A longitudinal scan of the floor of the mouth and the tongue is obtained if the transducer is placed submentally in the sagittal plane. If a large convex transducer is used, the whole length of the floor of the mouth and the majority of the length of the tongue can be seen in one image (Fig. 3-3). The acoustic shadows from the symphysis of the mandible and from the hyoid bone form the anterior and posterior limits of this image. Detailed imaging of the function of the tongue, including bolus holding, lingual propulsion, lingual-palatal contact, tongue tip and dorsum motion, bolus clearance, and hyoid excursion, can be evaluated in this plane.7
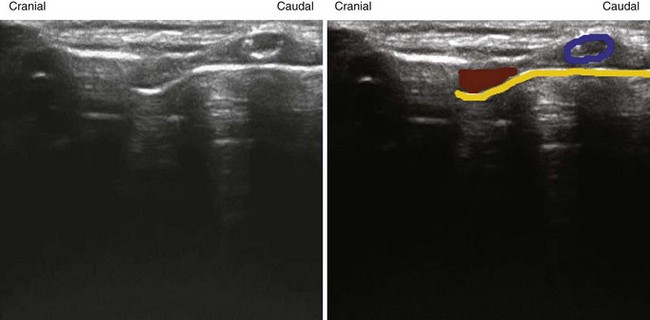
When the tongue is in contact with the palate, the palate can be visualized; if there is no contact with the palate, the air at the dorsum of the tongue will make visualization of the palate impossible. An improved image is achievable if water is ingested and retained in the oral cavity. The water eliminates the air-tissue border and allows visualization of most of the oral cavity including the palate (Fig. 3-4), as well as a better differentiation of the hard palate from the soft palate.4
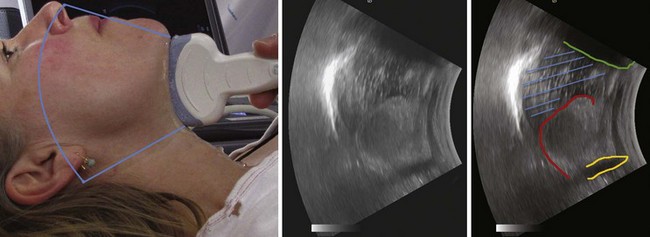
Figure 3-4 The tongue and the mouth are filled with water. Placement of the transducer is the same as in Figure 3-3. The shadow from the mentum of the mandible is outlined in green, the shadow from the hyoid bone in light orange, and the dorsal surface of the tongue in red. The blue lines indicate the water in the mouth. The large white line represents the strong echo from the hard palate.
(From Kristensen MS: Ultrasonography in the management of the airway. Acta Anaesthesiol Scand 55:1155–1173, 2011.)
The tongue can be visualized in detail with the use of three-dimensional USG.9 In a child, the major anatomic components of the tongue and mouth are covered by four scanning positions: the midline sagittal, the parasagittal, the anterior coronal, and the posterior coronal planes.10 In the transverse midline plane just cranial to the hyoid bone, the tongue base and the floor of the mouth are seen. In the transverse (axial) plane in the midline, the lingual tonsils and the valleculae can be imaged. The vallecula is seen just below the hyoid bone, and when the probe is angled caudally, the preglottic and paraglottic spaces and the infrahyoid part of the epiglottis are seen.11
B Oropharynx
Imaging of a part of the lateral border of the mid-oropharynx can be obtained by placing the transducer vertically with its upper edge approximately 1 cm below the external auditory canal.7 The lateral pharyngeal border and the thickness of the lateral parapharyngeal wall can be determined.12 The parapharyngeal space can also be visualized via the mouth by placing the probe directly over the mucosal lining of the lateral pharyngeal wall, but this approach is difficult for the patient to tolerate.13
C Hypopharynx
By performing USG through the thyrohyoid membrane, cricothyroid space, cricothyroid membrane (CTM), and thyroidal cartilage lamina and along the posterior edge of the thyroid lamina, it is possible to locate and classify hypopharyngeal tumors with a success rate as high as that achieved with computed tomography (CT) scanning.14
D Hyoid Bone
The hyoid bone is a key landmark that separates the upper airway into two scanning areas: the suprahyoid and infrahyoid regions. The hyoid bone is visible on the transverse view as a superficial, hyperechoic, inverted U–shaped, linear structure with posterior acoustic shadowing. On the sagittal and parasagittal views, the hyoid bone is visible in cross section (see Fig. 3-4) as a narrow, hyperechoic, curved structure that casts an acoustic shadow.1
E Larynx
Because of the superficial location of the larynx, USG offers images of higher resolution than CT or magnetic resonance imaging (MRI) when a linear high-frequency transducer is used.11 The different parts of the laryngeal skeleton have different sonographic characteristics.15 The hyoid bone is calcified early in life, and its bony shadow is an important landmark. The thyroid and cricoid cartilages show variable but progressive calcification throughout life, whereas the epiglottis stays hypoechoic. The true vocal cords overlie muscle that is hypoechoic, whereas the false cords contain echoic fat.
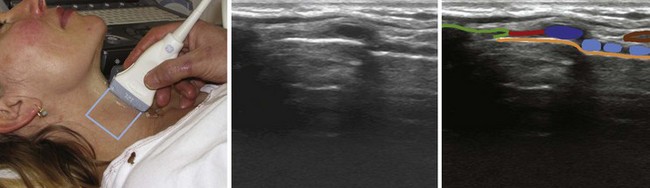
The thyrohyoid membrane runs between the caudal border of the hyoid bone and the cephalad border of the thyroid cartilage and provides a sonographic window through which the epiglottis can be visualized in all subjects when the linear transducer is oriented in the transverse plane (with varying degrees of cephalad or caudad angulation).1 The midline sagittal scan through the upper larynx from the hyoid bone cranially to the thyroid cartilage distally (Fig. 3-5) reveals the thyrohyoid ligament, the pre-epiglottic space containing echogenic fat, and, posterior to that, a white line representing the laryngeal surface of the epiglottis.15 On parasagittal view, the epiglottis appears as a hypoechoic structure with a curvilinear shape; on transverse view, it is shaped like an inverted C. It is bordered anteriorly by the hyperechoic, triangular pre-epiglottic space and lined posteriorly by a hyperechoic air-mucosa interface.16 In a convenience sample of 100 subjects, the transverse midline scan cranially to the thyroid cartilage depicted the epiglottis in all subjects and revealed an average epiglottis thickness of 2.39 mm.17
In the cricothyroid region, the probe can be angled cranially to assess the vocal cords and the arytenoid cartilages and thereafter moved distally to access the cricoid cartilages and the subglottis.11 With transverse scanning in the paramedian position, the following structures can be visualized (starting cranially and moving distally): faucial tonsils, lateral tongue base, lateral vallecula, strap muscles, laminae of the thyroid cartilage, the lateral cricoid cartilage, and, posteriorly, the piriform sinuses and the cervical esophagus.11
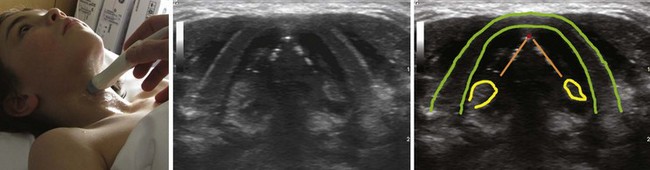
The laryngeal cartilage is noncalcified in the child, but calcification starts in some individuals before 20 years of age, and it increases with age. In subjects with noncalcified cartilage, the thyroid cartilage is visible on sagittal and parasagittal views as a linear, hypoechoic structure with a bright air-mucosa interface at its posterior surface. On the transverse view, it has an inverted V shape (Fig. 3-6), within which the true and false vocal cords are visible.1 By 60 years of age, all individuals show signs of partial calcification, and approximately 40% of the cartilage at the level of the vocal cords is calcified.18 The calcification is seen as a strong echo with posterior acoustic shadowing. Often the anatomic structures can be visualized despite the calcifications by angling the transducer. In a population of patients who were examined due to suspicion of laryngeal pathology, a sufficient depiction of the false cords was obtained in 60% of cases, of the vocal cords in 75%, of the anterior commissure in 64%, and of the arytenoid region in 71%; in 16% of cases, no endolaryngeal structures could be depicted.18
F Vocal Cords
In individuals with noncalcified thyroid cartilages, the false and the true vocal cords can be visualized through the thyroid cartilage.15 In individuals with calcified thyroid cartilage, the vocal cords and the arytenoid cartilages can still be seen by combining the scan obtained by placing the transducer just cranially to the superior thyroid notch angling it caudally with the scans obtained from the CTM in the midline and on each side with the transducer angled 30 degrees cranially.11 In a study group of 24 volunteers with a mean age of 30 years, the thyroid cartilage provided the best window for imaging the vocal cords. In all participants, it was possible to visualize and distinguish the true and false vocal cords by moving the transducer in a cephalocaudad direction over the thyroid cartilage.1
The true vocal cords appear as two triangular, hypoechoic structures (the vocalis muscles) outlined medially by the hyperechoic vocal ligaments (see Fig. 3-6). They are observed to oscillate and move toward the midline during phonation.1 In a study of 229 participants ranging in age from 2 months to 81 years, the true and false cords were visible in all female participants. In males, the visibility was 100% for those younger than 18 years and gradually decreased to less than 40% in males 60 years of age and older.19 The false vocal cords lie parallel and cephalad to the true cords, are more hyperechoic in appearance, and remain relatively immobile during phonation.
G Cricothyroid Membrane and Cricoid Cartilage
The CTM runs between the caudal border of the thyroid cartilage and the cephalad border of the cricoid cartilage. It is clearly seen on sagittal (Fig. 3-7) and parasagittal views as a hyperechoic band linking the hypoechoic thyroid and cricoid cartilages.1 The cricoid cartilage has a round, hypoechoic appearance on the parasagittal view and an arch-like appearance on the transverse view.
H Trachea
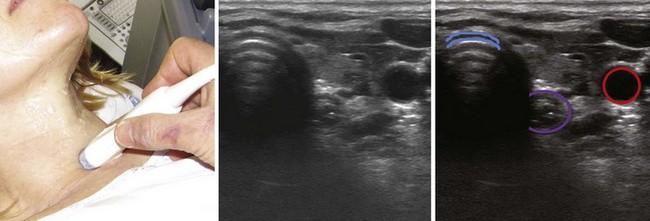
The location of the trachea in the midline of the neck makes it a useful reference point for transverse ultrasound imaging. The cricoid cartilage marks the superior limit of the trachea; it is thicker than the tracheal rings below and is seen as a hypoechoic, rounded structure. It serves as a reference point during performance of the sagittal midline scan (see Fig. 3-7). Often the first six tracheal rings can be imaged when the neck is in mild extension.13 The trachea is covered by skin, subcutaneous fat, the strap muscles, and, at the level of the second or third tracheal ring, the isthmus of the thyroid gland (see Fig. 3-7). The strap muscles appear hypoechoic and are encased by thin hyperechoic lines from the cervical fascia.13 A high-riding innominate artery may be identified above the sternal notch as a transverse anechoic structure crossing the trachea.13 The tracheal rings are hypoechoic, and they resemble a “string of beads” in the parasagittal and sagittal plane (see Fig. 3-7). In the transverse view, they resemble an inverted U highlighted by a hyperechoic air-mucosa interface (Fig. 3-8) and by reverberation artifact posteriorly.1
I Esophagus
The cervical esophagus is most often visible posterolateral to the trachea on the left side at the level of the suprasternal notch (see Fig. 3-8). The concentric layers of esophagus result in a characteristic “bull’s-eye” appearance on USG. The esophagus can be seen to compress and expand with swallowing, and this feature can be used for accurate identification.13 The patient may be placed in a modified position for examining the esophagus by slightly flexing the neck with a pillow under the head and turning the head 45 degrees to the opposite side while the neck is scanned on either side; this technique makes the esophagus visible also on the right side in 98% of cases.20
J Lower Trachea and Bronchi
Transesophageal USG displays a part of the lower trachea. When a saline-filled balloon is introduced in the trachea during cardiopulmonary bypass, it is possible to perform USG through the trachea, thus displaying the proximal aortic arch and the innominate artery.21 The bronchial wall and its layers can be visualized from within the airway by passing a flexible ultrasound probe through the working channel of a flexible bronchoscope. This technique, called end bronchial ultrasound, reliably distinguishes between airway infiltration and compression by tumor.22
K Peripheral Lung and Pleura
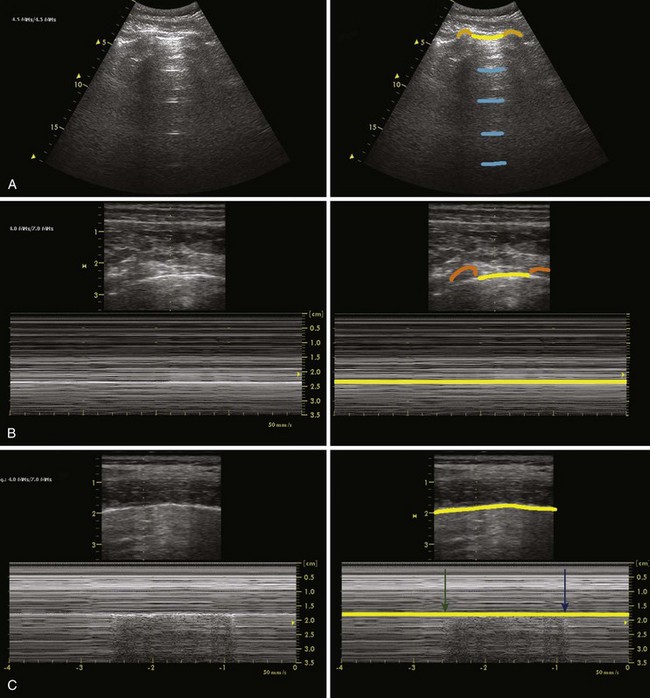
The ribs are identifiable by their acoustic shadow, and between two ribs a hyperechoic line is visible. This line, called the pleural line, represents the interface between the soft tissue of the chest wall and air (Fig. 3-9). In the normal breathing or ventilated subject, one can identify a kind of to-and-fro movement synchronous with ventilation; this is called “pleural sliding” or “lung sliding.”23 The movement is striking because the surrounding tissue is motionless.24 Lung sliding is best seen dynamically, in real time or on video.25
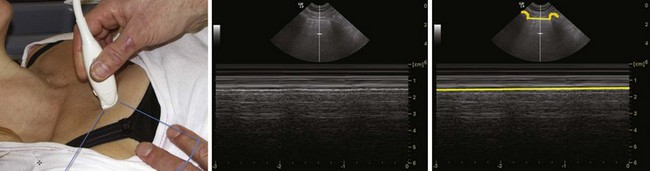
The investigation should always start by placing the probe perpendicular to the ribs and in such a way that two rib shadows are identified. The succession of the upper rib, pleural line, and lower rib outlines a characteristic pattern, the “bat sign” (see Fig. 3-9) and must be recognized to correctly identify the pleural line and avoid interpretation errors due to a parietal emphysema. Lung ultrasound examination should therefore be considered not feasible if the bat sign is not identified.26 Lung sliding can be objectified using the time-motion mode, which highlights a clear distinction between a wave-like pattern located above the pleural line and a sand-like pattern below, called the “seashore sign” (see Fig. 3-9).26
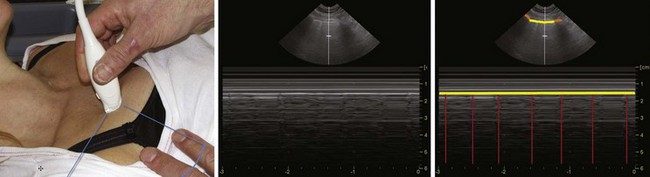
In breath-holding or apnea, there is no lung sliding, but a “lung pulse”—small movements synchronous with the heartbeat—is seen instead (Fig. 3-10). The lung pulse can be explained as the vibrations of the heart are transmitted through a motionless lung. The lung pulse can also be demonstrated in the time-motion M-mode scanning. There is a strong echo from the pleural line, and dominant reverberation artifacts of varying strength are seen. They appear as lines parallel to the pleural line and spaced with the same distance as the distance from the skin surface to the pleural line. These “A-lines” are seen in both the normal and the pathologic lung.26
The “B-line” is an artifact with seven features: It is (1) a hydrometric comet-tail artifact that (2) arises from the pleural line, (3) is hyperechoic, (4) is well defined, (5) spreads up indefinitely (i.e., spreads to the edge of the screen without fading—up to 17 cm with a probe reaching 17 cm26), (6) erases A-lines, and (7) moves with lung sliding when lung sliding is present.27 Sparse B-lines occur in normal lungs but three or more B-lines indicates pathology (e.g., interstitial syndrome).27 B-lines are also called “ring-down” artifacts.28
L Diaphragm
The diaphragm and its motion can be imaged by placing a convex transducer in the subxiphoid window in the middle upper abdominal region, just beneath the xiphoid process and the lower margin of the liver. The transducer is tilted 45 degrees cephalad, and bilateral diaphragm motion is noticed.29 The bilateral diaphragm moves toward the abdomen when the lungs are ventilated and toward the chest during the relaxation phase. The liver and spleen movements represent the whole movement of the right and left diaphragm during respiration and can be visualized by placing the probe in the longitudinal plane along the right anterior axillary line and the left posterior axillary line, respectively. The movement of the most caudal margin of the liver and spleen with respiration is measured.30
IV Clinical Applications
A Prediction of Difficult Laryngoscopy in Surgical Patients
In a pilot study of 27 elective surgical patients, it was found that failure to identify the epiglottis and trachea with sublingual USG was a more accurate predictor of a Cormack-Lehane grade 3 or greater laryngoscopy score than the Mallampati classification was.31 However, the interpretation of the sublingual USG approach was later reevaluated, and it remains to be determined whether this approach is useful in predicting airway difficulties.6 In 50 morbidly obese patients, the distance from the skin to the anterior aspect of the trachea, measured at the level of the vocal cords and the suprasternal notch, was significantly greater in those patients in whom laryngoscopy was difficult, even after optimization of laryngoscopy by laryngeal manipulation. However, these findings could not be reproduced when the end point was laryngoscopy grade without the use of laryngeal manipulation for optimization of the laryngoscopic view.32,33
B Evaluation of Pathology That May Influence the Choice of Airway Management Technique
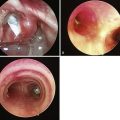
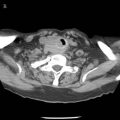
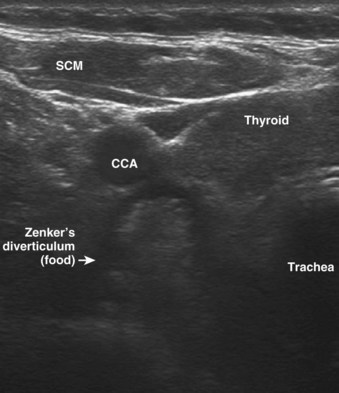
Subglottic hemangiomas, laryngeal stenosis, laryngeal cysts, and respiratory papillomatosis (Fig. 3-11) can be visualized with USG. A pharyngeal pouch (Zenker’s diverticulum), representing a source of regurgitation and aspiration, is seen on a transverse linear high-frequency scan of the neck and is located at the posterolateral aspect of the left thyroid lobe (Fig. 3-12).11,34–36 Malignancies and their relationship with the airway can be seen and quantified.
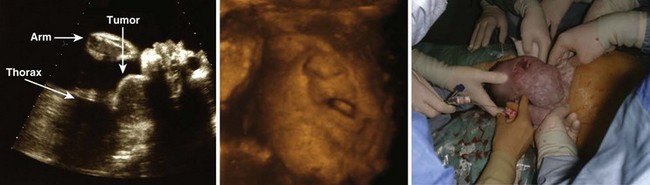
Fetal airway abnormalities, such as extrinsic obstruction caused by adjacent tumors (e.g., lymphatic malformation, cervical teratoma), can be visualized by prenatal USG (Fig. 3-13).37 With this information, airway management can be planned, either at birth or as an ex utero intrapartum treatment (EXIT) procedure. The EXIT maneuver can consist of performing a cesarean section and endotracheal intubation or tracheostomy while the newborn is still attached to the umbilical cord and thus maintains fetal circulation.
C Diagnosis of Obstructive Sleep Apnea
The width of the tongue base, measured by USG, was found to correlate with the severity of sleep-related breathing disorders, including a patient’s sensation of choking during the night. The width was measured as the distance between the lingual arteries where they enter the tongue base at its lower lateral borders.8 The thickness of the lateral pharyngeal wall, as measured with USG, is significantly higher in patients with obstructive sleep apnea than in patients without this condition.12
D Evaluation of Prandial Status
Twenty subjects were randomized to either fasting or nonfasting status and had their stomach examined with USG. The technique was found to be specific in identifying a full stomach but only moderately reliable in identifying an empty stomach. After the subjects drank water, the stomach was identified 100% of the time by all observers in both conditions. Recent publications have suggested clinical usefulness of USG in determining prandial status.38–40
E Prediction of the Appropriate Diameter of an Endotracheal, Endobronchial, or Tracheostomy Tube
In children and young adults, USG is a reliable tool for measuring the diameter of the subglottic upper airway and correlates well with MRI, which is the gold standard.41,42
The diameter of the left main stem bronchus, and therefore the proper size of a left-sided double-lumen tube, can be estimated with USG. Immediately before anesthesia in a series of patients, the outer diameter of the trachea was measured by USG just above the sternoclavicular joint in the transverse section. The ratio between the diameter of the trachea and that of the left main stem bronchus was obtained from CT images. The ratio between left main stem bronchus diameter on CT imaging and outer tracheal diameter measured with USG was 0.68. The results were comparable to those obtained with chest radiography as a guide for selecting left double-lumen tube size.43
In children with tracheostomy, USG measurement of the tracheal width and of the distance from the skin to the trachea can be used to predict the size and shape of a potential replacement tracheostomy tube, and adequate images can be obtained by placing the ultrasound probe just superior to the stomach.44
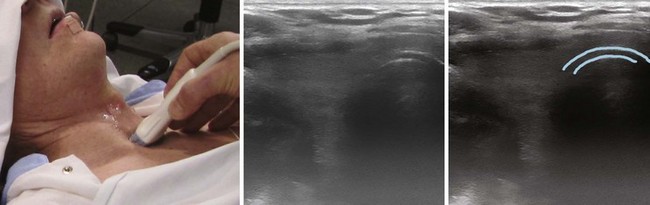
F Localization of the Trachea
Obesity, a short thick neck, neck mass, previous surgery or radiotherapy to the neck, and thoracic pathology resulting in tracheal deviation can make accurate localization of the trachea challenging and cumbersome. Even the addition of chest radiography and techniques of needle aspiration to locate the trachea may be futile.45 This situation is even more challenging in emergency cases and in cases where awake tracheostomy is chosen because of a predicted difficult mask ventilation or difficult endotracheal intubation. Under such circumstances, preoperative USG for localization of the trachea (Fig. 3-14) is very useful.45
G Localization of the Cricothyroid Membrane
The CTM plays a crucial role in airway management, but it was correctly identified by anesthesiologists in only 30% of cases when identification was based on surface landmarks and palpation alone.46 USG allows reliable, quick, and easily learned identification of the CTM.46–48 USG is a useful technique to identify the trachea before elective transtracheal cannulation or emergency cricothyrotomy. This was demonstrated by a case concerning an obese patient with Ludwig’s angina in whom it was not possible to identify the trachea by palpation. A portable ultrasound machine was used to locate the trachea 2 cm lateral to the midline.49 Accurate localization of the trachea allows the clinician to approach the difficult airway by placing a transtracheal catheter or performing a tracheostomy before anesthesia. In cases of awake intubation, it provides the added safety of having localized the CTM in advance in case the intubation should fail and an emergency transcricoid access should become necessary.
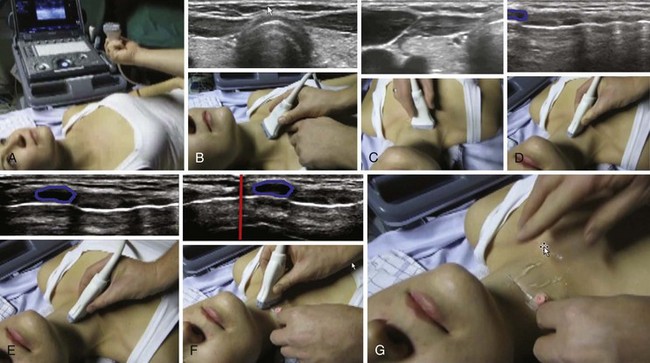
One method for localizing the CTM is described as follows: A transverse, midline scan is performed from the clavicles to the mandible with a 10-MHz linear array probe, and the CTM is identified by its characteristic echogenic artifact, the cricothyroid muscles lateral to it, and the thyroid cartilage cephalad.48 In a study of 50 emergency department patients, the craniocaudal level of the CTM was located by performing a longitudinal sagittal midline scan and then sliding the probe bilaterally to localize the lateral borders of the CTM. The mean time to visualization of the CTM was 24.3 seconds.47 A simple and systematic approach to localizing the CTM is shown in Figure 3-15.
H Airway-Related Nerve Blocks
USG has casuistically been used to identify and block the superior laryngeal nerve as part of the preparation for awake fiberoptic intubation. The greater horn of the hyoid bone and the superior laryngeal artery were identified, and the local analgesic was injected between them.50 In 100 ultrasound examinations for the superior laryngeal nerve space (i.e., the space delimited by the hyoid bone, the thyroid cartilage, the pre-epiglottic space, the thyrohyoid muscle, and the membrane between the hyoid bone and the thyroid cartilage), all components of the space were seen in 81% of cases, and there was a suboptimal, but still useful, depiction of the space in the remaining 19% of cases. The superior laryngeal nerve itself was not seen.51
I Confirmation of Endotracheal Tube Placement
Both the direct and the indirect confirmation techniques have the advantage over capnography because they can be applied in very-low-cardiac-output situations. USG has the advantage over stethoscopy in that it can be performed in noisy environments, such as in helicopters. In a cadaver model in which a 7.5-MHz curved probe was placed longitudinally over the CTM, it was possible for residents given only 5 minutes of training in the technique to correctly identify esophageal intubation (97% sensitivity) with dynamic examination at the time of intubation. When the examination was performed after the intubation, statically, the sensitivity was very poor.52
In 40 elective patients, a 3- to 5-MHz curved transducer placed at the level of the CTM and held at a 45-degree angle facing cranially allowed detection of all five accidental esophageal intubations. Tracheal passage of the ETT was seen as a brief flutter deep to the thyroid cartilage, whereas esophageal intubation created a clearly visible bright (hyperechoic) curved line with a distal dark area (shadowing) appearing on one side of, and deep to, the trachea.53
In another study, 33 patients with normal airways were intubated electively in both trachea and esophagus in random order and had a linear 5- to 10-MHz probe placed transversely on the anterior neck just superior to the suprasternal notch. USG allowed detection of both tracheal and esophageal intubation in all 33 patients. It was concluded that skilled ultrasonographers, in a controlled operating room setting, can consistently detect the passage of an ETT into either the trachea or the esophagus in normal airways.54
In children, direct confirmation of ETT placement by scanning via the CTM required multiple views; the USG examination was apparently performed after the intubation, making comparison to other studies difficult, and the feasibility of that approach has been challenged.55,56
Indirect confirmation of ETT placement in 15 patients was performed with the use of a portable, handheld ultrasound machine and routine scanning in the third and fourth intercostal spaces on both sides during the phases of preoxygenation, apnea, bag-mask ventilation, intubation, and positive-pressure ventilation after intubation. ETT placement was determined in all cases.57
The color power Doppler function has been used as a supplement during observation of lung sliding to detect that a lung was ventilated.57 The distinction between tracheal and endobronchial intubation can be made by scanning the lung bilaterally. If there is pleural sliding on one side and lung pulse on the other side, the tip of the tube is in the main stem bronchus on the side on which lung sliding is observed. The ETT is then withdrawn until lung sliding is observed bilaterally, indicating that the tip of the tube is again placed in the trachea.58 Indirect confirmation of intubation by detection of a “sliding lung” was studied in fresh ventilated cadavers; the tip of the ETT was placed in either the esophagus, the trachea, or the right main stem bronchus. A high sensitivity (95% to 100%) was found for detection of esophageal versus airway (trachea or bronchus) intubation. The sensitivity for distinguishing a right main stem bronchus intubation from an endotracheal intubation was lower (69% to 78%), most likely because of transmitted movement of the left lung due to expansion of the right lung.59
Indirect confirmation of intubation by depiction of the movement of the diaphragm bilaterally was shown to be useful for distinguishing between esophageal and endotracheal intubation in a pediatric population.29 However, when the technique was used to distinguish between main stem bronchus and endotracheal intubation, diaphragmatic ultrasound was not equivalent to chest radiography for determining ETT placement within the airway.60
The combination of the direct transverse scan on the neck at the level of the CTM and lung ultrasound detecting lung sliding in 30 emergency department patients who needed endotracheal intubation correctly detected the three cases of esophageal intubation, even in the presence of four cases of pneumohemothorax.61 The combination of the direct transverse scan on the neck at the level of the thyroid lobes, combined with lung ultrasound, has casuistically demonstrated its value by enabling detection of esophageal intubation in a patient in whom laryngoscopy was difficult in the clinical emergency setting.62
Filling the cuff with fluid helps in seeing the cuff position on USG.63 Use of a metal stylet does not augment visualization of the ETT.64 In children, when the transducer was placed at the level of the glottis, the vocal cords were always visible; the passing of the ETT was visible in all children and was characterized by widening of the vocal cords.65 USG is also useful in confirming the correct position of a double-lumen tube.43
J Tracheostomy
Accurate localization of the trachea in the absence of surface landmarks can be very challenging and cumbersome. Preoperative USG for localization of the trachea (see Fig. 3-14) is very suitable for both surgical tracheostomy and percutaneous dilatational tracheostomy (PDT).45 In children, preoperative USG is of value in verifying the precise tracheostomy position and thereby preventing subglottic damage to the cricoid cartilage and the first tracheal ring, hemorrhage due to abnormally placed or abnormally large blood vessels, and pneumothorax.66
K Percutaneous Dilatational Tracheostomy
USG allows localization of the trachea, visualization of the anterior tracheal wall and pretracheal tissue including blood vessels, and selection of the optimal intercartilaginous space for placement of the tracheostomy tube.67,68 The distance from the skin surface to the tracheal lumen can be measured to predetermine the length of the puncture cannula that is needed to reach the tracheal lumen without perforating the posterior wall.69 The same distance can be used to determine the optimal length of the tracheostomy cannula.70
Ultrasound-guided PDT was applied in a case in which bronchoscope-guided technique had been abandoned.69 Autopsy in cases of fatal bleeding after PDT revealed that the tracheostomy level was much more caudal than intended and that the innominate vein and the arch of the aorta had been eroded. It is likely that the addition of a USG examination to determine the level for the PDT and to avoid blood vessels could diminish this risk.71 PDT results in a significantly lower rate of cranial misplacement of the tracheostomy tube compared with “blind” placement.68 Bronchoscope-guided PDT often results in considerable hypercapnia, whereas Doppler ultrasound–guided PDT does not.72
In a prospective series of 72 PDTs, the combination of USG and bronchoscopy was applied. Before the procedures, all subjects had their pretracheal space examined with USG; the findings led to a change in the planned puncture site in 24% of cases and to a change of procedure to surgical tracheostomy in one case in which the ultrasound examination revealed a goiter with extensive subcutaneous vessels.73 A different approach, namely trying to follow the needle during its course through the tissue overlying the trachea, was tried in a cadaver model. A small curved transducer was used in the transverse plane to localize the tracheal midline and was then turned to the longitudinal plane to allow needle puncture in the inline plane and to follow the needle’s course from skin surface to trachea. After guidewire insertion a CT scan was performed that demonstrated that although all punctures had successfully entered the trachea on the first (89%) or second (11%) attempt, the guidewire was placed laterally to the ideal midline position in five of nine cadavers.74 Another approach using real-time ultrasound guidance with visualization of the needle path by means of a linear high-frequency transducer placed transversely over the trachea was more successful and resulted in visualization of the needle path und satisfactory guidewire placement in all of 13 patients.75
L Confirmation of Gastric Tube Placement
Abdominal USG performed in the intensive care unit (ICU) had a 97% sensitivity for detecting correct gastric placement of a weighted-tip nasogastric (NG) tube. Immediately after insertion of the NG tube, the metal stylet was removed and a 2- to 5-MHz convex transducer was used to examine the duodenum in the middle gastric area. If the NG tube was not visualized, the probe was oriented toward the left upper abdominal quadrant to visualize the gastric area. If the NG tube tip was still not visible, 5 mL normal saline mixed with 5 mL air was injected into the tube to visualize the hyperechoic “fog” exiting the tip. The tip of the NG tube was considered to be correctly located when it was seen to be surrounded by fluid and echogenic moving formations (related to peristalsis). The tip of the NG tube was visualized by sonography in 34 of 35 cases. Radiography correctly identified all 35 catheters, but the radiographic confirmation lasted on average 180 minutes (range, 113 to 240 minutes); in contrast, the sonographic examinations lasted 24 minutes on average (range, 11 to 53 minutes). The authors concluded that bedside USG performed by nonradiologists is a sensitive method for confirming the position of weighted-tip NG feeding tubes, that it is easily taught to ICU physicians, and that conventional radiography can be reserved for cases in which USG is inconclusive.76
A Sengstaken-Blakemore tube may be applied for severe esophageal variceal bleeding, but there are considerable complications, including death, from esophageal rupture after inadvertent inflation of the gastric balloon in the esophagus.77 USG of the stomach can aid in the rapid confirmation of correct placement. If the Sengstaken tube is not directly visible, inflation of 50 mL air via the gastric lumen (not the gastric balloon!) of the tube should lead to a characteristic jet of echogenic bubbles within the stomach. The gastric balloon is slowly inflated under direct USG control and usually appears as a growing echogenic circle within the stomach.77
M Diagnosis of Pneumothorax
USG is as effective as chest radiography in detecting or excluding pneumothorax.28 It is even more sensitive in the ICU setting: USG was able to establish the diagnosis in the majority of patients in whom a pneumothorax was invisible on plain radiographs but diagnosed by CT scan.26 In patients with multiple injuries, USG was faster and had a higher sensitivity and accuracy compared to chest radiography.78
The presence of lung sliding or lung pulse on USG examination indicates that two pleural layers are in close proximity to each other at that specific point under the transducer (i.e., there is no pneumothorax there). If there is free air (pneumothorax) in the part of the pleural cavity underlying the transducer, no lung sliding or lung pulse will be seen, and A-lines (Fig. 3-16) will be more dominant.26 In the M-mode, the “stratosphere sign” will be seen: only parallel lines through all of the depth of the image (see Fig. 3-16). If the transducer is placed right at the border of the pneumothorax, where the visceral pleura intermittently is in contact with the parietal pleura, the lung point will be seen. This is a sliding lung alternating with A-lines, synchronous with ventilation. The lung point is pathognomonic for pneumothorax (see Fig. 3-16). If a pneumothorax is suspected, the rib interspaces of the thoracic cavity can be systematically “mapped” to confirm or rule out a pneumothorax. An online video is available to view the lung point (http://www.airwaymanagement.dk/index.php?option=com_content&view=article&id=3&Itemid=2 [accessed January 2011]).25
The detection of lung sliding has a negative predictive value of 100%, meaning that when lung sliding is seen, a pneumothorax of the part of the lung beneath the ultrasound probe is ruled out.24 For diagnosis of occult pneumothorax, the abolition of lung sliding alone had a sensitivity of 100% and a specificity of 78%. Absent lung sliding plus the A-line sign had a sensitivity of 95% and a specificity of 94%. The lung point had a sensitivity of 79% and a specificity of 100%.26
A systematic approach is recommended when examining the supine patient. The anterior chest wall can be divided into quadrants and the probe first placed at the most superior aspect of the thorax with respect to gravity (i.e., the lower part of the anterior chest wall in supine patients). The probe is then positioned on each of the four quadrants of the anterior area, followed by the lateral chest wall between the anterior and posterior axillary lines and the rest of the accessible part of the thorax.26
N Differentiation Among Different Types of Lung and Pleura Pathology
Seventy percent of the pleural surface is accessible to ultrasound examination.28 In a study of 260 dyspneic medical-ICU patients with acute respiratory failure, the results of lung USG (performed by a dedicated specialist in lung USG) on initial presentation in the ICU were compared with the final diagnosis by the ICU team. Three items were assessed: artifacts (horizontal A-lines or vertical B-lines indicating interstitial syndrome), lung sliding, and alveolar consolidation or pleural effusion or both. Predominant A-lines plus lung sliding indicated asthma or chronic obstructive pulmonary disease with 89% sensitivity and 97% specificity. Multiple anterior diffuse B-lines with lung sliding indicated pulmonary edema with 97% sensitivity and 95% specificity. The use of these profiles would have provided correct diagnoses in 90.5% of cases. It was concluded that lung ultrasound can help the clinician make a rapid diagnosis in patients with acute respiratory failure.27
USG can detect pleural effusion and differentiate between pleural fluid and pleural thickening, and it is more accurate and preferable to radiographic measurement in the quantification of pleural effusion.28 Routine use of lung USG in the ICU setting can lead to a reduction of the number of chest radiographs and CT scans performed.79
O Prediction of Successful Extubation
In a study of adult ventilator-treated patients, the transducer was placed on the CTM with a transverse view of the larynx. The width of the air column was significantly smaller in the group of patients who developed postextubation stridor.80 However, the number of patients in the stridor group was small (n = 4), and these results need to be evaluated in larger studies.
Intubated patients receiving mechanical ventilation in a medical ICU had their breathing force evaluated by USG. The probe was placed along the right anterior axillary line and the left posterior axillary line for measurement of liver and spleen displacement in craniocaudal aspects, respectively. The cutoff value of diaphragmatic displacement for predicting successful extubation was determined to be 1.1 cm. The liver and spleen displacements measured in the study were thought to reflect the “global” functions of the respiratory muscles, and this method provided a good parameter of respiratory muscle endurance and predictor of extubation success.30
V Special Techniques and Future Aspects
The lateral position of a laryngeal mask airway cuff can be seen on USG if the cuff is filled with fluid, but the fluid damages the cuff on subsequent autoclaving.63 Airway obstruction due to a prevertebral hematoma after difficult central line insertion may be prevented by using USG for this procedure.81 The larynx can be depicted from the luminal side by filling the larynx and the trachea above the cuff of the ETT with 0.9% saline to obtain sufficient tissue connection and to prevent the retention of air bubbles in the anterior commissure. The technique involves use of a thin-catheter high-frequency probe with a rotating mirror to spread the ultrasound ray, which produces a 360-degree image rectilinear to the catheter.82,83 Three-dimensional, pocket-size USG devices are likely to move the boundaries for both the quality and the availability of USG imaging of the airway.
VI Learning Ultrasonography
The following studies provide insight into what (and how little) is required to learn basic airway USG. After 8.5 hours of focused training comprising a 2.5-hour didactic course that included essential views of normal and pathologic conditions and three hands-on sessions of 2 hours each, physicians without previous knowledge of USG were able to competently perform basic general USG examinations. The examinations were aimed at diagnosing the presence of pleural effusion, intra-abdominal effusion, acute cholecystitis, intrahepatic biliary duct dilation, obstructive uropathy, chronic renal disease, and deep venous thrombosis. In addition, the physicians correctly answered 95% of questions with a potential therapeutic impact.3
The USG experience needed to make a correct diagnosis is probably task specific. In other words, the basic skill required to detect a pleural effusion may be acquired in minutes and may then improve with experience.84 A 25-minute instructional session, including both a didactic portion and hands-on practice, was given to critical care paramedics/nurses who were part of a helicopter critical care transport team. The instructional session focused solely on detection of the presence or absence of lung sliding, including secondary techniques such as power Doppler and M-mode USG. The participants’ performance was studied on fresh ventilated cadavers. The presence or absence of lung sliding was correctly identified in 46 of 48 trials, for a sensitivity of 96.9% and a specificity of 93.8%. In a follow-up after 9 months, the presence or absence of lung sliding was correctly identified in all of 56 trials, resulting in a sensitivity and specificity of 100%.85
As mentioned earlier, residents given only 5 minutes of training were able to correctly identify esophageal intubation with 97% sensitivity when USG was performed dynamically, whereas the sensitivity was very poor when the examination was performed after the intubation.52
VIII Clinical Pearls
• USG has many advantages for imaging the airway: It is safe, quick, repeatable, portable, and widely available and gives real-time dynamic images.
• USG must be used dynamically for maximum benefit and in direct conjunction with the airway management (immediately before, during, and after airway interventions).
• Direct observation can be made of whether an ETT is entering the trachea or the esophagus by placing the ultrasound probe transversely on the neck at the level of the suprasternal notch during intubation; in this way, intubation can be confirmed without the need for ventilation or circulation.
• The cricothyroid membrane (CTM) can easily be identified by USG prior to management of a difficult airway.
• Ventilation can be confirmed by observing lung sliding bilaterally.
• USG should be the first-choice diagnostic approach when a pneumothorax is suspected intraoperatively or during initial trauma evaluation.
• Percutaneous dilatational tracheostomy (PDT) can be improved by using USG for identifying the correct tracheal-ring interspace, avoiding blood vessels, and determining the depth from the skin to the tracheal wall.
• Numerous conditions that affect airway management can be diagnosed by preanesthetic USG, but it remains to be determined in which patients the predictive value of such an examination is high enough to recommend this as a routine approach to airway management planning.
Acknowledgments
Acta Anaesthesiologica Scandinavica, the Acta Anaesthesiologica Scandinavica Foundation, and Blackwell Publishing are acknowledged for Figures 3-1 through 3-11 and 3-14 through 3-16, which were first published in Kristensen MS: Ultrasonography in the management of the airway. Acta Anaesthesiol Scand 55:1155–1173, 2011.
I also thank Connie Jørgensen, MD, DMSc, Head of the Clinic for Fetal Medicine and Ultrasonography, Rigshospitalet, Copenhagen, Denmark, for illustrations and critical reading of the manuscript; Erik Sloth, MD, Phd, DMSc, Professor in Experimental Ultrasonography, Department of Anaesthesiology and Intensive Care Medicine, Aarhus University Hospital, Skejby, 8200 Aarhus N, Denmark, for illustrations and videos; Michael Friis-Tvede, MD, Rigshospitalet, Copenhagen, Denmark, for setting up the nonprofit home page for academic airway management (www.airwaymanagement.dk) and for incorporating the airway videos; Peter H. Cheng, MD, Director of Regional Anesthesia, Department of Anesthesiology, Kaiser Permanente Riverside Medical Center, Riverside, CA, USA, for illustrations and sparring; and Rasmus Hesselfeldt, MD, Rigshospitalet, Copenhagen, Denmark, for help in making the photos and videos.
All references can be found online at expertconsult.com.
1 Singh M, Chin KJ, Chan VWS, et al. Use of sonography for airway assessment: An observational study. J Ultrasound Med. 2010;29:79–85.
13 Gourin CG, Orloff LA. Normal head and neck ultrasound anatomy. In: Orloff LA, ed. Head and neck ultrasonography. San Diego: Plural Publishing; 2008:39–68.
25 Copenhagen University Hospital. Ultrasonography in airway management. Available at www.airwaymanagement.dk (accessed January 2011)
27 Lichtenstein DA, Mezière GA. Relevance of lung ultrasound in the diagnosis of acute respiratory failure: The BLUE protocol. Chest. 2008;134:117–125.
28 Sartori S, Tombesi P. Emerging roles for transthoracic ultrasonography in pleuropulmonary pathology. World J Radiol. 2010;2:83–90.
42 Lakhal K, Delplace X, Cottier J-P, et al. The feasibility of ultrasound to assess subglottic diameter. Anesth Analg. 2007;104:611–614.
61 Park SC, Ryu JH, Yeom SR, et al. Confirmation of endotracheal intubation by combined ultrasonographic methods in the emergency department. Emerg Med Australas. 2009;21:293–297.
68 Sustić A, Kovač D, Žgaljardić Z, et al. Ultrasound-guided percutaneous dilatational tracheostomy: A safe method to avoid cranial misplacement of the tracheostomy tube. Intensive Care Med. 2000;26:1379–1381.
79 Peris A, Tutino L, Zagli G, et al. The use of point-of-care bedside lung ultrasound significantly reduces the number of radiographs and computed tomography scans in critically ill patients. Anesth Analg. 2010;111:687–692.
85 Lyon M, Walton P, Bhalla V, Shiver SA. Ultrasound detection of the sliding lung sign by prehospital critical care providers. Am J Emerg Med. 2011 Feb 17. [Epub ahead of print]
1 Singh M, Chin KJ, Chan VWS, et al. Use of sonography for airway assessment: an observational study. J Ultrasound Med. 2010;29:79–85.
2 Sites BD, Brull R, Chan VWS, et al. Artifacts and pitfall errors associated with ultrasound-guided regional anesthesia: Part II. A pictorial approach to understading and avoidance. Reg Anesth Pain Med. 2007;32:419–433.
3 Chalumeau-Lemoine L, Baudel J-L, Das V, et al. Results of short-term training of naïve physicians in focused general ultrasonography in an intensive-care unit. Intensive Care Med. 2009;35:1767–1771.
4 Maniere-Ezvan A, Duval JM, Darnault P. Ultrasonic assessment of the anatomy and function of the tongue. Surg Radiol Anat. 1993;15:55–61.
5 Tsui BCH, Hui CMW. Sublingual airway ultrasound imaging. Can J Anaesth. 2008;55:790–791.
6 Tsui BCH, Hui CMW. Challenges in sublingual airway ultrasound interpretation. Can J Anaesth. 2009;56:393–394.
7 Miller JJ, Sonies BC. Dynamic imaging of the tongue, larynx, and pharynx during swallowing. In: Orloff LA, ed. Head and neck ultrasonography. San Diego: Plural Publishing; 2008:291–308.
8 Lahav Y, Rosenzweig E, Heyman Z, et al. Tongue base ultrasound: A diagnostic tool for predicting obstructive sleep apnea. Ann Otol Rhinol Laryngol. 2009;118:179–184.
9 Volk J, Kadivec M, Mušič MM, Ovsenik M. Three-dimensional ultrasound diagnostics of tongue posture in children with unilateral posterior crossbite. Am J Orthodont Dentofacial Orthop. 2010;138:608–612.
10 Ueda D, Yano K, Okuno A. Ultrasonic imaging of the tongue, mouth, and vocal cords in normal children: Establishment of basic scanning positions. J Clin Ultrasound. 1993;21:431–439.
11 Beale TJ, Rubin JS. Laryngeal ultrasonography. In: Orloff LA, ed. Head and neck ultrasonography. San Diego: Plural Publishing; 2008:183–202.
12 Liu K-H, Chu WCW, To K-W, et al. Sonographic measurement of lateral parapharyngeal wall thickness in patients with obstructive sleep apnea. Sleep. 2007;30:1503–1508.
13 Gourin CG, Orloff LA. Normal head and neck ultrasound anatomy. In: Orloff LA, ed. Head and neck ultrasonography. San Diego: Plural Publishing; 2008:39–68.
14 Xia CX, Zhu Q, Cheng Y, et al. Sonographic assessment of hypopharyngeal carcinoma: Preliminary study. J Ultrasound Med. 2011;30:217–225.
15 Loveday E. The larynx. In: Ahuja A, Evans R. Practical head and neck ultrasound. Cambridge: Cambridge University Press; 2008:107–120.
16 Prasad A, Singh M, Chan VW. Ultrasound imaging of the airway. Can J Anaesth. 2009;56:868–869. author reply 869–870
17 Werner SL, Jones RA, Emerman CL. Sonographic assessment of the epiglottis. Acad Emerg Med. 2004;11:1358–1360.
18 Bozzato A, Zenk J, Gottwald F, et al. [Influence of thyroid cartilage ossification in laryngeal ultrasound]. Laryngorhinootologie. 2007;86:276–281.
19 Hu Q, Zhu S-Y, Luo F, et al. High-frequency sonographic measurements of true and false vocal cords. J Ultrasound Med. 2010;29:1023–1030.
20 Mateen M, Kaffes AJ, Sriram PVJ, et al. Modified technique of high-resolution ultrasonography of the normal cervical esophagus. J Gastroenterol Hepatol. 2006;21:1660–1663.
21 Li Y-L, Wong DT, Wei W, Liu J. A novel acoustic window for trans-oesophageal echocardiography by using a saline-filled endotracheal balloon. Br J Anaesth. 2006;97:624–629.
22 Herth F. Endobronchial ultrasound reliably differentiates between airway infiltration and compression by tumor. Chest. 2003;123:458–462.
23 Razzaq QM. Use of the “sliding lung sign” in emergency bedside ultrasound. Eur J Emerg Med. 2008;15:238–241.
24 Lichtenstein D, Menu Y. A bedside ultrasound sign ruling out pneumothorax in the critically ill: Lung sliding. Chest. 1995;108:1345–1348.
25 Copenhagen University Hospital. Ultrasonography in airway management. Available at www.airwaymanagement.dk (accessed January 2011)
26 Lichtenstein DA, Mezière G, Lascols N, et al. Ultrasound diagnosis of occult pneumothorax. Critical Care Med. 2005;33:1231–1238.
27 Lichtenstein DA, Mezière GA. Relevance of lung ultrasound in the diagnosis of acute respiratory failure: The BLUE protocol. Chest. 2008;134:117–125.
28 Sartori S, Tombesi P. Emerging roles for transthoracic ultrasonography in pleuropulmonary pathology. World J Radiol. 2010;2:83–90.
29 Hsieh KS, Lee CL, Lin CC, et al. Secondary confirmation of endotracheal tube position by ultrasound image. Crit Care Med. 2004;32:S374–S377.
30 Jiang JR, Tsai TH, Jerng JS, et al. Ultrasonographic evaluation of liver/spleen movements and extubation outcome. Chest. 2004;126:179–185.
31 Hui C, Tsui BC: Sublingual ultrasound examination of the airway: A pilot study [Abstract 613888]. Canadian Anesthesiologists’ Society Annual Meeting, Vancouver, June 26–30, 2009.
32 Ezri T, Gewürtz G, Sessler DI, et al. Prediction of difficult laryngoscopy in obese patients by ultrasound quantification of anterior neck soft tissue. Anaesthesia. 2003;58:1111–1114.
33 Komatsu R, Sengupta P, Wadhwa A, et al. Ultrasound quantification of anterior soft tissue thickness fails to predict difficult laryngoscopy in obese patients. Anaesth Intensive Care. 2007;35:32–37.
34 Garel C, Contencin P, Polonovski JM, et al. Laryngeal ultrasonography in infants and children: A new way of investigating. Normal and pathological findings. Int J Pediatr Otorhinolaryngol. 1992;23:107–115.
35 Bryson PC, Leight WD, Zdanski CJ, et al. High-resolution ultrasound in the evaluation of pediatric recurrent respiratory papillomatosis. Arch Otolaryngol Head Neck Surg. 2009;135:250–253.
36 Lixin J, Bing H, Zhigang W, Binghui Z. Sonographic diagnosis features of Zenker diverticulum. Eur J Radiol. 2011;80:e13–e19.
37 Courtier J, Poder L, Wang ZJ, et al. Fetal tracheolaryngeal airway obstruction: Prenatal evaluation by sonography and MRI. Pediatr Radiol. 2010;40:1800–1805.
38 Jacoby J. Bedside ultrasound to determine prandial status. Am J Emerg Med. 2003;21:216–219.
39 Perlas A, Chan VW, Lupu CM. Ultrasound assessment of gastric content and volume. Anesthesiology. 2009;111:82–89.
40 Koenig SJ, Lakticova V, Mayo PH. Utility of ultrasonography for detection of gastric fluid during urgent endotracheal intubation. Intensive Care Med. 2011;37:627–631.
41 Shibasaki M, Nakajima Y, Ishii S, et al. Prediction of pediatric endotracheal tube size by ultrasonography. Anesthesiology. 2010;113:819–824.
42 Lakhal K, Delplace X, Cottier J-P, et al. The feasibility of ultrasound to assess subglottic diameter. Anesth Analg. 2007;104:611–614.
43 Sustić A. Role of ultrasound in the airway management of critically ill patients. Crit Care Med. 2007;35:S173–S177.
44 Hardee P, Ng S, Cashman M. Ultrasound imaging in the preoperative estimation of the size of tracheostomy tube required in specialised operations in children. Br J Oral Maxillofac Surg. 2003;41:312–316.
45 Munir N, Hughes D, Sadera G, Sherman IW. Ultrasound-guided localisation of trachea for surgical tracheostomy. Eur Arch Otorhinolaryngol. 2010;267:477–479.
46 Elliott DSJ, Baker P, Scott MR, et al. Accuracy of surface landmark identification for cannula cricothyroidotomy. Anaesthesia. 2010:889–894.
47 Nicholls SE, Sweeney TW, Ferre RM, Strout TD. Bedside sonography by emergency physicians for the rapid identification of landmarks relevant to cricothyrotomy. Am J Emerg Med. 2008;26:852–856.
48 Blaivas M, Sama AE. Ultrasonography in the detection of the cricoid membrane for needle cricothyrotomy. Acad Emerg Med. 2001;8:579–580.
49 Orr JA, Stephens RS, Mitchell VM. Ultrasound-guided localisation of the trachea. Anaesthesia. 2007;62:972–973.
50 Manikandan S, Neema PK, Rathod RC. Ultrasound-guided bilateral superior laryngeal nerve block to aid awake endotracheal intubation in a patient with cervical spine disease for emergency surgery. Anaesth Intensive Care. 2010;38:946–948.
51 Barberey G, Henry Y, Boillot A, et al: Ultrasound imaging of the superior laryngeal nerve containing space (A116). Poster presented at the ASA Meeting, San Diego, October 2010.
52 Ma G, Davis DP, Schmitt J, et al. The sensitivity and specificity of transcricothyroid ultrasonography to confirm endotracheal tube placement in a cadaver model. J Emerg Med. 2007;32:405–407.
53 Milling TJ, Jones M, Khan T, et al. Transtracheal 2-D ultrasound for identification of esophageal intubation. J Emerg Med. 2007;32:409–414.
54 Werner SL, Smith CE, Goldstein JR, et al. Pilot study to evaluate the accuracy of ultrasonography in confirming endotracheal tube placement. Ann Emerg Med. 2007;49:75–80.
55 Galicinao J, Bush AJ, Godambe SA. Use of bedside ultrasonography for endotracheal tube placement in pediatric patients: A feasibility study. Pediatrics. 2007;120:1297–1303.
56 Sundaram V, Kumar A, Kumar P. Bedside ultrasonography and endotracheal tube placement: A long way to go. Pediatrics. 2008;122:213–214. author reply 214–215
57 Chun R, Kirkpatrick AW, Sirois M, et al. Where’s the tube? Evaluation of hand-held ultrasound in confirming endotracheal tube placement. Prehosp Disaster Med. 2004;19:366–369.
58 Blaivas M, Tsung JW. Point-of-care sonographic detection of left endobronchial main stem intubation and obstruction versus endotracheal intubation. J Ultrasound Med. 2008;27:785–789.
59 Weaver B, Lyon M, Blaivas M. Confirmation of endotracheal tube placement after intubation using the ultrasound sliding lung sign. Acad Emerg Med. 2006;13:239–244.
60 Kerrey BT, Geis GL, Quinn AM, et al. A prospective comparison of diaphragmatic ultrasound and chest radiography to determine endotracheal tube position in a pediatric emergency department. Pediatrics. 2009;123:e1039–e1044.
61 Park SC, Ryu JH, Yeom SR, et al. Confirmation of endotracheal intubation by combined ultrasonographic methods in the emergency department. Emerg Med Australas. 2009;21:293–297.
62 Hoffmann B, Gullett JP. Emergency ultrasound for the detection of esophageal intubation. Acad Emerg Med. 2010;17:464–465.
63 Hatfield A, Bodenham A. Ultrasound: An emerging role in anaesthesia and intensive care. Br J Anaesth. 1999;83:789–800.
64 Göksu E, Sayraç V, Oktay C, et al. How stylet use can effect confirmation of endotracheal tube position using ultrasound. Am J Emerg Med. 2010;28:32–36.
65 Marciniak B, Fayoux P, Hébrard A, et al. Airway management in children: Ultrasonography assessment of tracheal intubation in real time? Anesth Analg. 2009;108:461–465.
66 Emshoff R, Bertram S, Kreczy A. Topographic variations in anatomical structures of the anterior neck of children: An ultrasonographic study. Oral Surg Oral Med Oral Pathol Oral Radiol Endod. 1999;87:429–436.
67 Hatfield A, Bodenham A. Portable ultrasonic scanning of the anterior neck before percutaneous dilatational tracheostomy. Anaesthesia. 1999;54:660–663.
68 Sustić A, Kovač D, Žgaljardić Z, et al. Ultrasound-guided percutaneous dilatational tracheostomy: A safe method to avoid cranial misplacement of the tracheostomy tube. Intensive Care Med. 2000;26:1379–1381.
69 Sustić A, Zupan Z, Antoncić I. Ultrasound-guided percutaneous dilatational tracheostomy with laryngeal mask airway control in a morbidly obese patient. J Clin Anesth. 2004;16:121–123.
70 Muhammad JK, Patton DW, Evans RM, Major E. Percutaneous dilatational tracheostomy under ultrasound guidance. Br J Oral Maxillofac Surg. 1999;37:309–311.
71 McCormick B, Manara AR. Mortality from percutaneous dilatational tracheostomy: A report of three cases. Anaesthesia. 2005;60:490–495.
72 Reilly PM, Sing RF, Giberson F, et al. Hypercarbia during tracheostomy: A comparison of percutaneous endoscopic, percutaneous Doppler, and standard surgical tracheostomy. Intensive Care Med. 1997;23:859–864.
73 Kollig E, Heydenreich U, Roetman B, et al. Ultrasound and bronchoscopic controlled percutaneous tracheostomy on trauma ICU. Injury. 2000;31:663–668.
74 Kleine-Brueggeney M, Greif R, Eichenberger U, et al. Ultrasound guided percutaneous tracheal puncture: A feasibility study in human cadavers (Abstract 1656). ASA Meeting, San Diego, October 2010. Available at http://www.asa-abstracts.com/strands/asaabstracts/abstract.htm;jsessionid=DA0D7A9C91230E99F0F4588FE570B1B5?year=2010&index=15&absnum=643 (accessed January 2012)
75 Rajajee V, Fletcher JJ, Rochlen LR, Jacobs TL. Real-time ultrasound-guided percutaneous dilatational tracheostomy: A feasibility study. Crit Care (London). 2011;15:R67.
76 Vigneau C, Baudel J-L, Guidet B, et al. Sonography as an alternative to radiography for nasogastric feeding tube location. Intensive Care Med. 2005;31:1570–1572.
77 Lock G, Reng M, Messman H, et al. Inflation and positioning of the gastric balloon of a Sengstaken-Blakemore tube under ultrasonographic control. Gastrointest Endosc. 1997;45:538.
78 Zhang M, Liu Z-H, Yang J-X, et al. Rapid detection of pneumothorax by ultrasonography in patients with multiple trauma. Crit Care (London). 2006;10:R112.
79 Peris A, Tutino L, Zagli G, et al. The use of point-of-care bedside lung ultrasound significantly reduces the number of radiographs and computed tomography scans in critically ill patients. Anesth Analg. 2010;111:687–692.
80 Ding L-W, Wang H-C, Wu H-D, et al. Laryngeal ultrasound: A useful method in predicting post-extubation stridor. A pilot study. Eur Respir J. 2006;27:384–389.
81 Udy A, Senthuran S, Lipman J. Airway obstruction due to a pre-vertebral haematoma following difficult central line insertion: Implications for ultrasound guidance and review of the literature. Anaesth Intens Care. 2009;37:309–313.
82 Arens C, Glanz H. Endoscopic high-frequency ultrasound of the larynx. Eur Arch Otorhinolaryngol. 1999;256:316–322.
83 Arens C, Weight J, Schumacher J, Kraft M. Ultraschall des Larynx, Hypopharynx sowie des oberen Ösophagus. HNO. 2010;59:145–154.
84 Doelken P, Strange C. Chest ultrasound for “dummies.”. Chest. 2003;123:332–333.
85 Lyon M, Walton P, Bhalla V, Shiver SA. Ultrasound detection of the sliding lung sign by prehospital critical care providers. Am J Emerg Med. 2011. Feb 17 [Epub ahead of print]