[level-membership-for-pulmolory-and-respiratory-category]7
THE PULMONARY CIRCULATION
BRINGING BLOOD AND GAS TOGETHER
The anatomy of the pulmonary circulation
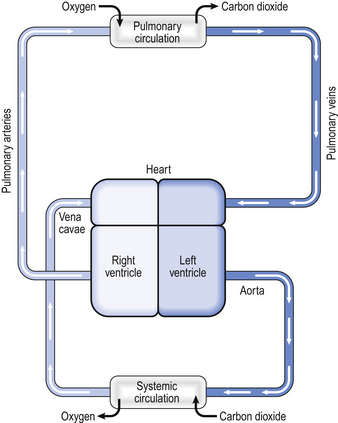
In humans the circulation behaves in many ways as if it consisted of two parts. In the systemic circulation the left ventricle pumps oxygenated blood through the organs and tissues of the body, where oxygen is removed and carbon dioxide added before the blood returns to the right atrium. In the pulmonary circulation the right ventricle pumps deoxygenated blood through the lungs, where oxygen is added and carbon dioxide is removed (Fig. 7.1). Of course, the two parts of the circulation work in series to form a single circuit of blood, but there are a number of differences between the pulmonary and systemic circulations which reflect their different functions.
The right ventricle
Every minute, the same volume of blood – about 5 L at rest – flows through both the right ventricle and the left ventricle. However, the two ventricles look very different (Fig. 7.2). The left ventricle has a thick, muscular wall that takes up most of the cross-section of the heart. The right ventricle has a much thinner wall, about one-third of the thickness of the left, and to accommodate the muscle of the left ventricle the right almost seems to be ‘wrapped around’ the left. Why is there such a difference between the two?
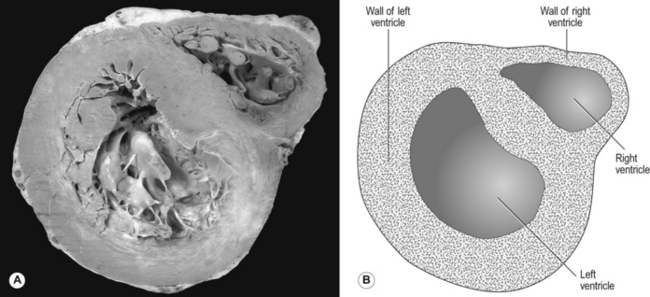
The reason is that the left ventricle pumps blood into the systemic circulation, which has a high resistance and which operates at a relatively high pressure. If cardiac output increases, for example during exercise, this pressure can increase even more, which means that the left ventricle needs a thick, muscular wall to produce these high pressures. On the other hand, the right ventricle pumps blood into the pulmonary circulation, which has a very low resistance and which operates at a low pressure, always less than that in the systemic circulation. Furthermore, as we shall see later, if cardiac output increases the pulmonary artery pressure does not increase very much. For this reason, the right ventricle needs only a relatively thin muscular wall in comparison to the left.
Pulmonary blood vessels
As well as having thinner walls, the pulmonary vessels are much more distensible than systemic arteries, which is important in keeping pulmonary blood pressure low during systole and in the face of increases in cardiac output. In circumstances such as exercise, cardiac output can increase from its normal 5 L per minute to as much as 25 L per minute. In order to keep pulmonary blood pressure low, the pulmonary circulation is able to reduce its resistance to even lower values than normal. It does so by two mechanisms, illustrated in Figure 7.3.
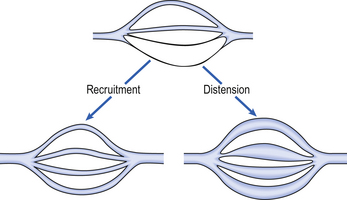
1. Pulmonary blood vessels are able to dilate or distend. A small increase in the diameter of a vessel decreases the resistance of that vessel substantially (Poiseuille’s Law, p. 156).
2. During normal conditions, some blood vessels in the lungs are closed. During periods of high cardiac output these vessels open up and blood is able to flow through them. The increase in number of blood vessels able to carry blood is called recruitment. However, it is likely that very few vessels are completely collapsed under normal conditions, and distension is probably much more important than recruitment in reducing vascular resistance.
The anatomical position of the capillaries and their function in gas exchange means that they are different from their systemic counterparts. The density of the capillary network in the alveolar walls is extremely high so that efficient gas exchange can take place. In fact, there are so few cells between the capillaries in the alveolar walls that the alveolar circulation behaves almost like a film of blood flowing around the alveoli. At rest, blood flows through an alveolar capillary in about 0.8 seconds, which is about three times longer than the time needed for oxygenation of mixed venous blood.
There is very little space between the blood in the pulmonary capillaries and the air in the alveoli. In fact, for the most part, the only cells separating blood from air are the endothelial cells of the pulmonary capillary and the epithelial type I cells of the alveolar wall (Fig. 2.9). This is clearly very important in allowing the most efficient transfer of gases between the alveoli and the blood (see Chapter 6).
The bronchial circulation
Not all the blood flowing into the lungs does so via the pulmonary artery – a small volume of arterial blood flows through the bronchial circulation (Fig. 7.4). The bronchial circulation supplies blood to the airways and to the lung parenchyma, although it is not essential to their survival; during a lung transplant the bronchial circulation is not reconnected, and this apparently does not produce any serious ill effects. Blood flowing through the bronchial circulation does not pass through the alveolar capillaries and therefore does not take part in gas exchange.
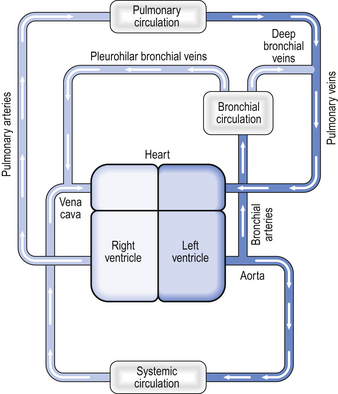
However, the blood from the more distal parts of the bronchial circulation drains via the deep bronchial veins into the pulmonary circulation. This blood therefore forms a shunt (see below). In other words, the blood arises from the aorta, but instead of draining into the right-hand side of the circulation, the partly deoxygenated blood of the deep bronchial veins drains into the oxygenated blood that has passed through the alveolar capillaries. The resulting mixture of blood therefore has an oxygen content less than that of the original pulmonary artery blood. The significance of this will be discussed later in the chapter.
 ratio, varies by a relatively small amount throughout the lungs.
 ratio in the lungs affects arterial blood gases.
Distribution of blood flow through the lungs
 ratio as possible.
Gravity
The diastolic blood pressure in the systemic circulation is about 80 mmHg, which is enough pressure to raise a column of water by a height of over a metre. In other words, there is more than enough pressure to carry blood from the heart up to the head. However, in the pulmonary circulation the diastolic blood pressure is about 12 mmHg, enough pressure to raise a column of water about 15 cm. In other words, there is only just enough pressure to pump blood from the right ventricle up to the lung apices. On the other hand, at the lung bases the blood pressure in the pulmonary circulation is equal to the pressure generated by the right ventricle plus the hydrostatic pressure of a column of blood extending up to the heart. Because the pressure generated by the right ventricle is not very high, this extra hydrostatic pressure makes a very significant difference. Thus there is a very considerable difference in arterial blood pressure between the bases and the apices of the lungs owing to gravity. In other words, gravity tends to direct blood towards the lung bases.
Case 7.1 The pulmonary circulation: bringing blood and gas together: 2
What causes a pulmonary embolus and how can it be diagnosed?
A pulmonary embolus occurs when something, usually a thrombus (blood clot), occludes part of the pulmonary artery tree. Generally the thrombus forms in the veins of the pelvis or lower limb, and part of that thrombus or the whole thrombus may dislodge and pass through the vena cava, through the right atrium and ventricle and into the pulmonary artery. The thrombus finally lodges in a branch of the pulmonary artery, occluding it. The segment of lung tissue supplied by the obstructed artery has a reduced blood supply (although it often receives some blood – remember the bronchial circulation) and may finally infarct.
In a small number of cases (probably less than 10% of the total number of pulmonary emboli) the thrombus does not form in the veins of the pelvis or leg but forms in the heart. This may be as a result of atrial fibrillation, in which the atria of the heart do not beat properly, or thrombus may form on a part of the myocardium which has infarcted. Very occasionally the embolus is not formed from thrombus but from other substances, such as fat or amniotic fluid.
Small emboli in the lungs cause no symptoms and no haemodynamic problems and go unnoticed. Larger emboli, particularly if they result in pulmonary infarction, can cause clinical symptoms, including pleuritic chest pain and sometimes haemoptysis. Very large emboli are a medical emergency (see Box 4).
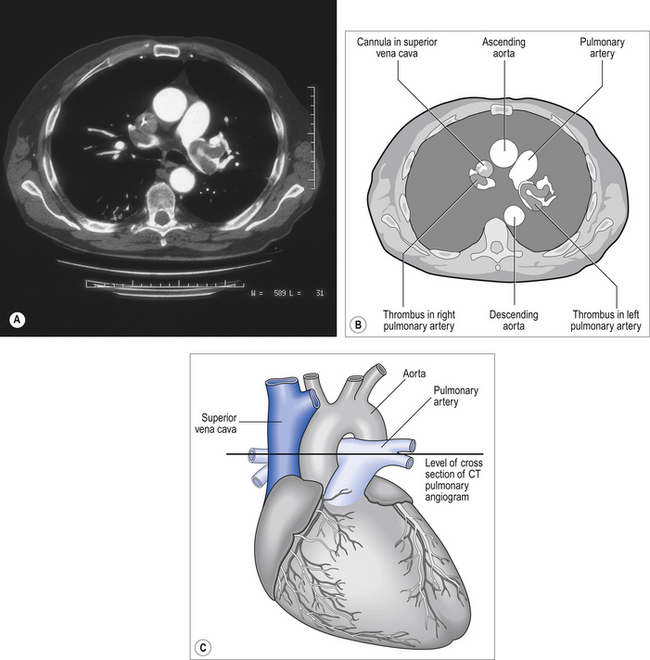
A CT pulmonary angiogram of a patient with a large pulmonary embolus is shown in Figure 7.5A. The CT shows a cross-section of the patient’s chest at the point where the aorta arches over the dividing pulmonary artery. CT scans are usually shown as if the cross-section is being viewed from below, in other words, the left-hand side of the scan corresponds to the right-hand side of the body. X-ray contrast, which shows up white on the scan, has been injected into a cannula lying in the superior vena cava – the white dot in the otherwise dark vena cava is the contrast within the cannula. Blood which contains contrast is clearly visible in the ascending and descending aorta. There is blood in the right and left pulmonary arteries; however, dark areas are visible within these arteries which correspond to thrombus. This pulmonary embolus is a large one, and thrombus is visible in both pulmonary arteries.
The regional flow of blood within the lungs can be demonstrated by dissolving a radioactive gas (usually Xenon-133 (133Xe)) in saline and then injecting this into the right side of the heart via an intravenous catheter. During the injection the subject holds his breath, and some of the radioactive xenon leaves the blood and enters the alveoli. By measuring the level of radioactivity from outside the body it is possible to estimate the blood flow to different regions of the lungs (Fig. 7.6).
Pressure around the blood vessels
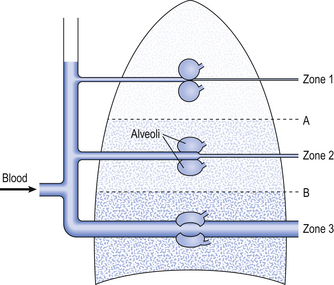
These two factors combine to influence the distribution of blood flow within the lungs. Three zones have been described related to the blood pressure at the beginning and end of a capillary and the gas pressure within the adjacent alveoli (Fig. 7.6):
• Zone 1. In this zone, the pressure in the alveoli is always greater than the pressure in the capillaries. This means that in zone 1 there is no blood flow. It is unlikely that such a zone exists in healthy individuals, but if it does so it occupies a very small volume of the apices of the lungs, where the pulmonary blood pressure is lowest.
• Zone 2. In this zone, the alveolar gas pressure is greater than the blood pressure at the venous end of the capillary but less than the blood pressure at the arterial end of the capillary. In zone 2, the flow through the capillaries is influenced by changes in blood pressure and changes in alveolar gas pressure. If alveolar gas pressure increases, then flow through the capillaries in zone 2 will be reduced.
• Zone 3. In zone 3, the blood pressure throughout the capillaries, from the arterial end through to the venous end, is greater than the gas pressure in the surrounding alveoli. Therefore, in this zone, flow through the capillaries is influenced only by the difference in blood pressure along the capillary and is not influenced at all by changes in alveolar pressure. It is likely that in healthy humans, the majority of the volume of the lungs lies within zone 3, and blood flow is independent of alveolar gas pressure.
Furthermore, at any given height from the base, there is a wide variation in blood flow to different lung regions. It is thought likely that this variation is due to the fact that when a blood vessel divides, the two vessels formed are not necessarily the same size. This effect leads to a random variation in blood flow between lung regions at the same height from the lung base. This effect is probably at least as important as gravity in producing variation in regional perfusion of the lungs.
Hypoxic pulmonary vasoconstriction
 ratio for the lungs as a whole by increasing the
  ratio in areas of the lungs where it is lower than normal.
In its role in optimizing the  ratio, the vasoconstrictor response of the blood vessels to low oxygen concentrations is analogous to the bronchodilator response of bronchi to high levels of carbon dioxide (see Chapter 4). In addition, hypoxic pulmonary vasoconstriction plays an important role in limiting blood flow through the non-ventilated and therefore hypoxic lungs of the fetus. After the baby is delivered and takes its first breath, the oxygen concentration in its lungs increases, the hypoxic pulmonary vasoconstriction reduces and blood flow to the lungs is increased.
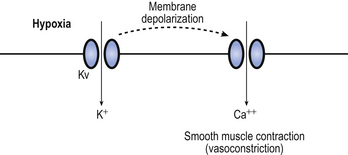
The mechanism behind hypoxic pulmonary vasoconstriction is not fully understood. What is known is that hypoxia causes membrane depolarization of the smooth muscle cells in the pulmonary blood vessels (Fig. 7.7). This is followed by contraction of the smooth muscles in the blood vessel wall. It is thought that the depolarization of the smooth muscle cells is mediated, at least in part, by a membrane potassium channel called the Kv channel. The conductance of Kv increases in response to hypoxia, resulting in membrane depolarization, although it is not certain whether the channel itself is sensitive to hypoxia or whether it responds to another detector of hypoxia.
Although hypoxic pulmonary vasoconstriction is usually beneficial in maintaining ventilation/perfusion matching, it can cause problems in patients with lung conditions such as chronic obstructive pulmonary disease that result in long-term hypoxia. This chronic hypoxia affects all parts of the lungs and results in a widespread hypoxic pulmonary vasoconstriction. This means that the resistance of the pulmonary circulation as a whole is much higher than normal, and the pulmonary blood pressure increases. The right ventricle is not well suited to producing a high blood pressure and under these circumstances can start to fail. The patient may become increasingly breathless on exertion, as fluid tends to seep into the alveoli as cardiac output increases. Furthermore, the patient may notice oedema around their ankles. Failure of the right ventricle means that the pressure in the systemic veins increases. This sort of heart failure due to lung disease is called cor pulmonale.
Innervation of the pulmonary vessels
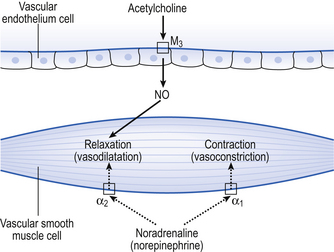
Fibres of the sympathetic and parasympathetic nervous system innervate the pulmonary vessels and may cause vasoconstriction or vasodilatation (Fig. 7.8). Sympathetic fibres release noradrenaline (norepinephrine), which acts predominantly on α1 adrenoceptors on the smooth muscle of arteries and arterioles to produce vasoconstriction. Noradrenaline (norepinephrine) may also act on α2 receptors to produce vasodilatation, but it is generally accepted that the overall effect of the sympathetic nervous system on the pulmonary vessels is vasoconstriction.
• Ventilation should not be ‘wasted’ on unperfused regions nor perfusion wasted on unventilated regions.
• The degree of matching is measured as the ventilation/perfusion ratio  .
.
• Gravity causes a gradient of pressure from top to bottom of the lungs.
• The gradient of pressure causes a gradient of perfusion increasing from top to bottom.
• Unlike the systemic arterioles pulmonary arterioles vasoconstrict in response to hypoxia.
• Sympathetic and parasympathetic innervation is not essential for normal function of the lung.
Regional differences in ventilation in the lungs
Fortunately, ventilation is also directed towards the bases. This happens essentially because the lungs ‘sag’. The weight of the tissue making up the lungs tends to cause the alveoli and airways at the bases to collapse, while at the same time the airways and alveoli at the apices tend to be ‘pulled’ open by the lung tissue below them. This means that at the beginning of a breath, the alveoli at the apices of the lungs are nearer to being ‘full’ than the alveoli at the bases, and cannot take much ‘fresh’ air, and therefore ventilation tends to increase towards the bases. However, this difference in ventilation between the apices and the bases of the lungs becomes less pronounced (and may even reverse) with high airway gas flows. There is also variability in the distribution of gas flow to different lung regions at a given height from the lung base, similar to the variability that is seen in blood flow. This is probably due to random differences in the diameters of bronchi formed at the bifurcation of the airways, comparable to the same random variation that occurs in regional perfusion of the lungs.
 ratio from the apices to the bases of the lungs.
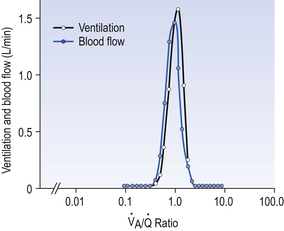
We have also seen that at any given height above the base, there is a wide variation in regional ventilation and regional perfusion. Despite this, the range of  ratios found in the lung is relatively narrow. Figure 7.9 shows both ventilation and perfusion plotted against
  ratio on a logarithmic scale. As you can see, most of the ventilation (open circles) and most of the perfusion (closed circles) take place in lung regions that encompass a relatively narrow range of
  ratios. In other words, regions of the lung with relatively low ventilation tend to have relatively low perfusion.
 ratio on a logarithmic scale. Most ventilation and perfusion takes place in lung regions having a relatively narrow range of
  ratio.
 ratios found in normal lungs. In diseased lungs, this variation is very much increased. What effect does variability in
  ratios have on gas exchange?
Ventilation/perfusion matching and its effect on blood O2 and CO2 content
 ratio is high, the mixture contains more air than blood and therefore has a relatively high Po2, and a relatively low Pco2. If, however, the
  ratio is low, the mixture contains a higher concentration of blood and therefore has a relatively low Po2 and a relatively high Pco2. In fact, the
  ratio can vary between zero and infinity. A
  ratio of zero means that there is perfusion but no ventilation: in other words, an area of the lungs where shunting is taking place and the gas concentrations are similar to mixed venous blood. A
  ratio of infinity means that there is ventilation but no perfusion, in other words an area of the lungs that is dead space, where the gas concentrations are similar to those of air. Each value of the
  ratio is therefore associated with a particular Po2 and Pco2.
If the transfer of oxygen and carbon dioxide were based on a simple mixing effect then it would be straightforward to calculate the composition of gas in an alveolus in the same way we could calculate the composition of a beaker of saline (i.e. blood) to which various known amounts of water (i.e. alveolar gas) were added. Adding a small amount of water to the saline would result in a mixture with a composition close to that of the saline. Adding a large volume of water to the saline would result in a mixture with a composition similar to that of water. Figure 7.10 shows how the composition of the saline/water mixture varies with the proportions of each making up the mixture. If saline represents the composition of mixed venous blood ( ) and water represents the composition of air (I), then there would be a straight line joining point
  (zero
(zero  ratio, dead space) and I (infinite
  ratio, shunt). This straight line would represent the gas tensions at different parts of the lungs with ratios that lie between these two extremes.
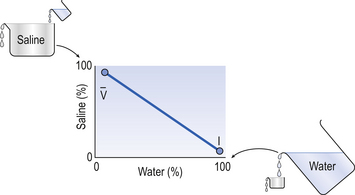
 ) and pure water represents alveolar air. Point
  represents the composition of blood in poorly ventilated regions of the lung, not enough water being added to wash the salt away. Point I represents regions with ventilation in excess. Nearly all the salt is washed away and the composition of I approaches that of pure water.
However, in this region gas exchange in the lungs is not a simple exchange of one molecule of carbon dioxide for one molecule of oxygen, and the line joining the two extremes of  ratio is, in fact, curved, mainly because the oxygen–haemoglobin dissociation curve is sigmoid in shape. In a region of lung with a high
  ratio more CO2 is removed from the blood but the blood does not take up much more oxygen. This is because at the higher Pao2, that is found here the haemoglobin is already 97% saturated and can therefore carry very little extra oxygen. Similarly, in an area of lung with a low
  ratio, relatively more oxygen is taken up by the blood because at the lower Pao2 here, haemoglobin is at the middle, steep part of the oxygen–haemoglobin dissociation curve. However, relatively little extra carbon dioxide is released from the blood because the carbon dioxide dissociation curve is straighter than the oxygen–haemoglobin dissociation curve.
 ratio for the lungs is coincidental.) In regions near the lung apices with a high
  ratio the value of R is high (up to 2.0), whereas in regions near the bases with a low
  ratio the value of R is low (as low as 0.5).
The relationship between Po2 and Pco2 in regions of the lungs with different  ratios is usually expressed in a diagram such as Figure 7.11C. This is called the oxygen–carbon dioxide diagram, or O2–CO2 diagram. The values of Po2 and Pco2 at point ‘
 ’ are those of mixed venous blood (perfusion, no ventilation,
  ratio of zero). The values of Po2 and Pco2 at I are those of moist air (ventilation, no perfusion,
  ratio of infinity). The
  ratio can be any value between these two extremes, and each value is associated with a particular respiratory exchange ratio as well as a particular Po2 and Pco2.
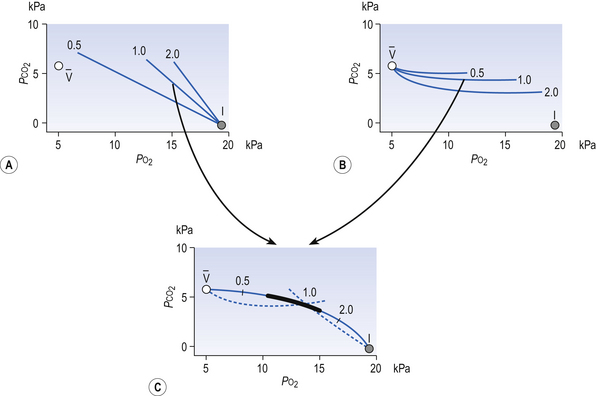
 and I correspond to mixed venous blood and moist inspired air, respectively. The theoretical effects of different gas exchange ratios (R) are shown in (A), on the composition of the alveolar gas, and (B) on the blood gas tensions in the blood (in reality it is not possible for gas exchange to take place in either the alveoli or blood independently of each other). (C) shows the combined alveolar–blood gas tension relationships for different values of R. The gas R line for R = 1.0 and the blood R line for R = 1.0 have been drawn in interrupted lines. Because the gas tensions must be the same in the alveoli and the blood, the point where the gas and blood R lines intersect represents the blood gas tensions that are actually seen in the alveolar gas and the alveolar capillary blood. Plotting points for all values of R gives the O2–CO2 diagram for the lungs. The normal range of
  ratios is shown by the heavy line.
It is also possible to draw separate hypothetical O2–CO2 diagrams for the composition of alveolar gas and for the gas tensions in the blood, although of course in reality neither arterial gas nor pulmonary capillary blood exists in isolation. Figure 11A shows the theoretical effect of different gas exchange ratios on the composition of alveolar gas. If R = 1.0, each molecule of O2 removed from an alveolus is replaced by one molecule of CO2. The Po2 and Pco2 change according to line 1.0. If R = 0.5, two molecules of O2 are replaced by one of CO2 and the gas tensions follow the 0.5 line; similarly, a line for R = 2.0 can be drawn. No line passes through the point, as this would represent a value of R that lies outside the range of R in normal healthy lungs. Figure 7.11B represents the theoretical effects of different gas exchanges on the gas tensions in the blood. In this diagram, the relationships between Po2 and Pco2 are not straight lines, because the oxygen and carbon dioxide dissociation curves are not straight lines.
As we have said, the alveoli and the pulmonary capillaries do not act in isolation. Clearly, each molecule of CO2 lost from the blood is gained by the alveolus, and each molecule of O2 gained by the blood must have come from the alveolus. The alveolar gas and pulmonary capillary blood must have the same value for R. This means that for each value of R in a particular lung region, the values of Po2 and Pco2 must lie on both the alveolar gas R line and the blood R line, i.e. they must lie where the two lines intersect, as in Figure 7.11. Plotting points for every possible value of R leads to the O2–CO2 diagram for the lungs shown in Figure 7.11C. Notice how the line joining all the values of Po2 and Pco2 is curved. On the diagram, the heavy line represents the normal ranges of Po2, Pco2,  ratio and R that are found in healthy individuals.
 ratio and R, the alveoli at the apices of the lungs have a higher P
 ratio will be ‘balanced’ by the high P
 ratio?
 ratio has a low P
 ratio, a high, P
Unfortunately, this is not the case for oxygen, for two reasons:
1. The blood flow to the apices of the lungs is very much less than the blood flow to the bases, as we have already seen. The blood leaving the apices of the lungs has a higher Pao2 than that leaving the bases; however, there is very much more blood leaving the bases of the lungs.
2. Although blood from the apices of the lungs has a higher Pao2 this does not translate into a higher blood oxygen content. The haemoglobin leaving regions of the lungs with a higher Po2 is 97% saturated with oxygen and can therefore carry very little extra oxygen compared with regions of the lungs with a normal Po2. In other words, the content of oxygen in blood leaving regions of the lungs with a high Po2 is very similar to that of blood leaving regions of the lungs with a ‘normal’ Po2. Clearly, then, it cannot ‘compensate’ for the low oxygen content of blood leaving regions of the lungs with a low Po2.
To summarize these two points: if there is a wide range of  ratios, blood in the left atrium will tend to have a reduced Pao2 (because the volume of blood with a low Pao2 from the bases of the lungs is greater than the volume of blood with a high Pao2 from the apices) and will also have a reduced oxygen content (the blood from the apices has a high PaO2, but its oxygen content is only very slightly higher than normal because of the shape of the oxygen–haemoglobin dissociation curve). It is therefore very important that there is a relatively narrow range of
  ratios within the lungs; in other words, ventilation and perfusion matching should be as good as possible. Poor ventilation/perfusion matching leads to deoxygenation. In healthy individuals, the degree of ventilation/perfusion matching is so good that arterial blood carries only 2% less oxygen than blood, leaving a theoretical ‘ideal’ set of lungs that have perfect ventilation/perfusion matching.
Shunt
Shunted blood comes from two main sources. The blood draining the bronchial circulation via the deep bronchial veins has already been mentioned. The second source of shunted blood is the thebesian veins in the myocardium. Most of the blood drains from the myocardium into the cardiac veins and then into the cardiac sinus. The cardiac sinus is essentially a large vein that drains into the right atrium. Deoxygenated blood draining through the cardiac vein system therefore does not form a shunt because it drains into the right-hand side of the circulation. The thebesian veins are small vessels that drain blood from the myocardium into the cavity of the underlying atrium or ventricle. Blood draining through the thebesian veins on the left-hand side of the heart therefore forms a shunt. Although the flow of blood through the left-sided thebesian veins is not great, the oxygen content of the blood is very low.
where  s is the venous admixture flow,
  t is the total blood flow,
  is the oxygen content of arterial blood, C
 is the oxygen content of mixed venous blood and
  is the oxygen content of the capillary blood draining an alveolus with an ideal ventilation/perfusion ratio.
The oxygen content of blood can be calculated knowing the partial pressure of oxygen and the haemoglobin concentration, using the oxygen dissociation curve. Mixed venous blood needs to be obtained from a catheter placed in the pulmonary artery. How can the oxygen content of capillary blood draining an ‘ideal’ alveolus be measured? Of course it cannot, but it can be inferred by calculating the Pao2 in an ‘ideal’ alveolus by solving the alveolar gas equation (see p. 69) and then calculating the oxygen content of blood at equilibrium with such an alveolus, as above.
[/level-membership-for-pulmolory-and-respiratory-category][not-level-membership-for-pulmolory-and-respiratory-category]7
THE PULMONARY CIRCULATION
BRINGING BLOOD AND GAS TOGETHER
The anatomy of the pulmonary circulation
In humans the circulation behaves in many ways as if it consisted of two parts. In the systemic circulation the left ventricle pumps oxygenated blood through the organs and tissues of the body, where oxygen is removed and carbon dioxide added before the blood returns to the right atrium. In the pulmonary circulation the right ventricle pumps deoxygenated blood through the lungs, where oxygen is added and carbon dioxide is removed (Fig. 7.1). Of course, the two parts of the circulation work in series to form a single circuit of blood, but there are a number of differences between the pulmonary and systemic circulations which reflect their different functions.
The right ventricle
Every minute, the same volume of blood – about 5 L at rest – flows through both the right ventricle and the left ventricle. However, the two ventricles look very different (Fig. 7.2). The left ventricle has a thick, muscular wall that takes up most of the cross-section of the heart. The right ventricle has a much thinner wall, about one-third of the thickness of the left, and to accommodate the muscle of the left ventricle the right almost seems to be ‘wrapped around’ the left. Why is there such a difference between the two?
The reason is that the left ventricle pumps blood into the systemic circulation, which has a high resistance and which operates at a relatively high pressure. If cardiac output increases, for example during exercise, this pressure can increase even more, which means that the left ventricle needs a thick, muscular wall to produce these high pressures. On the other hand, the right ventricle pumps blood into the pulmonary circulation, which has a very low resistance and which operates at a low pressure, always less than that in the systemic circulation. Furthermore, as we shall see later, if cardiac output increases the pulmonary artery pressure does not increase very much. For this reason, the right ventricle needs only a relatively thin muscular wall in comparison to the left.
Pulmonary blood vessels
As well as having thinner walls, the pulmonary vessels are much more distensible than systemic arteries, which is important in keeping pulmonary blood pressure low during systole and in the face of increases in cardiac output. In circumstances such as exercise, cardiac output can increase from its normal 5 L per minute to as much as 25 L per minute. In order to keep pulmonary blood pressure low, the pulmonary circulation is able to reduce its resistance to even lower values than normal. It does so by two mechanisms, illustrated in Figure 7.3.
1. Pulmonary blood vessels are able to dilate or distend. A small increase in the diameter of a vessel decreases the resistance of that vessel substantially (Poiseuille’s Law, p. 156).
2. During normal conditions, some blood vessels in the lungs are closed. During periods of high cardiac output these vessels open up and blood is able to flow through them. The increase in number of blood vessels able to carry blood is called recruitment. However, it is likely that very few vessels are completely collapsed under normal conditions, and distension is probably much more important than recruitment in reducing vascular resistance.
The anatomical position of the capillaries and their function in gas exchange means that they are different from their systemic counterparts. The density of the capillary network in the alveolar walls is extremely high so that efficient gas exchange can take place. In fact, there are so few cells between the capillaries in the alveolar walls that the alveolar circulation behaves almost like a film of blood flowing around the alveoli. At rest, blood flows through an alveolar capillary in about 0.8 seconds, which is about three times longer than the time needed for oxygenation of mixed venous blood.
There is very little space between the blood in the pulmonary capillaries and the air in the alveoli. In fact, for the most part, the only cells separating blood from air are the endothelial cells of the pulmonary capillary and the epithelial type I cells of the alveolar wall (Fig. 2.9). This is clearly very important in allowing the most efficient transfer of gases between the alveoli and the blood (see Chapter 6).
The bronchial circulation
Not all the blood flowing into the lungs does so via the pulmonary artery – a small volume of arterial blood flows through the bronchial circulation (Fig. 7.4). The bronchial circulation supplies blood to the airways and to the lung parenchyma, although it is not essential to their survival; during a lung transplant the bronchial circulation is not reconnected, and this apparently does not produce any serious ill effects. Blood flowing through the bronchial circulation does not pass through the alveolar capillaries and therefore does not take part in gas exchange.
However, the blood from the more distal parts of the bronchial circulation drains via the deep bronchial veins into the pulmonary circulation. This blood therefore forms a shunt (see below). In other words, the blood arises from the aorta, but instead of draining into the right-hand side of the circulation, the partly deoxygenated blood of the deep bronchial veins drains into the oxygenated blood that has passed through the alveolar capillaries. The resulting mixture of blood therefore has an oxygen content less than that of the original pulmonary artery blood. The significance of this will be discussed later in the chapter.
Distribution of blood flow through the lungs
Gravity
The diastolic blood pressure in the systemic circulation is about 80 mmHg, which is enough pressure to raise a column of water by a height of over a metre. In other words, there is more than enough pressure to carry blood from the heart up to the head. However, in the pulmonary circulation the diastolic blood pressure is about 12 mmHg, enough pressure to raise a column of water about 15 cm. In other words, there is only just enough pressure to pump blood from the right ventricle up to the lung apices. On the other hand, at the lung bases the blood pressure in the pulmonary circulation is equal to the pressure generated by the right ventricle plus the hydrostatic pressure of a column of blood extending up to the heart. Because the pressure generated by the right ventricle is not very high, this extra hydrostatic pressure makes a very significant difference. Thus there is a very considerable difference in arterial blood pressure between the bases and the apices of the lungs owing to gravity. In other words, gravity tends to direct blood towards the lung bases.
