Chapter 9 The Iron Metabolic System
Iron is one of the essential micronutrients and, as such, is required for growth, development, and normal cellular functioning. In contrast to some other micronutrients, such as water-soluble vitamins, there is a significant danger of toxicity if excessive amounts of iron accumulate in the body. A finely tuned feedback control system functions to limit this excessive accumulation by limiting absorption of iron. This chapter discusses systemic and brain iron homeostasis.
Systemic Iron Homeostasis
Dietary Forms of Iron
Iron occurs in two fundamental forms in the human diet: heme and nonheme iron.1 Heme iron refers to all forms of iron from plant and animal sources in which the iron molecule is tightly bound within the porphyrin ring structure, as is found in both myoglobin and hemoglobin. Nonheme iron refers to all other forms of iron. Nonheme iron is solubilized and ionized by gastric acid juice, reduced to the ferrous form, and kept soluble in the upper gastrointestinal tract by chelation to compounds such as citrate and ascorbic acid. The types and amounts of other materials, such as ascorbic acid, that can chelate iron to keep it in solution also determine the amount of nonheme iron in a soluble luminal pool. The number of “inhibitors” of nonheme iron absorption is substantial with phytate, polyphenols, and tannins leading the list. These inhibitors typically bind either ferric or ferrous iron in a tight complex in the lumen of the gut and make it unavailable for the absorptive proteins. Thus, a diet that contains a large amount of unrefined grains and nondigestible fibers will have poor bioavailability. In contrast, a diet that is highly refined and contains little roughage and substantial portions of meat will have a greater iron bioavailability regardless of other factors. The American diet typically contains about 50% of its iron intake from grain products in which the iron concentration is between 0.1 and 0.4 mg per serving. Some fortified cereals, however, may contain as much as 24 mg of iron in a single serving. Heme iron is more highly bioavailable than nonheme iron and its bioavailability is less affected by other components of the diet than nonheme iron. Heme iron represents only about 10% of total dietary iron intake in many Western countries.
Regulation of Absorption
There are two fundamental regulators of iron absorption in humans. The first is the total amount and form of iron compounds ingested (discussed earlier), and the second is the iron status of the individual.2 Thus, individuals with a high iron status will absorb proportionally less of any amount of iron consumed than an iron-deficient individual, and individuals with a lower iron status will absorb more of any dietary intake. This process of selective absorption is the fundamental mechanism whereby humans regulate iron balance.3 Although the details of the regulation are still not yet entirely clear, major discoveries in the last decade have added substantially to our understanding. At supraphysiological levels (as in high-dose iron supplementation) iron can apparently move across the gut via paracellular diffusion following a concentration gradient. At more physiological concentrations, as would be expected with the consumption of food, iron uptake is mediated by a series of receptors and binding proteins, which distinguish heme from nonheme iron.
Heme Iron Absorption
Heme iron is soluble in an alkaline environment; hence, no binding proteins are necessary for its luminal absorption. Specific transporters exist for heme on the surface of enterocytes, and efforts are being made to characterize this heme transporter.4 After binding to its receptor, the heme molecule is then internalized, acted on by heme oxygenase (HOX1) to release the iron to the soluble cytoplasmic pool.5 HOX1 is not induced by oral administration of hemoglobin (a source of heme) but is induced by iron deficiency, suggesting some form of feedback regulation from the iron stores “signal.”5 The distribution of HOX1 in the intestine is identical to that of maximal heme iron absorption. Heme iron absorption is far more efficient than nonheme iron absorption.6 In a typical American diet, it is reasonable to expect that overall dietary nonheme iron absorption is approximately 5% to 10% efficient, whereas heme iron absorption is nearly 40% efficient.
Nonheme Iron Absorption
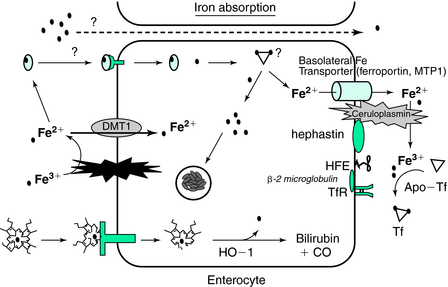
Divalent metal transporter (DMT) (Fig. 9-1) is a transmembrane protein that resides on the luminal membrane, has a strong preference for divalent metals, and exists in several isoforms (DMT1 and DMT2).2,7 The nonheme iron in the lumen of the gut has variable solubility depending on the various amounts of ferric and ferrous iron and the amounts of iron-binding compounds. A membrane-bound member of the cytochrome P450 family, Dcytb, accomplishes the rapid conversion of ferric to ferrous iron. Ferrous iron binds to DMT1, is internalized by vesicular endocytosis, and finally is released into the cellular cytoplasm. This iron is then free to be transported to the basolateral membrane for export by some as-yet-undescribed, intracellular iron-binding protein(s) or it can be incorporated into ferritin.8
Ferritin plays a primary role in both iron storage and detoxification and is found both intracellularly and in a secreted form in the blood.9 Ferritin molecules are composed of two subunit types, H and L. In general, H-chain ferritin is important in ferrous iron oxidation and often increases in response to acute inflammation. H-ferritin may serve as a regulator of cellular differentiation as well as a cytoprotectant.10–15 L-ferritin levels are often reflective of long-term iron storage and are involved in the enucleation of iron in the core of the mature 24-subunit protein.16
The amount of ferritin that is synthesized by the enterocyte is regulated specifically by iron regulator proteins (IRP1 and IRP2), which bind with high affinity to an iron response element (IRE) located in the 5′-untranslated end of the ferritin mRNA.8,17 There is also a similar set of IREs on the 3′ end of the mRNA for transferrin receptor (TfR) and DMT1 that allows for a reciprocal regulation of iron storage and iron uptake. This iron responsive element/iron-regulatory protein (IRE-IRP) system of regulation, however, is also susceptible to oxidative stress because nitric oxide may alter the affinity of this regulator of protein translation.18–20 The amount of IRP1 is, in turn, dependent on the cytosolic free iron concentration. In the presence of cytosolic iron, IRP1 becomes cytoplasmic aconitase with the iron in a 4 iron (Fe)–4 sulfur (S) complex. In the absence of iron, the IRP1 (now a 3Fe-4S complex) binds to the IREs of various iron proteins to regulate the translation of the mRNA transcripts.
A second iron regulatory protein, IRP2, is produced and metabolized in a distinctly different fashion than IRP1 and appears to be quite sensitive to oxygen partial pressure.22 IRP2, like IRP1, is sensitive to cytosolic-free iron and has somewhat different binding affinities to IREs than IRP1.8 Lower duodenal levels of ferritin mRNA are found in iron-deficient subjects and higher duodenal levels of ferritin mRNA found in secondary iron overload support the role of mucosal ferritin as a major regulator of iron absorption.21 Thus, enterocyte ferritin is the mucosal “iron sink” and can serve as a means of limiting iron absorption as the enterocytes are sloughed off the tip of the microvillus in 3.4 days.
Thus, it is now reasonable to assume the IRPs are the principal iron sensors in the enterocyte and determine the fate of iron movement for export or storage in ferritin.22 Consistent with this hypothesis is the fact that the concentrations of mucosal cell ferritin mRNA and ferritin protein in patients with familial hemochromatosis are lower than those of patients with secondary iron overload.21,23,24
Basolateral Membrane Iron Export
Ferroportin functions as the cellular iron exporter and also contains an IRE (like ferritin, and DMT1, TfR) and interacts, in some undefined fashion, with the hemochromatosis gene (HFE) protein on the abluminal enterocyte surface. Mutant forms of this protein are associated with very severe iron overload.25 Recent studies have identified a 25–amino acid protein, called hepcidin, which is secreted by hepatocytes in amounts proportional to iron stores.25 Hepcidin binds to another transmembrane protein, ferroportin, followed by its internalization and destruction.26
Plasma Transport and Storage
The ferroportin protein releases ferrous iron into the plasma pool where association with hephaestin and ceruloplasmin acts in a redox couple to form ferric iron. Hephaestin, a membrane-bound ferroxidase, has 50% amino acid homology with ceruloplasmin, another ferroxidase that is found in plasma.27 Mutations in the ceruloplasmin gene cause an autosomal recessive disease known as aceruloplasminemia. This disease is characterized by iron accumulation and clinically is often manifest by diabetes and degeneration of the retina and basal ganglia.28
Once ferric iron has been formed by either hephaestin or ceruloplasmin, it binds to transferrin (Tf). Tf is produced in a number of cells, but the liver is the primary donor to the plasma pool. The rate of production of Tf is affected by the iron status of the individual via transcriptional regulation.2 Individuals with depleted iron stores and a plasma Fe concentration of less than 40 to 60 µg/dL will have increased Tf production and increased plasma Tf concentration by nearly 100%. The two binding sites on Tf are nearly identical in binding affinity for iron (Kd = 10−22 mol/L). In vivo, Tf is normally 25% to 50% saturated with iron, but in iron deficiency, it can be less than 5% in the extreme.29 One of the criteria for establishing iron deficiency is for the transferrin saturation (TSAT) to be less than 15%.3 At this level of saturation, there is insufficient delivery of iron to bone marrow to maintain normal rates of erythropoiesis. Thus, under normal physiological circumstances, the iron-binding capacity of plasma is always in excess of iron concentration. The rate and location of the uptake of iron from the plasma pool are proportional to the number of TfRs expressed on plasma membranes.2 The normal concentration of iron in the human body is between 30 and 40 mg/kg, but nearly 85% of the nonstorage iron is found in the erythroid mass. The storage iron concentration in the body varies from 0 to 15 mg/kg depending on the gender and iron status of the individual. The liver contains more than 60% of the storage pool of iron with the metal sequestered inside the 24-subunit protein, ferritin. The core of this ferritin molecule can contain up to 4000 atoms of iron as ferric-hydrite. The amount of ferritin produced is determined by the IRP-IRE interaction previously described in the enterocyte. The remaining 40% of stored iron is found in muscle tissues and cells of the reticuloendothelial system.3 Normally, 95% of the stored iron in liver tissue is found in hepatocytes as ferritin. Iron in hemosiderin constitutes the remaining 5% and is found predominantly in Kupffer cell lysosomal remnants. During iron overload, however, the mass of hemosiderin iron in the liver accumulates at 10 times the rate of ferritin iron.30
Because the bone marrow has by far the greatest daily demand for iron, that is where greater than 80% of the plasma iron ends up on a daily basis. It is estimated that nearly 20 mg of Fe per day goes to the bone marrow for insertion into erthryoblasts in the porphyrin ring structure to form hemoglobin. As the plasma pool of iron is frequently less than 4 mg of iron, it is easy to compute that the half-life of an iron molecule in plasma is quite short. The other contributors to the plasma pool of iron apart from the gastrointestinal are macrophages, other reticuloendothelial (RE) cells, and hepatocytes. Iron turnover is primarily mediated by destruction of senescent erythrocytes by the reticuloendothelial system.31 Erythrocytes, which contain about 80% of the body’s functional iron, have a mean functional lifetime of 120 days in humans. At the end of their functional lifetime, they are recognized as senescent by changes in the structure of their membranes and are catabolized at extravascular sites by Kupffer cells and spleen macrophages. After phagocytosis, the globin chains of hemoglobin are denatured, which releases bound heme. Intracellular unbound heme is ultimately degraded by heme oxygenase, which liberates iron. About 85% of the iron derived from hemoglobin degradation is re-released to the body in the form of iron bound to Tf or ferritin. Each day, 0.66% of the body’s total iron content is recycled in this manner.32 Smaller contributions are made to plasma iron turnover by the degradation of myoglobin and iron-containing enzymes. Macrophage release of iron is affected by hepcidin, which alters the export of iron to the plasma pool.26
Iron Losses
The low solubility of iron at physiological pH precludes urinary excretion as a major mechanism of maintaining iron homeostasis. Thus, in contrast to most other trace minerals whose homeostasis in maintained by excretion, the primary mechanism of maintaining whole body iron homeostasis is to regulate the amount of iron absorbed so that it approximates iron losses. Iron losses can vary considerably with the gender of the individual. In males, total iron losses from the body have been calculated to be 1 mg/day. For premenopausal females, this loss is slightly higher. The predominant route of loss is from the gastrointestinal tract and amounts to 0.6 mg/day in men.32 Fecal iron losses derive from shed enterocytes, extravasated red blood cells, and biliary heme breakdown products, which are poorly absorbed. Urogenital and integumental iron losses have been estimated to be greater than 0.1 mg/day and 0.3 mg/day, respectively, in men.31 Menstrual iron loss, estimated from an average blood loss of 33 mL/month, equals 1.5 mg/day but may reach as high as 2.1 mg/day.33 Oral contraceptives reduce this loss and intrauterine devices increase it.34,35 Pregnancy is associated with losses approximating 1 g, which consist of a basal loss of 230 mg iron, increased maternal red cell mass of 450 mg iron, fetal needs of 270 to 300 mg iron, and placenta, deciduas, and an amniotic fluid iron content of 50 to 90 mg. A number of clinical and pathological conditions are attended by varying amounts of blood loss. These conditions include hemorrhage, hookworm infestation, peptic gastric or anastomotic ulceration, ulcerative colitis, colonic neoplasia, infant feeding with cow’s milk, aspirin, nonsteroidal anti-inflammatory drugs or corticosteroid administration, and hereditary hemorrhagic telangiectasia (see Bothwell3 for review). In addition to these conditions, a significant amount of iron (210 to 240 mg/unit) can be lost with regular blood donation.
Treatment of Iron Deficiency
Iron deficiency has traditionally been categorized into iron deficiency anemia and tissue iron deficiency, also referred to as “depleted iron stores.” Iron deficiency anemia is diagnosed as a low serum Tf saturation (<15%), a low serum ferritin concentration (<12 µg/L), and an elevated soluble TfR (>6 mg/dL) in the setting of microcytic anemia. Anemia, however, reflects a late stage of iron depletion with earlier stages often evidenced by low serum ferritin and slightly elevated TfR levels. Because both serum ferritin and serum iron concentrations are acute-phase reactants to inflammatory cytokines, the presence of inflammation must be considered in a diagnosis of iron deficiency. After the diagnosis of true iron deficiency, rapid restoration of an iron-replete state can be achieved by administering 125 to 250 mg of ferrous sulfate orally per day. This dosage of the salt will deliver 39 to 72 mg of highly bioavailable iron per day. There is some evidence that doses greater than 250 mg ferrous sulfate convey additional benefits, and it is still common practice in severe anemia of pregnancy to administer this dose twice per day. This, however, results in a high prevalence of complaints of gastrointestinal distress, constipation, and blackened stools. Thus, compliance with these high doses drops considerably from prescribed amounts. Once the iron deficiency is resolved, daily intake of iron based at RDA levels should be maintained.
Brain Iron Homeostasis
The normal adult brain has a high concentration of iron (approximately 60 mg) in a distinct pattern of distribution. Hallgren and Sourander36 studied iron content in approximately 100 autopsy brains, establishing the standard reference for brain region iron quantification. They found the globus pallidus, red nucleus, substantia nigra, and putamen to contain the greatest amounts of iron, followed by the dentate nucleus, caudate nucleus, and frontal white matter. They also noted that iron content is low in all brain regions at birth and increases to a fairly constant value by about age 40. More recent studies by Bartzokis and colleagues37 used magnetic resonance imaging to confirm the findings of Hallgren and Sourander.36
At the cellular level, most of the stainable iron in the brain is found in oligodendrocytes. Tf protein is also found predominantly in oligodendrocytes under normal conditions. A mature population of oligodendrocytes is required for normal expression of both Tf protein and mRNA even in the presence of significant astrogliosis.38 TfRs are found on neurons and blood vessels in the cortex, striatum, and hippocampus39 but not on oligodendrocytes even with their strong iron staining and even under conditions of iron deprivation when Tf in the brain is elevated.40 The uptake of iron into oligodendrocytes appears to be mediated by ferritin.41,42 The cellular distribution of ferritin is subunit specific. Subunit composition of the mature ferritin varies greatly among mammalian tissues, with L-rich ferritins generally being found in iron storage organs such as the liver and spleen, and H-rich ferritins being located more in organs such as the heart and brain.43 In the brain, H-ferritin predominates,44 but the ratio of H to L subunits is cell specific. Neurons express almost entirely H-ferritin and microglia express predominantly L-ferritin.45,46 Oligodendrocytes contain a mixture of H- and L-ferritin, and the pattern of staining for ferritin in white matter oligodendrocytes is consistent with the staining pattern for iron rather than Tf.
Iron Transport Across the Blood-Brain Barrier
The factors that come into play to determine when and how iron is moved across the BBB are likely different from or at least independent of those in gut-blood barrier. This is exemplified in studies of rodents where peripheral iron status has not been found to be a predictor of brain iron status.47 Furthermore, there is regional heterogeneity in the iron distribution of the brain, but the mechanism for establishing and maintaining that heterogeneity is unknown.
Early research into the mechanism of iron uptake into the brain established the role of TfR at the BBB. Pardridge and associates48 not only found that the TfR was present on isolated human brain capillary but also provided evidence for TfR-mediated endocytosis into endothelial cytoplasm. Based on this research, Pardridge and associates proposed that, unlike most endocytotic transport systems, Tf remained associated with iron. It is clear, however, that such a system is both insufficient and problematic when applied to the BBB28,49; at a primary level, it ignores the iron requirement of the endothelial cells that form the BBB.
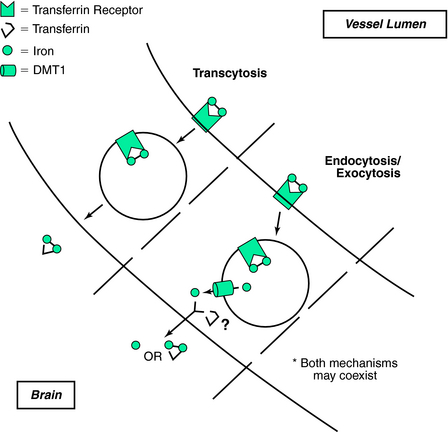
The traditional thinking for brain iron uptake proposes that TfR bound to Tf molecules travels across the lumen (Fig. 9-2). Such a mechanism poses several potential difficulties for interpreting transport of iron across the BBB. First, it is unclear how the Tf–Fe–TfR complex is processed between the luminal and abluminal membranes. If the TfR–Tf–Fe complex is transcytosed to the abluminal membrane, Tf should not be able to dissociate from TfR until the Tf first releases its iron. It is implausible that the Tf would release its iron without a significant alteration of the dissociation constant (estimated to be approximately 10−22 mol/L), which requires a reduction in pH.50 Acidification could be accomplished in a model that favors endocytosis rather than transcytosis, as the pH-labile endosomes are the established intracellular site for iron release. A plausible model of endosomal brain iron transport involves Tf delivery of iron by binding to cell-surface Tf receptors, which are then internalized into endosomes. The iron is then released from the TfR at the lower endosomal pH and is transported out of the endosome by DMT1. In support of this idea is our observation that DMT1 is expressed in brain endothelial cells.51
Furthermore, the regulation of Tf receptor expression occurs via post-transcriptional regulation. The post-transcriptional regulation is accomplished by the binding of IRPs (see description under Nonheme Iron Absorption) to the IREs on the 3′ end of the Tf receptor mRNA. The binding of the IRPs is in response to changes in the labile iron pool within the cell. IRPs have been demonstrated in the BBB.52 Therefore, the mechanism (and regulation of this mechanism) for Tf receptor expression in the BBB appeara similar to those for most cells. Furthermore, ferritin is also found in endothelial cells of the BBB,53 providing additional evidence that the endothelial cells lining the BBB are not simply a conduit whereas iron transport.
Studies of Tf brain transport have shown conflicting results. One in vivo rat study demonstrated that as much as 50% of iodine-125 (125I)-labeled Tf was transported to the brain,54 indicating a transcytosis mechanism that included Tf, whereas another study found that only 10% of the Tf reached the brain,55 suggesting that Tf was not transcytosed with iron. To address the mechanism of iron transport into the brain, at our laboratory, we used fluorescein-labeled Tf along with radioactively labeled iron-59 (59Fe) in a bovine retinal endothelial cell culture system to investigate the mode of iron and Tf transport.49 Using a Transwell culture system, we found that iron is transported into the basal chamber in both a non-Tf and a Tf form. Non-Tf–bound transport of iron could be altered by iron loading the cells or by treating them with ammonium chloride to prevent iron release with the endosomes, whereas the Tf-associated iron was not affected by blocking the acidification of the endosomes. These results suggest that the mechanisms of iron transport may be dependent on the iron status of the endothelial cells. In addition to the non-Tf and Tf forms of BBB iron transport discussed, studies suggest that lactoferrin56 and ferritin57 may also participate in BBB iron transport.
Cellular Iron Uptake in the Brain
The expression of TfRs in the brain at both the mRNA and protein levels is located primarily within gray matter areas.40,41,58,59 Although this observation indicates that neurons receive iron via a Tf-mediated process, the white matter tracts and the oligodendrocytes within them are relatively iron rich, suggesting that alternative uptake mechanisms to Tf must exist for these cells. Hulet and coworkers60 demonstrated the presence of ferritin-binding sites in the normal human brain in white matter tracts in a distribution opposite of that seen for TfR, providing evidence of ferritin binding in the human brain. They also found that in patients with multiple sclerosis, the normal pattern of Tf- and ferritin-binding distributions is disrupted, with ferritin binding absent in the lesion and the periplaque region in the white matter. Gray matter binding of Tf in multiple sclerosis patients was normal, suggesting that loss of ferritin binding is involved in or is a consequence of demyelination associated with multiple sclerosis.
Lactoferrin receptors have been reported in the substantia nigra in the human brain,61 and their expression was reported altered in brains from individuals with Parkinson’s disease. In addition, lactoferrin receptors have also been reported on the BBB.62
The Role of DMT1 in the Brain
DMT1 has been demonstrated in endothelial cells and in the astrocytic end-feet that are associated with blood vessels,63 lending support to a role for DMT1 in BBB transport. In addition, there is a report of DMT1 staining in neurons, including the nuclei of neurons.64 DMT1 exists in at least four different isoforms. Two forms differ at the C terminus (IRE+ and IRE−), and the other two forms differ at the transcription start site on N terminus. The different forms of DMT1 are distributed in different compartments of the cell. The IRE− forms of DMT1 are found in the nucleus and cytoplasm of neuronal and neuronal-like cells, whereas the IRE+ species are found only in the cytoplasmic compartment of these cells, suggesting that the two proteins may have different functions in vivo.64 One study comparing differences in expression and localization of the isoforms in rat astrocytes showed that neither the IRE+ or IRE− isoforms co-localized with the TfR,65 possibly suggesting distinct, specialized functions for the DMT1 isoforms aside from its role in Tf-TfR iron transport.
A valuable animal model for the study of DMT1 is the Belgrade rat. This animal contains a defective DMT1 gene, resulting in impaired intestinal iron uptake and systemic iron deficiency, as well as lower levels of iron in the brain.63,66,67 Moos and Morgan68 investigated the role of DMT1 in brain iron transport using the Belgrade rat model. They found that the DMT1 antibody they used detected the same levels of DMT1 in neurons and choroid plexus of both Belgrade (b/b) and control animals, but they failed to detect DMT1 in brain capillary endothelial cells. From these data, they suggest that “the low cerebral iron uptake in b/b rats derives from a reduced neuronal uptake rather than an impaired iron transport through the blood-brain barrier.”68 They argue in favor of a transcytosis theory of iron transport that does not require the presence of DMT1 in brain endothelial cells, suggesting instead that there exist microenvironments (created by such mediators as citrate and ATP) in brain extracellular fluid that allow for iron release from Tf. DMT1, they propose, plays a role only at the neuronal level, not in endothelial cell iron transport. We have shown, however, that both Tf-associated and non–Tf-associated iron is released from a cell culture model of the BBB.69 We have also provided evidence that endothelial cells of the brain do express the divalent metal transport protein to mediate iron release from endosomes within the cell. Furthermore, endothelial cells contain relatively high amounts of ferritin,70 indicating the existence of iron stores. The concept that brain endothelial cells have their own considerable iron requirement and regulate their own iron uptake is consistent with the high concentration of mitochondria in these cells and thus high iron requirement.71
Effects of Iron Deficiency on the Brain and Neurological Function
Because of the multiple biochemical pathways that require iron, iron deficiency can affect brain metabolism in many ways. The brain is especially susceptible to iron shortages during development, as iron is required for proper myelination and as a cofactor for enzymes in neurotransmitter synthesis.72–74 Animal studies over the past 30 years have documented the neurological consequences resulting from iron deficiency. It has been shown that even after iron-deficient rats are returned to a normal iron diet for several days, nonheme iron and ferritin remain depressed in the brain.75 Additionally, rats exposed to an iron deficiency for the first 28 days of life never recover, exhibiting a persistent deficit in brain nonheme iron, as well as changes in behavior and physiological responsiveness.76 Another study revealed further behavioral effects in iron-deprived rats, including decreased motor activity and reversed circadian rhythms of thermoregulation and motor activity, indicating the major role iron plays in the normal function of the dopaminergic system in the brain.77 Animal studies have distinguished differences between prenatal and postnatal recoveries from iron deficiency. If iron deficiency occurs during the postweaning period, recovery with dietary iron repletion occurs quickly,78–80 but the effects of iron deficiency in utero appear to be irreversible, even after iron repletion.81–83
Results of studies in humans have supported and extended the findings in animals. A study of grade-school children who were anemic as infants showed a significantly lower learning achievement score and positive task orientation in the anemic group than in the nonanemic control group.84 Another study found not only that children who were iron deficient as infants scored lower on tests of mental and motor functioning as teens than those infants who were not iron deficient, but also that more of those children had repeated a grade, been referred for special services, and/or were the objects of parental and teacher concerns regarding anxiety, depression, social difficulties, and attention problems.85 One study also examined the iron status of the mothers of iron-deficient infants and found that in young South African anemic mothers of full-term infants, the infants of the anemic mothers were developmentally delayed at 10 weeks. At 9 months, despite normalization of iron status in some mothers, the developmental delays were not diminished in the infants. At 9 months postpartum, anemic mothers were more negative, less engaged, and less responsive toward their babies than were control mothers. Mothers treated for iron-deficiency exhibited behaviors similar to control mothers.86 A different study of South African women by Beard and colleagues87 similarly found that iron treatment of anemic mothers up to 9 months postpartum resulted in a 25% improvement of depression, stress, and cognitive function, further suggesting the importance of maternal iron status on infant development. These studies highlight the needs to study and correct iron deficiency over the lifetime and allude to the diverse impacts of iron deficiency at different stages in life. It is now accepted that dietary iron deficiency lowers brain iron and interferes with protein synthesis in the brain,66 but there remains a paucity of knowledge on the effects of such early iron deficiency on later, adult life.
Neurological Disorders Associated With Excess Brain Iron
Abnormal concentrations of iron in the brain occurs in a number of neurological disorders, especially movement disorders.88 In addition, iron is a component of neuritic plaques in Alzheimer’s disease and can have a direct effect on amyloid synthesis and deposition.89 Furthermore, iron may directly contribute to the age-related breakdown observed in myelin and may contribute to Alzheimer’s disease through such a mechanism.90 Iron also promotes deposition of α-synuclein and therefore may be directly involved in Lewy body formation and Parkinson’s disease.91 Furthermore, magnetic resonance imaging and autopsy studies suggest there is iron dysregulation in the substantia nigra in Parkinson’s disease and that the dysregulation may be related to early- versus late-onset Parkinson’s disease.92–94 A genetic defect in ferritin has been associated with iron accumulation in the basal ganglia, and the disorder is now known as neuroferritinopathy.95
Additional Proteins Involved in Iron Management
More proteins involved in iron management, such as hepcidin, hephaestin, and ferroportin (also known as metal transport protein 1), have been identified, but relatively little information is available on these proteins in the brain. Hepcidin is released from the liver and interacts with a hephaestin/ferroportin complex on enterocytes and macrophages to decrease iron release by these cells.96 In the brain, prohepcidin has been identified in the human cerebrospinal fluid and in neuromelanin cells from the substantia nigra.97 Ferroportin has been demonstrated on the neuromelanin cells in the human brain97 and in neurons throughout the brain in rats.50 Another group found a wider distribution of ferroportin in the rat brain that included oligodendrocytes and astrocytes.98 An important question is whether ferroportin participates in release of iron from the endothelial cells into the brain. The two reports that examined ferroportin are not in agreement. Burdo and colleagues51 did not detect ferroportin in blood vessels in the brain with either immunocytochemistry or Western blot analysis. Wu and coworkers.98 did detect ferroportin protein but could not confirm these results with in situ hybridization for ferroportin mRNA. These latter data raise concerns about the immunocytochemistry observations because ferroportin is not known to be released by cells in a soluble manner and to be taken up by other cells.
The distribution of ferroportin is an important link in our knowledge of iron movement within the brain. It is not known, for example, how iron exits the BBB and if it enters astrocytes via the astrocytic end-feet before it is disseminated to the rest of the brain. Jeong and David99 determined that ferroportin and DMT1 are expressed by cultured astrocytes and provided microscopic evidence that ferroportin, but not DMT1, is co-localized with a glycosylphosphatidylinositol-anchored ceruloplasmin (GPI-Cp) on the surface of cultured astrocytes. In support of the microscopic evidence, ferroportin, but not DMT1, is co-immunoprecipitated with GPI-Cp, suggesting a direct interaction of this GPI-anchored ferroxidase with ferroportin.99 Cultured astrocytes from Cp−/− knockout mice have impaired iron efflux, further supporting the idea of a role for Cp and ferroportin in iron efflux. The latter also suggests that iron entering the brain may be passaged through astrocytes, but at present this idea is not supported by in vivo evidence.
1. Hurrell RF. Improvement of trace element status through food fortification: Technological, biological and health aspects. Bibl Nutr Diet. 1998;54:40-57.
2. Aisen P, et al. Chemistry and biology of eukaryotic iron metabolism. Int J Biochem Cell Biol. 2001;33:940-959.
3. Bothwell T, et al. Iron Metabolism in Man. Oxford: Blackwell Scientific Publications, 1979.
4. Conrad ME, et al. Human absorption of hemoglobin-iron. Gastroenterology. 1967;53:5-10.
5. Raffin SB, et al. Intestinal absorption of hemoglobin ironheme cleavage by mucosal heme oxygenase. J Clin Invest. 1974;54:1344-1352.
6. Rosenberg DW, Kappas A. Characterization of heme oxygenase in the small intestinal epithelium. Arch Biochem Biophys. 1989;274:471-480.
7. Gunshin H, et al. Cloning and characterization of a mammalian proton-coupled metal-ion transporter. Nature. 1997;388:482-488.
8. Eisenstein RS. Iron regulatory proteins and the molecular control of mammalian iron metabolism. Annu Rev Nutr. 2000;20:627-662.
9. Bellotti V, et al. Characteristics of a ferritin-binding protein present in human serum. Br J Haematol. 1987;65:489-493.
10. Chou C, et al. Structure and expression of ferritin genes in a human promyelocytic cell line that differentiates in vitro. Mol Cell Biol. 1986;6:566-573.
11. Chazenbalk G, Wadsworth HL, Rapoport B. Transcriptional regulation of ferritin H messenger RNA levels in FRTL5 rat thyroid cells by thyrotropin. J Biol Chem. 1990;265:666-670.
12. Chazenbalk G, et al. Thyrotropin and adenosine 3′,5′-monophosphate stimulate the activity of the ferritin-H promoter. Mol Endocrinol. 1990;4:1117-1124.
13. Broxmeyer H, et al. Mutated recombinant human heavy-chain ferritins and myelosuppression in vitro and in vivo: A link between ferritin ferroxidase activity and biological function. Proc Natl Acad Sci U S A. 1991;88:770-774.
14. Balla G, et al. Ferritin: A cytoprotective antioxidant strategem of endothelium. J Biol Chem. 1992;267:18148-18153.
15. Cozzi A, et al. Role of iron and ferritin in TNFalpha-induced apoptosis in HeLa cells. FEBS Lett. 2003;537:187-192.
16. Levi S, et al. The role of the L-chain in ferritin iron incorporation. Studies of homo and heteropolymers. J Mol Biol. 1994;238:649-654.
17. Owen D, Kuhn LC. Noncoding 3′sequences of the transferrin receptor gene are required for mRNA regulation by iron. EMBO J. 1987;6:1287-1293.
18. Rouault T, Klausner R. Regulation of iron metabolism in eukaryotes. Curr Top Cell Regul. 1997;35:1-19.
19. Rouault TA. Post-transcriptional regulation of human iron metabolism by iron regulatory proteins. Blood Cells Mol Dis. 2002;29:309-314.
20. Hentze MW, Kuhn LC. Molecular control of vertebrate iron metabolism: mRNA-based regulatory circuits operated by iron, nitric oxide, and oxidative stress. Proc Natl Acad Sci U S A. 1996;93:8175-8182.
21. Pietrangelo A, et al. Regulation of transferrin, transferrin receptor, and ferritin genes in human duodenum. Gastroenterology. 1992;102:802-809.
22. Meyron-Holtz EG, et al. Mammalian tissue oxygen levels modulate iron-regulatory protein activities in vivo. Science. 2004;306:2087-2090.
23. Francanzani AL, et al. Immunohistochemical evidence for a lack of ferritin in duodenal absorptive epithelial cells in idiopathic hemochromatosis. Gastroenterology. 1989;96:1071-1078.
24. Lee P, et al. Seeking candidate mutations that affect iron homeostasis. Blood Cells Mol Dis. 2002;29:471-487.
25. Nicolas G, et al. Lack of hepcidin gene expression and severe tissue iron overload in upstream stimulatory factor 2 (USF2) knockout mice. Proc Natl Acad Sci U S A. 2001;98:8160-8162.
26. Nemeth E, et al. Hepcidin regulates cellular iron efflux by binding to ferroportin and inducing its internalization. Science. 2004;306:2090-2093.
27. Chen H, et al. Systemic regulation of Hephaestin and Ireg1 revealed in studies of genetic and nutritional iron deficiency. Blood. 2003;102:1893-1899.
28. Qian ZM, Shen X. Brain iron transport and neurodegeneration. Trends Mol Med. 2001;7:103-108.
29. Stallard B, Collard MW, Griswold MD. A transferrin (hemiferrin) mRNA is expressed in the germ cells of rat testis. Mol Cell Biol. 1991;11:1448-1453.
30. Selden C, et al. Studies on the concentration and intracellular localization of iron proteins in liver biopsy specimens from patients with iron overload with special reference to their role in lysosomal disruption. Br J Haematol. 1980;44:593-603.
31. Finch CA, et al. Ferrokinetics in man. Medicine (Baltimore). 1970;49:17-53.
32. Green R, et al. Body iron excretion in man: A collaborative study. Am J Med. 1968;45:336-353.
33. Cole SK, Billewicz WZ, Thomson AM. Sources of variation in menstrual blood loss. J Obstet Gynaecol Br Commonw. 1971;78:933-939.
34. Frassinelli-Gunderson EP, Margen S, Brown JR. Iron stores in users of oral contraceptive agents. Am J Clin Nutr. 1985;41:703-712.
35. Kivijarvi A, et al. Iron deficiency in women using modern copper intrauterine devices. Obstet Gynecol. 1986;67:95-98.
36. Hallgren B, Sourander P. The effect of age on the non-haemin iron in the human brain. J Neurochem. 1958;3:41-51.
37. Bartzokis G, et al. In vivo MR evaluation of age-related increases in brain iron. AJNR Am J Neuroradiol. 1994;15:1129-1138.
38. Connor JR, Menzies SL. Relationship of iron to oligodendrocytes and myelination. Glia. 1996;17:83-93.
39. Connor JR, Menzies SL. Cellular management of iron in the brain. J Neurol Sci. 1995;134(suppl):33-44.
40. Han J, et al. Gene expression of transferrin and transferrin receptor in brains of control vs. iron-deficient rats. Nutr Neurosci. 2003;6:1-10.
41. Hulet SW, Powers S, Connor JR. Distribution of transferrin and ferritin binding in normal and multiple sclerotic human brains. J Neurol Sci. 1999;165:48-55.
42. Hulet S, et al. Characterization and distribution of ferritin binding sites in the adult mouse brain. J Neurochem. 1999;72:868-874.
43. Harrison PM, Arosio P. The ferritins: Molecular properties, iron storage function and cellular regulation. Biochim Biophys Acta. 1996;1275:161-203.
44. Sanyal B, Polak PE, Szuchet S. Differential expression of the heavy-chain ferritin gene in non-adhered and adhered oligodendrocytes. J Neurosci Res. 1996;46:187-197.
45. Connor J, et al. Isoforms of ferritin have a specific cellular distribution in the brain. J Neurosci Res. 1994;37:461-465.
46. Han J, et al. H and L ferritin subunit mRNA expression differs in brains of control and iron-deficient rats. J Nutr. 2002;132:2769-2774.
47. Jones BC, et al. Quantitative genetic analysis of ventral midbrain and liver iron in BXD recombinant inbred mice. Nutr Neurosci. 2003;6:369-377.
48. Pardridge WM, Eisenberg J, Yang J. Human blood-brain barrier transferrin receptor. Metabolism. 1987;36:892-895.
49. Burdo JR, et al. Mechanisms and regulation of transferrin and iron transport in a model blood-brain barrier system. Neuroscience. 2003;121:883-890.
50. Aisen P, Listowsky I. Iron transport and storage proteins. Annu Rev Biochem. 1980;49:357-393.
51. Burdo JR, et al. Distribution of divalent metal transporter 1 and metal transport protein 1 in the normal and Belgrade rat. J Neurosci Res. 2001;66:1198-1207.
52. Siddappa AJ, et al. Developmental changes in the expression of iron regulatory proteins and iron transport proteins in the perinatal rat brain. J Neurosci Res. 2002;68:761-775.
53. Burdo JR, et al. Regulation of the profile of iron-management proteins in brain microvasculature. J Cereb Blood Flow Metab. 2004;24:67-74.
54. Fishman JB, et al. Receptor-mediated transcytosis of transferrin across the blood-brain barrier. J Neurosci Res. 1987;18:299-304.
55. Roberts RL, Fine RE, Sandra A. Receptor-mediated endocytosis of transferrin at the blood-brain barrier. J Cell Sci. 1993;104(Pt 2):521-532.
56. Ji B, et al. Pharmacokinetics and brain uptake of lactoferrin in rats. Life Sci. 2005;78:851-855.
57. Fisher J, et al. Ferritin: A novel mechanism for delivery of iron to the brain and other organs. Am J Physiol Cell Physiol 2007;293:C641-C649.
58. Hill JM, et al. Transferrin receptors in rat brain: Neuropeptide-like pattern and relationship to iron distribution. Proc Natl Acad Sci U S A. 1985;82:4553-4557.
59. Mash DC, et al. Characterization and distribution of transferrin receptors in the rat brain. J Neurochem. 1990;55:1972-1979.
60. Hulet SW, Powers S, Connor JR. Distribution of transferrin and ferritin binding in normal and multiple sclerotic human brains. J Neurol Sci. 1999;165:48-55.
61. Faucheux B, et al. Expression of lactoferrin receptors is increased in the mesenchephalon of patients with parkinson disease. Proc Natl Acad Sci U S A. 1995;92:9603-9607.
62. Ji B, et al. Pharmacokinetics and brain uptake of lactoferrin in rats. Life Sci. 2005;78:851-855.
63. Burdo JR, et al. Distribution of divalent metal transporter 1 and metal transport protein 1 in the normal and Belgrade rat. J Neurosci Res. 2001;66:1198-1207.
64. Roth JA, et al. Differential localization of divalent metal transporter 1 with and without iron response element in rat PC12 and sympathetic neuronal cells. J Neurosci. 2000;20:7595-7601.
65. Lis A, et al. Expression and localization of different forms of DMT1 in normal and tumor astroglial cells. Brain Res Mol Brain Res. 2004;122:62-70.
66. Fleming MD, et al. Nramp2 is mutated in the anemic Belgrade (b) rat: Evidence of a role for Nramp2 in endosomal iron transport. Proc Natl Acad Sci U S A. 1998;95:1148-1153.
67. Zywicke HA, et al. Microscopic R2* mapping of reduced brain iron in the Belgrade rat. Ann Neurol. 2002;52:102-105.
68. Moos T, Morgan EH. The significance of the mutated divalent metal transporter (DMT1) on iron transport into the Belgrade rat brain. J Neurochem. 2004;88:233-245.
69. Burdo J.R, Antonetti DA, Wolpert EB, Connor JR. Mechanisms and regulation of transferrin and iron transport in a model blood-brain barrier system. Neuroscience. 2003;121:883-890.
70. Burdo J.R, Simpson I.A, Menzies S, Beard J, Connor J.R. Regulation of the profile of iron-management proteins in brain microvasculature. J. Cereb. Blood Flow Metab. 2004;24:67-74.
71. Stewart PA, Tuor UI. Blood-eye barriers in the rat: correlation of ultrastructure with function. J Comp Neurol. 1994;340:566-576.
72. Larkin E, Rao GA. Importance of fetal and neonatal iron: Adequacy for normal development of central nervous system. In: Dobbing J, editor. Brain, Behavior and Iron in the Infant Diet. London: Springer-Verlag; 1990:43-63.
73. Beard JL, Connor JR. Iron status and neural functioning. Annu Rev Nutr. 2003;23:41-58.
74. Beard JL, Wiesinger JA, Connor JR. Pre- and postweaning iron deficiency alters myelination in Sprague-Dawley rats. Dev Neurosci. 2003;25:308-315.
75. Dallman PR, Siimes MA, Manies EC. Brain iron: Persistent deficiency following short-term iron deprivation in the young rat. Br J Haematol. 1975;31:209-215.
76. Weinberg J, Levine S, Dallman PR. Long-term consequences of early iron deficiency in the rat. Pharmacol Biochem Behav. 1979;11:631-638.
77. Youdim MB, Yehuda S, Ben-Uriah Y. Iron deficiency-induced circadian rhythm reversal of dopaminergic-mediated behaviours and thermoregulation in rats. Eur J Pharmacol. 1981;74:295-301.
78. Chen Q, Connor JR, Beard JL. Brain iron, transferrin and ferritin concentrations are altered in developing iron-deficient rats. J Nutr. 1995;125:1529-1535.
79. Erikson KM, et al. Regional brain iron, ferritin and transferrin concentrations during iron deficiency and iron repletion in developing rats. J Nutr. 1997;127:2030-2038.
80. Pinero DJ, et al. Variations in dietary iron alter brain iron metabolism in developing rats. J Nutr. 2000;130:254-263.
81. Felt BT, Lozoff B. Brain iron and behavior of rats are not normalized by treatment of iron deficiency anemia during early development. J Nutr. 1996;126:693-701.
82. Kwik-Uribe CL, et al. Chronic marginal iron intakes during early development in mice result in persistent changes in dopamine metabolism and myelin composition. J Nutr. 2000;130:2821-2830.
83. Kwik-Uribe CL, Golub MS, Keen CL. Chronic marginal iron intakes during early development in mice alter brain iron concentrations and behavior despite postnatal iron supplementation. J Nutr. 2000;130:2040-2048.
84. Palti H, Meijer A, Adler B. Learning achievement and behavior at school of anemic and non-anemic infants. Early Hum Dev. 1985;10:217-223.
85. Lozoff B, et al. Poorer behavioral and developmental outcome more than 10 years after treatment for iron deficiency in infancy. Pediatrics. 2000;105:E51.
86. Perez EM, et al. Mother-infant interactions and infant development are altered by maternal iron deficiency anemia. J Nutr. 2005;135:850-855.
87. Beard JL, et al. Maternal iron deficiency anemia affects postpartum emotions and cognition. J Nutr. 2005;135:267-272.
88. Zecca L, et al. Iron, brain ageing and neurodegenerative disorders. Nat Rev Neurosci. 2004;5:863-873.
89. Rogers JT, et al. An iron-responsive element type II in the 5′-untranslated region of the Alzheimer’s amyloid precursor protein transcript. J Biol Chem. 2002;277:45518-45528.
90. Bartzokis G, et al. Heterogeneous age-related breakdown of white matter structural integrity: Implications for cortical “disconnection” in aging and Alzheimer’s disease. Neurobiol Aging. 2004;25:843-851.
91. Kaur D, Andersen J. Does cellular iron dysregulation play a causative role in Parkinson’s disease? Ageing Res Rev. 2004;3:327-343.
92. Dexter DT, et al. Alterations in the levels of iron, ferritin, and other trace metals in Parkinson’s disease and other neurodegenerative disease affecting the basal ganglia. Brain. 1991;114:1953-1975.
93. Loeffler DA, et al. Transferrin and iron in normal, Alzheimer’s disease, and Parkinson’s disease brain regions. J Neurochem. 1995;65:710-716.
94. Bartzokis G, et al. MRI evaluation of brain iron in earlier- and later-onset Parkinson’s disease and normal subjects. Magn Reson Imaging. 1999;17:213-222.
95. Curtis AR, et al. Mutation in the gene encoding ferritin light polypeptide causes dominant adult-onset basal ganglia disease. Nat Genet. 2001;28:350-354.
96. Anderson GJ, et al. Relationship between intestinal iron-transporter expression, hepatic hepcidin levels and the control of iron absorption. Biochem Soc Trans. 2002;30:724-726.
97. Clardy S, et al. Is ferroportin-hepcidin signalling altered in restless legs syndrome? J Neurol Sci 2006; 247:173-179.
98. Wu LJ, et al. Expression of the iron transporter ferroportin in synaptic vesicles and the blood-brain barrier. Brain Res. 2004;1001:108-117.
99. Jeong SY, David S. Glycosylphosphatidylinositol-anchored ceruloplasmin is required for iron efflux from cells in the central nervous system. J Biol Chem. 2003;278:27144-27148.