Chapter 1 The Elements of Cardiac Imaging
Cardiovascular imaging is different from that for all other organs because the dimension of time has to be included in the subsecond acquisition and analysis of images. The chest film remains the entry-level examination for most cardiac problems. Although daunting economic and scheduling constraints remain, the cross-sectional methods—echocardiography, computed tomography (CT), and magnetic resonance imaging (MRI)—are becoming the primary imaging choices to diagnose cardiac diseases because the millisecond temporal resolution and the millimeter spacial resolution can follow the beating heart and the moving blood.
THE CHEST FILM
The chest film is often the first imaging procedure performed when heart disease is suspected, and more commonly, it is used to assess and follow the severity of cardiac disease. Because the chest film forms images by projection, this technique detects only those cardiopulmonary abnormalities that change the shape of the heart, mediastinum, and lungs and those that alter the structure of the pulmonary vasculature. Clinically silent heart disease may also be detected on a chest film taken for other reasons. Extracardial structures, particularly in the abdomen and the thoracic cage, may produce additional clues indicating heart disease. Calcification in the aortic valve, for example, identifies the abnormal structure and directs the differential diagnosis toward a particular pathologic lesion (Box 1-1).
CARDIAC SHAPE AND SIZE
Age and Its Visible Effects
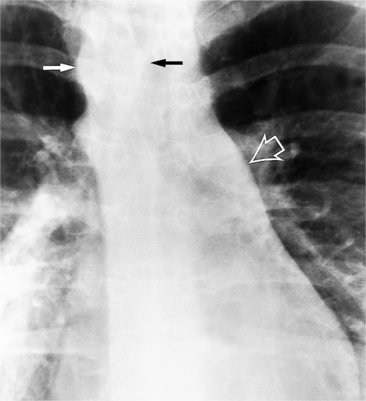
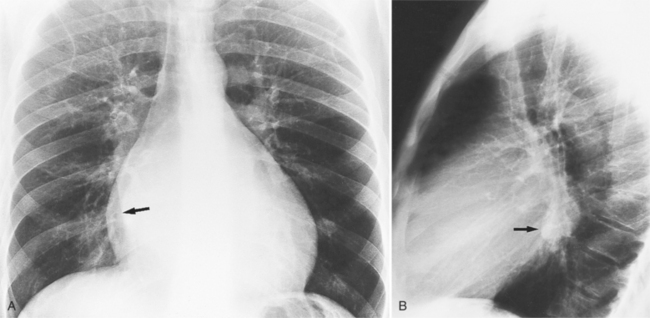
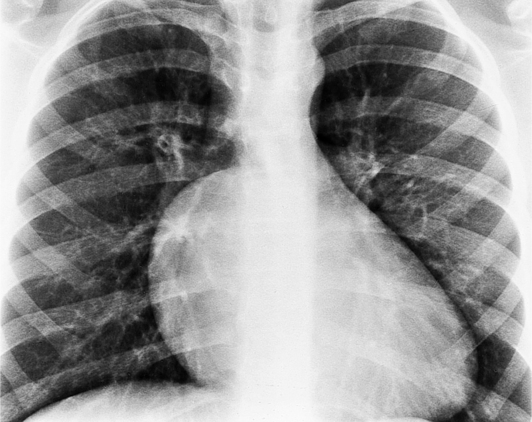
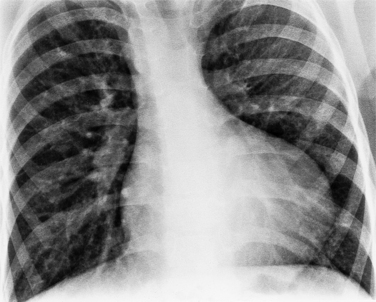
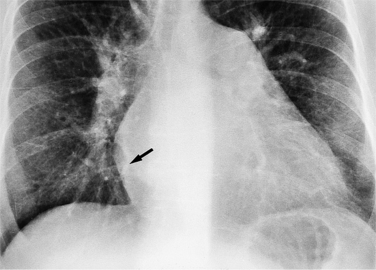
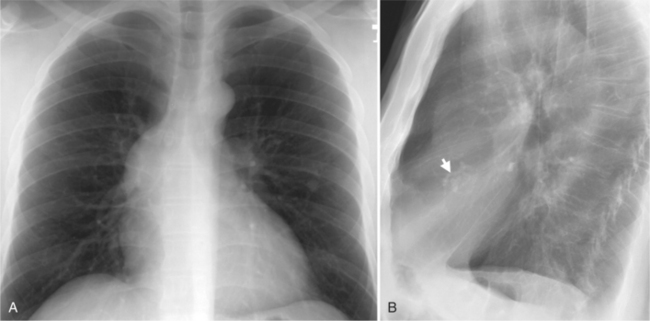
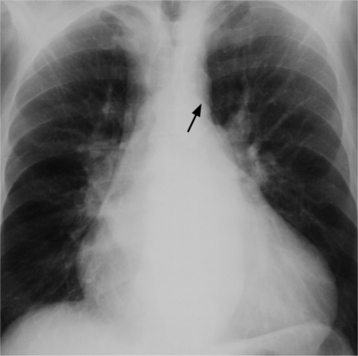
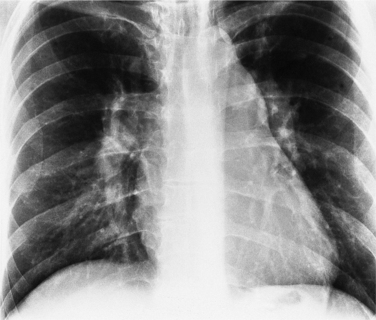
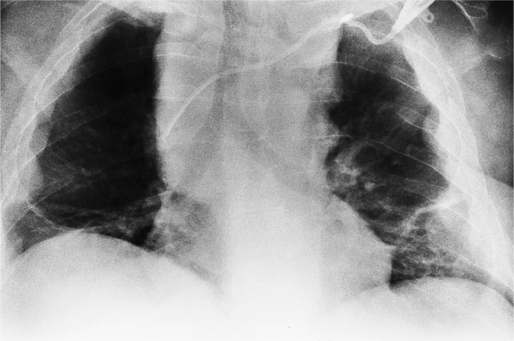
In the child and adolescent, the bronchopulmonary markings become more distinguishable, and the thymic shadow regresses and becomes inapparent so the aortic arch and pulmonary trunk can be seen. A convex pulmonary trunk in girls in their late teens may suggest pulmonary artery enlargement, but in the absence of a heart murmur this is usually a normal variant (Fig. 1-1). However, an electrocardiogram (ECG) may be necessary to exclude entities such as pulmonary stenosis and left-to-right shunts. The “double density” of the pulmonary veins may mimic an enlarged left atrium (Fig. 1-2), but a large left atrium has a rounder curve and extends medially above the diaphragm.
Evaluation of Heart Size
Cardiothoracic Ratio
The determination of heart size, both subjectively and quantitatively, has been assessed from the chest film for more than 70 years. Then Danzer described the cardiothoracic ratio, which is still one of the most common measurements of overall heart size. This ratio was constructed to measure left ventricular dilatation. Because it measures the transverse heart diameter, the cardiothoracic ratio is usually normal when either the left atrium or the right ventricle is moderately enlarged because neither of these two chambers is reflected in the transverse dimension. The left atrium and right ventricle become border-forming when they are severely enlarged. Rose and colleagues noted that for the cardiothoracic ratio to reliably detect enlargement of the left ventricle (Table 1-1), changes in left ventricular volume up to 66% in excess of normal are needed.
|
|

Modified with permission from Rose CP, Stolberg HO: The limited utility of the plain chest film in the assessment of left ventricular structure and function, Invest Radiol 17:139-144, 1982.
Measurements of the heart and mediastinum are dramatically affected by the height of the diaphragm and the intrathoracic pressure and less so by the body position and status of the intravascular volume (Table 1-2).
TABLE 1-2 Typical variations of heart and mediastinum measurements on the chest film
| Circumstance | Variation |
|---|---|
| In expiration | Transverse diameter of heart and mediastinum widens Indistinct appearance of pulmonary hilum can be identical to that seen with pulmonary edema |
| In recumbent position | Heart is broader Lung volumes are lower Upper lobe arteries and veins appear more distended |
| On posteroanterior film | Change in heart width between systole and diastole is typically less than 1 cm |
| On right anterior oblique film | Heart size does not change between systole and diastole Left ventricular apex appears akinetic |
| On left anterior oblique film | Posterolateral wall motion is typically more than 1 cm |
Chamber Enlargement
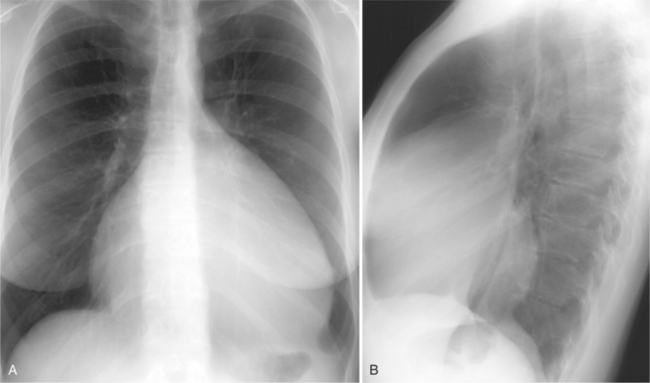
Each chamber basically enlarges directly outward from its normal position. Except for the right ventricle, isolated chamber enlargement does not affect the position of the heart in the mediastinum or the identification of other chamber enlargement. When the right ventricle enlarges, it contacts the sternum and rotates the heart posteriorly and in a clockwise direction as viewed from below. Frequently in right ventricular enlargement, the normal left ventricle may falsely appear enlarged on both the frontal and lateral films because the entire heart is displaced posteriorly. If the right ventricle is dilated, the diagnosis of left ventricular enlargement may not be possible in the chest film (Dinsmore principle). Therefore, you should assess the size of the right ventricle on the lateral film before judging the left ventricle (Figure 1-3, Box 1-2).
Box 1-2 Right atrial enlargement on chest film
Right Atrium
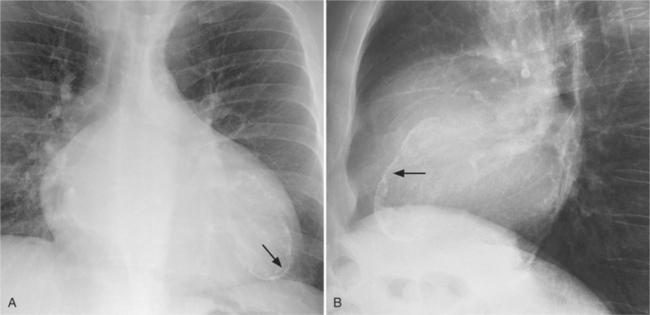
In the frontal view, the right atrium is visible because of its border with the right middle lobe (see Box 1-2). Neither subtle nor moderate enlargement can be recognized accurately because there is moderate variability of its shape in normal subjects, and in expiration the right atrium becomes rounder and moves to the right (Figures 1-4, 1-5).
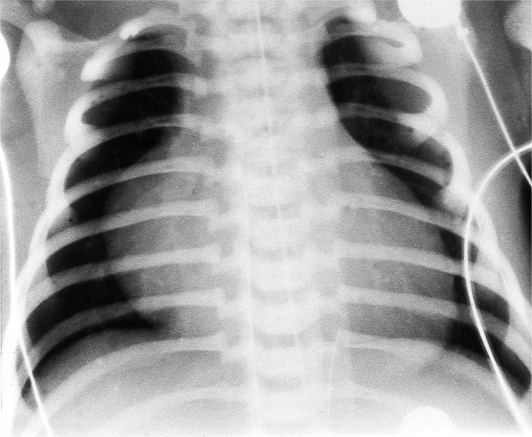
The right atrium and the other three chambers enlarge because of increased pressure, increased blood volume, or a wall abnormality. Common causes of right atrial enlargement are tricuspid stenosis and regurgitation, atrial septal defect, atrial fibrillation, and dilated cardiomyopathy. Ebstein anomaly may have all of these features. In pulmonary atresia, the right atrium dilates in direct proportion to the amount of tricuspid regurgitation (Fig. 1-6).
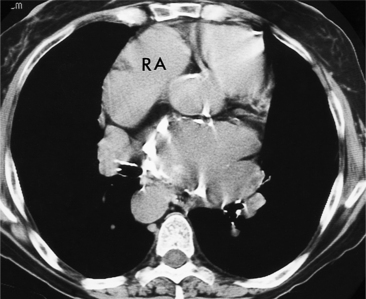
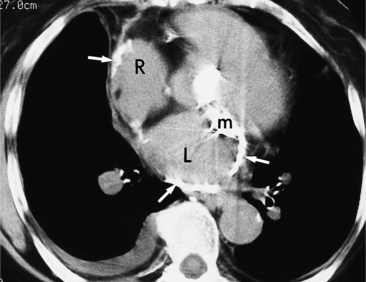
All the signs of right heart enlargement that are implied on the chest film are directly visible on the CT scan. The right atrium and ventricle touch the anterior chest wall and rotate the heart posteriorly. The right coronary artery adjacent to the right atrial appendage lies to the left of the sternum (Fig. 1-7).
Right Ventricle
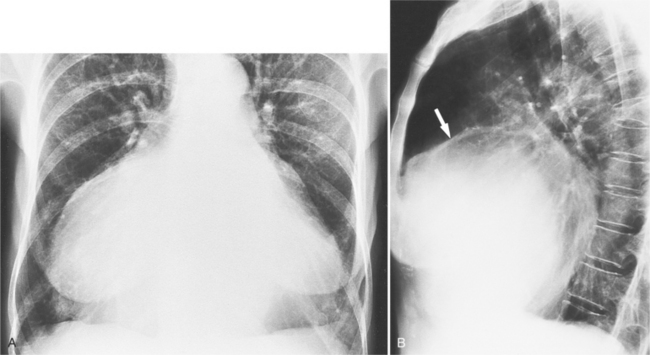
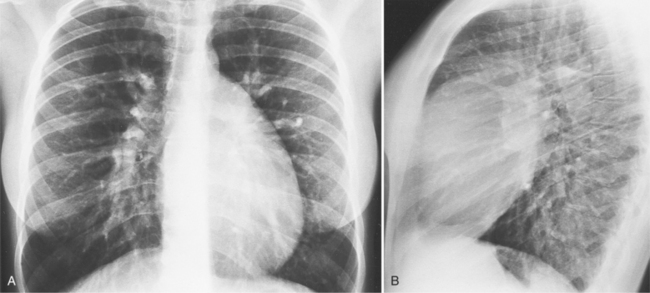
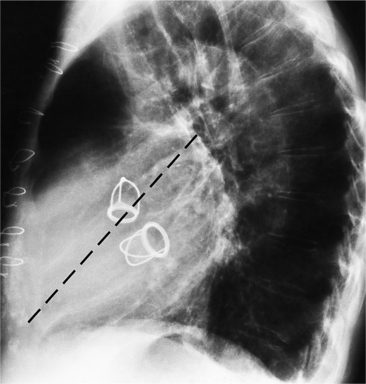
On the lateral view, the normal right ventricle does not touch more than one fourth of the lower portion of the sternum as measured by the distance from the sterno diaphragmatic angle to the point at which the trachea meets the sternum. One sign of right ventricular enlargement is the filling in of more than one third of the retrosternal space. On the frontal view, the normal right ventricle is not visible, and only extreme dilatation causes recognizable signs because the heart rotates clockwise as it dilates and pushes against the sternum. In this instance, the usual contour of the left atrial appendage is rotated posteriorly and is no longer part of the left side of the mediastinum. You can recognize this sign by an unusually long convex curvature extending inferiorly from the main pulmonary artery (Fig. 1-8). In extreme instances the entire left heart border may be the right ventricle (Box 1-3).
Box 1-3 Right ventricular enlargement on chest film
Frontal view (the right ventricle is usually not visible on the frontal view)
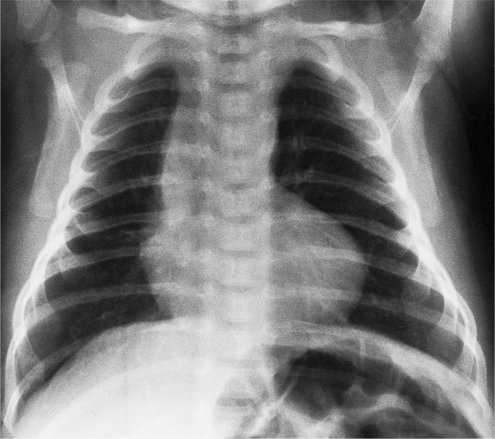
In tetralogy of Fallot when the fat pad is absent in the left cardiophrenic angle, the heart may have an uplifted cardiac apex (Fig. 1-9), which has been called the “boot-shaped heart” or the coeur en sabot. The right ventricle is not enlarged but may have hypertrophy.
Left Atrium
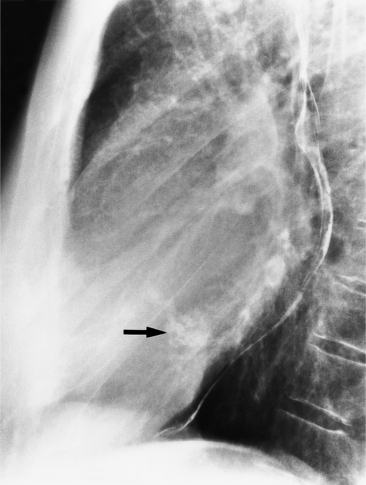
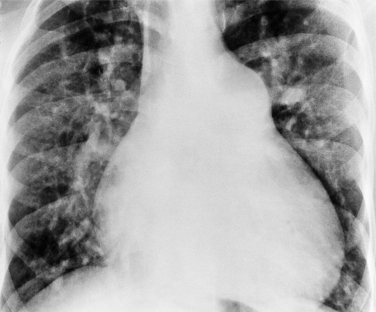
There are many clues to left atrial enlargement on the frontal and lateral chest film. One of the earliest signs of slight enlargement is the appearance of the double density, which is the right side of the left atrium as it pushes into the adjacent lung. Because a prominent pulmonary vein or varix may also cause a vertical double density, the double density should begin to curve inferiorly (Fig. 1-10). In extreme cases, the left atrium may enlarge to the right side and touch the right thoracic wall (Fig. 1-11). The etiology of this “giant left atrium” is rheumatic heart disease, mainly from mitral regurgitation.
A convex left atrial appendage on the frontal view is abnormal and usually reflects prior rheumatic heart disease. In pure mitral regurgitation, the body of the left atrium, not the appendage, enlarges.
The indirect signs visible only when the left atrium is dilated at least moderately are highlighted in Box 1-4 and Figures 1-12 and 1-13.
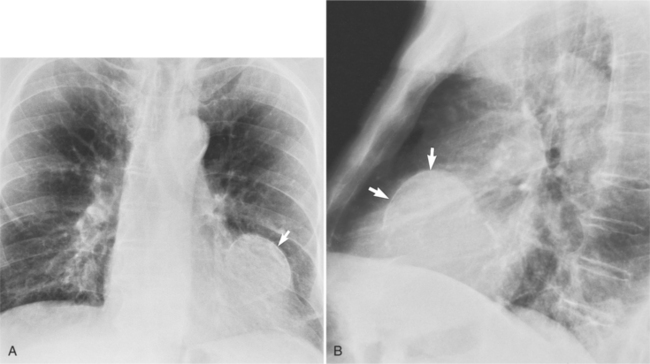
Common acquired causes of left atrial enlargement are mitral stenosis or regurgitation, left ventricular failure, and left atrial myxoma. Congenital causes include ventricular septal defects, patent ductus arteriosus, and the hypoplastic left heart complex. When atrial fibrillation occurs, the left atrial volume may increase by 20%.
Left Ventricle
Left ventricular enlargement exists if the left heart border is displaced leftward, inferiorly, or posteriorly. Inferior displacement may invert the diaphragm and cause this border to appear in the gastric air bubble. The chest film cannot reliably distinguish between left ventricular dilatation and hypertrophy. With hypertrophy, the apex has a pronounced rounding and a decrease in its radius of curvature. The elderly normal heart also has this shape. When massive hypertrophy is present, the left ventricular shape is large and appears similar to one that is only dilated (Box 1-5).
Common causes of left ventricular enlargement can be grouped into three categories: pressure overload (hypertension, aortic stenosis; Fig. 1-14); volume overload (aortic or mitral regurgitation, ventricular septal defects; Fig. 1-15); and wall abnormalities (left ventricular aneurysm, hypertrophic cardiomyopathy; Fig. 1-16).
CARDIAC AND PERICARDIAL CALCIFICATIONS
Aortic Valve Calcification
Distinguishing Characteristics
Mitral Annulus Calcification
Distinguishing Patterns
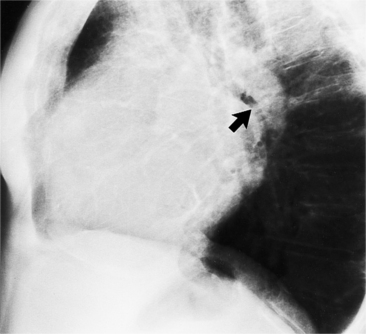
The mitral valve ring may calcify in individuals over age 60. The incidence is four times higher in women. The calcium begins to form in or below the mitral annulus at the junction between the ventricular myocardium and the posterior mitral leaflet. More severe degrees of calcification will form a pattern resembling the letter J, the letter O, or a reversed letter C (Figure 1-19).
Clinical Significance
Aortic stenosis and hypertension have a higher incidence of mitral annulus calcification, possibly because of increased strain exerted on the mitral valve apparatus from the left ventricular pressure overload. For the same reason, the tricuspid annulus rarely may calcify when right ventricular pressures have been chronically increased (Fig. 1-20).
Mitral Valve Calcification
Myocardial Calcification
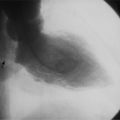
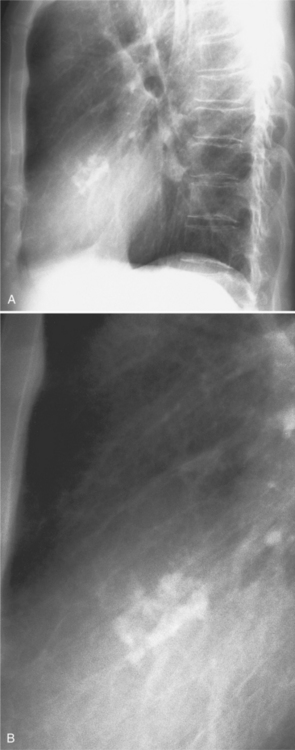
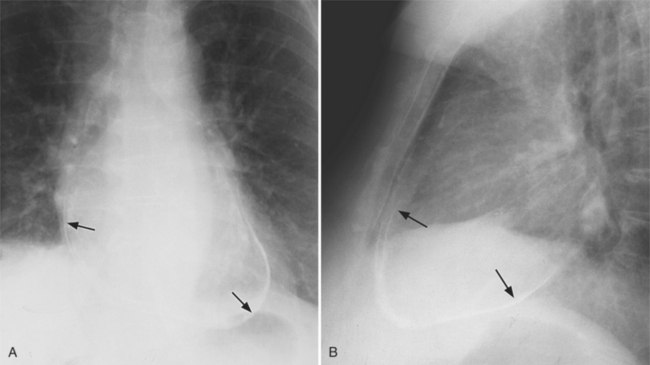
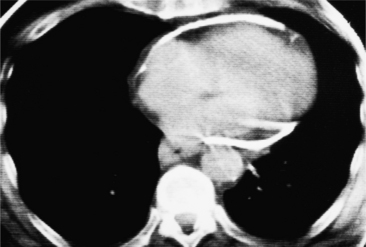
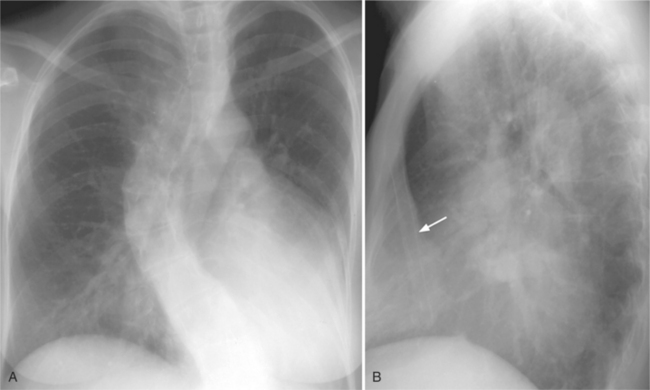
A myocardial infarction can later calcify if it evolves to form either a scar or an aneurysm. The thin curvilinear calcification is easily recognized as it projects within the left ventricular wall and inside the heart silhouette (Fig. 1-22).
Left Atrial Calcification
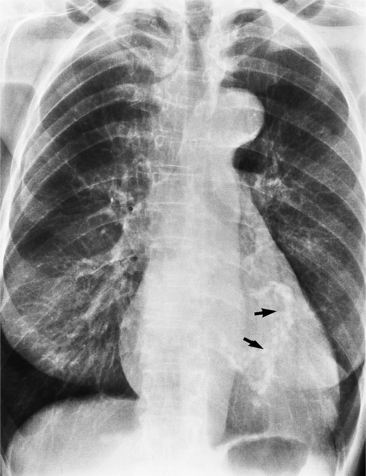
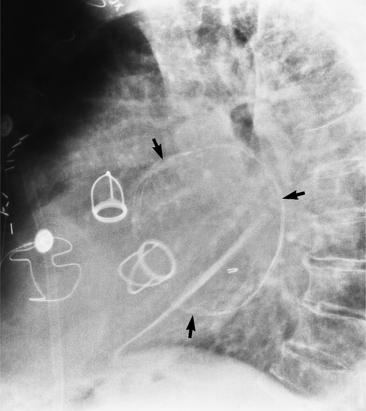
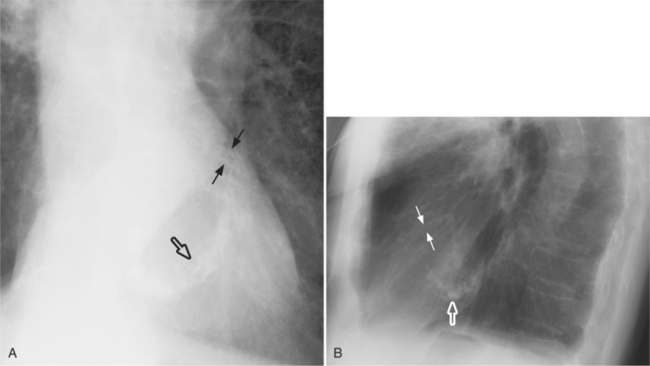
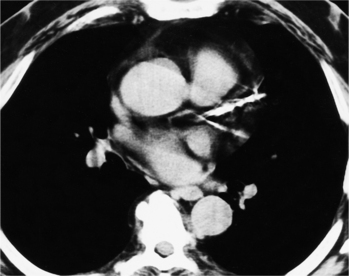
Left atrial calcification is the sequela of rheumatic endocarditis. The appearance usually is curvilinear around the body of the left atrium (Fig. 1-23). The interatrial septum does not calcify, but the appendage does, and it has a shaggy nodular appearance. The calcium deposits may be shaggy but usually occur in an “eggshell” pattern (Fig. 1-24). Left atrial wall calcification indicates that the patient is in atrial fibrillation. Mural thrombi over the calcium are frequently present and may embolize into the systemic circuit. Tumors in the left atrium, such as myxomas, calcify with an incidence of less than 5%.
Pericardial Calcification
Radiologic Appearance
Use of Computed Tomography
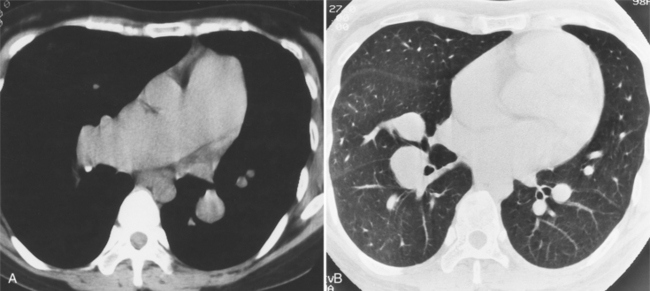
In patients with constrictive pericarditis, 50% have calcium visible on the chest film, and most have calcium on the CT scan. Because pressure tracings from the ventricles may be identical in both restrictive cardiomyopathy and constrictive pericarditis, a CT scan that shows calcium in a thickened pericardium in a patient with elevated filling pressure is diagnostic of constrictive pericarditis (Fig. 1-26).
Coronary Calcification
Appearance
Coronary calcification represents atherosclerotic changes in the intima and in the internal elastic membrane of the coronary arteries. The left anterior descending artery is the most frequently calcified site, followed by the left circumflex artery, then the right coronary artery (Fig. 1-27). The incidence of coronary calcification increases with age and may be part of the normal aging process. Generally, in patients under age 60, there is a strong correlation between calcification and severity of atherosclerosis; the association is not as strong in older patients. Coronary calcification is influenced by risk factors such as increased cholesterol and lipids, smoking, hypertension, and a family history of coronary disease. There is correlation between calcification and the severity of coronary stenosis; however, some severe stenoses may not be calcified, and some heavy calcifications may not denote stenotic arteries.
Association with Stenosis
A number of investigators have attempted to develop a test for asymptomatic coronary artery disease by screening for coronary calcification. Coronary calcium is frequently seen on routine multislice chest CT (Fig. 1-28). Ultrafast or electron-beam CT detects calcium in significant coronary artery stenoses with a sensitivity of about 95% and a specificity of 50%. Multislice coronary CT angiography has a similar detection rate of calcified coronary plaques but also shows the soft or noncalcified component of the plaque (see Chapter 7).
PULMONARY VASCULATURE
Determining the Vascular Pattern
Segmental Analysis
Upper and Lower Lung Zones and Bronchoarterial Ratios
In the normal erect person, the upper lung zone vessels are smaller in width than those in the lung bases. The lung apex is barely perfused, whereas gravitational differences cause an increasing distribution of blood flow toward the lung base. This gravitational effect can be noticed on upright chest films and on supine or prone CT scans, in which the gradient of blood vessel size then increases to the most dependent part of the lungs. In the normal subject, the pulmonary artery in the hilum is roughly the same size as its adjacent bronchus. In the upper lung zones, the pulmonary artery diameter in an erect film is 85% of the adjacent bronchial diameter. In the lower lung zones, the pulmonary arteries are one-third bigger than the nearby bronchus.
Diminished Vasculature
In many patients with cyanotic congenital heart disease and decreased pulmonary blood flow, the pulmonary vasculature appears normal on the chest film. Despite this lack of sensitivity, there are several clues on the chest film that indicate abnormally diminished flow (Box 1-6).
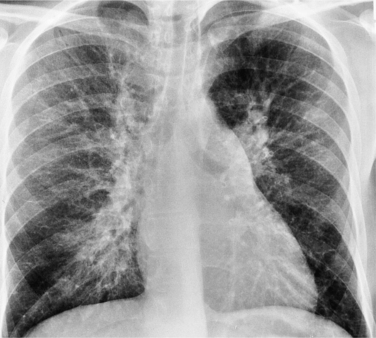
Using a segmental analysis approach, examine the central, hilar, and peripheral pulmonary arteries and veins. In the frontal view, a concave main pulmonary artery segment is the most reliable indicator of small main and central pulmonary arteries (Fig. 1-29). There are diminished bronchovascular markings in the hilum, and the diameters of the pulmonary arteries are smaller than their adjacent bronchus. The peripheral pulmonary arteries and veins are quite small. In infants, separate arteries may be difficult to see individually, and the lung therefore appears hyperlucent.
Decreased blood flow and volume are easier to recognize when only a lobe is involved so that the adjacent lung can be used as a standard. Peripheral pulmonary emboli, congenital branch stenosis, Takayasu disease, and destruction of a lung by previous pneumonia, abscess, or bulla all may have caused decreased pulmonary vasculature in only a single lobe. Pulmonary stenosis with any malformation that allows a right-to-left cardiac shunt can cause diminished flow to the lungs. For example, patients with tetralogy of Fallot have decreased pulmonary vasculature because of the pulmonary stenosis and right-to-left shunt across the ventricular septal defect. Box 1-7 gives examples of decreased pulmonary vasculature.
High-Output States
Flow Ratios
High-output states can be separated into those that have increased blood flow in both the pulmonary and the systemic circulation and those that have increased pulmonary circulation only. The chest film usually does not detect increased pulmonary flow until the flow ratio (Qp/Qs) is at least 2 (i.e., the pulmonary flow is twice that in the aorta). Increased cardiac output from both the right and left ventricles occurs in metabolic and endocrine diseases, in arteriovenous fistulas and malformations, and in aortic regurgitation.
Contributing Diseases, Lesions, and Defects
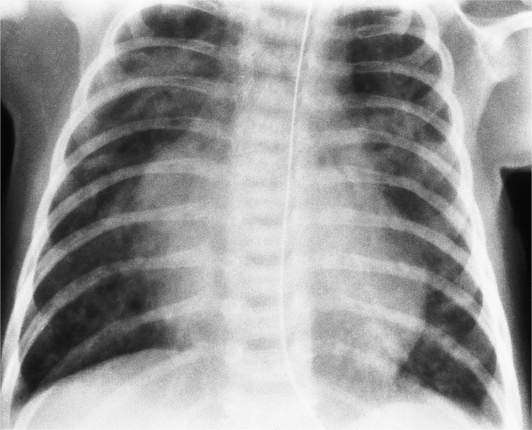
Thyrotoxicosis (Fig. 1-30), beriberi, and pheochromocytoma are diseases that either increase the overall metabolic rate of the body or have a specific effect on the heart. They increase its rate and stroke volume. Extra cardial shunts, such as patent ductus arteriosus, aortopulmonary window, and arteriovenous fistulas and malformations either in the lungs or in another part of the body, provide a lower-resistance parallel circuit to the systemic capillary bed for the blood to return to the heart. (The electrical analogy is a short circuit of a battery, which causes a high current to flow across its terminals.) In Paget disease there are numerous arteriolar-venous channels within the bone. In aortic regurgitation, blood flow that is regurgitated from the aorta into the left ventricle is added to the forward output to produce an augmented forward flow in the aorta. Because the lungs are in a series circuit with the aorta, the output is also increased. Intracardiac shunts have a normal aortic size and large main, hilar, and peripheral pulmonary arteries. In babies, high-output states often result in an element of pulmonary edema (Fig. 1-31). A large pulmonary vasculature is also a feature of certain cyanotic congenital heart diseases (Fig. 1-32).
A convex main pulmonary artery segment suggesting a high-output state may be present in healthy individuals. Highly trained endurance athletes, such as marathon runners, women in the third trimester of pregnancy, and occasionally teenage girls frequently show mild enlargement of the main pulmonary artery (see Box 1-7).
Pulmonary Artery Hypertension
Pressure Measurements and Patterns of Pulmonary Vasculature
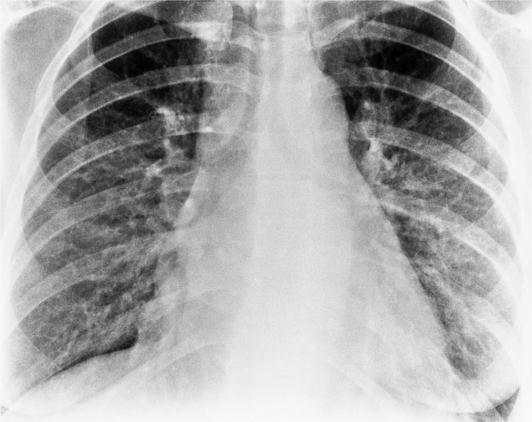
If the heart is structurally intact, the earliest sign of pulmonary artery hypertension is a convex main pulmonary artery segment. Severe chronic pulmonary artery hypertension also dilates the hilar branches but, unlike a left-to-right shunt, not the peripheral arteries within the lungs (Fig. 1-33). The gradient of small vessels at the apex and large vessels at the base is preserved.
Eisenmenger Syndrome
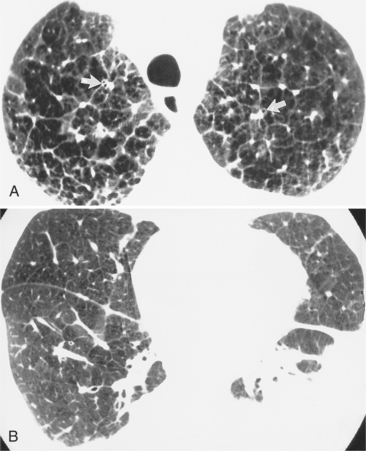
In adults with Eisenmenger syndrome the pulmonary vasculature is unusually striking because of the central arterial enlargement. The arteries dilate longitudinally, forming a serpentine course (Fig. 1-34). The rapid taper of the large aneurysmal hilar pulmonary arteries to the periphery looks like a “pruned tree.” This phrase is correct angiographically and pathologically: There are fewer arterial side branches than in a normal arterial tree. However, the reduced number of side branches can not be seen on a chest film. The size of the pulmonary arteries in relation to their adjacent bronchus is measurable on CT (Fig. 1-35).
Box 1-8 lists the common causes of pulmonary artery hypertension.
Pulmonary Venous Hypertension
Fluid and Water Exchange
The lung removes excess fluid mainly by a network of pulmonary lymphatics. The mediastinal and pulmonary lymphatics serve as the major channel for fluid removal. Extensive lymphatic channels exist near the alveolar ducts and drain centrally adjacent to respiratory bronchioles, to the interstitium about the minor and major bronchi, and to the major mediastinal lymph nodes. The cortex of the lung has its own lymphatic supply, which drains the peripheral portion of the lung into pleural lymphatics. This anatomic arrangement provides a pathologic correlation that explains peribronchial cuffing and hilar haze on the chest film as two signs of pulmonary edema. When there is significant accumulation of lung water, the rate of lymph flow can increase tenfold before there is significant pulmonary edema. The excess lung fluid in the pulmonary interstitium is visible in patients with transplanted lungs because the lymphatics have been cut, blocking the major pathway of fluid transport from the lung.
Radiologic Appearance
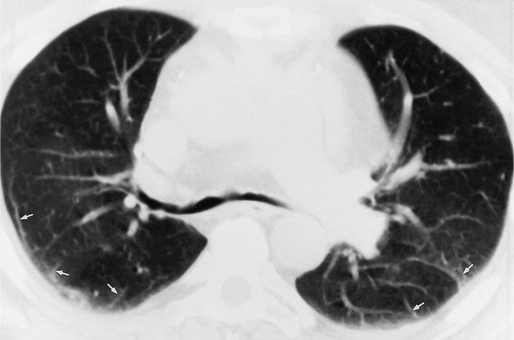
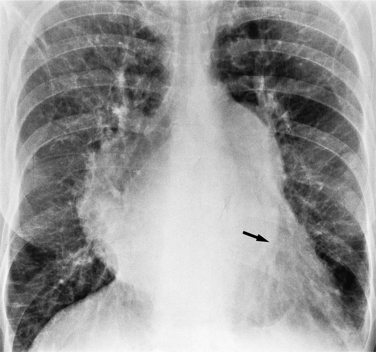
As left atrial pressure rises, the hilar and lower lobe vasculature becomes indistinct and the edges are less sharp. Fluid begins to accumulate in the interstitium. The number of visible side branches decreases, perhaps because of a silhouette sign as water in the interstitium partially obscures the adjacent vessel wall. In response to the higher venous pressure, the upper lobe vessels handle the blood that is meeting increasing resistance as it enters the left atrium. You will recognize this increased blood flow to the upper lobes by the increased visibility of numerous upper lobe arteries and veins (Fig. 1-37). The width of these structures, normally 1 to 2 mm in the middle part of the lung, increases to 2 to 4 mm. The redistribution now is reflected by an increase in both the size and number of vessels in the apices. The development of pulmonary venous hypertension is a continuum in the gradient of vessel size from apex to base. The normal distribution of small apical and large basilar vessels becomes balanced with equal size in both locations; at higher pressures this reverses and the upper lobe vessels are larger. A CT scan of a supine person with pulmonary venous hypertension will show large anterior vessels and smaller posterior vessels. Roughly the same branching generation from the main pulmonary artery should be used when comparing the anterior and posterior arteries (Fig. 1-38).
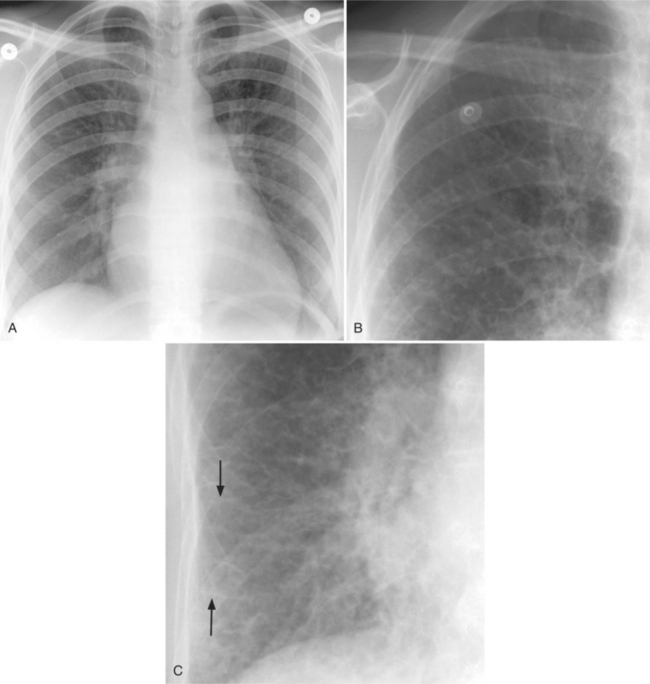
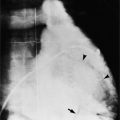
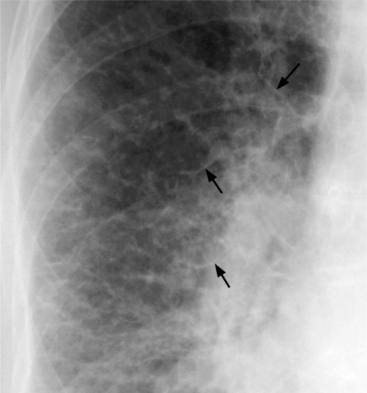
There are other signs of interstitial lung water that help confirm the diagnosis of pulmonary venous hypertension. In the cortex of the lung, Kerley B lines appear and represent thickening of the interlobular septum (Fig. 1-39). Kerley A lines—3- to 5-cm lines about 1 mm thick and extending from the central part of the lung—represent distended lymphatics (Fig. 1-40). The perihilar haze probably represents a combination of distended lymphatics, alveolar transudate, and interstitial thickening in lung parenchyma that lies anterior and posterior to the hilum. Thickening of the interlobular fissures and accumulation of subpleural fluid represent excess fluid and distention of the interstitial space and lymphatics. The end-on appearance of the bronchus and its adjacent pulmonary artery also changes in pulmonary venous hypertension. The bronchial wall becomes thickened and less distinct (“cuffed”) and the pulmonary artery dilates (Fig. 1-41).
As interstitial edema proceeds to alveolar edema, roseate opacities begin to appear in the perihilar region and spread peripherally to form a butterfly pattern. This does not involve the lung cortex except in extreme cases. When the opacities involve a significant part of the lung cortex and its adjacent pleura, other disease processes, such as pneumonia and adult respiratory distress syndrome, are more likely explanations for the cortical distribution. The edema caused by a cardiac disease typically is symmetrical and perihilar and is more severe in the lung bases than in the apices. The distribution of cardiac pulmonary edema can be quite variable and asymmetric but is never completely unilateral. Asymmetric pulmonary edema is usually more severe in the right lung. These patients are often lying with their right side down so the distribution of pulmonary edema often corresponds to the gravity gradient. Patients who develop mitral regurgitation during myocardial infarction rarely may also have pulmonary edema, predominantly in the right upper lobe. The jet of mitral regurgitation is directed into the right upper pulmonary vein and augments the forces in that lung that promote fluid retention.
The width of the vascular pedicle is an indirect but reliable sign of increased intravascular fluid. The width is measured just above the aortic arch from the left subclavian artery on the left side to the superior vena cava on the right side (Fig. 1-42). Dilatation of this pedicle and the adjacent azygos vein is increased in overhydration, renal failure, and chronic cardiac failure. In contrast, the vascular pedicle is usually unchanged in capillary permeability edema.
There is only a fair correlation between redistribution of blood flow with dilatation of the upper lobe vessels and pulmonary capillary pressure between 12 and 20 mm Hg. Because the osmotic pressure of plasma protein is 25 mm Hg, it is reasonable to expect alveolar edema when the pulmonary capillary wedge pressure exceeds this number; however, alveolar opacities can be seen with pressures of only 20 mm Hg. Pulmonary edema may be visible within a few minutes after the onset of acute mitral regurgitation or left heart failure. As the pulmonary edema resolves, there may be a therapeutic lag during which the wedge pressure returns to normal while the pulmonary edema persists. This lag may exist from several hours to several days. Although it is common to compare interpretation of the pulmonary edema on the chest film with the pulmonary capillary wedge pressure, these two observations measure different parameters and therefore are not appropriate standards of comparison. The pulmonary capillary wedge pressure measures the instantaneous pulmonary venous and left atrial pressures. The radiologic signs of pulmonary edema are an integrated history of the production and resorption of lung water. Particularly in the resorption phase, these signs more accurately mirror the amount of lung water present rather than the pulmonary venous pressure. A patient with an acute myocardial infarction that has a chest film showing pulmonary edema and a normal pulmonary wedge pressure has stiff and noncompliant lungs because of the unresorbed interstitial fluid.
Box 1-9 lists the cardiac causes of pulmonary edema.
SKELETAL ABNORMALITIES IN HEART DISEASE
Cardiac Surgery
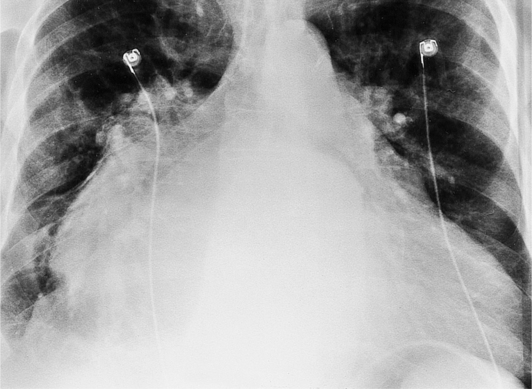
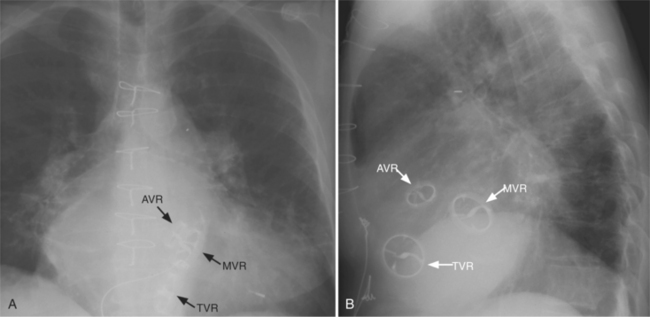
The appearance of the thoracic cage can indicate previous surgery and frequently suggests certain types of heart disease. Most cardiac surgery begins with a median sternotomy because it gives excellent access to the heart’s anterior structures and to the ascending aorta. A sternotomy also causes less postoperative pain than a posterior thoracotomy. After many types of cardiac surgery, there may be sternal wire sutures, mediastinal clips, epicardial pacing wires, and umbrella closure devices (Fig. 1-43). A myriad of vascular clips following the course of the left internal mammary artery indicates a graft to the left anterior descending or diagonal arteries. Most prosthetic mitral and aortic valve replacements are easily seen (Fig. 1-44), except for the St Jude valve, whose ring is usually not visible. The leaflets of this valve appear as one or two straight lines and are seen in about 30% of chest films when the leaflets are tangential to the x-ray beam. A posterior thoracotomy can be identified by a surgical absence of the fifth rib or by uneven spacing between the fourth, fifth, and sixth ribs. Left posterior thoracotomies are performed to repair a coarctation of the aorta, to ligate a patent ductus arteriosus, to repair a vascular ring, and to create a left Blalock-Taussig shunt between the left subclavian artery and the left pulmonary artery. Right posterior thoracotomies are performed to create a right Blalock-Taussig shunt or to approach a coarctation in the right aortic arch.
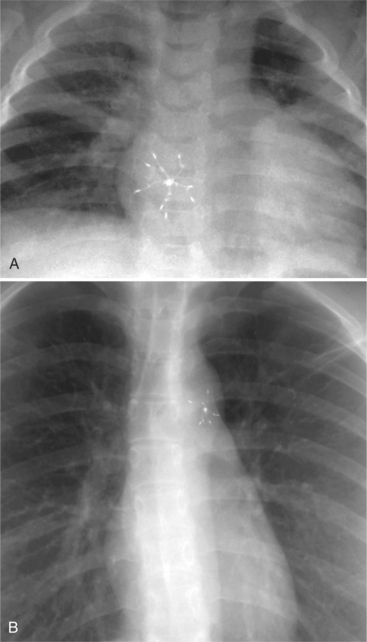
FIGURE 1-43 Umbrella closure devices. A, For an atrial septal defect. B, For a patent ductus arteriosus.
Thoracic Cage and Heart Disease
The thoracic cage also has several distinctive signs associated with heart disease. The chest film of a patient with Marfan syndrome may show a tall person with a narrow anteroposterior diameter and a pectus excavatum (Fig. 1-45). However, a normal variation is a narrow posteroanterior diameter of the thorax, which has a structurally normal heart that is rotated to the left side. The lateral chest film then shows a straight thoracic spine lacking the normal kyphosis and diminished retrosternal and retrocardiac spaces. In the adult, when the distance between the sternum and the spine is less than 10 cm, the heart and mediastinum are shifted to the left side, producing an extrinsic levocardia.
Congenital Syndromes with Heart Disease
Spine abnormalities also may indicate surgery or disease. An acquired scoliosis may occur where the ribs on the side of a posterior thoracotomy have been pulled tightly together. Vertebral anomalies, such as hemivertebra and “butterfly” vertebra, are frequently associated with congenital heart disease (Fig. 1-46).
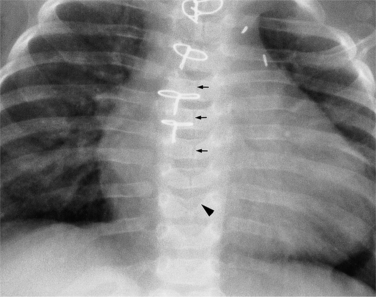
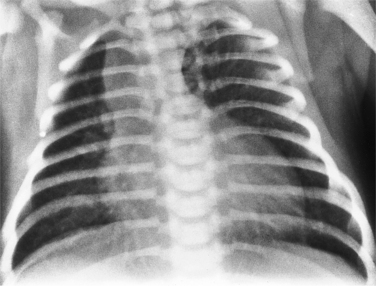
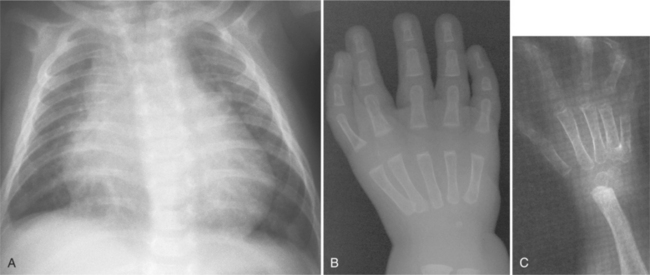
Chest radiographs of infants with trisomy 21, or Down syndrome, may be distinctive enough to diagnose not only the heart disease but also the syndrome. Of patients with trisomy 21, roughly half have atrioventricular canal defects. Conversely, of those infants who have atrioventricular canal defects, about half have trisomy 21. Other indicative chest radiographic findings include 11 pairs of ribs (Fig. 1-47) and multiple manubrial ossification centers (Fig. 1-48), both of which are more prevalent in infants with trisomy 21 than in normal newborn infants.
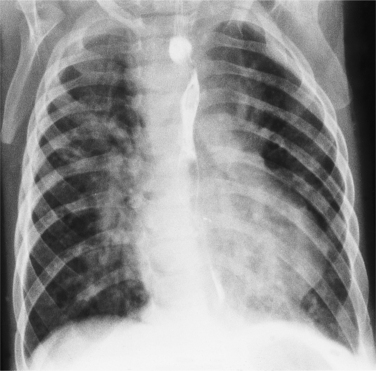
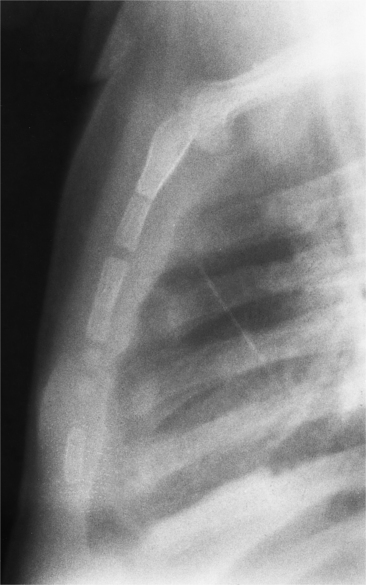
FIGURE 1-48 Down syndrome. Hypersegmentation of the sternum and multiple manubrial ossification centers.
The bony abnormalities in neurofibromatosis mimic the rib notching seen in coarctation of the aorta. The spine and ribs reflect the mesodermal dysplasia. Scoliosis, kyphosis, and distortion of numerous ribs are common. The ribs may appear notched from neurofibroma in the neurovascular groove (Fig. 1-49). The overconstricted ribs appear like ribbons with bowing and pathologic fractures. Occasionally you may see pseudoarthrosis in the clavicle; interstitial lung disease; and aneurysms of the mediastinal arteries, veins, or lymphatic system.
Patients with the Holt-Oram syndrome (heart-hand syndrome) have abnormalities in the upper limbs with congenital heart diseases such as atrial septal defect and ventricular septal defect. The upper extremity defects are usually bilateral and affect the radial ray. The thumb is almost always affected and is either absent or part of a hand complex with three phalanges, focal phocomelia, or carpal bone fusions (Fig. 1-50).
Other bone diseases associated with heart disease can be recognized on the chest film. Osteogenesis imperfecta is a disease that causes diffuse aortic ectasia, aortic regurgitation, or coarctation. The bony abnormalities include variable bone density, multiple fractures in many bones, kyphoscoliosis, and biconcave vertebra with anterior wedge deformities. Sickle cell disease and thalassemia major, which are associated with cardiomyopathy and thoracic cage abnormalities, are representative of severe anemias. In sickle cell disease, the ribs have diffuse sclerosis and a coarsened trabecular pattern; the vertebral bodies have squared-off corners. Ischemia of the central portion of the cartilaginous end plate results in a steplike depression of the vertebral end plate, and bony infarcts may be seen in the humeral heads. Thalassemia major also has large lobulated paravertebral masses of marrow hyperplasia and extramedullary hematopoiesis.
Table 1-3 lists the major syndromes associated with cardiovascular disease.
TABLE 1-3 Syndromes and metabolic disorders associated with heart disease
| Cystic fibrosis | Cor pulmonale |
| DiGeorge syndrome | Aortic arch interruption, truncus arteriosus, tetralogy of Fallot |
| Down syndrome | Endocardial cushion defect, mitral valve prolapse |
| Ellis–van Creveld syndrome | Atrial septal defect, single atrium |
| Ehlers–Danlos syndrome | Aortic aneurysms, dissection, and rupture; tortuous systemic and pulmonary arteries; congenital heart disease (valvular regurgitation and stenosis); mitral valve prolapse |
| Friedreich ataxia | Hypertrophic cardiomyopathy |
| Homocystinuria | Marfan feature, coronary thrombosis |
| Mucopolysaccharidoses | Coronary artery disease, aortic and mitral stenosis and regurgitation |
| Osteogenesis imperfecta | Aortic regurgitation, aortic aneurysm |
| Progeria | Accelerated arteriosclerosis, hypertension |
| Sickle cell anemia | Cardiomyopathy, myocardial infarct, pulmonary infarct, cor pulmonale |
| Holt–Oram syndrome | Atrial septal defect, ventricular septal defect |
| Idiopathic hypertrophic subaortic stenosis | Hypertrophic cardiomyopathy, subaortic stenosis |
| Heterotaxy | Polysplenia or asplenia and congenital heart disease with anomalies of situs and symmetry |
| Ivemark syndrome | Asplenia and congenital heart disease with anomalies of situs and right-sided symmetry |
| Kartagener syndrome | Situs inversus with dextrocardia and bronchiectasis |
| Marfan syndrome | Aortic aneurysm or aortic dissection; aortic, mitral, and tricuspid valve prolapse with regurgitation; mitral annular calcification in young adults |
| Neurofibromatosis | Aortic and pulmonary stenosis, pheochromocytoma with hypertension, coarctation, aortic aneurysm |
| Turner syndrome | Coarctation, aortic stenosis, atrial septal defect, pulmonary stenosis, aortic dissection |
| Noonan (male Turner) syndrome | Pulmonary valve and peripheral stenosis, atrial septal defect, idiopathic hypertrophic subaortic stenosis, ventricular septal defect, patent ductus arteriosus |
| Rubella | Peripheral and valvular pulmonary stenosis, patent ductus arteriosus, hypoplasia of the aorta, coarctation, atrial septal defect, ventricular septal defect |
| Treacher Collins syndrome | Atrial septal defect, patent ductus arteriosus, ventricular septal defect |
| Tuberous sclerosis | Myocardial rhabdomyoma |
| Williams syndrome | Supravalvular aortic stenosis, peripheral pulmonary stenosis |
Data from Taybi H, Lachman RS: Radiology of syndromes, metabolic disorders, and skeletal dysplasias, ed 4, St Louis, 1996, Mosby-Year Book.
THE CORONARY SINUS AND THE LEFT SUPERIOR VENA CAVA
Coronary Sinus
Anatomy and Relation to the Left Superior Vena Cava
The coronary sinus enters the right atrium anterior to the origin of the inferior vena cava. The eustachian valve of the inferior vena cava and the thebesian valve of the coronary sinus join to form a ridge of tissue between them. The coronary sinus extends behind the heart and becomes the great cardiac vein in the left atrioventricular groove. When a left superior vena cava is present, it joins the great cardiac vein about 2 cm from the right atrium to continue as the coronary sinus.
Location from Catheter Position
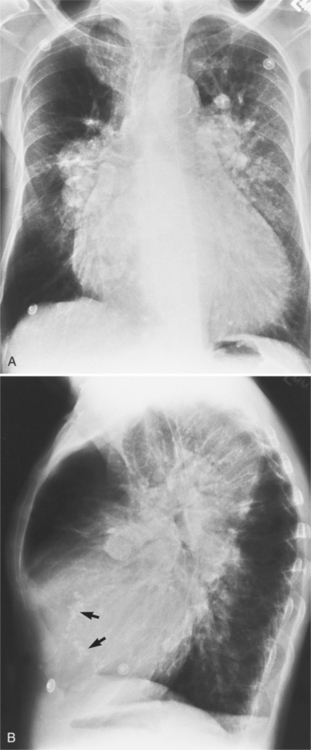
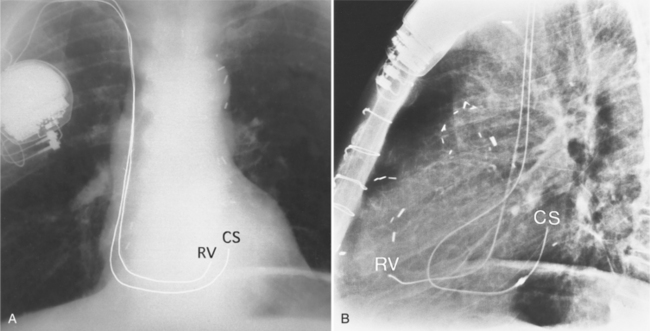
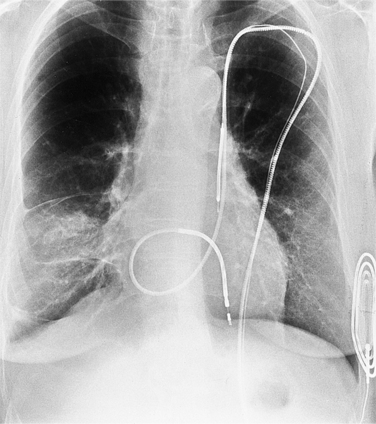
On the frontal chest film, a catheter ending in the coronary sinus usually cannot be distinguished from one ending in the body of the right ventricle. For this reason, you should use a lateral and a frontal view when placing a catheter or pacing wire into the right ventricle. A power injection suitable for right ventriculography has enough force to rupture the coronary sinus into the pericardium. A lateral view identifies the posteriorly placed coronary sinus line from the right ventricular one (Fig. 1-51).
Left Superior Vena Cava
Mediastinal Position
A persistent left superior vena cava is a relatively common venous anomaly that usually connects to the right atrium. Rarely, it may connect to the left atrium and is then associated with the heterotaxy syndrome. The left superior vena cava begins at the junction of the left subclavian and jugular veins and descends in front of the aortic arch. It then may pass in front of the left pulmonary artery or go between the pulmonary artery and vein and connect with the left hemiazygos vein before entering the pericardium. The left superior vena cava joins with the great cardiac vein to become the coronary sinus (Fig. 1-52). Right and left superior venae cavae, as with most venous anomalies, have numerous variations. Either the right or left superior vena cava may be absent, or both may persist (Fig. 1-53). The innominate connecting vein rarely is absent.
Catheter Course
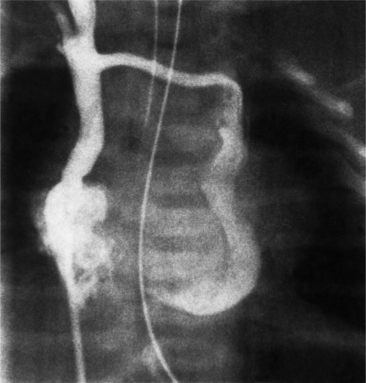
Although a left superior vena cava usually is discovered inadvertently on a chest film when a left-sided mediastinal catheter is noted, it can be used for central line placement and entry into the heart. The line from the left superior vena cava enters the right atrium and is redirected through the tricuspid valve (Fig. 1-54).
Benjamin EJ, Plehn JF, D’Agostino RB, et al. Mitral annular calcification and the risk of stroke in an elderly cohort. N Engl J Med. 1992;327:374-379.
Boxt LM. Principles of cardiac imaging. New York: Thieme, 2004.
Breen JE, Sheedy PFII, Schwartz RS, et al. Coronary artery calcification detected with ultrafast CT as indication of coronary artery disease. Radiology. 1992;185:435-439.
Chen JT T. Essentials of cardiac imaging. New York: Lippincott-Raven, 1997.
Chikos PM, Figley MM, Fisher L. Correlation between chest film and angiographic assessment of left ventricular size. AJR. 1977;128:367-373.
Comeau WJ, White PD. A critical analysis of standard methods of estimating heart size from roentgen measurements. AJR. 1942;47:665-677.
Danzer CS. The cardiothoracic ratio: an index of cardiac enlargement. Am J Med Sci. 1919;157:513-521.
Desjardins B, Kazerooni E. ECG-gated cardiac CT. AJR. 2004;182:993-1010.
Edwards DKIII, Berry CC, Hilton SW. Trisomy 21 in newborn infants: chest radiographic diagnosis. Radiology. 1988;167:317-318.
Elliot LP. Cardiac imaging in infants, children, and adults. Philadelphia: JB Lippincott, 1991.
Fallavollita JA, Brody AS, Bunnell IL, et al. Fast computed tomography detection of coronary calcification in the diagnosis of coronary artery disease. Comparison with angiography in patients 50 years old. Circulation. 1994;89:285-290.
Fleischner FG. The butterfly pattern of acute pulmonary edema. Am J Cardiol. 1976;20:39-46.
Gammill SL, Krebs C, Meyers P, et al. Cardiac measurements in systole and diastole. Radiology. 1970;94:115-119.
Glover L, Baxley WA, Dodge HT. A quantitative evaluation of heart size measurements from chest roentgenograms. Circulation. 1973;155:1289-1296.
Higgins CB, de Roos A. MRI and CT of the cardiovascular system. Philadelphia: Lippincott Williams & Wilkins, 2005.
Higgins CB, Reinke RT, Jones NE, et al. Left atrial dimension on the frontal thoracic radiography: a method for assessing left atrial enlargement. AJR. 1978;130:251-255.
Higgins CB. Essentials of cardiac radiology and imaging. Philadelphia: JB Lippincott, 1992.
Janowitz WR, Agatston AS, Viamonte MJr. Comparison of serial quantitative evaluation of calcified coronary artery plaque by ultrafast computed tomography in persons with and without obstructive coronary artery disease. Am J Cardiol. 1991;68:1-6.
Kazerooni EA. The core curriculum: cardiopulmonary imaging. Philadelphia: Lippincott Williams & Wilkins, 2004.
Keats TE, Anderson MV. Atlas of radiologic measurements. St Louis: Mosby-Year Book, 2001.
Keren G, Etzion T, Sherez J, et al. Atrial fibrillation and atrial enlargement in patients with mitral stenosis. Am Heart J. 1987;114:1146-1152.
Koos R, Kuhl HP, Muhlenbruch G, et al. Prevalence and clinical importance of aortic valve calcification detected incidentally on CT scans: comparison with echocardiography. Radiology. 2006;241:76-82.
Kostuk W, Barr JW, Simon AL, et al. Correlations between the chest film and hemodynamics in acute myocardial infarction. Circulation. 1973;158:624-632.
Kuriyama K, Gamsu G, Stern RG, et al. CT-determined pulmonary artery diameters in predicting pulmonary hypertension. Invest Radiol. 1984;19:19-22.
Lachman RS. Taybi and Lachman’s radiology of syndromes, metabolic disorders, and skeletal dysplasias. St Louis: Mosby-Year Book, 2006.
Loecker TH, Schwartz RS, Cotta CW, et al. Fluoroscopic coronary artery calcification and associated coronary disease in asymptomatic young men. J Am Coll Cardiol. 1992;19:1167-1172.
Mahnken AH, Muhlenbruch G, Das M, et al. MDCT detection of mitral valve calcification: prevalence and clinical relevance compared with echocardiography. AJR. 2007;188:1264-1269.
Milne EN C, Pistolesi M, Miniati M, et al. The radiologic distinction: cardiogenic and noncardiogenic edema. AJR. 1985;144:879-894.
Moore EH, Greenberg RW, Merck SH, et al. Coronary artery calcifications: significance of incidental detection on CT scans. Radiology. 1989;172:711-716.
Pistolesi M, Milne EN C, Miniati M, et al. The vascular pedicle of the heart and the vena azygos. Radiology. 1984;152:9-17.
Pohost GM. Imaging in cardiovascular disease. Philadelphia: Lippincott Williams & Wilkins, 2000.
Ravin CE. Pulmonary vascularity: radiographic considerations. J Thorac Imaging. 1988;3:1-13.
Rose CP, Stolberg HO. The limited utility of the plain chest film in the assessment of left ventricular structure and function. Invest Radiol. 1982;2:139-144.
Staub NC. New concepts about pathophysiology of pulmonary edema. J Thorac Imaging. 1988;3:8-14.
West JB. Regional differences in the lung. Chest. 1978;74:426-437.
Woodring JH. Pulmonary artery-bronchus ratios in patients with normal lungs, pulmonary vascular plethora, and congestive heart failure. Radiology. 1991;179:115-122.