Chapter 13 Thalassemia Syndromes
Table 13-1 Common β-Thalassemia Mutations in Different Racial Groups
| Racial Group | Description |
|---|---|
| Mediterranean | IVS-1, position 110 (G → A) |
| Codon 39, nonsense (CAG → TAG) | |
| IVS-1, position 1 (G → A) | |
| IVS-2, position 745 (C → G) | |
| IVS-1, position 6 (T → C) | |
| IVS-2, position 1 (G → A) | |
| Black | -34 (A → G) |
| -88, (C → T) | |
| Poly(A), (AATAAA → AACAAA) | |
| Southeast Asian | Codons 41/42, frameshift (-CTTT) |
| IVS-2, position 654 (C → T) | |
| -28 (A → T) | |
| Asian Indian | IVS-1, position 5 (G → C) |
| 619-bp deletion | |
| Codons 8/9, frameshift (++G) | |
| Codons 41/42, frameshift (–CTTT) | |
| IVS-1, position 1 (G → T) |
Data from Kazazian HH Jr, Boehm CD: Molecular basis and prenatal diagnosis of beta-thalassemia. Blood 72(4):1107, 1988; and Kazazian HH Jr, Boehm CD: personal communication, 1993.
Clinical Heterogeneity of Thalassemia
Guidelines for Transfusion Therapy
1. Obtain a complete RBC antigen profile before the first transfusion.
2. Administer 10 to 15 mL/kg of RBCs every 2 to 4 weeks to maintain the pretransfusion hemoglobin level above 9 to 10.5 g/dL.
3. Use leukoreduced RBCs that have been stored for less than 7 to 10 days.
4. Avoid the use of first-degree relatives as blood donors.
5. For patients who come to a new center after receiving transfusions elsewhere, contact the previous blood bank for information about alloantibodies.
Benefits of Iron Chelation Therapy
1. Liver iron concentrations can be maintained at normal or mildly elevated levels.
2. Hepatic fibrosis is slowed or prevented.
3. The risk of iron-induced cardiac disease, including heart failure and serious arrhythmias, is markedly decreased.
4. Normal growth and sexual development are common but not universal.
5. Long-term survival is substantially improved. These benefits are directly related to compliance and generally require the prolonged administration of deferoxamine at least five times per week.
6. Long-term safety and efficacy studies of the oral iron chelators deferiprone and deferasirox are ongoing.
Assessment of Iron Stores
Measurement of liver iron concentration by biopsy provides a direct assessment of tissue iron loading and reflects total body iron stores but liver biopsy requires a skilled technician, at least 1 mg of tissue at least 2.5 cm in length with five portal tracts and has the risk of hemorrhage. MRI changes in R2 reflects liver iron concentration comparable to that on liver biopsy. The use of MRI to estimate hepatic and cardiac iron in patients with transfusional siderosis has largely replaced liver biopsy for liver iron concentration quantification at the start of chelation therapy and with annual assessments. Future MRI use may involve the quantification of iron concentration of endocrine glands to predict or monitor dysfunction.1–3 Levels between 3 and 7 mg Fe/g dry weight appear to be associated with minimal toxicity. Levels greater than 15 mg Fe/g dry weight are associated with an increased risk of heart disease. Recent experience with cardiac magnetic resonance imaging suggests that changes in T2* reflect levels of iron in the heart and may predict adverse changes in cardiac function.
Serum ferritin levels are safe, inexpensive, and readily available, and serial measurements are predictive both of critical complications such as iron-induced heart disease and of adverse effects of chelation therapy such as impairment of vision and hearing. However, single ferritin levels may correlate poorly with liver iron concentration because it is an acute phase reactant and may be influenced by inflammation, vitamin C deficiency, hepatitis, and other infectious states. Transferrin saturation is not very useful in evaluating the severity of iron overload in patients with thalassemia because the massive IE usually results in a transferrin saturation greater than 60% even in the absence of iron overload.4
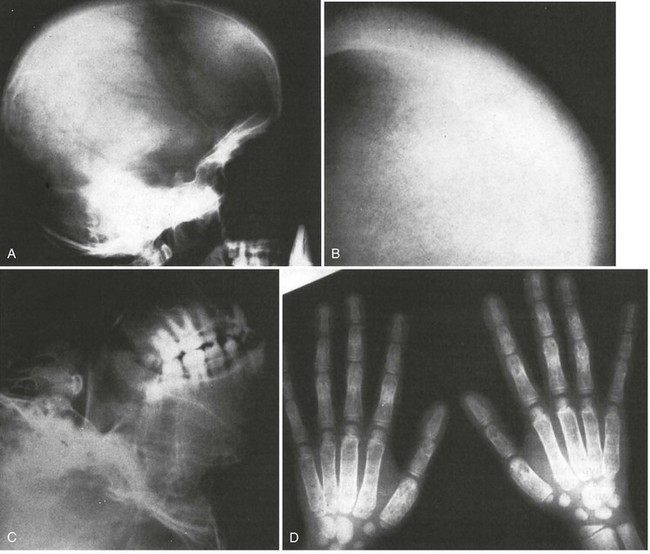
Figure 13-3 BONY ABNORMALITIES IN A PATIENT WITH SEVERE β-THALASSEMIA.
(From Pearson HA, Benz EJ Jr: Thalassemia syndromes. In Miller DR, Baehner RL, McMillan CW, editors: Smith’s blood diseases of infancy and childhood, ed 5, St. Louis, 1984, CV Mosby, p 439.)
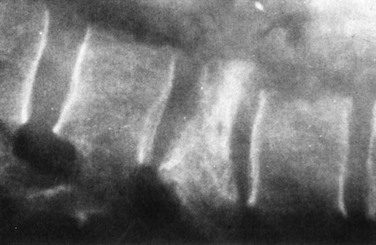
Figure 13-4 COMPRESSION FRACTURE OF L2 VERTEBRA IN A PATIENT WITH SEVERE β-THALASSEMIA.
(From Pearson HA, Benz EJ Jr: Thalassemia syndromes. In Miller DR, Baehner RL, McMillan CW, editors: Smith’s blood diseases of infancy and childhood, ed 5, St. Louis, 1984, CV Mosby, p 439.)
Table 13-2 Survival by Birth Cohort at Different Ages of Patients With Transfusion-Dependent Thalassemia
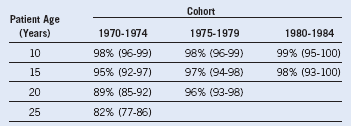
Data from Borgna Pignatti C, Rugolotto S, De Stefano X, et al: Survival and disease complications in thalassemia major. Ann N Y Acad Sci 850:227, 1998.
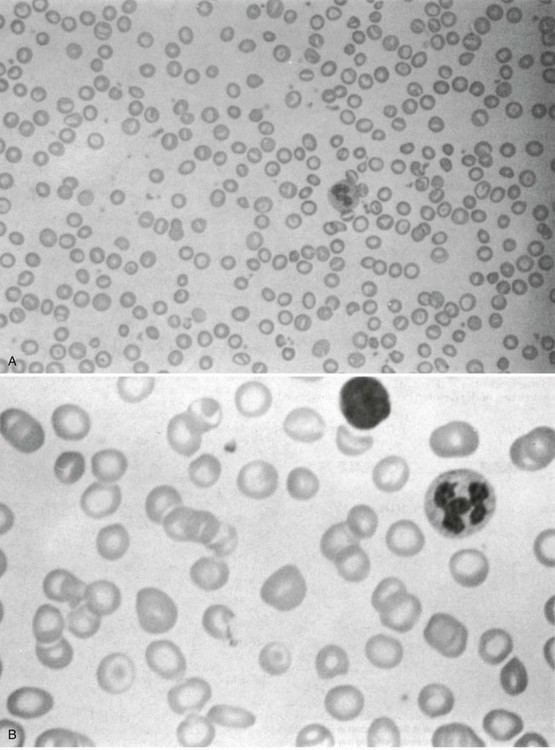
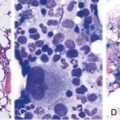
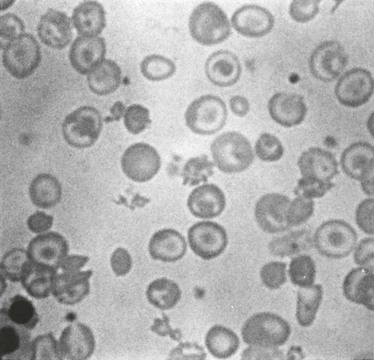
Figure 13-5 MORPHOLOGY OF THE PERIPHERAL BLOOD FILM IN A PATIENT WITH HETEROZYGOUS β-THALASSEMIA (A) AND A PATIENT WITH HETEROZYGOUS α-THALASSEMIA (B).
Note the profound hypochromia and microcytosis and the many target cells.
(From Pearson HA, Benz EJ Jr: Thalassemia syndromes. In Miller DR, Baehner RL, McMillan CW, editors: Smith’s blood diseases of infancy and childhood, ed 5, St. Louis, 1984, CV Mosby, p 439.)
1 Wood JC. Impact of iron assessment by MRI. Hematology Am Soc Hematol Educ Program. 443, 2011.
2 Au WY, Lam WW, Chu W, et al. A T2* magnetic resonance imaging study of pancreatic iron overload in thalassemia major. Haematologica. 2008;93:116.
3 Noetzli LJ, Papudesi J, Coates TD, et al. Pancreatic iron loading predicts cardiac iron loading in thalassemia major. Blood. 2009;114:4021.
4 Finch CA, Huebers H. Perspectives in iron metabolism. N Engl J Med. 1982;306:1520.