[level-membership-for-cardiovascular-category]
Special Tests
The medical workup of a patient with cardiac or pulmonary disease uses many tools. The patient interview, physical examination, chest x-ray, and electrocardiogram (ECG) can provide adequate information to make a diagnosis. However, when the diagnosis remains unclear, special tests that use more complex technology are required. These special tests may be invasive or noninvasive. Current clinical practice guidelines recommend that noninvasive tests be performed before invasive tests such as angiography.1 Nuclear medicine offers a variety of noninvasive tests for evaluation of cardiac and pulmonary function. Echocardiography, which is particularly useful in children, is another noninvasive method that provides information about the cardiovascular system, including valve function, ventricular performance, and estimation of filling pressures. In comparison with cardiovascular tests, special tests of the respiratory system are less commonly required in the initial diagnosis and treatment of disease. The generally high-quality information obtained from standard x-ray examination in combination with the patient’s respiratory symptoms, pulmonary function tests, and the results of the physical examination is usually sufficient, making special tests unnecessary.2–4
Various factors are involved in the decision of which special tests may be beneficial for a patient. These tests afford different benefits to patients in terms of diagnostic and prognostic accuracy (Table 14-1). Radiation exposure is an additional factor in selection of tests. These tests have helped to clarify our understanding of the physiology and pathophysiology of the cardiovascular and pulmonary system. Therapists need to understand the pathophysiological basis for a patient’s movement dysfunctions to select the most appropriate treatment strategies. Many special tests can and are being used in research to evaluate treatment interventions. For example, radiolabeled aerosols are used to evaluate mucociliary clearance, providing a method to evaluate the effectiveness of pulmonary hygiene techniques.5 Clinically, physical therapists need to use information from the tests to develop a framework for predicting how the patient may respond to a physical therapy intervention. For example, nuclear imaging can provide information about left ventricular ejection fraction. This information helps the therapist determine whether the patient should be stratified into high-risk or low-risk categories. Monitoring of an exercise session may depend on the risk level, and the therapist’s interpretation of the patient’s response to treatment may be affected by this information.
Table 14-1
Tests Used for Diagnosis and Prognosis in Ischemic Heart Disease
| Test Type | Sensitivity* | Specificity* | Predictive Accuracy* |
| Exercise ECG | 68% | 77% | 73% |
| Duke treadmill score | – | – | 80% |
| Thallium-201 perfusion scan | 85% | 85% | 85% |
| Technetium-99m sestamibi/SPECT | 88% | 72% | 80% |
| Adenosine SPECT | 90% | 82% | 85% |
| Exercise echocardiography | 85% | 81% | 80% |
| Dobutamine echocardiography | 88% | 84% | 86% |
| Computed tomography: electron beam computed tomography (EBCT) calcium score | 60% | 70% | 65% |
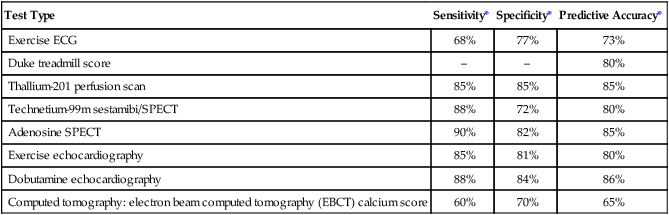
*Data vary according to studies included and characteristics of patient group studied (e.g., number of coronary vessels involved).
From Kones R: Recent advances in the management of chronic stable angina. I: Approach to the patient, diagnosis, pathophysiology, risk stratification, and gender disparities. Vascular Health and Risk Management 6:635-656, 2010.
Nuclear Imaging Systems
Physics of Nuclear Imaging
Radionuclide imaging allows for the noninvasive acquisition of images from a variety of body tissues. An imaging system requires three basic parts. The first requirement is a radiopharmaceutical that emits gamma radiation and is taken up by the body tissue of interest. Next, a radiation detector or camera is needed. Finally, computers are required to collect and analyze the data. Thus an image is formed based on the brightness of the tissue, which is proportional to the radiation the tissue has absorbed.6
Radionuclides are elements that are unstable; they gain stability by emitting particles or photons. This is called radioactive decay, and gamma radiation is released. Radionuclides are either cyclotron- or generator-produced. The cyclotron accelerates alpha-particles, deuterons, and protons to energies suitable for the production of the required radionuclide.7 A radionuclide generator is a system of a long-lived parent radionuclide which decays to produce a daughter radionuclide. The system is constructed so that the daughter can be removed (called “milking” the generator) for patient use.8 A generator system produces short-lived radionuclides.7
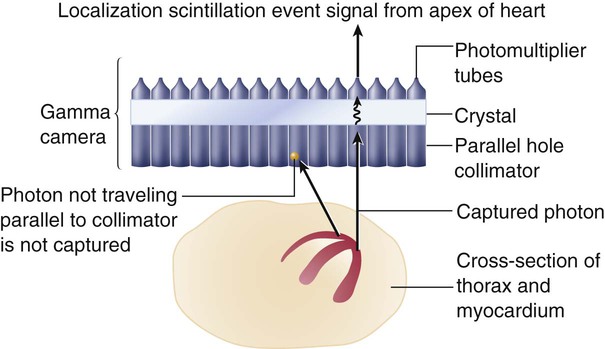
Detection of the radioactive energy emitted by a specific radiopharmaceutical requires a camera. When certain materials are struck by ionizing radiation, light is emitted. A scintillation detector detects this light (Figure 14-1). A gamma camera (a scintillation detector) is able to detect photons exiting the body. It uses a large, collimated crystal monitored by an array of photomultiplier tubes.9 A collimator is a device that allows only those photons traveling in an appropriate direction to reach the crystal. There are several types of collimators: parallel-hole collimators (most common), pinhole collimators, and converging and diverging collimators. The photomultiplier tube records the amount of light from the crystal and converts it into a voltage that is proportional to the intensity of the light.9 The camera system is connected to a computer that stores the light images. The computer is able to derive two-dimensional images from the data. The newer software algorithms that construct the images have improved, allowing for better spatial resolution, contrast, and overall image quality.10
Planar Imaging
A single crystal camera produces a two dimensional or planar image. Multicrystal cameras also produce planar images but are also able to perform fast, dynamic imaging used in first pass and gated studies. Planar images are unable to reflect the depth of an image.6 Planar imaging may be the only option available for obese patients who do not “fit” the single-photon emission computed tomography (SPECT) camera or for those who cannot remain immobile.11
Single-Photon Emission Computed Tomography Imaging
The most common nuclear study of myocardial perfusion is SPECT imaging.12 Planar images or tomographs are collected by rotating the scintillation detectors (single-, dual-, or triple-head scintillation cameras) around the patient, taking images at 3-degree increments.10 SPECT images allow for quantification of radioactivity.6 However, attenuation artifacts (absorption of the radioactive energy by other body tissues, preventing the camera from detecting it) are greater than with planar images, particularly those images involving the inferior wall of the heart in men and the anterior wall in women, and may produce false-positive scans.13 Quality of the images is dependent on the use of stringent quality control measures and experience of the staff. The most commonly used radionuclides are thallium-201, technetium-99m-sestamibi, and technetium-99m-tetrofosmin.14 Image quality is also patient-dependent. Patients must be able to lie perfectly still for 15 to 20 minutes, with their hands over their heads, while data are collected. Newer systems allow for a 50% reduction in duration of the scan as well as reduced processing time.10 Currently available systems also allow for seated positioning.10
Positron Emission Tomography
Positron emission tomography (PET) uses positron-emitting radionuclides. The images obtained by PET can provide information regarding cellular processes in living tissue. Both cardiac and lung tissue can be quantitatively examined to obtain information on metabolism, blood perfusion, tissue viability, autonomic regulation, and other processes.15,16 PET is valuable in delineating myocardial areas with reversible and irreversible injury, thus assessing the feasibility of revascularization, in patients with CAD or left ventricular dysfunction.17 PET studies use short scanning times (5-35 minutes) and because of the short half-life of PET tracers, multiple scans can be repeated in a relatively short period of time.18 Although PET scans offer superior imaging, in part due to greater correction for attenuation artifact,18 PET’s technological complexity, short-lived radio tracers, and specialized equipment have resulted in high costs and more limited clinical application.15 However, because of increased PET use in oncology imaging, opportunities for imaging of the cardiorespiratory system are now increasing.15,19 Current FDA-approved PET nuclides are rubidium-82 (82-Rb), 13N-ammonia (13-NH3), and fluorine-18-fluorodeoxyglucose (18F-FDG).15
Nuclear Tests of the Cardiovascular System
First-Pass and Gated Equilibrium Scans
In a first-pass study, data are collected on a radiolabeled bolus of blood as it passes through the cardiac chambers, which is one method of radionuclide angiography. A first-pass scan allows for clear identification of the four cardiac chambers. During first-pass studies, data are collected over several cardiac cycles. Gated equilibrium studies or multiple-uptake gated acquisition (MUGA) scans average several hundred cardiac cycles. Each R wave of the ECG triggers the acquisition of data; thus the average cycle observed is the compilation of many cycles.20 The quality of the image is best when the patient has a stable sinus rhythm. Patients with irregular heart rates, such as atrial fibrillation, have images of poorer quality.
Exercise Stress Studies
Many of the tests performed using radionuclides are coupled with an exercise test. A treadmill exercise test is performed, and at the peak of exercise, a tracer is injected. Shortly afterward, depending on the tracer, images are acquired. Exercise imaging enhances the identification of ischemic areas. These tests are then often compared with rest studies. Rest/stress or stress/rest protocols can be used.14
Nuclear-Derived Measurements
The most important of these measurements, the ejection fraction (right and left ventricle) is a measure of myocardial function. It is derived from quantitative counts of the ventricular area during diastole and systole:20

Left ventricular ejection fraction (LVEF) has been shown to be predictive of mortality. LVEF normally ranges from 50% to 85%, whereas LVEF below 40% indicates moderate-severe congestive heart failure.21,22 LVEF is linearly related to mortality up to 45% EF23 and inversely related to moderate- to large-sized infarcts.24 Right ventricular ejection fraction (RVEF) has been found to have a wide range of normal values (35% to 75%)25 but is not as predictive of function without data about wall motion abnormalities. The strongest radionuclide predictor of outcome is the exercise LVEF. In terms of predicting outcome, multivariate analysis of clinical data, catheterization data, and radionuclide measurements have shown that the radionuclide results (exercise LVEF, resting end-diastolic volume, and change in heart rate [HR]) have the same prognostic power as the catheterization data.26
Another important measurement is wall motion. Quantitative and qualitative evaluation of the movement of the myocardium can be made. Wall thickness and wall movement are compared during systole and diastole. Assessments are made about akinesia (absence of wall motion), global or regional hypokinesia (reduction of wall motion), and dyskinesia (outward bulging of the wall during systole).27 Global left ventricular function is a strong predictor of survival. It can help clinicians differentiate a weak heart from one that is stiff, thus allowing the appropriate treatment. Regional wall function, when correlated with knowledge of coronary artery anatomy, allows for the identification of potential blockages or areas of infarct. Assessing wall thickness can provide information about hypertrophy or aneurysm but is done more reliably by echocardiography.
Infarct size is an important measurement because it predicts short-term mortality. It is also important as a clinical endpoint in determining the effectiveness of reperfusion strategies and pharmacological interventions, which should result in a decrease of infarct size.28 The size of a myocardial infarct can be estimated by using the measurements previously described (i.e., ejection fraction, end-systolic volume, and global or regional wall motion).28 Perfusion defects of the myocardium can be measured acutely, after intervention, or during recovery.
Anatomical measurements of chamber size can be made. From these data, chamber volume can be calculated, as well as stroke volume and cardiac output (Table 14-2).
Table 14-2
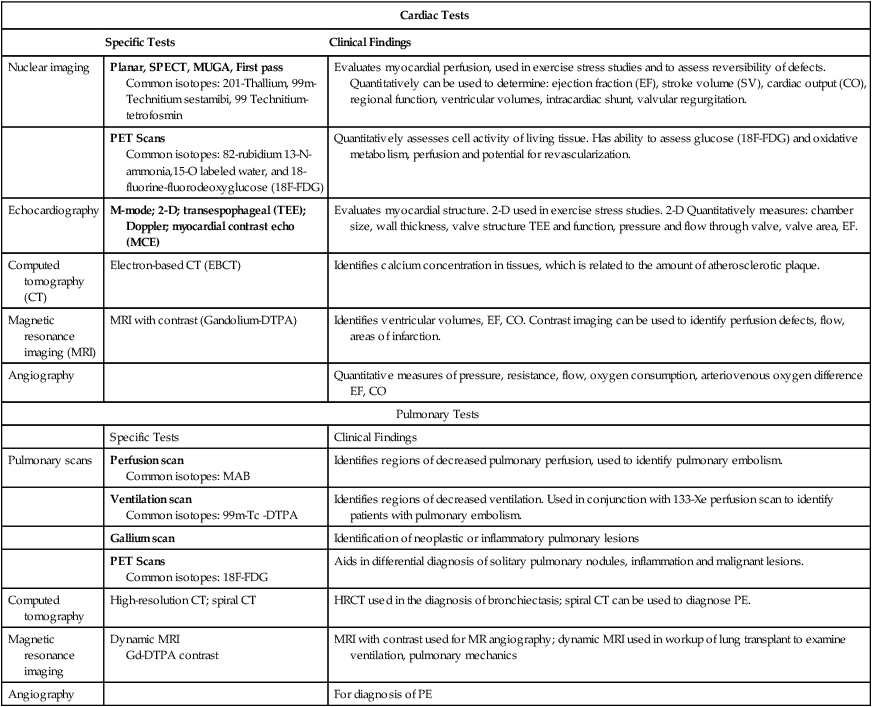
Summary of Special Tests of the Cardiopulmonary System
| Cardiac Tests | ||
| Specific Tests | Clinical Findings | |
| Nuclear imaging | Planar, SPECT, MUGA, First pass Common isotopes: 201-Thallium, 99m-Technitium sestamibi, 99 Technitium-tetrofosmin |
Evaluates myocardial perfusion, used in exercise stress studies and to assess reversibility of defects. Quantitatively can be used to determine: ejection fraction (EF), stroke volume (SV), cardiac output (CO), regional function, ventricular volumes, intracardiac shunt, valvular regurgitation. |
| PET Scans Common isotopes: 82-rubidium 13-N-ammonia,15-O labeled water, and 18-fluorine-fluorodeoxyglucose (18F-FDG) |
Quantitatively assesses cell activity of living tissue. Has ability to assess glucose (18F-FDG) and oxidative metabolism, perfusion and potential for revascularization. | |
| Echocardiography | M-mode; 2-D; transespophageal (TEE); Doppler; myocardial contrast echo (MCE) | Evaluates myocardial structure. 2-D used in exercise stress studies. 2-D Quantitatively measures: chamber size, wall thickness, valve structure TEE and function, pressure and flow through valve, valve area, EF. |
| Computed tomography (CT) | Electron-based CT (EBCT) | Identifies calcium concentration in tissues, which is related to the amount of atherosclerotic plaque. |
| Magnetic resonance imaging (MRI) | MRI with contrast (Gandolium-DTPA) | Identifies ventricular volumes, EF, CO. Contrast imaging can be used to identify perfusion defects, flow, areas of infarction. |
| Angiography | Quantitative measures of pressure, resistance, flow, oxygen consumption, arteriovenous oxygen difference EF, CO | |
| Pulmonary Tests | ||
| Specific Tests | Clinical Findings | |
| Pulmonary scans | Perfusion scan Common isotopes: MAB |
Identifies regions of decreased pulmonary perfusion, used to identify pulmonary embolism. |
| Ventilation scan Common isotopes: 99m-Tc -DTPA |
Identifies regions of decreased ventilation. Used in conjunction with 133-Xe perfusion scan to identify patients with pulmonary embolism. | |
| Gallium scan | Identification of neoplastic or inflammatory pulmonary lesions | |
| PET Scans Common isotopes: 18F-FDG |
Aids in differential diagnosis of solitary pulmonary nodules, inflammation and malignant lesions. | |
| Computed tomography | High-resolution CT; spiral CT | HRCT used in the diagnosis of bronchiectasis; spiral CT can be used to diagnose PE. |
| Magnetic resonance imaging | Dynamic MRI Gd-DTPA contrast |
MRI with contrast used for MR angiography; dynamic MRI used in workup of lung transplant to examine ventilation, pulmonary mechanics |
| Angiography | For diagnosis of PE | |
Myocardial Perfusion Imaging
Perfusion of the myocardium is a vital factor in the viability and function of the heart. Information about myocardial perfusion is used for diagnostic decisions, treatment decisions, and prognosis. Perfusion of the myocardium under rest and exercise conditions is important in the diagnosis of CAD. For those patients with left ventricular dysfunction, identifying tissue that is viable but still at risk is critical for improving long-term outcomes. The efficacy of reperfusion strategies, such as angioplasty and thrombolytic therapy, must be evaluated. Information gained from combined perfusion and metabolic studies has helped to increase the understanding of ischemic myocardium. Two types of contractile dysfunction have been delineated. Hibernating myocardium is the result of prolonged ischemia. In this case, the contractility of the muscle fiber is affected so that there may appear to be regional wall motion abnormalities. The tissue is alive but not contracting. It is theorized that this is a measure to reduce energy expenditure and ensure myocyte survival. The second condition, myocardial stunning, occurs under conditions of acute ischemia. In this case, contractile dysfunction that initially occurs during the acute ischemic episode persists for some time after perfusion has returned to normal. Both conditions are reversible. Patients demonstrating hibernating myocardium may benefit from revascularization procedures. Patients with stunned myocardium may only require supportive care until contractile function returns.29 The type of imaging performed and the specific radiopharmaceutical used provides similar but not necessarily interchangeable imaging results and measurements.14
Thallium-201
Thallium-201 (201-TL) is the oldest radioactive isotope used in myocardial perfusion studies.14 It is a cyclotron-produced isotope that emits low-energy radiation (68 to 80 kiloelectron volts [keV]). Thallium concentrations in the myocardium depend on 201-TL properties, uptake, and redistribution. Administered intravenously, its distribution throughout the body depends on blood flow, and within 5 minutes, myocardial uptake represents myocardial blood flow.30 The first-pass myocardial uptake coefficient is 85%.14 Extraction from the blood and transport across the cell membrane depend on active and passive transport mechanisms. Thallium is transported across the cell membrane through the sodium-potassium ATPase pump and facilitative diffusion.30 Normally perfused and functioning myocardium will take up the thallium tracer, while damaged cells will demonstrate weaker uptake. Within 15 minutes thallium begins washout (also called redistribution) in normal myocardium. Images taken 4-24 hours later show clearance of the 201-Tl, again as a result of normal blood flow, while abnormal cells have more tracer as it has not been washed out.30
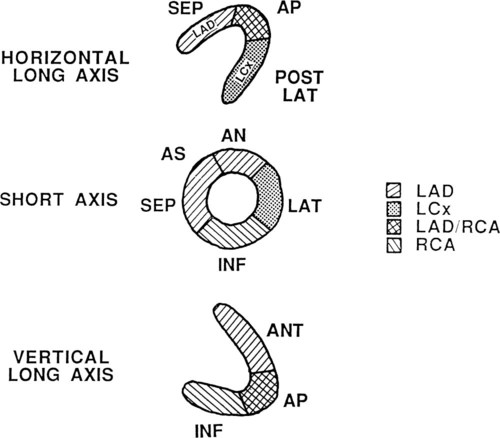
Thallium-201 images can be qualitatively and quantitatively evaluated. Normally perfused myocardium demonstrates uniform uptake of the tracer. Uniform uptake can occur as long as blockages are less than 50% of the artery. Ischemic but viable myocardium initially appears as areas of decreased uptake; these areas fill in over time, a function of redistribution. Because blood flow is decreased, clearance of thallium-201 from the defect region is slower.30 In infarcted areas, these defects remain unchanged over time. Thus perfusion and tissue viability can be assessed with 201-TL. Qualitative evaluation requires visual inspection of the images. Quantitative evaluation is performed by specialized software individual to the imaging system used. The computer analyzes the amount of radioactivity taken up in a particular region of interest (ROI). It then quantifies this count so that regions can be compared with each other and with normalized data. In this way, unperfused or hypoperfused areas can be identified (Figure 14-2).
Thallium-201 is used to acquire planar and SPECT images for rest studies, exercise stress studies, and pharmacological stress studies. The traditional thallium-201 stress study calls for injection of the tracer at the peak of exercise with collection of the stress data within 10 to 15 minutes. The redistribution study is completed at a minimum of 4 hours later. Alternative study protocols include reinjection of thallium before the 4-hour redistribution study and use in dual-isotope studies.30 Reinjection of thallium and repeat imaging 24 hours after initial study can help identify severely ischemic (greater than 90% blockage) areas, which may take much longer to demonstrate redistribution.
Technetium-99m-Sestamibi or Technetium-99m-Tetrofosmin
The technetium (Tc)-99m–based radionuclides were developed because of a number of advantages they have over thallium imaging. Sestamibi and tetrofosmin provide improved SPECT image quality as a result of higher count rates and higher energy, in the 140 keV range. Tc-99m is generator-produced. These isotopes have a 6-hour half-life and are excreted via the hepatobiliary system.14 Because of the short half-life, higher doses can be injected, and although the percentage of extraction is lower (65% for sestamibi and 54% for tetrofosmin), uptake in relation to flow is similar to that of thallium.14 These factors result in higher count rates, which thus allow the use of gated images and first-pass acquisition studies. Higher count rates are preferred when evaluating obese patients. One of the greatest limitations of Tc-99m is that it does not readily redistribute; therefore reversibility of defects cannot be ascertained as well as with thallium. This factor is one reason thallium is much more popular. Two-day protocols or dual isotope protocols can be used to overcome this limitation.31 Lack of redistribution has been exploited in evaluating the impact of thrombolytic therapy in acute situations. A patient with an acute myocardial infarction (MI) can be injected with tracer, given thrombolytics, stabilized, and scanned 4 hours later. The scan results show myocardial perfusion at the time of injection when the myocardium was ischemic. Later scans demonstrate the new perfusion situation.
Protocols using this isotope are designed to take advantage of the rapid uptake and washout. When used with pharmacological stress studies, a rest-stress study can be completed within minutes.32 This may have future application in studying reperfusion following balloon angioplasty or reperfusion therapy with thrombolytic agents.32
Positron Emission Tomography Tracers
PET tracers are also used to evaluate perfusion. The most commonly used tracers are 13N-ammonia, rubidium-82, and 15-O-labeled water.33,34 The benefit of using PET tracers is that it is possible to quantify myocardial blood flow in mL/g/min.
Rubidium-82
One of the oldest approved tracers, rubidium-82 (82-Rb) is taken up by the myocardium via the Na/K-ATPase mechanism. Imaging myocardial blood flow is not optimal, because first-pass extraction is only 60% and uptake becomes nonlinear with increased blood flow.34 However, it is easily produced via generator. The very short half-life of 82-Rb is useful in the clinical setting. It is most often used with pharmacological stress studies.34
15-O-Labeled Water
The PET tracer 15-O-labeled water (H2-15O) can be delivered by a variety of methods. It can be administered by bolus injection (the same method used for 82Rb and 13-NH3), but it can also be inhaled or given as an infusion. Myocardial uptake is uniform over a wide range of flow rates and is modeled as an inert freely diffusible tracer, which easily crosses capillary and sarcolemmal membranes.33 However, the short half-life and reduced count density of H2-15O result in less-than-optimal image quality, making visual analyses problematic.34 H2-15O is not currently an FDA-approved tracer.
Myocardial Metabolism
Fluorine-18-Fluorodeoxyglucose
Fluorine-18-fluorodeoxyglucose (18F-FDG) is a glucose analogue that crosses the capillary and sarcolemmal membrane at a rate proportional to that of glucose. 18F-FDG becomes trapped in the myocardium, because it is not a useful substrate in metabolic pathways. The distribution of 18F-FDG is relative to uptake of unlabeled glucose.35 Glucose utilization is therefore used as a marker of tissue viability.
Identification of areas with normal metabolism, altered metabolism, or no metabolism is based on the use of glucose as an energy substrate. Normally perfused myocardial cells use a combination of fatty acids and carbohydrates for adenosine triphosphate (ATP) production when in a fasting state and use glucose as the primary energy source in the postprandial state. Ischemic myocardium uses glucose in the fasting state and the postprandial state. Infarcted or scarred areas show no metabolic activity. Therefore increased uptake of 18F-FDG in the postprandial state occurs in both hibernating and normal myocardium, but in the fasting state, it occurs only in the hibernating myocardium. Clinical studies in patients with infarct showed that areas with persistent thallium-201 perfusion defects have evidence of remaining metabolic activity in 47% of regions when studied with a PET scan, indicating overestimation of irreversible injury. Use of reinjection and late redistribution imaging has significantly lowered this number.36 The implication derived from this finding is that in areas with perfusion defects, if glucose activity remains, the region is viable (mismatch pattern); conversely, if such activity is absent, the area is likely to be infarcted or necrotic (match pattern).37 Viewed in functional terms, mismatch simply implies the potential for improvement; match implies no potential for improvement in contractility after successful revascularization.38
11C-Acetate
Another way to evaluate myocardial viability is to use an isotope that is incorporated into the metabolic pathways related to myocardial oxygen consumption. 11C-acetate in its activated form, acetyl-CoA, represents the entry point for all metabolic pathways into the tricarboxylic acid cycle, which is tightly coupled to oxidative metabolism. Its advantage over 18F-FDG is that it does not rely on substrate use (i.e., glucose versus fat metabolism). 11C-acetate accurately reflects oxidative metabolism and can distinguish viable from nonviable myocardium in both acute and chronic ischemic conditions.39
Nuclear Tests of the Pulmonary System
Ventilation-Perfusion Lung Scan
The ventilation-perfusion (VQ) lung scan is a combination of two separate imaging procedures. It is primarily used in the diagnosis of pulmonary embolism (PE), with limited use for other clinical problems.40 The perfusion portion requires the injection of radioactive tracer. Technetium-99m- macroaggregated albumin is accepted (almost universally) as the perfusion tracer of choice.41 The ventilation scan requires the inhalation of radioactive gas, usually 133-XE gas or Tc-99m-diethylenetriamine pentaacetic acid (DTPA) aerosol. Other isotopes can be used for ventilation scanning (e.g., Kr-81M, Xenon-127), but they are more difficult to obtain (Figure 14-3).
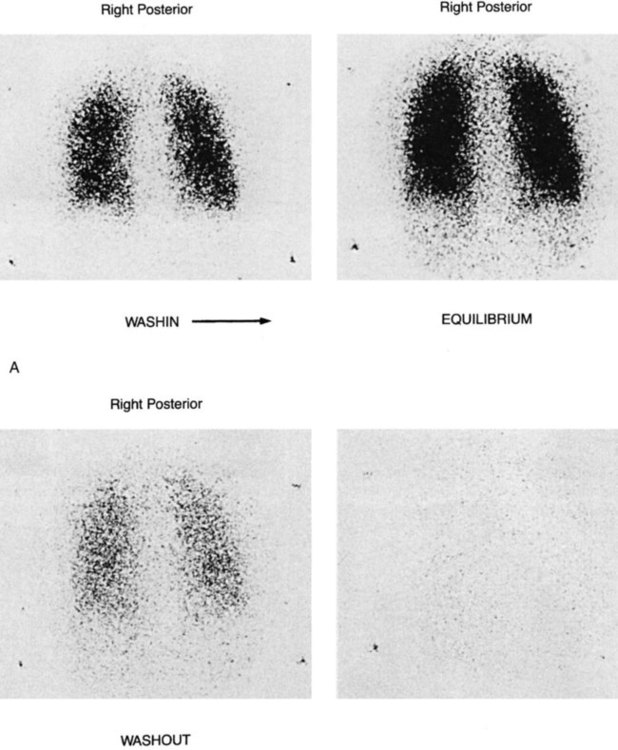
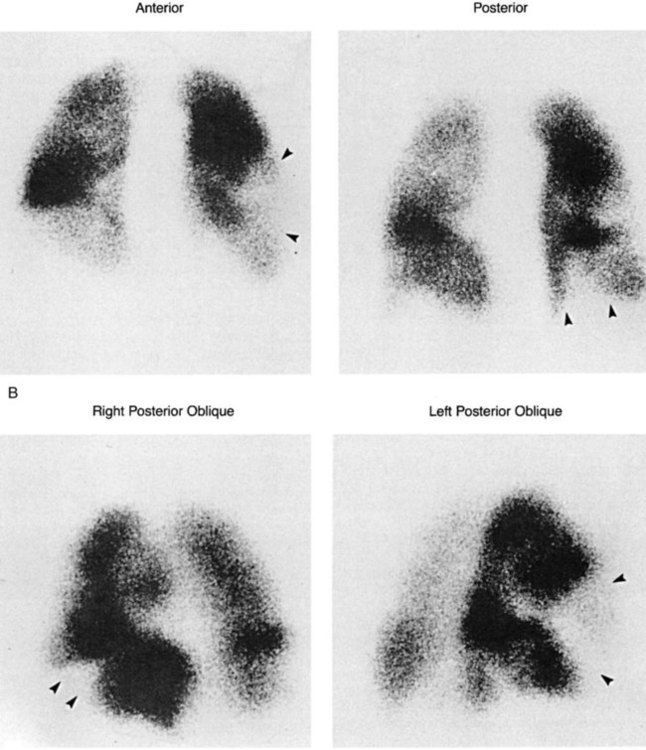
A normal perfusion scan essentially rules out recent pulmonary embolus. If the perfusion scan is abnormal, it is compared with the ventilation scan for match or mismatch of defects. An interpretation scheme is used, such as Pioped, which classifies the probability of PE as present (high probability), absent (normal or very low probability), and non-diagnostic (low probability or indeterminate).5,41 Patients with high-probability scans should begin anticoagulation therapy.41 The D-dimer test and pretest probability of a PE also help to determine if the patient is high probability and thus requires anticoagulation.
Since the PIOPED II conclusion that computed tomography pulmonary angiogram (CTPA) has superior diagnostic accuracy for pulmonary emboli, the VQ scan is used less frequently.41–44 However, VQ scans remain valuable for patients concerned with radiation exposure, intolerance to intravenous contrast agents or during pregnancy.45
Miller and O’Doherty5 note other applications of ventilation/perfusion scanning, including monitoring of response to radiotherapy and assessment of resectability of bullae. The scan is used to predict whether someone can tolerate a pneumonectomy based on percent flow to the opposite lung and extent of disease present.
Positron Emission Tomography
PET scans using 18F-FDG isotopes are being used to identify metabolically active tissue (glucose metabolism) in the lungs. It has found application in the differential diagnosis of pulmonary nodules, inflammation, and potential malignant lesions.46 PET with 18F-FDG is used as a diagnostic tool for pulmonary nodules and mass lesions.46 Solitary pulmonary nodules (SPN) are often found during screening tests. They are of significant concern because of the risk for malignancy. Gould and colleagues46 performed a meta-analysis and concluded that sensitivity is 96.8% and specificity is 77.8% for detecting malignancy in SPNs. PET 18F-FDG is not recommended for nodules less than 1 cm in size.47 In addition to difficulty accessing PET scanners, cost may be a limiting factor—based on Medicare reimbursement figures, PET scans using 18F-FDG can cost six times more than conventional CT scans of the chest.47
Gallium Scintigraphy
PET or SPECT imaging has largely replaced gallium scanning for lung disease.48 However, this isotope is still used in some centers and in specific clinical situations. Gallium-67-citrate binds with transferrin. This complex binds with transferrin-receptors in neoplastic cells while in areas of inflammation and infection gallium binds to lactoferrin and siderophores.48 The radioisotope is injected intravenously, but it takes 48 to 72 hours before imaging can be performed; this delay is one reason it is out of favor.
Gallium is used in the evaluation of patients with inflammation and infection. Non-infectious inflammatory processes include: sarcoidosis, amiodarone toxicity, following cytotoxic therapy with bleomycin, and interstitial pulmonary fibrosis, as well as many other entities.48 Gallium scanning is used to monitor response to treatment in lymphoma and where PET scans are not available can be useful in the diagnosis of lung cancer.48 Gallium continues to be useful in infections (e.g., TB) as it helps discriminate active infection from fibrosis. Similarly, discriminating active disease from scarring is useful in evaluating AIDS patients with Pneumocystis carinii pneumonia (PCP).48 The sensitivity of gallium scanning for PCP in patients with AIDS approaches 94% to 96%.43
Angiography
Angiography is the radiographic examination of the arterial system using an opaque contrast dye injected into the arterial segment to characterize flow. Angiography provides information about the detailed structural anatomy of the vascular system under study. Angiography requires an x-ray generator tube and image intensifier/cine camera.49 The radiopaque dye is injected into the vascular supply of the region of interest. Radiographic images can then monitor the contrast material as it moves through the circulation. The development of coronary angiography via cardiac catheterization techniques allowed for the development of many of the catheter-based interventions now used today.50
Cardiac Imaging
The gold standard with which many of the cardiac noninvasive tests are compared is that of cardiac catheterization. It is an invasive test, with a small but serious risk to the patient. Complications include death, stroke, MI, bleeding, arterial trauma or thrombus, renal dysfunction, and arrhythmias.49 The test is indicated in patients presenting with ST elevated MI (STEMI) who are candidates for reperfusion as well as those presenting with chest pain and non-STEMI who are at risk for further cardiac events.51 There is some debate as to whether the NSTEMI population should undergo a coronary angiogram with potential for revascularization within 24 hours or should wait. Current guidelines recommend the early procedure.52 Patients who have CAD with angina that is unresponsive to medical therapy may also need catheterization.
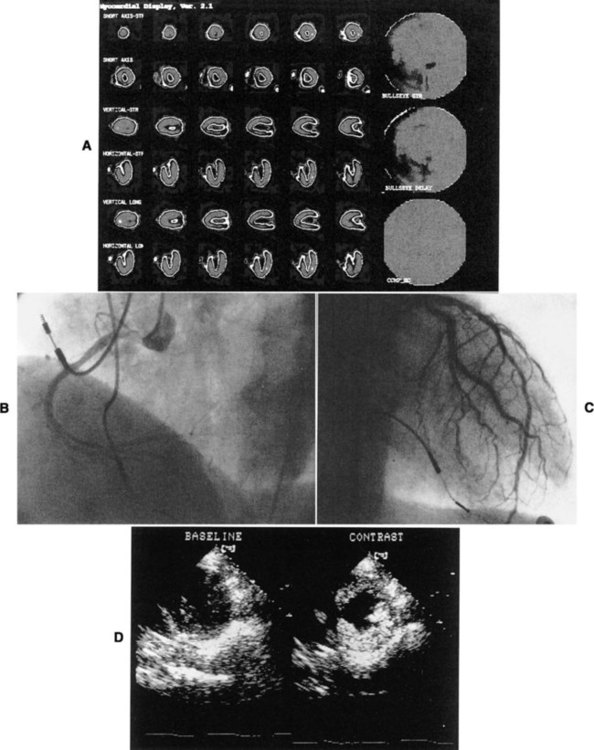
The procedure for cardiac catheterization of the left side of the heart requires the threading of a catheter, guided by fluoroscopy, through the femoral artery or brachial artery to the aorta. Direct measurements of chamber pressures, blood flow, and oxygen saturation can be obtained. When selective coronary arteriography is performed, radiopaque contrast material is injected from the catheter into the left main or right coronary artery. Cine recordings are made after the injection, and injections are repeated until the entire coronary tree is visualized. The location of an arterial obstruction can be identified, as well as the percentage of blockage (stenosis) (Figure 14-4).
More recently, additional physiological measures can be obtained that provide flow and pressure data at the site of the lesion within the coronary artery.53 These measures have become particularly important for monitoring outcomes after the administration of reperfusion therapy (e.g. thrombolytics, angioplasty, stenting).54,55 Coronary artery flow grades—for example, thrombolysis in myocardial infarction (TIMI) grades 0-3—are based on the visual analysis of the rate of opacification of the artery of interest, typically 90 minutes after intervention.54 TIMI myocardial perfusion grades (TMPG 0-3), or myocardial blush, grade the reperfusion of the myocardium by the contrast medium.55 Higher TIMI and TMPG grades have been associated with reduced mortality over 2 years.55
Pulmonary Imaging
Pulmonary angiography is used primarily for the diagnosis of PE. It is the gold standard with which ventilation/perfusion scans are compared.41 Contrast dye is injected into the pulmonary circulation through the pulmonary artery. Additional techniques such as balloon occlusion, segmental injections, or increased magnification improve the sensitivity of the test.40 Interobserver reliability studies performed on the interpretation of pulmonary angiograms are 83% to 86%.41
Echocardiography
Another noninvasive method of evaluating the heart uses the physical properties of sound. Echocardiography (sometimes simply called “echo”) provides information about blood flow, structure, and function of the heart. Motion mode (M-mode) and two-dimensional (2-D) images are highly reliable methods of evaluation. Recent developments of technique and technology include color flow Doppler echo, transesophageal echo, and intravascular echo. These techniques, when used in combination, can provide much of the information previously available only by cardiac catheterization.56,57 Echocardiography is an important tool in the assessment and management of patients with thoracic trauma.58
Physics of Echocardiography
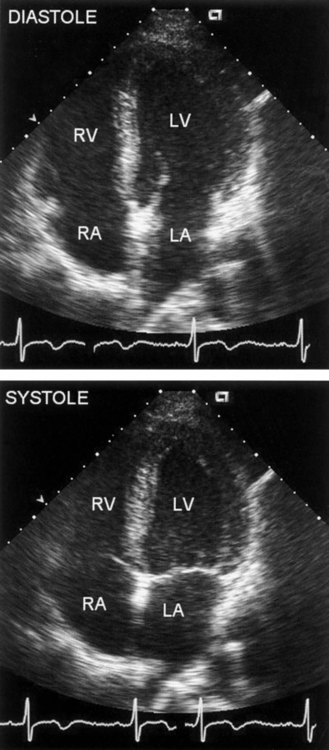
Imaging systems that use ultrasound require a source for generation of the sound wave, a transducer, and a receiver to pick up the reflected sound waves. Sound is absorbed or reflected differentially by specific tissues. Therefore the sound wave reflected from muscle differs from that reflected from vascular space, or valvular structures. Returning signals are converted into electrical signals that generate an image. This is the basis for M-mode and 2-D echo. In M-mode echocardiography, the transducer transmits a single sound wave through the chest wall (transthoracic echocardiography, or TTE). A thin slice of the heart, an “ice pick” view, directly under the sound wave, reflects the wave back to the transducer. M-mode, though useful when a high-resolution image is required, is rarely used.59 The primary diagnostic mode is 2-D. In 2-D echocardiography, the transducer is able to pick up a wedge section of the heart. In 2-D mode, the transducer acts as the transmitter and receiver. A “real time” two-dimensional picture of the heart is recorded on videotape. The heart can be viewed in motion, and wall motion can be evaluated (Figure 14-5).
Doppler Echocardiography
Doppler echocardiography relies on the Doppler effect to determine velocity. When a sound wave is aimed at moving objects, such as red blood cells, the known transmitted frequency from the soundhead and the reflected frequency differ, a phenomenon known as a frequency shift. The greater the frequency shift, the greater the speed of the targeted object.57 Velocity of flow is the term used to express Doppler frequency shifts. Both continuous-wave and pulsed-wave Doppler modes are used.
Color flow Doppler echocardiography was introduced in the mid-1980s. It is usually superimposed on a two-dimensional image in real time but can be used with M-mode. It is a method that displays anatomical and spatial blood flow velocity estimates with indication of flow direction in real time.60 Color is matched based on the direction of flow, and shading is indicative of intensity based on the mean velocity flow estimates.60 It is primarily used to assess the extent of regurgitant jets across “leaky valves,” as well as to indicate areas of abnormal shunts such as atrial septal defects. Turbulence created by narrowed valves creates wide color shading.
Measurements Derived from Echocardiography

These measurements allow calculation of stenotic valve gradients and right-sided filling pressures, valve regurgitation, and shunt volumes.57 Valve regurgitation and shunt calculations are more complicated than the Bernoulli equation alone.

where V1 is the velocity of flow at one side of the valve, V2 is the flow velocity at the other side of the valve, and A is the cross-sectional area.57
Exercise Studies
Exercise echocardiography can be done immediately following physiological stress (treadmill or bicycle exercise) or pharmacological stress (dipyridamole, adenosine, or dobutamine). Pharmacological stress offers the advantage of the patient being in a stable position throughout the test. If monitoring during physiological stress conditions is desired, the bicycle test, in the semirecumbent or supine position, is preferred because imaging cannot be performed during a treadmill test.61
Transesophageal Echocardiography
Because of consistent technical difficulties with TTE, the technique of transesophageal echocardiography (TEE) was developed to improve spatial resolution. TEE can obtain M-mode, 2-D, 3-D, and color flow Doppler images by using a small probe mounted on the tip of a modified gastroscope. TEE is considered minimally invasive. The probe is advanced into the esophagus, similar to placement of a gastric tube by nasal or oral route, and positioned so that multiple views of the heart are available.62 For cardiac output measures, it is advanced to the midthoracic level.63 The technique can be performed on anesthetized patients during surgery and monitored postoperatively; on mildly sedated patients (e.g., those on mechanical ventilation or trauma patients in the intensive care unit); and on those suspected of having aortic dissection or aortic injury.58 TEE is frequently used for diagnosis of congenital heart disease, evaluation of valve function, and determination of thromboembolic risk. It has become an important monitoring tool during cardiac catheterization procedures and surgery.64
TEE is used to assess cardiac valve function as well as to monitor treatment. Image quality of TEE is better than that of TTE. This is especially true when visualizing the mitral valve, because of the proximity to the transducer (valves positioned farther from the transducer afford lower-quality images).65 It is used to monitor prosthetic valve function, as well as to diagnose and monitor infective endocarditis, particularly the status of valve vegetation. TEE provides superior visualization (compared with TTE) of the left atrium and left atrial appendage, which are often the source of thrombi causing transient ischemic attack (TIA) or stroke. TEE Doppler studies can examine left atrial flow velocities, which also indicate increased stroke risk. TEE Doppler has been successfully used to decrease morbidity and length of stay when hemodynamic management of the patient is critical.63 TEE has now progressed to 3-D real-time imaging, which allows for improved imaging and quantification of LV function, including preload, afterload, and contractility.65
Myocardial Contrast Echocardiography
The ability of echocardiography to evaluate myocardial perfusion was historically based on observation of wall motion abnormalities. The development of a contrast agent that can be used with echocardiography has ushered in noninvasive techniques that do not rely on radioactive agents (see Figure 14-3). In myocardial contrast echocardiography (MCE), microbubbles of air encapsulated in a thin shell are introduced by IV infusion or bolus injection into the venous system as the contrast agent.66 These small bubbles (<6-10 µm) oscillate when exposed to ultrasound energy and produce harmonic signals (a multiple of the ultrasound frequency) that are then used to produce the images.67 Although numerous studies have shown the potential benefit of MCE for bedside and stress perfusion imaging, the FDA has not approved it for this use.68
Computed Tomography
Computed tomography (CT) was first developed in the 1970s, allowing the visualization of cross-sectional views of body organs, as opposed to the planar views possible with standard radiographs.69 Further technological developments in CT have made possible such rapid scan times that CT of the respiratory system can be completed in a single breath-hold, resulting in scans of improved spatial resolution and diagnostic utility.70 Electron beam CT has found application in the examination of the cardiac system and is currently used as part of risk stratification for asymptomatic patients.71
Physics of Computed Tomography
A computed tomographic scan (CT scan) acquires images of a fixed thickness (a cross-sectional slice), which allows examination of a specific part of the body. CT scanners use an x-ray source, collimators, x-ray detectors, and computers to reconstruct the cross-sectional images from the acquired data.69 The x-ray source rotates around the patient, the speed of rotation dictating how long it takes to acquire a single slice (about 1 second). Slice thickness and the space between slices determine the quality of the spatial resolution of the images. The spatial resolution required depends on the type of tissue being examined and the suspected diagnosis. Imaging can be done with a single-detector or newer multiple-detector row scanners (4, 8, or 16 rows).72 Multidetector CT (MDCT) scanners allow for faster acquisition of images. Spiral CT scanners simultaneously rotate the source and move the table and patient for continuous data acquisition and improved resolution.73 The most rapid scanning times are achieved by electron beam computed tomography (EBCT), also called ultrafast CT. EBCT uses an electron gun to generate x-rays to a fixed tungsten “target.”71 The electron beam is electronically moved, rather than mechanically rotated, resulting in images that can be made in milliseconds. The cost and the limited number of available EBCT scanners are factors that limit their routine use.72
Cardiac Imaging
Electron-beam tomography is currently used to identify calcium in atherosclerotic plaques within the coronary arteries.71 A scoring system developed to quantify the amount of calcium in the coronary arteries is used to identify future risk of cardiac events.71 Scores are based on Housenfeld units (HU), which are based on the tissue attenuation factor. Calcified areas are identified in the coronary tree and given scores based on HU > 130. Scores are summed across all identified lesions (Agatston method) to provide a total coronary calcium score.74 In general, the greater the amount of calcium detected, the greater the amount of atherosclerotic plaque in the coronary arteries. A limitation of EBCT is that it cannot localize the plaque anatomically. Sensitivity and specificity for EBCT for CAD is 91% and 49%, respectively.71 Research is currently being done to determine whether EBCT tests adds valuable data to cardiac risk assessment.75 In a sample of nearly 9000 asymptomatic low- to intermediate-risk middle-aged adults, the relative risk for a cardiac event significantly increased at higher quartiles of calcium scores.75 However, it is not recommended for screening in asymptomatic patients or for patients at high pretest probability for CAD.76,77 Cardiac CT has been deemed appropriate for symptomatic individuals with low to intermediate pretest probability of significant coronary stenosis or pre-operative evaluation in low-risk patients.77 A particular strength of CT is its ability to image cardiac structure and ventricular function.77
Pulmonary Imaging
Compared with standard radiography, CT is not commonly used in the initial diagnosis of pulmonary disease. However, the CT scan has been found to be a useful first-line diagnostic tool in the evaluation of mediastinal disease, including mediastinal masses, staging of mediastinal cancers, and identification of cysts.40
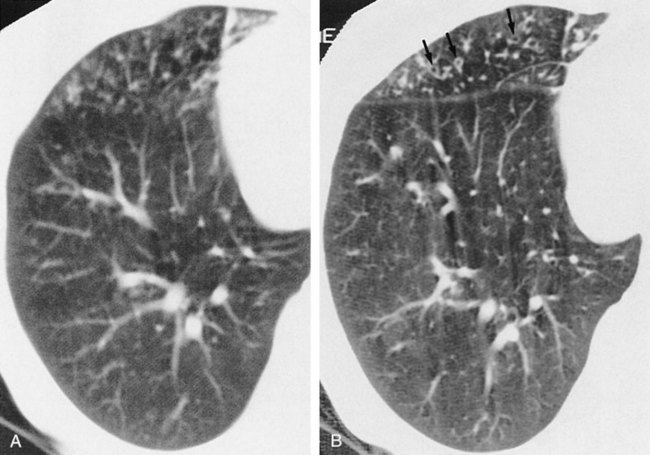
High-resolution computed tomography (HRCT) has improved the documentation of morphological changes associated with chronic airflow obstruction. Webb’s 1994 review78 of the application of this new technology identified the utility of this test in a variety of obstructive diseases. HRCT is sensitive in the diagnosis of early emphysema, although it is rarely used clinically. In cystic disease, such as histiocytosis X and lymphangiomyomatosis, HRCT is able to demonstrate cysts less than 10 mm in diameter and can also visualize wall thickness.
In the diagnosis of bronchiectasis, HRCT demonstrates a high specificity (Figure 14-6) and is the procedure of choice after standard chest radiography. It can discriminate among the three different types of abnormal bronchi seen in bronchiectasis (cylindrical, varicose, and cystic); however, there is little clinical significance in this distinction.78 HRCT can be used to differentiate lymphangitic spread of cancer versus heart failure when that distinction is clinically unclear. It also can be used to evaluate clearing of persistent pneumonias. Overall, HRCT has helped clarify disease morphology, but its clinical significance for diagnosis and for patient pulmonary function is less clear.
Spiral CT, with and without a contrast agent, has become the test of choice in the diagnosis of acute pulmonary embolism.79 Multidetector scans (>4 detectors) provide sensitivity and specificity >83% and 89% respectively.79 The combination of CT and V/Q scans provide examination of lung function (V/Q) and structure (CT) which may surpass CT alone for diagnosis of PE.80 Hybrid cameras that can perform both V/Q SPECT and CT will increase utilization of these scans. Future applications may be seen in planning radiation therapy of the lung and lung volume reduction surgery.81
Magnetic Resonance Imaging
Technically, MRI, which was adopted clinically in the 1970s, uses nuclear magnetic resonance to build tissue images—that is, nuclei are made to resonate in a magnetic field.82 However, since MRI is a technique that does not use radiopharmaceuticals or ionizing radiation, it was thought to be less confusing to leave “nuclear” out of the name. Thus MRI is a noninvasive, test that involves no exposure to radiation and is able to provide high quality imaging without the use of contrast dyes. Furthermore, with the development of ultrafast imaging, MRI has found utility for the examination of the cardiovascular and pulmonary systems.
Physics of Magnetic Resonance Imaging
MRI relies on the creation of a stable, powerful magnetic field that causes hydrogen (also carbon-13, fluorine-19, and sodium-23) nuclei to align with the field. A radiofrequency pulse specific to the hydrogen (or other) nuclei causes the nuclei to resonate.82,83 Additional magnets that apply magnetic fields of different gradients are used to locate the image. When the radiofrequency is turned off, the nuclei release the stored energy. This energy is analyzed via Fourier transformation, which results in the image. The images are highly dependent on the timing and magnitude of the radiofrequency.84 Data acquisition can take 20 to 90 minutes, during which the patient must remain immobile. Application of MRI to the cardiac and pulmonary system was initially limited by the continuous movement of the heart and lungs, but the development of ultrafast imaging has overcome some of these problems.85 Contrast materials such as gadolinium diethylenetriamine pentaacetate (Gd-DTPA) can be used to enhance signal intensity.
Cardiac Imaging
MRI is a useful technique in evaluating cardiac structures. It can identify cardiac masses and is the modality of choice for evaluating the pericardium. MRI is still secondary to CT in evaluating the mediastinum and detecting CAD.84,86 Coronary artery imaging is still problematic due to cardiac motion.87 Cardiac images from MRI do allow the measurement of right and left ventricular volumes, ejection fraction, and cardiac output.82, 87 MRI is able to detect tissue composition such as myocardial fat infiltration and identification of myocardial edema caused by inflammation or ischemia.87 Data collection of the heart requires the use of different testing sequences and specialized equipment to capture the beating heart.87
Tests to Evaluate Myocardial Perfusion
Contrast agents such as Gd-DPTA can be used in stress MRI studies to examine perfusion defects in the myocardium.72 Cardiac MRI is able to characterize blood flow, as well as uptake and washout of the contrast agent. Unlike other modalities, cardiac MRI can distinguish tissue layers, enabling identification of areas of subendocardial or transmural defects.72 MRI can also identify areas of myocardial edema, which is the result of ischemia. This allows identification of at risk areas which will benefit from reperfusion interventions. 87
Tests to Evaluate Myocardial Viability
The viability of cardiac tissue can be examined with MRI, using delayed contrast enhancement Gd-DPTA as the contrast agent.82 Images are taken 10 minutes after the intravenous administration of the agent. An inversion time pulse sequence allows the normal myocardial tissue to fade and the infarcted or scar tissue to be enhanced.
Pulmonary Imaging
Evaluation of the lung parenchyma presents unique problems because of respiratory movement, low proton density, and the air-tissue interface.85 The development of ultrafast imaging pulse sequences, called dynamic MRI, has improved the utility of this noninvasive test for evaluation of the pulmonary system. Contrast agents such as Gd-DTPA are used to perform MR angiography to diagnose pulmonary embolism.88 The use of MRI to provide noninvasive evaluation of PE has application in special cases, where typical tests are inconclusive.88 Without contrast, dynamic MRI is being used to study biomechanical function of the diaphragm and chest wall in patients with and without pulmonary disease. These studies are important for patients undergoing lung volume reduction surgery.89
The use of gaseous contrast agents such as hyperpolarized helium-3 (HHe-3), with dynamic MRI and lung motion correction, is a promising new development that allows examination of gas distribution in the lungs.85, 90 These studies have shown that dynamic MRI with contrast HHe-3 contrast can discriminate healthy lung grafts from native diseased lung in transplant patients85 and identify ventilation defects that correlate with decreased FEV1 in patients with asthma.90
Bronchoscopy
Bronchoscopy is often used as both a diagnostic and a therapeutic treatment modality.91 It allows direct visualization of the trachea and its major subdivisions. Fiberoptic bronchoscopy has virtually replaced bronchography.40 In fiberoptic bronchoscopy, a flexible tube is inserted into the trachea of mildly sedated patients. This tube is able to enter small bronchial subdivisions. Secretions can be removed for evaluation or as a treatment. It is also possible to obtain biopsy samples using tiny forceps or cell brushings. Bronchoscopy is particularly important in the diagnosis of bronchogenic carcinoma.92
[/level-membership-for-cardiovascular-category][not-level-membership-for-cardiovascular-category]
Special Tests
The medical workup of a patient with cardiac or pulmonary disease uses many tools. The patient interview, physical examination, chest x-ray, and electrocardiogram (ECG) can provide adequate information to make a diagnosis. However, when the diagnosis remains unclear, special tests that use more complex technology are required. These special tests may be invasive or noninvasive. Current clinical practice guidelines recommend that noninvasive tests be performed before invasive tests such as angiography.1 Nuclear medicine offers a variety of noninvasive tests for evaluation of cardiac and pulmonary function. Echocardiography, which is particularly useful in children, is another noninvasive method that provides information about the cardiovascular system, including valve function, ventricular performance, and estimation of filling pressures. In comparison with cardiovascular tests, special tests of the respiratory system are less commonly required in the initial diagnosis and treatment of disease. The generally high-quality information obtained from standard x-ray examination in combination with the patient’s respiratory symptoms, pulmonary function tests, and the results of the physical examination is usually sufficient, making special tests unnecessary.2–4
Various factors are involved in the decision of which special tests may be beneficial for a patient. These tests afford different benefits to patients in terms of diagnostic and prognostic accuracy (Table 14-1). Radiation exposure is an additional factor in selection of tests. These tests have helped to clarify our understanding of the physiology and pathophysiology of the cardiovascular and pulmonary system. Therapists need to understand the pathophysiological basis for a patient’s movement dysfunctions to select the most appropriate treatment strategies. Many special tests can and are being used in research to evaluate treatment interventions. For example, radiolabeled aerosols are used to evaluate mucociliary clearance, providing a method to evaluate the effectiveness of pulmonary hygiene techniques.5 Clinically, physical therapists need to use information from the tests to develop a framework for predicting how the patient may respond to a physical therapy intervention. For example, nuclear imaging can provide information about left ventricular ejection fraction. This information helps the therapist determine whether the patient should be stratified into high-risk or low-risk categories. Monitoring of an exercise session may depend on the risk level, and the therapist’s interpretation of the patient’s response to treatment may be affected by this information.
Table 14-1
Tests Used for Diagnosis and Prognosis in Ischemic Heart Disease
| Test Type | Sensitivity* | Specificity* | Predictive Accuracy* |
| Exercise ECG | 68% | 77% | 73% |
| Duke treadmill score | – | – | 80% |
| Thallium-201 perfusion scan | 85% | 85% | 85% |
| Technetium-99m sestamibi/SPECT | 88% | 72% | 80% |
| Adenosine SPECT | 90% | 82% | 85% |
| Exercise echocardiography | 85% | 81% | 80% |
| Dobutamine echocardiography | 88% | 84% | 86% |
| Computed tomography: electron beam computed tomography (EBCT) calcium score | 60% | 70% | 65% |
*Data vary according to studies included and characteristics of patient group studied (e.g., number of coronary vessels involved).
From Kones R: Recent advances in the management of chronic stable angina. I: Approach to the patient, diagnosis, pathophysiology, risk stratification, and gender disparities. Vascular Health and Risk Management 6:635-656, 2010.
Nuclear Imaging Systems
Physics of Nuclear Imaging
Radionuclide imaging allows for the noninvasive acquisition of images from a variety of body tissues. An imaging system requires three basic parts. The first requirement is a radiopharmaceutical that emits gamma radiation and is taken up by the body tissue of interest. Next, a radiation detector or camera is needed. Finally, computers are required to collect and analyze the data. Thus an image is formed based on the brightness of the tissue, which is proportional to the radiation the tissue has absorbed.6
Radionuclides are elements that are unstable; they gain stability by emitting particles or photons. This is called radioactive decay, and gamma radiation is released. Radionuclides are either cyclotron- or generator-produced. The cyclotron accelerates alpha-particles, deuterons, and protons to energies suitable for the production of the required radionuclide.7 A radionuclide generator is a system of a long-lived parent radionuclide which decays to produce a daughter radionuclide. The system is constructed so that the daughter can be removed (called “milking” the generator) for patient use.8 A generator system produces short-lived radionuclides.7
Detection of the radioactive energy emitted by a specific radiopharmaceutical requires a camera. When certain materials are struck by ionizing radiation, light is emitted. A scintillation detector detects this light (Figure 14-1). A gamma camera (a scintillation detector) is able to detect photons exiting the body. It uses a large, collimated crystal monitored by an array of photomultiplier tubes.9 A collimator is a device that allows only those photons traveling in an appropriate direction to reach the crystal. There are several types of collimators: parallel-hole collimators (most common), pinhole collimators, and converging and diverging collimators. The photomultiplier tube records the amount of light from the crystal and converts it into a voltage that is proportional to the intensity of the light.9 The camera system is connected to a computer that stores the light images. The computer is able to derive two-dimensional images from the data. The newer software algorithms that construct the images have improved, allowing for better spatial resolution, contrast, and overall image quality.10
Planar Imaging
A single crystal camera produces a two dimensional or planar image. Multicrystal cameras also produce planar images but are also able to perform fast, dynamic imaging used in first pass and gated studies. Planar images are unable to reflect the depth of an image.6 Planar imaging may be the only option available for obese patients who do not “fit” the single-photon emission computed tomography (SPECT) camera or for those who cannot remain immobile.11
Single-Photon Emission Computed Tomography Imaging
The most common nuclear study of myocardial perfusion is SPECT imaging.12 Planar images or tomographs are collected by rotating the scintillation detectors (single-, dual-, or triple-head scintillation cameras) around the patient, taking images at 3-degree increments.10 SPECT images allow for quantification of radioactivity.6 However, attenuation artifacts (absorption of the radioactive energy by other body tissues, preventing the camera from detecting it) are greater than with planar images, particularly those images involving the inferior wall of the heart in men and the anterior wall in women, and may produce false-positive scans.13 Quality of the images is dependent on the use of stringent quality control measures and experience of the staff. The most commonly used radionuclides are thallium-201, technetium-99m-sestamibi, and technetium-99m-tetrofosmin.14 Image quality is also patient-dependent. Patients must be able to lie perfectly still for 15 to 20 minutes, with their hands over their heads, while data are collected. Newer systems allow for a 50% reduction in duration of the scan as well as reduced processing time.10 Currently available systems also allow for seated positioning.10
Positron Emission Tomography
Positron emission tomography (PET) uses positron-emitting radionuclides. The images obtained by PET can provide information regarding cellular processes in living tissue. Both cardiac and lung tissue can be quantitatively examined to obtain information on metabolism, blood perfusion, tissue viability, autonomic regulation, and other processes.15,16 PET is valuable in delineating myocardial areas with reversible and irreversible injury, thus assessing the feasibility of revascularization, in patients with CAD or left ventricular dysfunction.17 PET studies use short scanning times (5-35 minutes) and because of the short half-life of PET tracers, multiple scans can be repeated in a relatively short period of time.18 Although PET scans offer superior imaging, in part due to greater correction for attenuation artifact,18 PET’s technological complexity, short-lived radio tracers, and specialized equipment have resulted in high costs and more limited clinical application.15 However, because of increased PET use in oncology imaging, opportunities for imaging of the cardiorespiratory system are now increasing.15,19 Current FDA-approved PET nuclides are rubidium-82 (82-Rb), 13N-ammonia (13-NH3), and fluorine-18-fluorodeoxyglucose (18F-FDG).15
Nuclear Tests of the Cardiovascular System
First-Pass and Gated Equilibrium Scans
In a first-pass study, data are collected on a radiolabeled bolus of blood as it passes through the cardiac chambers, which is one method of radionuclide angiography. A first-pass scan allows for clear identification of the four cardiac chambers. During first-pass studies, data are collected over several cardiac cycles. Gated equilibrium studies or multiple-uptake gated acquisition (MUGA) scans average several hundred cardiac cycles. Each R wave of the ECG triggers the acquisition of data; thus the average cycle observed is the compilation of many cycles.20 The quality of the image is best when the patient has a stable sinus rhythm. Patients with irregular heart rates, such as atrial fibrillation, have images of poorer quality.
Exercise Stress Studies
Many of the tests performed using radionuclides are coupled with an exercise test. A treadmill exercise test is performed, and at the peak of exercise, a tracer is injected. Shortly afterward, depending on the tracer, images are acquired. Exercise imaging enhances the identification of ischemic areas. These tests are then often compared with rest studies. Rest/stress or stress/rest protocols can be used.14
Nuclear-Derived Measurements
The most important of these measurements, the ejection fraction (right and left ventricle) is a measure of myocardial function. It is derived from quantitative counts of the ventricular area during diastole and systole:20
Left ventricular ejection fraction (LVEF) has been shown to be predictive of mortality. LVEF normally ranges from 50% to 85%, whereas LVEF below 40% indicates moderate-severe congestive heart failure.21,22 LVEF is linearly related to mortality up to 45% EF23 and inversely related to moderate- to large-sized infarcts.24 Right ventricular ejection fraction (RVEF) has been found to have a wide range of normal values (35% to 75%)25 but is not as predictive of function without data about wall motion abnormalities. The strongest radionuclide predictor of outcome is the exercise LVEF. In terms of predicting outcome, multivariate analysis of clinical data, catheterization data, and radionuclide measurements have shown that the radionuclide results (exercise LVEF, resting end-diastolic volume, and change in heart rate [HR]) have the same prognostic power as the catheterization data.26
Another important measurement is wall motion. Quantitative and qualitative evaluation of the movement of the myocardium can be made. Wall thickness and wall movement are compared during systole and diastole. Assessments are made about akinesia (absence of wall motion), global or regional hypokinesia (reduction of wall motion), and dyskinesia (outward bulging of the wall during systole).27 Global left ventricular function is a strong predictor of survival. It can help clinicians differentiate a weak heart from one that is stiff, thus allowing the appropriate treatment. Regional wall function, when correlated with knowledge of coronary artery anatomy, allows for the identification of potential blockages or areas of infarct. Assessing wall thickness can provide information about hypertrophy or aneurysm but is done more reliably by echocardiography.
Infarct size is an important measurement because it predicts short-term mortality. It is also important as a clinical endpoint in determining the effectiveness of reperfusion strategies and pharmacological interventions, which should result in a decrease of infarct size.28 The size of a myocardial infarct can be estimated by using the measurements previously described (i.e., ejection fraction, end-systolic volume, and global or regional wall motion).28 Perfusion defects of the myocardium can be measured acutely, after intervention, or during recovery.
Anatomical measurements of chamber size can be made. From these data, chamber volume can be calculated, as well as stroke volume and cardiac output (Table 14-2).
Table 14-2
Summary of Special Tests of the Cardiopulmonary System
| Cardiac Tests | ||
| Specific Tests | Clinical Findings | |
| Nuclear imaging | Planar, SPECT, MUGA, First pass Common isotopes: 201-Thallium, 99m-Technitium sestamibi, 99 Technitium-tetrofosmin |
Evaluates myocardial perfusion, used in exercise stress studies and to assess reversibility of defects. Quantitatively can be used to determine: ejection fraction (EF), stroke volume (SV), cardiac output (CO), regional function, ventricular volumes, intracardiac shunt, valvular regurgitation. |
| PET Scans Common isotopes: 82-rubidium 13-N-ammonia,15-O labeled water, and 18-fluorine-fluorodeoxyglucose (18F-FDG) |
Quantitatively assesses cell activity of living tissue. Has ability to assess glucose (18F-FDG) and oxidative metabolism, perfusion and potential for revascularization. | |
| Echocardiography | M-mode; 2-D; transespophageal (TEE); Doppler; myocardial contrast echo (MCE) | Evaluates myocardial structure. 2-D used in exercise stress studies. 2-D Quantitatively measures: chamber size, wall thickness, valve structure TEE and function, pressure and flow through valve, valve area, EF. |
| Computed tomography (CT) | Electron-based CT (EBCT) | Identifies calcium concentration in tissues, which is related to the amount of atherosclerotic plaque. |
| Magnetic resonance imaging (MRI) | MRI with contrast (Gandolium-DTPA) | Identifies ventricular volumes, EF, CO. Contrast imaging can be used to identify perfusion defects, flow, areas of infarction. |
| Angiography | Quantitative measures of pressure, resistance, flow, oxygen consumption, arteriovenous oxygen difference EF, CO | |
| Pulmonary Tests | ||
| Specific Tests | Clinical Findings | |
| Pulmonary scans | Perfusion scan Common isotopes: MAB |
Identifies regions of decreased pulmonary perfusion, used to identify pulmonary embolism. |
| Ventilation scan Common isotopes: 99m-Tc -DTPA |
Identifies regions of decreased ventilation. Used in conjunction with 133-Xe perfusion scan to identify patients with pulmonary embolism. | |
| Gallium scan | Identification of neoplastic or inflammatory pulmonary lesions | |
| PET Scans Common isotopes: 18F-FDG |
Aids in differential diagnosis of solitary pulmonary nodules, inflammation and malignant lesions. | |
| Computed tomography | High-resolution CT; spiral CT | HRCT used in the diagnosis of bronchiectasis; spiral CT can be used to diagnose PE. |
| Magnetic resonance imaging | Dynamic MRI Gd-DTPA contrast |
MRI with contrast used for MR angiography; dynamic MRI used in workup of lung transplant to examine ventilation, pulmonary mechanics |
| Angiography | For diagnosis of PE | |
Myocardial Perfusion Imaging
Perfusion of the myocardium is a vital factor in the viability and function of the heart. Information about myocardial perfusion is used for diagnostic decisions, treatment decisions, and prognosis. Perfusion of the myocardium under rest and exercise conditions is important in the diagnosis of CAD. For those patients with left ventricular dysfunction, identifying tissue that is viable but still at risk is critical for improving long-term outcomes. The efficacy of reperfusion strategies, such as angioplasty and thrombolytic therapy, must be evaluated. Information gained from combined perfusion and metabolic studies has helped to increase the understanding of ischemic myocardium. Two types of contractile dysfunction have been delineated. Hibernating myocardium is the result of prolonged ischemia. In this case, the contractility of the muscle fiber is affected so that there may appear to be regional wall motion abnormalities. The tissue is alive but not contracting. It is theorized that this is a measure to reduce energy expenditure and ensure myocyte survival. The second condition, myocardial stunning, occurs under conditions of acute ischemia. In this case, contractile dysfunction that initially occurs during the acute ischemic episode persists for some time after perfusion has returned to normal. Both conditions are reversible. Patients demonstrating hibernating myocardium may benefit from revascularization procedures. Patients with stunned myocardium may only require supportive care until contractile function returns.29 The type of imaging performed and the specific radiopharmaceutical used provides similar but not necessarily interchangeable imaging results and measurements.14
Thallium-201
Thallium-201 (201-TL) is the oldest radioactive isotope used in myocardial perfusion studies.14 It is a cyclotron-produced isotope that emits low-energy radiation (68 to 80 kiloelectron volts [keV]). Thallium concentrations in the myocardium depend on 201-TL properties, uptake, and redistribution. Administered intravenously, its distribution throughout the body depends on blood flow, and within 5 minutes, myocardial uptake represents myocardial blood flow.30 The first-pass myocardial uptake coefficient is 85%.14 Extraction from the blood and transport across the cell membrane depend on active and passive transport mechanisms. Thallium is transported across the cell membrane through the sodium-potassium ATPase pump and facilitative diffusion.30 Normally perfused and functioning myocardium will take up the thallium tracer, while damaged cells will demonstrate weaker uptake. Within 15 minutes thallium begins washout (also called redistribution) in normal myocardium. Images taken 4-24 hours later show clearance of the 201-Tl, again as a result of normal blood flow, while abnormal cells have more tracer as it has not been washed out.30
Thallium-201 images can be qualitatively and quantitatively evaluated. Normally perfused myocardium demonstrates uniform uptake of the tracer. Uniform uptake can occur as long as blockages are less than 50% of the artery. Ischemic but viable myocardium initially appears as areas of decreased uptake; these areas fill in over time, a function of redistribution. Because blood flow is decreased, clearance of thallium-201 from the defect region is slower.30 In infarcted areas, these defects remain unchanged over time. Thus perfusion and tissue viability can be assessed with 201-TL. Qualitative evaluation requires visual inspection of the images. Quantitative evaluation is performed by specialized software individual to the imaging system used. The computer analyzes the amount of radioactivity taken up in a particular region of interest (ROI). It then quantifies this count so that regions can be compared with each other and with normalized data. In this way, unperfused or hypoperfused areas can be identified (Figure 14-2).
[/not-level-membership-for-cardiovascular-category]
