Cardiovascular and Pulmonary Physiology
This chapter reviews basic cardiovascular and pulmonary physiology. A thorough understanding of normal physiology provides a basis for understanding the deficits in cardiovascular and pulmonary function (in the context of limitation of activity and social participation, as well as structure and function) and the adaptations to changing physiological and pathophysiological demands. This knowledge provides the foundation for conducting a thorough assessment and prescribing treatment.1–8
Cardiovascular Physiology
Control of the Heart
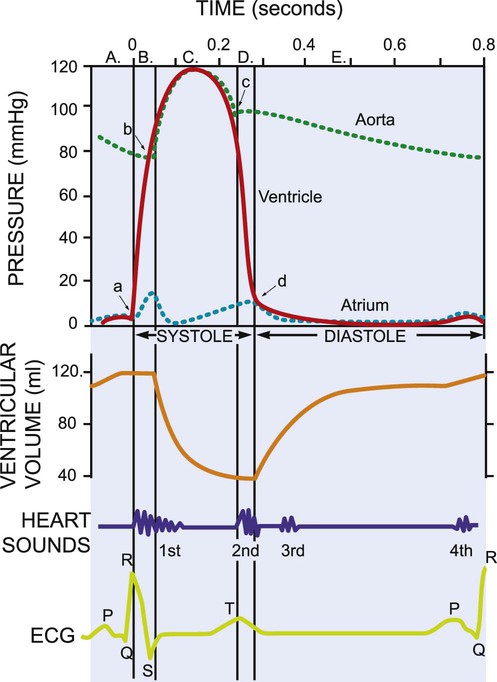
The mechanical activity of the heart is precisely regulated in accordance with the electrical activity of the heart to effect optimal cardiac output to the organs of the body.9,10 The electrical activity of the heart, based on electrocardiography, in both health and pathology, is described in detail in Chapter 12. The electrical and mechanical events of the cardiac cycle and their coupling (electromechanical coupling) are summarized in Figure 4-1. These events include the spread of the wave of electrical excitation throughout the myocardium; the resulting sequence of contraction of the atria and ventricles, followed by dynamic changes in blood pressure and volume in the heart chambers; the heart sounds; and the timing of these events. The cardiac cycle takes 0.8 second in a heart beating at 75 beats per minute. Ventricular systole or ejection takes about one-third of this time. Its onset and termination are marked, respectively, by the closing and opening of the atrioventricular valves (mitral and tricuspid). Diastole, or the period between successive ventricular systoles, in which the ventricles fill with blood, takes two-thirds of the 0.8 second of each cardiac cycle.
Volume and Pressure Changes
Changes in the ventricular volume curve and aortic pressure wave reflect changes in atrial and ventricular pressures during systole and diastole. The sequence of events appears in a flow chart in Figure 4-2. Pressure gradients within the heart are responsible for the opening and closing of the valves. Coordinated valve opening and closure are important to promote the forward movement of blood and prevent mechanical inefficiency of the heart pump resulting from valvular regurgitation of blood during ventricular contraction. Regurgitation of blood in the retrograde direction gives rise to heart murmurs that are audible on auscultation of the heart.
Peripheral Circulation
The purpose of the peripheral circulation, including the microcirculation at the tissue level, is to provide saturated oxygenated blood and remove partially desaturated blood. The microcirculation within each organ regulates the blood flow both exogenously, via the neurological system, and endogenously, via the humoral system, commensurate with the metabolic needs of that tissue bed (see Chapter 3). The four principal factors that determine the movement of fluid in the microcirculation are the following:
1. The capillary hydrostatic pressure from the blood pressure, which tends to move blood across the capillary membrane and out of the circulation into the interstitium
2. The capillary oncotic pressure from the proteins within the blood vessels, which tends to retain fluid in the circulation
3. The interstitial hydrostatic pressure, which tends to move fluid back into the circulation
4. The interstitial oncotic pressure, which tends to draw fluid out of the circulation and into the interstitium
The net forces acting on the capillary fluid are nearly in equilibrium, with a slight tendency for fluid to be filtered out of the systemic circulation into the interstitium. Box 4-1 illustrates the mean pressures that determine normal fluid dynamics across capillary membranes.
Transport of Oxygen
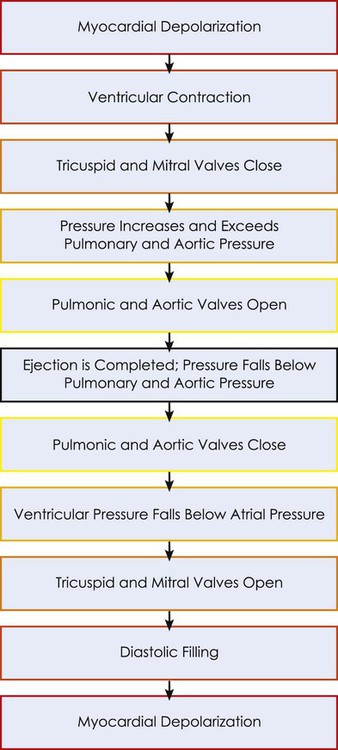
Once oxygen reaches the blood, it rapidly combines with hemoglobin to form oxyhemoglobin. A small proportion of oxygen is dissolved in the plasma. The use of the hemoglobin molecule as an oxygen carrier allows for greater availability and efficiency of oxygen delivery to the tissues in response to metabolic demand. Saturation of the oxygen-carrying sites on the hemoglobin molecule is curvilinearly related to the partial pressure of oxygen in the tissues. This relationship is called the oxyhemoglobin dissociation curve and is a sigmoid, or S-shaped, curve (Fig. 4-3). The hemoglobin of arterial blood is 99%, or almost completely saturated with oxygen. Under normal circumstances, arterial blood is mixed with a small proportion of venous blood from the coronary and pulmonary circulation, resulting in arterial saturation slightly less than 100%. The graph shows a range of partial pressures of oxygen that may exist in the tissues. At relatively high arterial oxygen pressures, the oxygen saturation is high. This reflects high association or low dissociation between oxygen and hemoglobin. Saturation does not fall significantly until the partial pressure of oxygen falls below 80 mm Hg. Even at PO2 levels of 40 to 50 mm Hg, arterial saturation is still 75%. This suggests that the oxyhemoglobin dissociation system has an enormous capacity to meet the varying needs of different tissues without severely compromising arterial saturation. A PO2 of less than 50%, for example, has a profound effect on arterial saturation. This demonstrates an adaptive response of hemoglobin dissociation to respond to low oxygen tissue pressures by greater dissociation of oxygen from hemoglobin as the need arises. As PO2 improves with increased supply of oxygen or decreased demand, the affinity between oxygen and hemoglobin increases, and arterial saturation increases. Thus oxygen is not released unless there is a need for greater oxygen delivery to the tissues.
Various conditions can increase or decrease hemoglobin’s affinity for oxygen and thereby cause a shift in the oxyhemoglobin dissociation curve (see Fig. 4-3). A shift to the right results in decreased oxygen affinity and greater dissociation of oxygen and hemoglobin. In this instance, for any given partial pressure of oxygen, there is a lower saturation than normal. This means that there is more oxygen available to the tissues. Shifts in the curve to the right occur with increasing concentration of hydrogen ions (i.e., decreasing pH), increasing PCO2, increasing temperatures, and increasing levels of 2,3-DPG (diphosphoglycerate), a byproduct of red blood cell metabolism. West suggests that “a simple way to remember these shifts is that an exercising muscle (increased metabolic demand), is acid, hypercapnic and hot, and it benefits from increased unloading of oxygen from its capillaries.”8
Cardiopulmonary Physiology
Ventilation
Ventilation is the process by which air moves into the lungs. The volume of air inhaled can be measured with a spirometer. The various lung capacities and volumes are defined in Chapter 9.
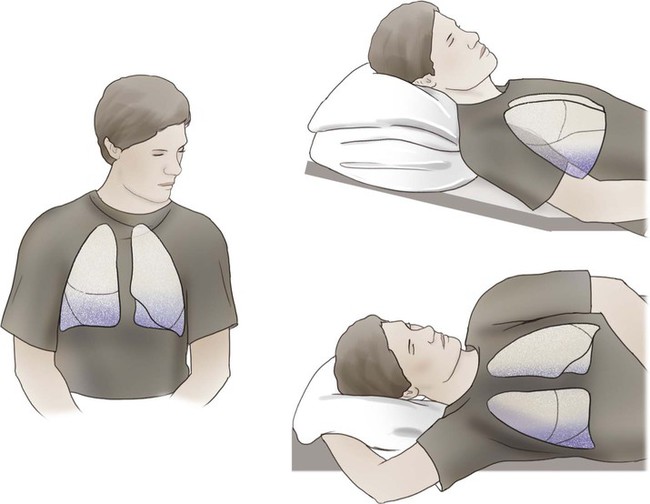
Regional differences in ventilation exist throughout the lung. Studies using radioactive inert gas with a radiation counter over the chest wall have shown that when the gas is inhaled by an individual in the seated position and measurements are taken, radiation counts are greatest in the lower lung fields, intermediate in the midlung fields, and lowest in the upper lung fields. This effect is position or gravity dependent. In the supine position, the apices and bases are ventilated comparably, and the lowermost lung fields are better ventilated than the uppermost lung fields. Similarly, in the lateral, or side-lying, position, the lower lung fields are preferentially ventilated compared with the upper lung fields (see Chapter 19).
Diffusion
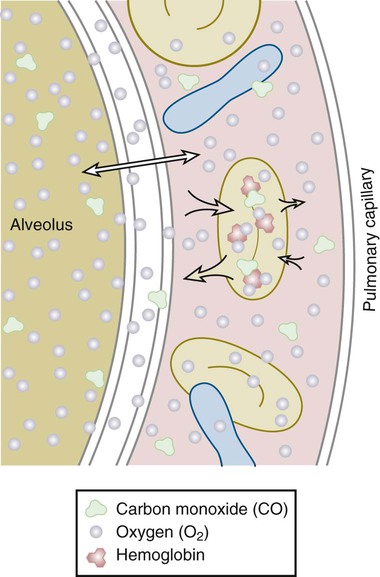
Once air has reached the alveoli, it must cross the alveolar-capillary (A-C) membrane (Fig. 4-4). Gases, specifically oxygen entering the lungs and carbon dioxide leaving the lungs, must cross through the surfactant lining, the alveolar epithelial membrane, and the capillary endothelial membrane. Oxygen then has to travel through a layer of plasma, the erythrocyte membrane, and intracellular fluid in the erythrocyte, until it encounters a hemoglobin molecule. This distance is actually small in normal lungs, but in disease states it may increase. The alveolar wall and the capillary membrane often become thickened. Fluid, edema, or exudate may separate the two membranes. These conditions are often first detected when arterial PO2 becomes chronically lower than normal. Oxygen diffuses slowly through the A-C membrane in comparison to CO2 diffusion. As a result, patients with diffusion problems frequently have hypoxemia with a normal PCO2. Sarcoidosis, asbestosis, scleroderma, and pulmonary edema are conditions that decrease the diffusing capacity of the gases. The capacity may also decrease in emphysema because of a decrease in total surface area for gas exchange.
Ventilation and Perfusion Matching
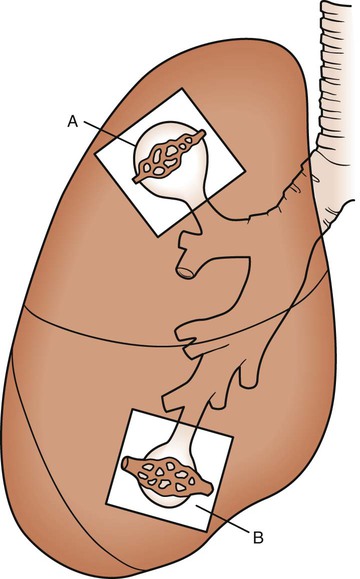
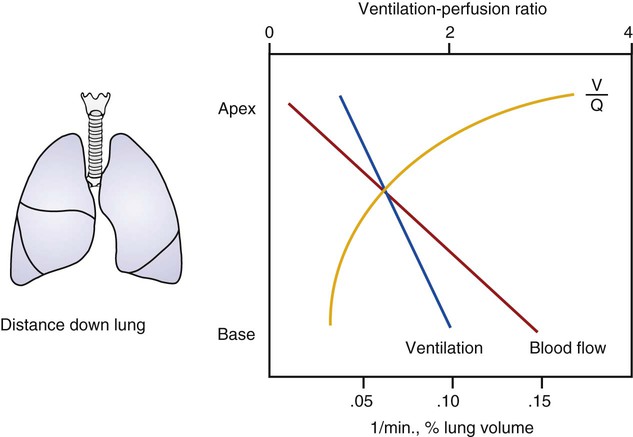
As discussed previously, gravity tends to pull blood into the dependent positions of the lung (Fig. 4-5). In erect humans, therefore, there is greater blood flow at the bases of the lung. In places, the arterial blood pressure exceeds the alveolar pressure and causes compression or collapse of the airways (Fig. 4-6). Blood flow to the apices is decreased because of gravity. Alveoli in this region are more fully expanded as a result of high transmural pressures and may further decrease blood flow by compressing blood vessels. It follows that the areas of optimal gas exchange occur where there is the greatest amount of perfusion and ventilation. This occurs toward the base of the lungs in erect humans. Changes in posture cause changes in perfusion and ventilation. Generally, greater air exchange occurs toward the gravity-dependent areas. In side-lying, there is greater gas exchange in the dependent lung (Fig. 4-7).
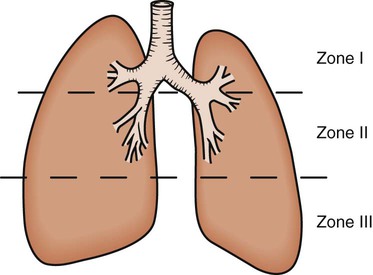
In normal lungs there is an optimal ratio, or matching of gas and blood. This ratio of ventilation to perfusion (V/Q) is 0.8 to maintain normal blood gas values of PO2 and PCO2. Therefore the lungs must be able to supply four parts ventilation to about five parts perfusion. When the ratio is not uniform throughout the lung, the arterial blood cannot contain normal blood-gas values. Regions with low ratios (perfusion in excess of ventilation) act as shunts, whereas regions with high ratios (ventilation in excess of perfusion) act as dead space (Fig. 4-8). Hypoxemia results if regions of abnormal V/Q predominate. An elevation in arterial PCO2 may also occur unless the patient increases ventilation.
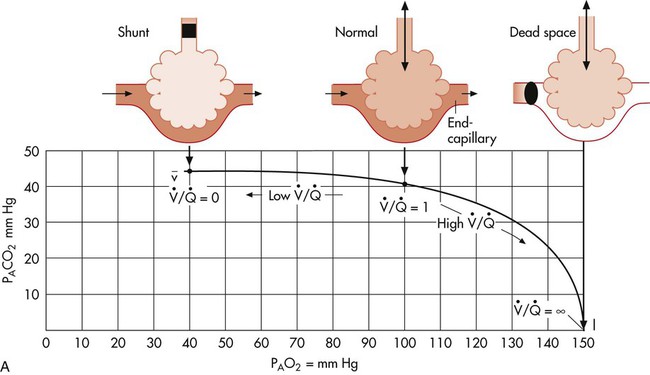
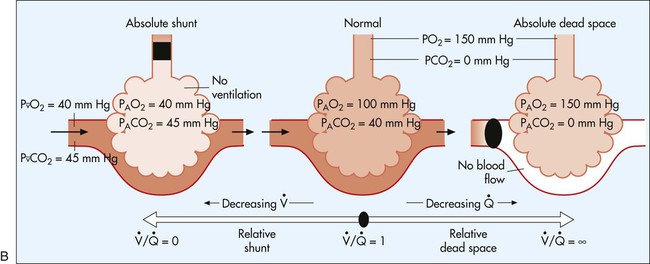
 represents mixed venous blood composition; ∞ represents inspired gas composition; I represents inspired tracheal gas composition. B, The shunt–dead-space continuum.
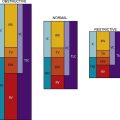
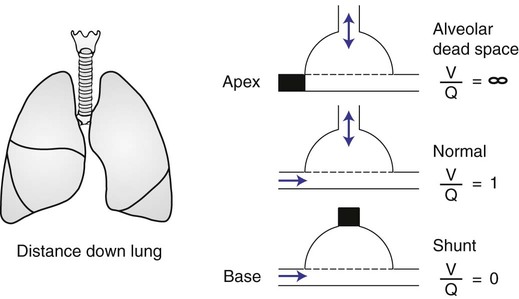
 The relationship of ventilation and perfusion in the lung is summarized in the following figures. Figure 4-9 shows increases in ventilation and perfusion down the upright lung. When optimal ventilation and perfusion match, V/Q occurs in the midlung zones. In the upright position, ventilation is in excess of perfusion in the apices, and perfusion is in excess of ventilation in the bases. Figure 4-10 illustrates the effects of shunt and physiological dead space on V/Q matching in the upright lung and shows their effect on alveolar gas. Specifically, Figure 4-10 shows a schematic representation of regional differences in ventilation and perfusion in the upper, middle, and lower zones of the upright lung. These gradients are reflected in the alveolar Po2 and Pco2 levels associated with alveolar dead space in the apices, appropriate V/Q matching in the midlung, and shunt in the bases.
Pulmonary Physiology
Control of Breathing
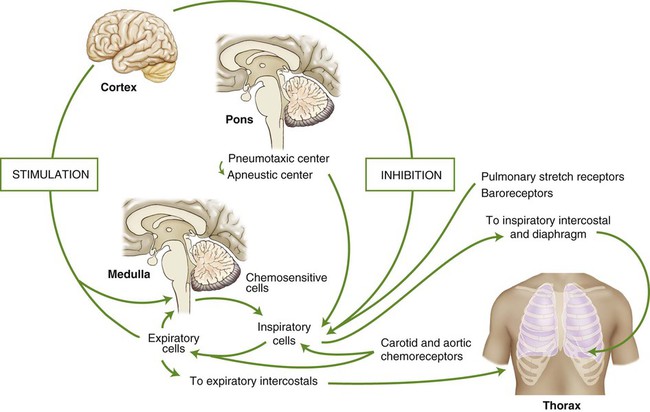
The act of breathing is a natural process to which most of us give little thought. Breathing unconsciously adjusts to varying degrees of activity while maintaining optimum arterial levels of PO2 and PCO2, whether we are resting or physically active. Sighing, yawning, hiccoughing, laughing, and vomiting are all involuntary acts that use respiratory muscles. Breathing can also be done under voluntary control. A person can stop breathing momentarily by breath holding or increase breathing by rapidly panting until he or she faints (from cerebral vascular constriction due to a decrease in arterial PCO2). Exhalation is used in singing, speaking, coughing, and blowing, whereas inspiration is used for sniffing and sucking. Parturition, defecation, and the Valsalva maneuver are all performed while voluntarily holding one’s breath. These activities are regulated by control centers located in the brain. The centers integrate a multitude of chemical, reflex, and physical stimuli before transmitting impulses to the respiratory muscles. The cerebral hemispheres control voluntary respiratory activity, whereas involuntary respiratory activity is controlled by centers located in the pons and medulla of the midbrain (Fig. 4-11).
Reflexes
Hering-Breuer Reflex
Stretch Reflex
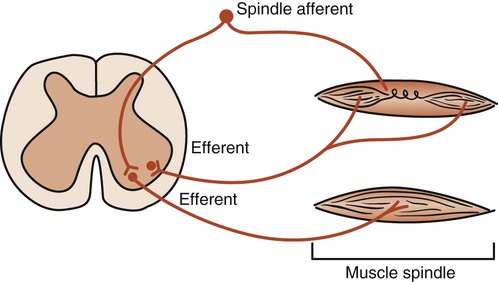
The intercostal muscles and the diaphragm contain sensory muscle spindles that respond to elongation. A signal is sent to the spinal cord and anterior horn motor neurons. These neurons signal more muscle fibers to contract (recruitment) and thus increase the strength of the contraction. Theoretically, such a stretch reflex may be useful when there is an increase in airway resistance or a decrease in lung compliance. Stretching the ribs and the diaphragm may activate the stretch reflex and help the patient take a deep breath. The fundamental pathways of the stretch reflex are shown in Figure 4-12. Research is needed, however, to establish the therapeutic role of proprioceptive neurofacilitation techniques based on stretch reflex theory in altering pulmonary function.
Mechanical Factors in Breathing
Resistance to Breathing
Compliance
The elastic recoil or compliance of the lung is also dependent on a surface fluid called surfactant, which lines the alveoli. This fluid increases alveolar compliance by lowering the surface tension, thereby reducing the muscular effort necessary to ventilate the lungs and keep them expanded. It is a complex lipoprotein that is produced in type II alveolar cells (see Chapters 2 and 4). A decrease in surfactant causes the alveoli to collapse. Reexpanding these alveoli requires a tremendous amount of work on the part of the patient. The patient may become fatigued and need mechanical ventilation. This occurs in respiratory distress syndrome in premature infants (previously called hyaline membrane disease) and in acute respiratory distress syndrome in adults. In another disease, alveolar proteinosis, there is excessive accumulation of protein in the alveolar spaces. This may be because of excessive production of surfactant or deficient removal of surfactant by alveolar macrophages.
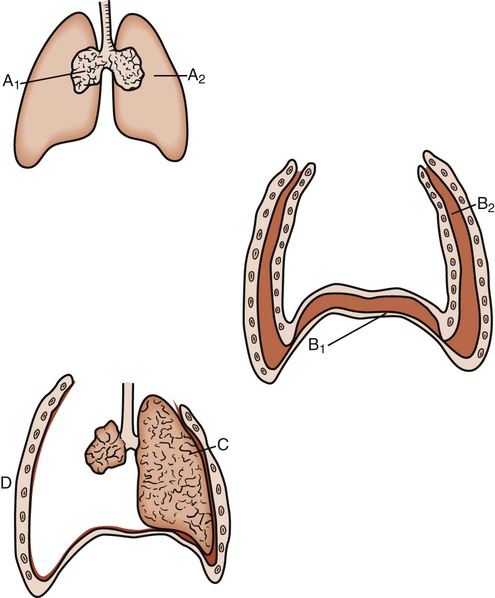
The elastic properties of the lungs tend to collapse them if not counterbalanced by external forces. The tissues of the thoracic wall also have elastic recoil, which causes them to expand considerably if unopposed. These two forces oppose each other, keeping the lungs expanded and the thoracic cage in a neutral position. If these forces are interrupted (as in pneumothorax), the lung collapses and the thoracic wall expands (Fig. 4-13). Similarly, the overinflated, barrel-shaped chest of a patient with chronic obstructive pulmonary disease (COPD) is caused by the elastic tension of the chest wall being unopposed by the usual elastic forces of the lungs, which have been damaged by disease.
Pressure-Volume Relationships
Pressure-volume curves help define the elastic properties of the chest wall and lungs. The elasticity of the respiratory system as a whole is the sum of its two major components, the lungs and the chest wall. The so-called relaxation pressure curve is shown in Figure 4-14. The curve illustrates the static pressure of the lungs and chest wall and the combination of the two measured at given lung volumes. Functional residual capacity (FRC) reflects the balance of elastic forces exerted by the chest wall and the lungs and has significant implications for the clinical presentation and management of patients with cardiovascular and pulmonary dysfunction.
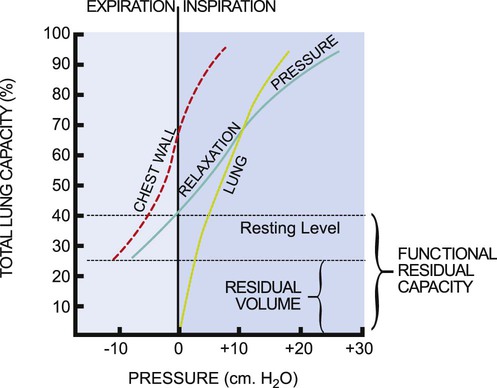
The relaxation pressure curve represents static pressure measurements. This means that the respiratory muscles are inactive, and the volume in the lungs at a given point in the respiratory cycle is determined by the balance of forces between the chest wall and the lungs. The chest wall and lungs exert elastic forces that oppose each other. The chest wall attempts to pull the lung out, and the lungs attempt to recoil and pull the chest wall in. The curves labeled “lung” and “chest wall” (see Fig. 4-14) are theoretical and illustrate the elastic force exerted by each when it is permitted to act unopposed by the other. Normally these two forces are exerted together, producing the pressure-volume relaxation curve. At FRC, these forces are in equilibrium; therefore this capacity constitutes the resting volume of the respiratory system.
In lung disease, the balance between chest wall and lung forces is disrupted.11 More work and energy are required to sustain the respiratory effort.12 The patient is less able to rely on normal elastic recoil of the chest wall, lungs, or both. Therefore the patient must expend more energy to effect equivalent respiration. The limits of respiratory excursion are determined by both elastic and muscular forces. At total lung capacity, the elastic forces of the respiratory system are balanced by the inspiratory muscle force. At residual volume, the elastic forces of the chest wall are balanced by the maximum expiratory muscle force. This volume excursion from total lung capacity to residual volume reflects vital capacity.
Although the curves representing the elastic forces of the lungs and chest wall are theoretical, they are helpful in understanding the effect of lung dysfunction on pulmonary function and on the clinical presentation of the patient.11 For example, in individuals with COPD, the characteristic barrel chest reflects the unopposed elastic forces of the chest wall as it succeeds in increasing the excursion of the chest as a result of reduced elastic recoil of the lungs. At the other extreme is the effect on the chest wall of a puncture wound, which disrupts the intrapleural pressure gradient that normally keeps the lung expanded and the chest wall contained. The result of such a puncture is to produce a pneumothorax in which the lung collapses down to the hilum and the chest wall springs outward (see Fig. 4-13).
Airway Resistance
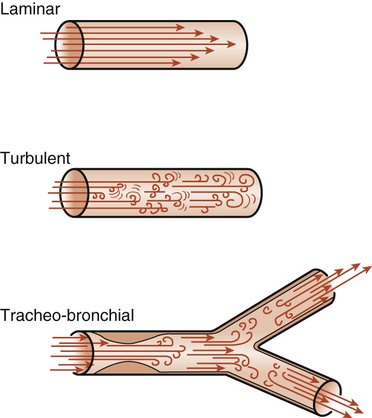
The flow of air into the lungs depends on pressure differences and on the resistance to flow in the airways. Resistance is defined as the pressure difference required for one unit flow change. The air passages are divided into upper and lower airways (see Chapter 3). The upper airways are responsible for 45% of airway resistance. The resistance to airflow by the lower airways depends on many factors and is therefore difficult to predict. The branching of the lower airways is irregular, and the diameter of the lumen may vary because of external pressures and because of the contraction or relaxation of bronchial or bronchiolar smooth muscle. The lumen diameter may also decrease as a result of edema or mucus. Any of these changes in the airway diameter may cause an increase in airway resistance. Flow of air through these airways can be either laminar or turbulent (Fig. 4-15). Laminar flow is a streamlined flow in which resistance occurs mainly between the sides of the tubes and the air molecules. It tends to be cone shaped, with the molecules in contact with the walls of the tubes moving more slowly than the molecules in the middle of the tube. Turbulent flow occurs when there are frequent molecular collisions in addition to the resistance of the sides of the tubes. This type of flow occurs at high flow rates and in airways where there are irregularities caused by mucus, exudate, tumor, or other obstructions. In normal lungs, airflow is a combination of laminar and turbulent flow and is known as tracheobronchial flow.