Severity of Illness Scoring Systems
SEVERITY OF ILLNESS ASSESSMENT AND OUTCOME PREDICTION
Selecting the Target Population
Using a Severity of Illness Score
Application of a Severity of Illness Score: Evaluation of Patients
ORGAN DYSFUNCTION/FAILURE SCORING SYSTEMS
Multiple Organ Dysfunction Score
Sequential Organ Failure Assessment Score
The goal of intensive care is to provide the highest quality of treatment in order to achieve the best outcomes for critically ill patients. Although intensive care medicine has developed rapidly over the years, there exists, still, little scientific evidence as to what treatments and practices are really effective in the real world. Moreover, intensive care now faces major economic challenges, which increase the need to provide evidence not only on the effectiveness but also on the efficiency of practices. Intensive care is, however, a complex process, which is carried out on very heterogeneous populations and is influenced by several variables, including cultural background and different structure and organization of the health care systems. It is, therefore, extremely difficult to reduce the quality of intensive care to something measurable, to quantify it and then to compare it among different institutions. Also, in recent years, patient safety as a necessary dimension in the evaluation of quality of the care provided has become mandatory, leading to major changes in the way benchmarking should be evaluated and reported.1
Although quality encompasses a variety of dimensions, the main interest to date is focused on effectiveness and efficiency: It is clear that other issues are less relevant if the care being provided is either ineffective or harmful. Therefore, the priority must be to evaluate effectiveness. The instruments available to measure effectiveness in intensive care derive from the science of outcome research. The starting point for this science was the high degree of variability in medical processes, which was found during the first part of the twentieth century, when epidemiologic research was developing. The variation in medical practices led to the search for the “optimal” therapy for each syndrome or disease through the repeated performance of randomized controlled trials (RCTs). However, the undertaking of RCTs in intensive care is fraught with ethical and other difficulties. For this reason, observational studies to evaluate the effects of intensive care treatment are still frequently employed and sometimes more informative than prior RCTs.2 Outcome research provides the methods necessary to compare different patients or groups of patients, especially different institutions. Risk adjustment (also called case-mix adjustment) is the method of choice to standardize the severity of illness of the individual or groups of patients. The purpose of risk adjustment is to take into account all of the characteristics of patients known to affect their outcome, in order to understand the differences due to the treatment received and the conditions (timing, setting, standardization) in which that treatment has been delivered. Conceptually, the quantification of individual patients should be made by the use of severity scores, and the evaluation of groups of patients is done by summing up the probabilities of death given by the model for each individual patient and its comparison with actual fatality.
Historical Perspective
Scoring systems have been broadly used in medicine for several decades. In 1953 Virginia Apgar3 published a very simple scoring tool, the first general severity score designed to be applicable to a general population of newborn children. It was composed of five variables, easily evaluated at the patient’s bedside, that reflect cardiopulmonary and central nervous system function. Its simplicity and accuracy have never been improved on, and any child born in a hospital today receives an Apgar score at 1 and 5 minutes after birth. Nearly 50 years ago Dr. Apgar commented on the state of research in neonatal resuscitation: “Seldom have there been such imaginative ideas, such enthusiasms and dislikes, and such unscientific observations and study about one clinical picture.” She suggested that part of the solution to this problem would be a “simple, clear classification or grading of newborn infants which can be used as the basis for discussion and comparison of the results of obstetric practices, types of maternal pain relief and the effects of resuscitation.” Thirty years later, physicians working in ICUs found themselves using the same tools and applying them in the same way.
Efforts to improve risk assessment during the 1960s and 1970s were directed at improving our ability to quickly select those patients most likely to benefit from promising new treatments. For example, Child and Turcotte4 created a score to measure the severity of liver disease and estimate mortality risk for patients undergoing shunting. In 1967, Kilipp and Kimball classified the severity of acute myocardial infarction by the presence and severity of signs of congestive heart failure.5 In 1974 Teasdale and Jennett introduced the Glasgow Coma Scale (GCS) for reproducibly evaluating the severity of coma.6 The usefulness of the GCS score has been confirmed by the consistent relationship between poor outcome and a reduced score among patients with a variety of diseases. The GCS score is reliable and easy to perform, but problems with the timing of evaluation, the use of sedation, inter- and intraobserver variability, and its use in prognostication have caused strong controversies.7 Nevertheless, the GCS remains the most widely used neurologic measure for risk assessment.
The 1980s brought an explosive increase in the use of new technology and therapies in critical care. The rapidity of change and the large and growing investment in these high-cost services prompted demands for better evidence for the indications and benefit of critical care. For this reason several researchers developed systems to evaluate and compare the severity of illness and outcome of critically ill patients. The first of these systems was the Acute Physiology And Chronic Health Evaluation (APACHE) system, published by Knaus and associates in 1981,8 followed soon after by Le Gall and colleagues with the Simplified Acute Physiology Score (SAPS).9 The APACHE system was latter updated to APACHE II,10 and a new system, the Mortality Probability Model (MPM), joined the group.11 By the beginning of the 1990s different systems were available to describe and classify ICU populations, to compare severity of illness, and to predict mortality risk in their patients. These systems performed well, but there were concerns about errors in prediction caused by differences in patient selection and lead-time bias. There were also concerns about the size and representativeness of the databases used to develop the three systems and about poor calibration within patient subgroups and across geographic locations. These concerns, in part, led to the development of their subsequent versions such as APACHE III,12 the SAPS II,13 and the MPM II,14 all published between 1991 and 1993.
During the mid-1990s, the need to quantify not only mortality but also morbidity risks in specific groups of patients became evident and led to the development of the so-called organ dysfunction scores, such as the Multiple Organ Dysfunction Score (MODS),15 the Logistic Organ Dysfunction System (LODS) score,16 and the Sequential Organ Failure Assessment (SOFA) score.17
Severity of Illness Assessment and Outcome Prediction
• Severity scores are instruments that aim at stratifying patients based on their severity, assigning to each patient an increasing score as the severity of the illness increases.
• Outcome prediction models, apart from their ability to stratify patients according to their severity, aim at predicting a certain outcome (usually the vital status at hospital discharge) based on a given set of prognostic variables and a certain modeling equation.
The development of this kind of system, applicable to heterogeneous groups of critically ill patients, started in the 1980s (Table 73.1). The first general severity of illness score applicable to most critically ill patients was the APACHE score.8 Developed in the George Washington University Medical Center in 1981 by William Knaus and coworkers, the APACHE system was created to evaluate, in an accurate and reproducible form, the severity of disease in this population.18–20 Two years later, Jean-Roger Le Gall and coworkers published a simplified version of this model, the SAPS.21 This model soon became very popular in Europe, especially in France. Another simplification of the original APACHE system, the APACHE II, was published in 1985 by the same authors of the original model.10 This system introduced the prediction of mortality risk, providing a major reason for ICU admission from a list comprising 50 operative and nonoperative diagnoses. The MPM,22 developed by Stanley Lemeshow, provided additional contributions for the prediction of prognosis, using logistic regression techniques. Further developments in this field include the third version of the APACHE system (APACHE III)12 and the second versions of the SAPS (SAPS II)13 and MPM (MPM II).14 All of them use multiple logistic regression to select and weight the variables and are able to compute the probability of hospital mortality risk for groups of critically ill patients. It has been demonstrated that they perform better than their old counterparts,23,24 and they represented the state of the art in this field by the end of the last century.
Table 73.1
General Severity Scores and Outcome Prediction Models
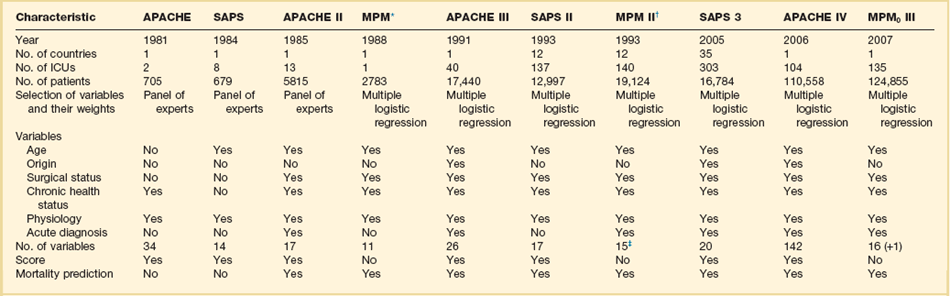
*These models are based on previous versions, developed by the same investigators (Lemeshow et al11,181; see online list of references for this chapter).
†The numbers presented are those for the admission component of the model (MPM II0). MPM II24 was developed using data for 15,925 patients from the same ICUs.
Since the early 1990s, owing to the progressive lack of calibration of these models, the performance of these instruments began to slowly deteriorate with the passage of time. Differences in the baseline characteristics of the admitted patients, in the circumstances of the ICU admission, and in the availability of general and specific therapeutic measures introduced an increasing gap between actual mortality rate and predicted mortality risk.25 Overall, in the last years of the century, there was an increase in the mean age of the admitted patients, a larger number of chronically sick patients and immunosuppressed patients, and an increase in the number of ICU admissions due to sepsis.26,27 Although most of the models kept an acceptable discrimination, their calibration (or prognostic accuracy) deteriorated to such a point that major changes were needed.
An inappropriate use of these instruments outside their sampling space was responsible also for some misapplication of the instruments, especially for risk adjustment in clinical trials.28–30
In the early 2000s, several attempts were made to improve the old models. However, a new generation of general outcome prediction models was built that included models such as the MPM III developed in the IMPACT database in the United States,31 new models based on computerized analysis by hierarchical regression developed by some of the authors of the APACHE systems,32 the APACHE IV,33 and the SAPS 3 admission model, developed by hierarchical regression in a worldwide database.34,35 Models based on other statistical techniques such as artificial neural networks and genetic algorithms have been proposed but, besides academic use, they never became used widely.36,37 These approaches have been revised more than once,38 and will be summarized later.
Recalibrating and Expanding Existing Models
All the existing general outcome prediction models used logistic regression equations to estimate the probabilities of a given outcome in a patient with a certain set of predictive variables. Consequently, the first approach to improve the calibration of a model when the original model is not able to adequately describe the population is to customize the model.39 Several methods and suggestions have been proposed for this exercise,40 based usually on one of two strategies:
• First-level customization, or the customization of the logit, developing a new equation relaying the score to the probability, such as one proposed by Le Gall or Apolone.41,42
• Second-level customization, or the customization of the coefficients of the variables in the model as described for the MPM II0 model,39 which can be made either by keeping unchanged the relative weight of the variables in the model or eventually by changing also these weights (this latter technique involves the limit of second-level customization: from this point forward, so the researcher is developing a new model and not customizing an existing one). Usually the researcher customizing an existing model assumes that the relative weight of the variables in the model is constant.
Both of these methods have been used in the past with a partial success in increasing the prognostic ability of the models.39,43 However, both fail when the problem of the score is on discrimination or in its poor performance in subgroups of patients (poor uniformity of fit).44 This fact can be justified by the lack of additional variables, more predictive in this specific context. The addition of new variables to an existing model has been done before45,46 and can be an appropriate approach in some cases. It can lead to very complex models, needs the collection of special data, and is also more expensive and time-consuming. The best tradeoff between the burden of data collection and accuracy should be tailored case by case. It should be noted that the aim of first-level customization, which is nothing more than a mathematical translation of the original logit in order to get a different probability of mortality risk, is to improve the calibration of a model and not to improve discrimination. It should therefore not be considered when the improvement of this parameter is considered important.
A third level of customization can be imagined, through the introduction in the model of new prognostic variables and the recomputation of the weights and coefficients for all variables, but—as mentioned before—this technique crosses the borders of customizing a model versus building a new predictive model. In past years, all these approaches have been tried.47–49
Building New Models
Three general outcome prediction models have been developed and finally published: the SAPS 3 admission model in 2005, the APACHE IV in 2006, and the MPM III in 2007.50
The SAPS 3 Admission Model
Developed by Rui Moreno, Philipp Metnitz, Eduardo Almeida, and Jean-Roger Le Gall on behalf of the SAPS 3 Outcomes Research Group, the SAPS 3 model was published in 2005.34,35 The study used a total of 19,577 patients consecutively admitted to 307 ICUs all over the world from 14 October to 15 December 2002. This high-quality multinational database was built to reflect the heterogeneity of current ICU case mix and typology all over the world, trying not to focus only on Western Europe and the United States. Consequently, the SAPS 3 database better reflects important differences in patients’ and health care systems’ baseline characteristics that are known to affect outcome. These include, for example, different genetic makeups, different styles of living, and a heterogeneous distribution of major diseases within different regions, as well as issues such as access to the health care system in general and to intensive care in particular, or differences in availability and use of major diagnostic and therapeutic measures within the ICUs. Although the integration of ICUs outside Europe and the United States surely increased its representativeness, it must be acknowledged that the extent to which the SAPS 3 database reflects case mix on ICUs worldwide cannot be determined yet.
Based on data collected at ICU admission (±1 hour), the authors developed regression coefficients by using multilevel logistic regression to estimate the probability of hospital death. The final model, which comprises 20 variables, exhibited good discrimination without major differences across patient typologies; calibration was also satisfactory. Customized equations for major areas of the world were computed and demonstrate a good overall goodness of fit. It is interesting that the determinant of hospital mortality probability changed remarkably from the early 1990s,12 with chronic health status and circumstances of ICU admission now being responsible for almost three fourths of the prognostic power of the model.
To allow all interested parties to see the calculation of SAPS 3, completely free of charge, extensive electronic supplementary material (http://dx.doi.org/10.1007/s00134-005-2762-6 and http://dx.doi.org/10.1007/s00134-005-2763-5, both accessed 30/06/2013) was published together with the study reports, including the complete and detailed description of all variables as well as additional information about SAPS 3 performance. Moreover, the SORG provides at the project website (www.saps3.org) several additional resources: First, a Microsoft Excel sheet is available and can be used to calculate a SAPS 3 “on the fly.” Second, a small Microsoft Access database allows for the calculation, storage, and export of SAPS 3 data elements.
However, as all outcome prediction models, SAPS 3 is slowly losing calibration, as recently demonstrated by several groups.51–55 It seems to keep a good level of reliability and discrimination, but a recalibration process, which can be relatively easy to perform, must be done in the following years.
The APACHE IV Model
In early 2006, Jack E. Zimmerman, one of the original authors of the original APACHE models, published in collaboration with colleagues from Cerner Corporation (Vienna, VA) the APACHE IV model.33 The study was based on a database of 110,558 consecutive admissions during 2002 and 2003 to 104 ICUs in 45 U.S. hospitals participating in the APACHE III database. The APACHE IV model uses the worst values during the first 24 hours in the ICU and a multivariate logistic regression procedure to estimate the probability of hospital death.
Predictor variables were similar to those in APACHE III, but new variables were added and different statistical modeling has been used. The accuracy of APACHE IV predictions was analyzed in the overall database and in major patient subgroups. APACHE IV had good discrimination and calibration. For 90% of 116 ICU admission diagnoses, the ratio of observed to predicted mortality was not significantly different from 1.0. Predictions were compared with the APACHE III versions developed 7 and 14 years previously: there was little change in discrimination, but aggregate mortality risk was systematically overestimated as model age increased. When examined across disease, predictive accuracy was maintained for some diagnoses but for others seemed to reflect changes in practice or therapy. A predictive model for risk-adjusted ICU length of stay was also published by the same group.56 More information about the model and the possibility to compute the probability of death for individual patients is available at the website of Cerner Corporation (www.criticaloutcomes.cerner.com).
The MPM0 III Model
The MPM0 III was published by Tom Higgins and associates in 2007.50 It was developed using data from ICUs in the United States participating in the project IMPACT but there is almost no published data to evaluate its behavior outside the development cohort. As for the previous MPM models, the MPM0 III does not allow the computation of a score but estimates directly the probability of death in the hospital.
Developing Predictive Models
Outcome Selection
Fatality meets all the preceding criteria; however, there are confounding factors to be considered when using death as an outcome. The location of the patient at the time of death can considerably reduce hospital mortality rates. For example, in a study of 116,340 ICU patients, a significant decline in the ratio of observed and predicted death was attributed to a decrease in hospital mortality rate as a result of earlier discharge of patients with a high severity of illness to skilled nursing facilities.57 In the APACHE III study, a significant regional difference in mortality rate was entirely secondary to variations in hospital length of stay.58 Improvements in therapy, such as the use of thrombolysis in myocardial infarction or steroids in Pneumocystis pneumonia and the acquired immunodeficiency syndrome59 can dramatically reduce hospital mortality rate. Increases in the use of advance directives, do-not-resuscitate orders, and limitation or withdrawal of therapy all increase hospital mortality rates.
Variations in any of the previous factors will lead to differences between observed and predicted deaths that have little to do with case mix or effectiveness of therapy. Predictive instruments directed at long-term mortality predictions provide accurate prognostic estimates within the first month of hospital discharge, but their accuracy falls off considerably thereafter, because other factors, such as HIV infection or malignancy, dominate the long-term survival pattern.45 Owing to these caveats, fatality is the most useful outcome for designing general severity of illness scores and predictive instruments.
• Morbidity and complication rates
• Duration of mechanical ventilation, use of pulmonary artery catheters
All current outcome prediction models aim at predicting vital status at hospital discharge. It is thus incorrect to use them to predict other outcomes, such as the vital status at ICU discharge. This approach will result in a gross underestimation of mortality rates.60
Data Collection
The next step in the development of a general outcome prediction model is the evaluation, selection, and registration of the predictive variables. At this stage major attention should be given to the variable definitions as well as to the time frames for data collection.61–63 Very frequently models have been applied incorrectly, the most common errors being related to the following:
• The definitions of the variables
• The time frames for the evaluation and registration of the data
• The frequency of measurement and registration of the variables
It should be noted that all existing models have been calibrated for nonautomated (i.e., manual) data collection. The use of electronic patient data management systems (with high sampling rates) has been demonstrated to have a significant impact on the results:64,65 the higher the sampling rate, the more outliers will be found and thus scores will be higher. The evaluation of intra- and interobserver reliability should always be described and reported, together with the frequency of missing values.
Selection of Variables
• Readily available and clinically relevant
• Plausible relationship to outcome and easily defined and measured
Initial selection of variables can be either deductive (subjective), using terms that are known or suspected to influence outcome, or inductive (objective) using any deviation from homeostasis or normal health status. The deductive approach employs a group of experts, who supply a consensus regarding the measurements and events most strongly associated with the outcome. This approach is faster and requires less computational work; APACHE I and SAPS I both started this way. A purely inductive strategy, used by MPM, begins with the database, and tests candidate variables with a plausible relationship to outcome. In the SAPS 3 model several complementary methods have been used, such as logistic regression on mutually exclusive categories built using smoothed curves based on LOWESS (locally weighted scatterplot smoothing),66 and multiple additive regression trees (MART).67
• Chronic disease status or comorbid conditions
• Circumstances of ICU admission
• Reasons for ICU admission and admitting diagnoses
• Cardiopulmonary resuscitation (CPR), mechanical ventilation prior to ICU admission
The accuracy of any scoring system depends on the quality of the database from which it was developed. Even with well-defined variables, significant interobserver variability is reported.68,69
In calculating the scores, several practical issues should be discussed.70,71 First, exactly which value for any parameter should be considered? It is true that for many of the more simple variables, several measurements will be taken during any 24-hour period. Should the lowest, highest, or an average be taken as the representative value of that day? There is a general consensus that, for the purposes of the score, the worst value in any 24-hour period should be considered. Second, what about missing values? Should the last known value repeatedly be considered as representative until a new value is obtained, or should the mean value between two successive values be taken? Both options make assumptions that may influence the reliability of the score. The first option assumes that we have no knowledge of the evolution of values with time and the second assumes that changes are usually fairly predictable and regular. However, we prefer this second option because values may be missing for several days and repeating the last known value may involve considerable errors in calculation. In addition, changes in most of the variables measured (platelet count, bilirubin, urea) are, in fact, usually fairly regular, moving up or down in a systematic manner.
Validation of the Model
Goodness of Fit
The evaluation of the goodness of fit comprises the evaluation of calibration and discrimination in the analyzed population. Calibration evaluates the degree of correspondence between the estimated probabilities of fatality and the actual fatality in the analyzed sample. Several methods are usually proposed: observed/estimated (O/E) mortality ratios, Flora’s Z score,72 Hosmer-Lemeshow goodness of fit tests,73–75 and Cox calibration regression and calibration curves.
Hosmer-Lemeshow goodness of fit tests are two chi-square statistics proposed for the formal evaluation of the calibration of predictive models.73–75 In the Ĥ test, patients are classified into 10 groups according to their probabilities of death. Then, a chi-square statistic is used to compare the observed number of deaths and the predicted number of survivors with the observed number of deaths and the observed number of survivors in each of the groups. The formula is (Equation 1):
with g being the number of groups (usually 10), o the number of events observed in group l, e the number of events expected in the same group, and  the mean estimated probability, always in group l. The resulting statistic is then compared with a chi-square table with 8 degrees of freedom (model development) or 10 degrees of freedom (model validation), in order to know if the observed differences can be explained exclusively by random fluctuation. The Hosmer-Lemeshow Ĉ test is similar, with the 10 groups containing an equal number of patients. Hosmer and Lemeshow demonstrated that the grouping method used on the Ĉ statistics behaves better when most of the probabilities are low.73
These tests are nowadays considered to be mandatory for the evaluation of calibration,76 although they are subject to criticism.77,78 It should be stressed that the analyzed sample must be large enough to have the power to detect the lack of agreement between predicted and observed mortality rates.40
The Hosmer-Lemeshow tests are very sensitive to the size of the sample. When the sample is small, the test is usually underpowered to detect poor fit; when the sample size is very large, even minor, insignificant differences between the predicted and the observed fatality will result in a significant chi-square; for this reason, more and more investigators, especially those dealing with large databases, prefer to use the Cox calibration regression, in which the relation between the expected and the observed probabilities is assessed by logistic regression with hospital death being the dependent variable and the natural logarithm of the odds of the probabilities given by the model being the independent variable. If the intercept is 0 and the slope of the model 1, then the calibration is perfect.49
This is the one of the best methods to provide the user with a quantitative measure of calibration, but it does not indicate fully the deviations between observed and predicted mortality rates, in particular in the direction, extent, and risk classes affected by these deviations. This last information is more or less provided by the traditional calibration plot, which, however, is not a real curve (single points are theoretically independent from each other), is not a formal statistical method, and consequently does not provide the uncertainty of the estimate. Another weak point of the most commonly used calibration assessment methods (i.e., the Hosmer–Lemeshow statistics combined with the traditional calibration plot) is that they average the risk of patients in each decile, thus not using the entire information carried by each patient. These shortcomings were recently addressed by a new statistical approach, the GiViTI calibration belt,53 recently used by Poole and colleagues in the comparison of the calibration of SAPS II and 3.53 However, it is also not perfect, because most of the time there is a left (low-risk) deviation of the distribution of risks and the test becomes less helpful and informative. Calibration curves are also used to describe the calibration of a predictive model. These types of graphics compare observed and predicted mortality risks. They can be misleading, because the number of patients usually decreases from left to right (when we move from low probabilities to high probabilities), and as a consequence, even small differences in high-severity groups appear visually more important than small differences in low-probability groups. It should be stressed that calibration curves are not a formal statistical test.
Discrimination evaluates the capability of the model to distinguish between patients who die from patients who survive. This evaluation can be made using a nonparametric test such as Harrell’s C index, using the order of magnitude of the error.79 This index measures the probability of, for any two patients chosen randomly, the one with the greater probability to have the outcome of interest (to be dead). It has been shown that this index is directly related with the area under the receiver operating characteristic (ROC) curve and that it can be obtained as the parameter of the Mann-Whitney-Wilcox statistic.80 Additional computations can be used to compute the confidence interval of this measure.81
The interpretation of the area under the ROC curve is easy: a virtual model with a perfect discrimination would have an area of 1.0, a model with a discrimination no better than chance has an area of 0.5. Discriminative abilities are said to be satisfactory when the ROC curve is greater than 0.70. General outcome prediction models usually have areas greater than 0.80. Several methods have been described to compare the areas under two (or more) ROC curves,82–84 but they can be misleading if the shape of the curves is different.85
The relative importance of calibration and discrimination depends on the intended use of the model. Some authors advise that for group comparison calibration is especially important86 and that for decisions involving individual patients both parameters are important.87
Uniformity of Fit
The evaluation of calibration and discrimination in the analyzed sample is nowadays current practice. More complex is the identification of subgroups of patients when the behavior of the model is nonoptimal. These subgroups can be viewed as influential observations in model building and their contribution for the global error of the model can be vary large.88
• The intrahospital location before ICU admission
• The degree of physiologic reserve (age, comorbid conditions)
• The acute diagnosis (including the presence, site, and extension of infection at ICU admission)
Although some authors such as Rowan and Goldhill in the United Kingdom89,90 and Apolone and Sicignano in Italy42,91 have suggested that the behavior of a model can depend to a significant extent on the case mix of the sample, no consensus exists about the subpopulations that should mandatorily be analyzed.44
Using a Severity of Illness Score
Transforming the Score into a Probability of Death

with b0 being the intercept of the model, x1 to xk the predictive variables and b1 to bk the estimated regression coefficients. The probability of death is then given by:

with the logit being y as described before. The logistic transformation included in this equation allows the S-shaped relationship between the two variables to become linear (on the logit scale). In the extremes of the score (very low or very high values) changes in the probability of death are small; for intermediate values, even small changes in the score are associated with very large changes in the probability of death. This ensures that outliers do not influence the prediction too much.
Application of a Severity of Illness Score: Evaluation of Patients
• Evaluation and registration of the predictive variables
• Evaluation and registration of the outcome
After validation, the utility and applicability of a model must be evaluated. Literature is full of models developed in large populations that failed, when applied within other contexts.42,43,89,92–96 Thus, this question can only be answered by validating the model in its final population. The potential applications of a model—and consequently its utility—are different for individual patients and for groups.97
Evaluating Individual Patients
Some evidence exists that suggests that statistical methods behave better than clinicians in predicting outcome,98–105 or that they can help clinicians in the decision-making process.106–108 This opinion is, however, controversial,109–111 especially for decisions to withdraw or to withhold therapy.112 Moreover, the application of different models to the same patient results frequently in very different predictions.113 Thus, application of these models to individual patients for decision making is not recommended.114
If should be noted that severity scores have been proposed for applications as diverse as to determine the use of total parenteral nutrition115 or the identification of futility in intensive care medicine.116 Some authors demonstrated that knowledge of predictive information will not have an adverse effect on the quality of care, helping at the same time to decrease the consumption of resources and to increase the availability of beds.117
One field in which the scientific community agrees consensually is the stratification of patients for inclusion into clinical trials and for the comparison of the balance of randomization to different groups.118
Evaluating Groups of Patients
At a group level, general outcome prediction models have been proposed for two objectives: distribution of resources and performance evaluation. Several studies were published describing methods used to identify and to characterize patients with a low risk of death.119–123 This type of patient, who requires only basic monitoring and general care, could eventually be transferred to other areas of the hospital.108,124 One could, however, also argue that these patients have a low mortality risk only because they have been monitored and cared for in an ICU.125 Also, the use of current instruments is not recommended as a triage instrument in the emergency department,126 and also the use of early physiologic indicators outside the ICU is being questioned.127
Moreover, patient costs in the ICU depend on the amount of required (and utilized) nursing workload use. Patient characteristics (diagnosis, degree of physiologic dysfunction) are thus not the only determinants: costs depend also on the practices and policies in a given ICU. To focus our attention on the effective use of nursing workload128 or the dynamic evolution of the patient129,130 seems thus a more promising strategy than those approaches based exclusively on the condition of the patients during the first hours in the ICU or in the O/E length of stay in the ICU.58,131,132
On the other hand, general outcome prediction models have been proposed to identify patients who require more resources.133 Unfortunately, these patients only rarely can be identified at ICU admission, because their degree of physiologic dysfunction during the first 24 hours in the ICU tends usually to be moderate, although very variable.134–136 And even if some day these patients might be well identified, the question of what to do with this information remains.
Another important area in which these type of models have been used is evaluation of ICU performance. Several investigators proposed the use of standardized mortality ratios (SMR) for performance evaluation, assuming that current models can take into account the main determinants of mortality risk.137 The SMR is computed by dividing the observed mortality rate by the averaged predicted mortality rate (the sum of the individual probabilities of death of all the patients in the sample). Additional computations can be made to estimate the confidence interval of this ratio.138
The interpretation of the SMR is easy: a ratio lower than 1 implies a performance better than the reference population and a ratio greater than 1 indicates a performance worse than the reference population. This methodology has been used for international comparison of ICUs,* comparison of hospitals,† ICU evaluation,143–146 management evaluation,142,147,148 and the influence of organization and management factors on the performance of the ICU.149
Before applying this methodology, six questions should always be answered:
1. Can we evaluate and register all the data needed for the computation of the models?
2. Can the models be used in the large majority of our patients?
3. Are existent models able to control for the main patient characteristics related to mortality?
4. Has the reference population been well chosen and are the models well calibrated to this population?
5. Is the sample size large enough to draw meaningful differences?
6. Is vital status at ICU discharge the main performance indicator?
Each of these assumptions has been questioned in past years and there is no definitive answer at this time. However, most investigators believe that performance is multidimensional and consequently that it should be evaluated in several dimensions.25,150 The problem of sample size seems especially important with respect to the risk of a type II error (in other words, to say that there are no differences when they exist).
Moreover, the comparison between observed and predicted might make more sense if done separately in low-, intermediate-, and high-risk patients, because the performance of an ICU can change according to the severity of the admitted patients. This approach was advocated in the past based on theoretical concerns,151–153 but was used only in a small number of studies.149,154 Multilevel modeling with varying slopes can be an answer for the developers of such models.25,155
Organ Dysfunction/Failure Scoring Systems
Organ failure scores are designed to describe organ dysfunction/failure more than to predict survival. In the development of organ function scores, three important principles need to be remembered.17 First, organ failure is not a simple all-or-nothing phenomenon; rather, a spectrum or continuum of organ dysfunction exists from very mild altered function to total organ failure. Second, organ failure is not a static process and the degree of dysfunction may vary with time during the course of disease so that scores need to be calculated repeatedly. Third, the variables chosen to evaluate each organ need to be objective, simple, and available but reliable, routinely measured in every institution, specific to the organ in question, and independent of patient variables, so that the score can be easily calculated for any patient in any ICU. Interobserver variability in scoring can be a problem with more complex systems63,156 and the use of simple, unequivocal variables can avoid this potential problem. Ideally, scores should be independent of therapeutic variables, as stressed by Marshall and coworkers,15 but in fact, this is virtually impossible to achieve as all factors are more or less treatment dependent. For example, the PaO2/FiO2 ratio is dependent on ventilatory conditions and positive end-expiratory pressure (PEEP), platelet count may be influenced by platelet transfusions, urea levels are affected by hemofiltration, and so on.
The process of organ function description is relatively new and there is no general agreement on which organs to assess and which parameters to use. Many different scoring systems have been developed for assessing organ dysfunction,15–17,157–165 differing in the organ systems included in the score, the definitions used for organ dysfunction, and the grading scale used.71,166 The majority of scores include six key organ systems—cardiovascular, respiratory, hematologic, central nervous, renal, and hepatic—with other systems, such as the gastrointestinal system, less commonly included. Early scoring systems assessed organ failure as either present or absent, but this approach is very dependent on where the limits for organ function are set, and newer scores consider organ failure as a spectrum of dysfunction. Most scores have been developed in the general ICU population, but some were aimed specifically at the septic patient.17,158,159,163,164 Three of the more recently developed systems will be discussed later, the main difference between them being in their definition of cardiovascular system dysfunction (Table 73.2).
Table 73.2
Organ Dysfunction/Failure Scoring Systems
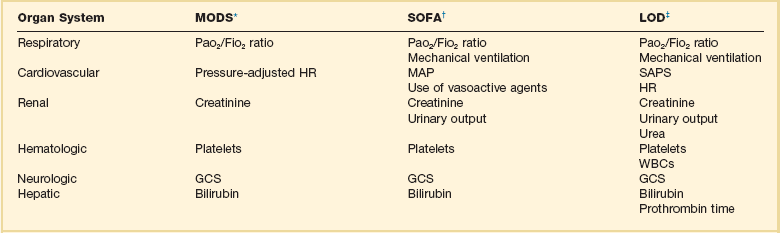
*Data from Marshall JC, Cook DA, Christou NV, et al: Multiple organ dysfunction score: A reliable descriptor of a complex clinical outcome. Crit Care Med 1995;23:1638-1652.
†Data from Vincent J-L, Moreno R, Takala J, et al: The SOFA (Sepsis-related Organ Failure Assessment) score to describe organ dysfunction/failure. Intensive Care Med 1996;22:707-710.
‡Data from Le Gall JR, Klar J, Lemeshow S, et al, The ICU Scoring Group: The logistic organ dysfunction system. A new way to assess organ dysfunction in the intensive care unit. JAMA 1996;276:802-810.
Multiple Organ Dysfunction Score
This scoring system was developed by a literature review of clinical studies of multiple organ failure from 1969 to 1993.15 Optimal descriptors of organ dysfunction were thus identified and validated against a clinical database. Six organ systems were chosen, and a score of 0 to 4 allotted for each organ according to function (0 being normal function through 4 for most severe dysfunction) with a maximum score of 24. The worst score for each organ system in each 24-hour period is taken for calculation of the aggregate score. A high initial Multiple Organ Dysfunction Score (MODS) correlated with ICU mortality risk and the delta MODS (calculated as the MODS over the whole ICU stay less the admission MODS) was even more predictive of outcome.15 In a study of 368 critically ill patients the MODS was found to better describe outcome groups than the APACHE II or the organ failure score, although the predicted risk of mortality was similar for all scoring systems.167 The MODS has been used to assess organ dysfunction in clinical studies of various groups of critically ill patients, including those with severe sepsis.168–171
Sequential Organ Failure Assessment Score
The sequential organ failure assessment (SOFA) score was developed in 1994 during a consensus conference organized by the European Society of Intensive Care and Emergency Medicine in an attempt to provide a means of quantitatively and objectively describing the degree of organ failure over time in individual, and groups of, septic patients.17 Initially termed the sepsis-related organ failure assessment score, the score was then renamed the sequential organ failure assessment because it was realized that it could be applied equally to nonseptic patients. In devising the score, the participants of the conference decided to limit to six the number of systems studied: respiratory, coagulation, hepatic, cardiovascular, central nervous system, renal. A score of 0 is given for normal function through 4 for most abnormal, and the worst values on each day are recorded. Individual organ function can thus be assessed and monitored over time, and an overall global score can also be calculated. A high total SOFA score (SOFA max) and a high delta SOFA (the total maximum SOFA minus the admission total SOFA) have been shown to be related to a worse outcome,129,172 and the total score has been shown to increase over time in nonsurvivors compared to survivors.172 The SOFA score has been used for organ failure assessment in several clinical trials, including one in septic shock patients.173–176
Logistic Organ Dysfunction System Score
This score was developed in 1996 using multiple logistic regression applied to selected variables from a large database of ICU patients.16 To calculate the score, each organ system receives points according to the worst value for any variable for that system on that day. If no organ dysfunction is present, the score is 0, rising to a maximum of 5. As the relative severity of organ dysfunction differs between organ systems, the Logistic Organ Dysfunction System (LODS) score allows for the maximum of 5 points to be awarded only to the neurologic, renal, and cardiovascular systems. For maximum dysfunction of the pulmonary and coagulation systems, a maximum of 3 points can be given for the most severe levels of dysfunction; and for the liver, the most severe dysfunction receives only 1 point. Thus, the total maximum score is 22. The LODS score is designed to be used as a once-only measure of organ dysfunction in the first 24 hours of ICU admission, rather than as a repeated assessment measure. The LODS system is quite complex and seldom used; nevertheless, it has been used to assess organ dysfunction in clinical studies.177
Directions for Further Research
No matter the model chosen, users should keep in mind that the accuracy of these models is dynamic and should be periodically retested, and that when accuracy deteriorates these models must be revised and updated. Also, it is important to remember that these instruments have been developed to be used in populations of patients with critical illness and not in individual patients; consequently, their use in individual patients should always be complementary and not alternative to the use of clinical evaluation, because statistical predictive methods are prone to error, especially in the individual patient.179,180
References
1. Rhodes, A, Moreno, RP, Azoulay, E, et al. Prospectively defined indicators to improve the safety and quality of care for critically ill patients: A report from the Task Force on Safety and Quality of the European Society of Intensive Care Medicine (ESICM). Intensive Care Med. 2012; 38:598–605.
2. Poole, D, Bertolini, G, Garattini, S. Errors in the approval process and post-marketing evaluation of drotrecogin alfa (activated) for the treatment of severe sepsis. Lancet Infect Dis. 2008; 9:67–72.
3. Apgar, V. A proposal for a new method of evaluation of the newborn infant. Anesth Analg. 1953; 32:260–267.
4. Child, CG, Turcotte, JG. Surgery and portal hypertension. Major Probl Clin Surg. 1964; 1:1–85.
5. Killip, T, 3rd., Kimball, JT. Treatment of myocardial infarction in a coronary care unit. Am J Cardiol. 1967; 20:457–464.
6. Teasdale, G, Jennett, B. Assessment of coma and impaired consciousness. Lancet. 1974; 2:81–84.
7. Bastos, PG, Sun, X, Wagner, DP, et al. Glasgow Coma Scale score in the evaluation of outcome in the intensive care unit: Findings from the acute physiology and chronic health evaluation III study. Crit Care Med. 1993; 21:1459–1465.
8. Knaus, WA, Zimmerman, JE, Wagner, DP, et al. APACHE—Acute physiology and chronic health evaluation: A physiologically based classification system. Crit Care Med. 1981; 9:591–597.
9. Le Gall, J-R, Loirat, P, Alperovitch, A. Simplified acute physiological score for intensive care patients. Lancet. 1983; ii:741.
10. Knaus, WA, Draper, EA, Wagner, DP, Zimmerman, JE. APACHE II: A severity of disease classification system. Crit Care Med. 1985; 13:818–829.
11. Lemeshow, S, Teres, D, Pastides, H, et al. A method for predicting survival and mortality of ICU patients using objectively derived weights. Crit Care Med. 1985; 13:519–525.
12. Knaus, WA, Wagner, DP, Draper, EA, et al. The APACHE III prognostic system. Risk prediction of hospital mortality for critically ill hospitalized adults. Chest. 1991; 100:1619–1636.
13. Le Gall, JR, Lemeshow, S, Saulnier, F. A new simplified acute physiology score (SAPS II) based on a European/North American multicenter study. JAMA. 1993; 270:2957–2963.
14. Lemeshow, S, Teres, D, Klar, J, et al. Mortality Probability Models (MPM II) based on an international cohort of intensive care unit patients. JAMA. 1993; 270:2478–2486.
15. Marshall, JC, Cook, DA, Christou, NV, et al. Multiple organ dysfunction score: A reliable descriptor of a complex clinical outcome. Crit Care Med. 1995; 23:1638–1652.
16. Le Gall, JR, Klar, J, Lemeshow, S, et al. The logistic organ dysfunction system. A new way to assess organ dysfunction in the intensive care unit. The ICU Scoring Group. JAMA. 1996; 276:802–810.
17. Vincent, J-L, Moreno, R, Takala, J, et al. The SOFA (Sepsis-related Organ Failure Assessment) score to describe organ dysfunction/failure. Intensive Care Med. 1996; 22:707–710.
18. Knaus, WA, Draper, EA, Wagner, DP, et al. Evaluating outcome from intensive care: A preliminary multihospital comparison. Crit Care Med. 1982; 10:491–496.
19. Knaus, WA, Le Gall, JR, Wagner, DP, et al. A comparison of intensive care in the U. S. A. and France. Lancet. 1982; 642–646.
20. Wagner, DP, Draper, EA, Abizanda Campos, R, et al. Initial international use of APACHE: An acute severity of disease measure. Med Decis Making. 1984; 4:297.
21. Le Gall, JR, Loirat, P, Alperovitch, A, et al. A simplified acute physiologic score for ICU patients. Crit Care Med. 1984; 12:975–977.
22. Lemeshow, S, Teres, D, Avrunin, J, Gage, RW. Refining intensive care unit outcome by using changing probabilities of mortality. Crit Care Med. 1988; 16:470–477.
23. Castella, X, Artigas, A, Bion, J, Kari, A, The European/North American Severity Study Group. A comparison of severity of illness scoring systems for intensive care unit patients: Results of a multicenter, multinational study. Crit Care Med. 1995; 23:1327–1335.
24. Bertolini, G, D’Amico, R, Apolone, G, et al. Predicting outcome in the intensive care unit using scoring systems: Is new better? A comparison of SAPS and SAPS II in a cohort of 1,393 patients. Med Care. 1998; 36:1371–1382.
25. Moreno, R, Matos, R. The “new” scores: What problems have been fixed, and what remain. Curr Opin Crit Care. 2000; 6:158–165.
26. Angus, DC, Linde-Zwirble, WT, Lidicker, J, et al. Epidemiology of severe sepsis in the United States: Analysis of incidence, outcome and associated costs of care. Crit Care Med. 2001; 29:1303–1310.
27. Martin, GS, Mannino, DM, Eaton, S, Moss, M. The epidemiology of sepsis in the United States from 1979 through 2000. N Engl J Med. 2003; 348:1546–1554.
28. Bernard, GR, Vincent, J-L, Laterre, P-F, et al. Efficacy and safety of recombinant human activated protein C for severe sepsis. for the Recombinant Human Activated Protein C Worldwide Evaluation in Severe Sepsis (PROWESS) Study Group. N Engl J Med. 2001; 344:699–709.
29. Ely, EW, Laterre, P-F, Angus, DC, et al. Drotrecogin alfa (activated) administration across clinically important subgroups of patients with severe sepsis. for the PROWESS Investigators. Crit Care Med. 2003; 31:12–19.
30. Moreno, R, Metnitz, P, Jordan, B, Einfalt, J. SAPS 3 28 days score: A prognostic model to estimate patient survival during the first 28 days in the ICU. Intensive Care Med. 2006; 32:S203.
31. Higgins, T, Teres, D, Copes, W, et al. Preliminary update of the Mortality Prediction Model (MPM0). Crit Care. 2005; 9:S97.
32. Render, ML, Kim, M, Deddens, J, et al. Variation in outcomes in Veterans Affairs intensive care units with a computerized severity measure. Crit Care Med. 2005; 33:930–939.
33. Zimmerman, JE, Kramer, AA, McNair, DS, Malila, FM. Acute Physiology and Chronic Health Evaluation (APACHE) IV: Hospital mortality assessment for today’s critically ill patients. Crit Care Med. 2006; 34:1297–1310.
34. Metnitz, PG, Moreno, RP, Almeida, E, et al. SAPS 3. From evaluation of the patient to evaluation of the intensive care unit. Part 1: Objectives, methods and cohort description. SAPS 3 Investigators. Intensive Care Med. 2005; 31:1336–1344.
35. Moreno, RP, Metnitz, PG, Almeida, E, et al. SAPS 3. From evaluation of the patient to evaluation of the intensive care unit. Part 2: Development of a prognostic model for hospital mortality at ICU admission. SAPS 3 Investigators. Intensive Care Med. 2005; 31:1345–1355.
36. Dybowski, R, Weller, P, Chang, R, Gant, V. Prediction of outcome in critically ill patients using artificial neural network, synthesised by genetic algorithm. Lancet. 1996; 347:1146–1150.
37. Engoren, M, Moreno, R, Miranda, DR. A genetic algorithm to predict hospital mortality in an ICU population. Crit Care Med. 1999; 27:A52.
38. Moreno, R, Afonso, S. Ethical, legal and organizational issues in the ICU: Prediction of outcome. Curr Opin Crit Care. 2006; 12:619–623.
39. Moreno, R, Apolone, G. The impact of different customization strategies in the performance of a general severity score. Crit Care Med. 1997; 25:2001–2008.
40. Zhu, B-P, Lemeshow, S, Hosmer, DW, et al. Factors affecting the performance of the models in the mortality probability model and strategies of customization: A simulation study. Crit Care Med. 1996; 24:57–63.
41. Le Gall, J-R, Lemeshow, S, Leleu, G, et al. Customized probability models for early severe sepsis in adult intensive care patients. JAMA. 1995; 273:644–650.
42. Apolone, G, D’Amico, R, Bertolini, G, et al. The performance of SAPS II in a cohort of patients admitted in 99 Italian ICUs: Results from the GiViTI. Intensive Care Med. 1996; 22:1368–1378.
43. Metnitz, PG, Valentin, A, Vesely, H, et al. Prognostic performance and customization of the SAPS II: Results of a multicenter Austrian study. Intensive Care Med. 1999; 25:192–197.
44. Moreno, R, Apolone, G, Miranda, DR. Evaluation of the uniformity of fit of general outcome prediction models. Intensive Care Med. 1998; 24:40–47.
45. Knaus, WA, Harrell, FE, Fisher, CJ, et al. The clinical evaluation of new drugs for sepsis. A prospective study design based on survival analysis. JAMA. 1993; 270:1233–1241.
46. Knaus, WA, Harrell, FE, LaBrecque, JF, et al. Use of predicted risk of mortality to evaluate the efficacy of anticytokine therapy in sepsis. The rhIL-1ra Phase III Sepsis Syndrome Study Group. Crit Care Med. 1996; 24:46–56.
47. Le Gall, J-R, Neumann, A, Hemery, F, et al. Mortality prediction using SAPS II: An update for French intensive care units. Crit Care. 2005; 9:R645–R652.
48. Aegerter, P, Boumendil, A, Retbi, A, et al. SAPS II revisited. Intensive Care Med. 2005; 31:416–423.
49. Harrison, DA, Brady, AR, Parry, GJ, et al. Recalibration of risk prediction models in a large multicenter cohort of admissions to adult, general critical care units in the United Kingdom. Crit Care Med. 2006; 34:1378–1388.
50. Higgins, TL, Teres, D, Copes, WS, et al. Assessing contemporary intensive care unit outcome: An updated Mortality Probability Admission Model (MPM0-III). Crit Care Med. 2007; 35:827–835.
51. Ledoux, D, Canivet, J-L, Preiser, J-C, et al. SAPS 3 admission score: An external validation in a general intensive care population. Intensive Care Med. 2008; 34:1873–1877.
52. Poole, D, Rossi, C, Anghileri, A, et al. External validation of the Simplified Acute Physiology Score (SAPS) 3 in a cohort of 28,357 patients from 147 Italian intensive care units. Intensive Care Med. 2009; 35(11):1916–1924.
53. Poole, D, Rossi, C, Latronico, N, et al. Comparison between SAPS II and SAPS 3 in predicting hospital mortality in a cohort of 103 Italian ICUs. Is new always better? Intensive Care Med. 2012; 38:1280–1288.
54. Khwannimit, B, Bhurayanontachai, R. The performance and customization of SAPS 3 admission score in a Thai medical intensive care unit. Intensive Care Med. 2010; 36:342–346.
55. Metnitz, B, Schaden, E, Moreno, R, et al. Austrian validation and customization of the SAPS 3 Admission Score. on behalf of the ASDI Study Group. Intensive Care Med. 2009; 35:616–622.
56. Zimmerman, JE, Kramer, AA, McNair, DS, et al. Intensive care unit length of stay: Benchmarking based on Acute Physiology and Chronic Health Evaluation (APACHE) IV. Crit Care Med. 2006; 34:2517–2529.
57. Sirio, CA, Shepardson, LB, Rotondi, AJ, et al. Community-wide assessment of intensive care outcomes using a physiologically based prognostic measure: Implications for critical care delivery from Cleveland Health Quality Choice. Chest. 1999; 115:793.
58. Knaus, WA, Wagner, DP, Zimmerman, JE, Draper, EA. Variations in mortality and length of stay in intensive care units. Ann Intern Med. 1993; 118:753–761.
59. Montaner, JSG, Lawson, LM, Levitt, N, et al. Corticosteroids prevent early deterioration in patients with moderate severe Pneumocystis carinii pneumonia and the acquired immunodeficiency syndrome. Ann Intern Med. 1990; 113:14–20.
60. Moreno, R, Miranda, DR, Matos, R, Fevereiro, T. Mortality after discharge from intensive care: The impact of organ system failure and nursing workload use at discharge. Intensive Care Med. 2001; 27:999–1004.
61. Abizanda Campos, R, Balerdi, B, Lopez, J, et al. Fallos de prediccion de resultados mediante APACHE II. Analisis de los errores de prediction de mortalidad en pacientes criticos. Med Clin (Barc). 1994; 102:527–531.
62. Fery-Lemonnier, E, Landais, P, Loirat, P, et al. Evaluation of severity scoring systems in the ICUs: Translation, conversion and definitions ambiguities as a source of inter-observer variability in APACHE II, SAPS, and OSF. Intensive Care Med. 1995; 21:356–360.
63. Rowan, K. The reliability of case mix measurements in intensive care. Curr Opin Crit Care. 1996; 2:209–213.
64. Bosman, RJ, Oudemane van Straaten, HM, Zandstra, DF. The use of intensive care information systems alters outcome prediction. Intensive Care Med. 1998; 24:953–958.
65. Suistomaa, M, Kari, A, Ruokonen, E, Takala, J. Sampling rate causes bias in APACHE II and SAPS II scores. Intensive Care Med. 2000; 26:1773–1778.
66. Cleveland, WS. LOWESS: A program for smoothing scatterplots by robust locally weighted regression. Am Stat. 1981; 35:54.
67. Ridgeway, G. The state of boosting. Comput Sci Statist. 1999; 31:172–181.
68. Damiano, AM, Bergner, M, Draper, EA, et al. Reliability of a measure of severity of illness: Acute physiology and chronic health evaluation II. J Clin Epidemiol. 1992; 45:93–101.
69. Moreno, R, Miranda, DR, Fidler, V, Van Schilfgaarde, R. Evaluation of two outcome predictors on an independent database. Crit Care Med. 1998; 26:50–61.
70. Guyatt, GH, Meade, MO. Outcome measures: Methodologic principles. Sepsis. 1997; 1:21–25.
71. Marshall, JD, Bernard, G, Le Gall, J-R, Vincent, J-L. The measurement of organ dysfunction/failure as an ICU outcome. Sepsis. 1997; 1:41.
72. Flora, JD. A method for comparing survival of burn patients to a standard survival curve. J Trauma. 1978; 18:701–705.
73. Hosmer, DW, Lemeshow, S. Applied Logistic Regression. New York: John Wiley & Sons; 1989.
74. Lemeshow, S, Hosmer, DW. A review of goodness of fit statistics for use in the development of logistic regression models. Am J Epidemiol. 1982; 115:92–106.
75. Hosmer, DW, Lemeshow, S. A goodness-of-fit test for the multiple logistic regression model. Commun Stat. 1980; A10:1043–1069.
76. Hadorn, DC, Keeler, EB, Rogers, WH, Brook, RH. Assessing the performance of mortality prediction models. Santa Monica: RAND/UCLA/Harvard Center for Health Care Financing Policy Research; 1993.
77. Champion, HR, Copes, WS, Sacco, WJ, et al. Improved predictions from a severity characterization of trauma (ASCOT) over trauma and injury severity score (TRISS): Results of an independent evaluation. J Trauma. 1996; 40:42–49.
78. Bertolini, G, D’Amico, R, Nardi, D, et al. One model, several results: The paradox of the Hosmer-Lemeshow goodness-of-fit test for the logistic regression model. J Epidemiol Biostat. 2000; 5:251–253.
79. Harrell, FE, Jr., Califf, RM, Pryor, DB, et al. Evaluating the yield of medical tests. JAMA. 1982; 247:2543–2546.
80. Hanley, J, McNeil, B. The meaning and use of the area under a receiver operating characteristic (ROC) curve. Radiology. 1982; 143:29–36.
81. Ma, G, Hall, WJ. Confidence bands for receiver operating characteristic curves. Med Decis Making. 1993; 13:191–197.
82. Hanley, J, McNeil, B. A method of comparing the areas under receiver operating characteristic curves derived from the same cases. Radiology. 1983; 148:839–843.
83. McClish, DK. Comparing the areas under more than two independent ROC curves. Med Decis Making. 1987; 7:149–155.
84. DeLong, ER, DeLong, DM, Clarke-Pearson, DL. Comparing the areas under two or more correlated receiver operating characteristic curves: A nonparametric approach. Biometrics. 1988; 44:837–845.
85. Hilden, J. The area under the ROC curve and its competitors. Med Decis Making. 1991; 11:95–101.
86. Schuster, DP. Predicting outcome after ICU admission. The art and science of assessing risk. Chest. 1992; 102:1861–1870.
87. Kollef, MH, Schuster, DP. Predicting intensive care unit outcome with scoring systems. Underlying concepts and principles. Crit Care Clin. 1994; 10:1–18.
88. Miller, ME, Hui, SL. Validation techniques for logistic regression models. Stat Med. 1991; 10:1213–1226.
89. Rowan, KM, Kerr, JH, Major, E, et al. Intensive Care Society’s APACHE II study in Britain and Ireland II: Outcome comparisons of intensive care units after adjustment for case mix by the American APACHE II method. Br Med J. 1993; 307:977–981.
90. Goldhill, DR, Withington, PS. The effects of case mix adjustment on mortality as predicted by APACHE II. Intensive Care Med. 1996; 22:415–419.
91. Sicignano, A, Carozzi, C, Giudici, D, et al. The influence of length of stay in the ICU on power of discrimination of a multipurpose severity score (SAPS). on behalf of ARCHIDIA. Intensive Care Med. 1996; 22:1048–1051.
92. Castella, X, Gilabert, J, Torner, F, Torres, C. Mortality prediction models in intensive care: Acute Physiology and Chronic Health Evaluation II and Mortality Prediction Model compared. Crit Care Med. 1991; 19:191–197.
93. Sirio, CA, Tajimi, K, Tase, C, et al. An initial comparison of intensive care in Japan and United States. Crit Care Med. 1992; 20:1207–1215.
94. Bastos, PG, Sun, X, Wagner, DP, et al. Application of the APACHE III prognostic system in Brazilian intensive care units: A prospective multicenter study. The Brazil APACHE III Study Group. Intensive Care Med. 1996; 22:564–570.
95. Moreno, R, Morais, P. Outcome prediction in intensive care: Results of a prospective, multicentre, Portuguese study. Intensive Care Med. 1997; 23:177–186.
96. Rivera-Fernandez, R, Vazquez-Mata, G, Bravo, M, et al. The Apache III prognostic system: Customized mortality predictions for Spanish ICU patients. Intensive Care Med. 1998; 24:574–581.
97. Moreno, R. From the evaluation of the individual patient to the evaluation. of the ICU. Réanimation. 2003; 12:47s–48s.
98. Perkins, HS, Jonsen, AR, Epstein, WV. Providers as predictors: Using outcome predictions in intensive care. Crit Care Med. 1986; 14:105–110.
99. Silverstein, MD. Prediction instruments and clinical judgement in critical care. JAMA. 1988; 260:1758–1759.
100. Dawes, RM, Faust, D, Mechl, PE. Clinical versus actuarial judgement. Science. 1989; 243:1674–1688.
101. Kleinmuntz, B. Why we still use our heads instead of formulas: Toward an integrative approach. Psychol Bull. 1990; 107:296–310.
102. McClish, DK, Powell, SH. How well can physicians estimate mortality in a medical intensive care unit? Med Decis Making. 1989; 9:125–132.
103. Poses, RM, Bekes, C, Winkler, RL, et al. Are two (inexperienced) heads better than one (experienced) head? Averaging house officers prognostic judgement for critically ill patients. Arch Intern Med. 1990; 150:1874–1878.
104. Poses, RM, Bekes, C, Copare, FJ, et al. The answer to “what are my chances, doctor?” depends on whom is asked: Prognostic disagreement and inaccuracy for critically ill patients. Crit Care Med. 1989; 17:827–833.
105. Winkler, RL, Poses, RM. Evaluating and combining physicians’ probabilities of survival in an intensive care unit. Manage Sci. 1993; 39:1526–1543.
106. Chang, RWS, Lee, B, Jacobs, S, Lee, B. Accuracy of decisions to withdraw therapy in critically ill patients: Clinical judgement versus a computer model. Crit Care Med. 1989; 17:1091–1097.
107. Knaus, WA, Rauss, A, Alperovitch, A, et al. Do objective estimates of chances for survival influence decisions to withhold or withdraw treatment? Med Decis Making. 1990; 10:163–171.
108. Zimmerman, JE, Wagner, DP, Draper, EA, Knaus, WA. Improving intensive care unit discharge decisions: Supplementary physician judgment with predictions of next day risk for life support. Crit Care Med. 1994; 22:1373–1384.
109. Branner, AL, Godfrey, LJ, Goetter, WE. Prediction of outcome from critical illness: A comparison of clinical judgement with a prediction rule. Arch Intern Med. 1989; 149:1083–1086.
110. Kruse, JA, Thill-Baharozin, MC, Carlson, RW. Comparison of clinical assessment with APACHE II for predicting mortality risk in patients admitted to a medical intensive care unit. JAMA. 1988; 260:1739–1742.
111. Marks, RJ, Simons, RS, Blizzard, RA, et al. Predicting outcome in intensive therapy units—A comparison of APACHE II with subjective assessments. Intensive Care Med. 1991; 17:159–163.
112. Knaus, WA, Wagner, DP, Lynn, J. Short-term mortality predictions for critically ill hospitalized adults: Science and ethics. Science. 1991; 254:389–394.
113. Lemeshow, S, Klar, J, Teres, D. Outcome prediction for individual intensive care patients: Useful, misused, or abused. Intensive Care Med. 1995; 21:770–776.
114. Suter, P, Armagandis, A, Beaufils, F, et al. Predicting outcome in ICU patients: Consensus conference organized by the ESICM and the SRLF. Intensive Care Med. 1994; 20:390–397.
115. Chang, RW, Jacobs, S, Lee, B. Use of APACHE II severity of disease classification to identify intensive-care-unit patients who would not benefit from total parenteral nutrition. Lancet. 1986; 1:1483–1486.
116. Atkinson, S, Bihari, D, Smithies, M, et al. Identification of futility in intensive care. Lancet. 1994; 344:1203–1206.
117. Murray, LS, Teasdale, GM, Murray, GD, et al. Does prediction of outcome alter patient management? Lancet. 1993; 341:1487–1491.
118. Gattinoni, L, Brazzi, L, Pelosi, P, et al, A trial of goal-orientated hemodynamic therapy in critically ill patients for the SVO2 Collaborative Group. N Engl J Med 1995; 333:1025–1032.
119. Henning, RJ, McClish, D, Daly, B, et al. Clinical characteristics and resource utilization of ICU patients: Implementation for organization of intensive care. Crit Care Med. 1987; 15:264–269.
120. Wagner, DP, Knaus, WA, Draper, EA. Identification of low-risk monitor admissions to medical-surgical ICUs. Chest. 1987; 92:423–428.
121. Wagner, DP, Knaus, WA, Draper, EA, et al. Identification of low-risk monitor patients within a medical-surgical ICU. Med Care. 1983; 21:425–433.
122. Zimmerman, JE, Wagner, DP, Knaus, WA, et al. The use of risk predictors to identify candidates for intermediate care units. Implications for intensive care unit utilization. Chest. 1995; 108:490–499.
123. Zimmerman, JE, Wagner, DP, Sun, X, et al. Planning patient services for intermediate care units: Insights based on care for intensive care unit low-risk monitor admissions. Crit Care Med. 1996; 24:1626–1632.
124. Strauss, MJ, LoGerfo, JP, Yeltatzie, JA, et al. Rationing of intensive care unit services. An everyday occurrence. JAMA. 1986; 255:1143–1146.
125. Civetta, JM, Hudson-Civetta, JA, Nelson, LD. Evaluation of APACHE II for cost containment and quality assurance. Ann Surg. 1990; 212:266–276.
126. Jones, AE, Fitch, MT, Kline, JA. Operational performance of validated physiologic scoring systems for predicting in-hospital mortality among critically ill emergency department patients. Crit Care Med. 2005; 33:974–978.
127. MERIT study investigators. Introduction of the medical emergency team (MET) system: A cluster-randomised controlled trial. Lancet. 2005; 365:2091–2097.
128. Moreno, R, Miranda, DR. Nursing staff in intensive care in Europe. The mismatch between planning and practice. Chest. 1998; 113:752–758.
129. Moreno, R, Vincent, J-L, Matos, R, et al. The use of maximum SOFA score to quantify organ dysfunction/failure in intensive care. Results of a prospective, multicentre study. on behalf of the working group on “sepsis-related problems” of the European Society of Intensive Care Medicine. Intensive Care Med. 1999; 25:686–696.
130. Clermont, G, Kaplan, V, Moreno, R, et al. Dynamic microsimulation to model multiple outcomes in cohorts of critically ill patients. Intensive Care Med. 2004; 30:2237–2244.
131. Zimmerman, JE, Shortell, SM, Knaus, WA, et al. Value and cost of teaching hospitals: A prospective, multicenter, inception cohort study. Crit Care Med. 1993; 21:1432–1442.
132. Rapoport, J, Teres, D, Lemeshow, S, Gehlbach, S. A method for assessing the clinical performance and cost-effectiveness of intensive care units: A multicenter inception cohort study. Crit Care Med. 1994; 22:1385–1391.
133. Teres, D, Rapoport, J. Identifying patients with high risk of high cost. Chest. 1991; 99:530–531.
134. Cerra, FB, Negro, F, Abrams, J. APACHE II score does not predict multiple organ failure or mortality in post-operative surgical patients. Arch Surg. 1990; 125:519–522.
135. Rapoport, J, Teres, D, Lemeshow, S, et al. Explaining variability of cost using a severity of illness measure for ICU patients. Med Care. 1990; 28:338–348.
136. Oye, RK, Bellamy, PF. Patterns of resource consumption in medical intensive care. Chest. 1991; 99:685–689.
137. Knaus, WA, Draper, EA, Wagner, DP, Zimmerman, JE. An evaluation of outcome from intensive care in major medical centers. Ann Intern Med. 1986; 104:410–418.
138. Hosmer, DW, Lemeshow, S. Confidence interval estimates of an index of quality performance based on logistic regression estimates. Stat Med. 1995; 14:2161–2172.
139. Rapoport, J, Teres, D, Barnett, R, et al. A comparison of intensive care unit utilization in Alberta and Western Massachusetts. Crit Care Med. 1995; 23:1336–1346.
140. Wong, DT, Crofts, SL, Gomez, M, et al. Evaluation of predictive ability of APACHE II system and hospital outcome in Canadian intensive care unit patients. Crit Care Med. 1995; 23:1177–1183.
141. Le Gall, JR, Loirat, P, Nicolas, F, et al. Utilisation d’un indice de gravité dans huit services de réanimation multidisciplinaire. Presse Méd. 1983; 12:1757–1761.
142. Zimmerman, JE, Rousseau, DM, Duffy, J, et al. Intensive care at two teaching hospitals: An organizational case study. Am J Crit Care. 1994; 3:129–138.
143. Chisakuta, AM, Alexander, JP. Audit in intensive care. The APACHE II classification of severity of disease. Ulster Med J. 1990; 59:161–167.
144. Marsh, HM, Krishan, I, Naessens, JM, et al. Assessment of prediction of mortality by using the APACHE II scoring system in intensive care units. Mayo Clin Proc. 1990; 65:1549–1557.
145. Turner, JS, Mudaliar, YM, Chang, RW, Morgan, CJ. Acute physiology and chronic health evaluation (APACHE II) scoring in a cardiothoracic intensive care unit. Crit Care Med. 1991; 19:1266–1269.
146. Oh, TE, Hutchinson, R, Short, S, et al. Verification of the acute physiology and chronic health evaluation scoring system in a Hong Kong intensive care unit. Crit Care Med. 1993; 21:698–705.
147. Zimmerman, JE, Shortell, SM, Rousseau, DM, et al. Improving intensive care: Observations based on organizational case studies in nine intensive care units: A prospective, multicenter study. Crit Care Med. 1993; 21:1443–1451.
148. Shortell, SM, Zimmerman, JE, Rousseau, DM, et al. The performance of intensive care units: Does good management make a difference? Med Care. 1994; 32:508–525.
149. Miranda DR, Ryan DW, Schaufeli WB, Fidler V, eds. Organization and Management of Intensive Care: A Prospective Study in 12 European Countries. Berlin: Springer-Verlag, 1997.
150. Moreno, R, Matos, R. New issues in severity scoring: Interfacing the ICU and evaluating it. Curr Opin Crit Care. 2001; 7:469–474.
151. Teres, D, Lemeshow, S. Using severity measures to describe high performance intensive care units. Crit Care Clin. 1993; 9:543–554.
152. Teres, D, Lemeshow, S. Why severity models should be used with caution. Crit Care Clin. 1994; 10:93–110.
153. Teres, D, Lieberman, S. Are we ready to regionalize pediatric intensive care? Crit Care Med. 1991; 19:139–140.
154. Pollack, MM, Alexander, SR, Clarke, N, et al. Improved outcomes from tertiary center pediatric intensive care: A statewide comparison of tertiary and nontertiary care facilities. Crit Care Med. 1990; 19:150–159.
155. Goldstein, H, Spiegelhalter, DJ. League tables and their limitations: Statistical issues in comparisons of institutional performance. J. R Stat Soc A. 1996; 159:385–443.
156. Polderman, KH, Thijs, LG, Girbes, AR. Interobserver variability in the use of APACHE II scores. Lancet. 1999; 353:380.
157. Fry, DE, Pearlstein, L, Fulton, RL, Polk, HC. Multiple system organ failure. The role of uncontrolled infection. Arch Surg. 1980; 115:136–140.
158. Elebute, EA, Stoner, HB. The grading of sepsis. Br J Surg. 1983; 70:29–31.
159. Stevens, LE. Gauging the severity of surgical sepsis. Arch Surg. 1983; 118:1190–1192.
160. Goris, RJA, te Boekhorst, TP, Nuytinck, JKS, Gimbrère, JSF. Multiple-organ failure. Generalized autodestructive inflammation? Arch Surg. 1985; 120:1109–1115.
161. Knaus, WA, Draper, EA, Wagner, DP, Zimmerman, JE. Prognosis in acute organ-system failure. Ann Surg. 1985; 202:685–693.
162. Chang, RW, Jacobs, S, Lee, B. Predicting outcome among intensive care unit patients using computerised trend analysis of daily Apache II scores corrected for organ system failure. Intensive Care Med. 1988; 14:558–566.
163. Meek, M, Munster, AM, Winchurch, RA, et al. The Baltimore sepsis scale: Measurement of sepsis in patients with burns using a new scoring system. J Burn Care Rehabil. 1991; 12:564.
164. Baumgartner, JD, Bula, C, Vaney, C, et al. A novel score for predicting the mortality of septic shock patients. Crit Care Med. 1992; 20:953.
165. Bernard, GR, Doig, BG, Hudson, G, et al. Quantification of organ failure for clinical trials and clinical practice. Am J Respir Crit Care Med. 1995; 151:A323.
166. Bertleff, MJ, Bruining, HA. How should multiple organ dysfunction syndrome be assessed? A review of the variations in current scoring systems. Eur J Surg. 1997; 163:405–409.
167. Jacobs, S, Zuleika, M, Mphansa, T. The multiple organ dysfunction score as a descriptor of patient outcome in septic shock compared with two other scoring systems. Crit Care Med. 1999; 27:741–744.
168. Gonçalves, JA, Hydo, LJ, Barie, PS. Factors influencing outcome of prolonged norepinephrine therapy for shock in critical surgical illness. Shock. 1998; 10:231–236.
169. Maziak, DE, Lindsay, TF, Marshall, JC, et al. The impact of multiple organ dysfunction on mortality following ruptured abdominal aortic aneurysm repair. Ann Vasc Surg. 1998; 12:93–100.
170. Pinilla, JC, Hayes, P, Laverty, W, et al. The C-reactive protein to prealbumin ratio correlates with the severity of multiple organ dysfunction. Surgery. 1998; 124:799–805.
171. Staubach, KH, Schroder, J, Stuber, F, et al. Effect of pentoxifylline in severe sepsis: Results of a randomized, double-blind, placebo-controlled study. Arch Surg. 1998; 133:94–100.
172. Vincent, J-L, de Mendonça, A, Cantraine, F, et al. Use of the SOFA score to assess the incidence of organ dysfunction/failure in intensive care units: Results of a multicentric, prospective study. on behalf of the working group on “sepsis-related problems” of the European Society of Intensive Care Medicine. Crit Care Med. 1998; 26:1793–1800.
173. Di Filippo, A, De Gaudio, AR, Novelli, A, et al. Continuous infusion of vancomycin in methicillin-resistant staphylococcus infection. Chemotherapy. 1998; 44:63–68.
174. Fiore, G, Donadio, PP, Gianferrari, P, et al. CVVH in postoperative care of liver transplantation. Minerva Anestesiol. 1998; 64:83–87.
175. Briegel, J, Forst, H, Haller, M, et al. Stress doses of hydrocortisone reverse hyperdynamic septic shock: A prospective, randomized, double-blind, single-center study. Crit Care Med. 1999; 27:723–732.
176. Hynninen, M, Valtonen, M, Markkanen, H, et al. Interleukin 1 receptor antagonist and E-selectin concentrations: A comparison in patients with severe acute pancreatitis and severe sepsis. J Crit Care. 1999; 14:63–68.
177. Soufir, L, Timsits, JF, Mahe, C, et al. Attributable morbidity and mortality of catheter-related septicemia in critically ill patients: A matched, risk-adjusted, cohort study. Infect Control Hosp Epidemiol. 1999; 20:396–401.
178. Timsit, JF, Fosse, JP, Troche, G, et al. Accuracy of a composite score using daily SAPS II and LOD scores for predicting hospital mortality in ICU patients hospitalized for more than 72 h. Intensive Care Med. 2001; 27:1012–1021.
179. Sinuff, T, Adhikari, NKJ, Cook, DJ, et al. Mortality predictions in the intensive care unit: Comparing physicians with scoring systems. Crit Care Med. 2006; 34:878–885.
180. Booth, FV, Short, M, Shorr, AF, et al. Application of a population-based severity scoring system to individual patients results in frequent misclassification. Crit Care. 2006; 9:R522–529.
181. Lemeshow, S, Teres, D, Avrunin, JS, Pastides, H. A comparison of methods to predict mortality of intensive care unit patients. Crit Care Med. 1987; 15:715–722.
182. Zimmerman, JE, Knaus, WA, Judson, JA, et al. Patient selection for intensive care: A comparison of New Zealand and United States Hospitals. Crit Care Med. 1988; 16:318–325.