Assessment of Cardiac Filling and Blood Flow
The accurate assessment and manipulation of the circulation are important parts of the management of critically ill patients. The principal objective of cardiorespiratory manipulation is to ensure optimal oxygen delivery. Adequate cellular respiration, adequate delivery of substrates and pharmaceuticals, and eventual recovery of organs and tissues are possible only when this has been achieved. This chapter deals with the physiologic principles governing the cardiovascular system and discusses interpretation of hemodynamic data in a clinical context. With the increasing number of medical devices available to monitor the circulation, this chapter also outlines the principles underlying the design and function of these devices, as well as their uses and limitations (Tables 3.1 to 3.4).
Table 3.1
Primary Measured Hemodynamic Data
| Parameter/Formula | Normal Range |
| Arterial blood pressure (BP) | |
| Systolic (SBP) | 90-140 mm Hg |
| Diastolic (DBP) | 60-90 mm Hg |
| Mean arterial pressure (MAP): [SBP + (2 × DBP)]/3 |
70-105 mm Hg |
| Right atrial pressure (RAP) | 2-6 mm Hg |
| Right ventricular pressure (RVP) | |
| Systolic (RVSP) | 15-25 mm Hg |
| Diastolic (RVDP) | 0-8 mm Hg |
| Pulmonary artery pressure (PAP) | |
| Systolic (PASP) | 15-25 mm Hg |
| Diastolic (PADP) | 8-15 mm Hg |
| Mean pulmonary artery pressure (MPAP): [PASP + (2 × PADP)]/3 |
10-20 mm Hg |
| Pulmonary artery occlusion pressure (PAOP) | 6-12 mm Hg |
| Left atrial pressure (LAP) | 6-12 mm Hg |
| Cardiac output (CO): HR × SV/1000 |
4.0-8.0 L/min |
Table 3.2
| Derived Parameter/Formula | Normal Range |
| Cardiac index (CI): CO/BSA |
2.5-4.0 L/min/m2 |
| Stroke volume (SV): CO/HR × 1000 |
60-100 mL/beat |
| Stroke volume index (SVI): CI/HR × 1000 |
33-47 mL/m2/beat |
| Systemic vascular resistance (SVR): 80 × (MAP − RAP)/CO |
1000-1500 dyn⋅s/cm5 |
| Systemic vascular resistance index (SVRI): 80 × (MAP − RAP)/CI |
1970-2390 dyn⋅s/cm5/m2 |
| Pulmonary vascular resistance (PVR): 80 × (MPAP − PAOP)/CO |
<250 dyn⋅s/cm5 |
| Pulmonary vascular resistance index (PVRI): 80 × (MPAP − PAOP)/CI |
255-285 dyn⋅s/cm5/m2 |
Table 3.3
Cardiac Filling
Our current understanding of the relationship between preload and contractility and their effect on stroke volume is based on the experiments of Dario Maestrini, Otto Frank, and Ernest Starling. Culminating in Starling’s “law of the heart,” which states that the force of myocardial contraction is directly proportional to the end-diastolic myocardial fiber length (or “preload”), as determined by the ventricular end-diastolic volume (EDV).1,2 It is this relationship, commonly known as the Frank-Starling mechanism that matches venous return to cardiac output (Fig. 3.1).
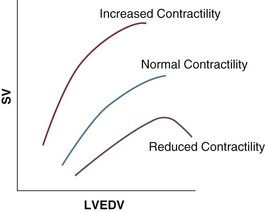
The most common intervention used by clinicians to improve stroke volume—the administration of fluids—is aimed at increasing venous return as a main determinant of EDV. In this regard two factors are important to consider: the position of an individual heart on the Frank-Starling curve and the expected response to fluid administration, as well as giving the right amount of fluid in order to achieve a hemodynamic response. The dynamics of venous return have been extensively described by Arthur Guyton, whose theories contribute to our current understanding of the circulation and may help to optimize venous return.3,4
Preload
Preload is determined by the following factors:
• Venous capacitance (i.e., sympathetic stimulation resulting in venoconstriction, mechanical compression)
• Posture: The Trendelenburg position (supine, head down) increases venous return. Clinically, a passive leg raise test may be performed to assess volume responsiveness by autotransfusion of approximately 300 mL of blood from the splanchnic and lower limb compartments to the central circulation, increasing preload.
• Intracavitary pressures: Abdominal hypertension and increased intrathoracic pressures (i.e., during positive-pressure ventilation and application of positive end-expiratory pressure [PEEP]) can oppose venous return.
• Ventricular compliance: Ventricular compliance determines the relationship between EDV and end-diastolic pressure (i.e., diastolic dysfunction or impaired relaxation as in ventricular hypertrophy).
• Heart rate: The filling time influences EDV.
• Atrial contraction: Atrial contraction contributes to EDV and may be impaired (i.e., in atrial fibrillation).
Static Indicators of Preload
Static indices of the left side of the heart:
• Left ventricular end-diastolic volume (LVEDV)
• Left ventricular end-diastolic pressure (LVEDP)
• Pulmonary artery occlusion or “wedge” pressure (PAOP or PAWP)
Static indices of the right side of the heart:
For the left side of the heart these relationships are as follows:

For the right side of the heart these relationships are as follows:

PAOP overestimates LVEDP in the following conditions:
PAOP underestimates LVEDP in the following conditions:
The PAOP does not predict preload and bears little or no relationship to the subsequent response to a volume challenge. It is important to realize, however, that pressure is one of the driving forces responsible for edema formation in the lungs. In this regard, the PAOP may function as more of a safety limit rather than as a guide to therapy.5–7
The CVP reflects RAP and has been traditionally used as a marker of right ventricular preload and, assuming a relationship between CVP, RVEDP, and RVEDV, of left ventricular preload. However, CVP does not accurately reflect left ventricular preload and has been shown to correlate poorly with blood volume.5–7 The main clinical value of measuring CVP is to provide information about the right side of the heart, as in cases of right ventricular failure or in assessing the right ventricular response to pulmonary hypertension. A low CVP in the setting of clinical signs of tissue hypoperfusion may be predictive of a benefit from fluid administration, and a rapid significant rise of CVP during a fluid challenge may indicate that the heart is not fluid responsive.8–12
Volumetric Indicators of Preload
Based on cardiac output measurements using thermodilution and incorporating indicator passage times, volumetric preload parameters have been introduced as an alternative to conventional “static” parameters and have become available with thermodilution-based monitoring techniques such as the PAC, pulse contour continuous cardiac output (PiCCO), and EV1000 systems. The continuous end-diastolic volume index (CEDVI), derived from a modified PAC is a surrogate of RVEDV. Global end-diastolic volume index (GEDVI), intrathoracic blood volume index (ITBVI), and extravascular lung water index (EVLWI) are parameters provided by devices that require transpulmonary thermodilution for the measurement of cardiac output based on pulse pressure analysis (i.e., PiCCO and EV1000 systems, see later). GEDVI represents the total intracardiac volume, and the volume of the descending aorta has been shown to be a better indicator of preload than CVP.13,14
Dynamic Indicators of Preload (or Preload Responsiveness)
Based on the study of heart-lung-interactions a number of so-called dynamic preload indicators have been introduced. Although these parameters are not measures of preload per se, they play an important role in the prediction of the hemodynamic response (i.e., by an increased cardiac output) to an increase in preload (preload or “volume” responsiveness). Generally, these parameters are based on the observation that transient changes in preload occur during mechanical ventilation.15,16
Stroke Volume Variation
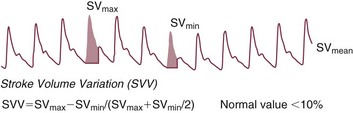
During mechanical ventilation each positive-pressure breath induces a decrease in venous return. In conditions of decreased volume status, when the right ventricle is responsive to an increase in preload, a reduction in right ventricular outflow will occur and result in a decrease of left ventricular preload after the number of cardiac cycles it takes to pump blood through the lung (pulmonary transit time). If the left ventricle is preload responsive as well, a transient decrease in stroke volume will occur. This cyclic variation in stroke volume (stroke volume variation, SVV) can indicate volume responsiveness if it reaches a certain degree and may describe the response to a volume challenge in relation to changes in cardiac output.17–21
Pulse Pressure Variation
Similar to SSV, a marked respiratory variation of the arterial pulse pressure (pulse pressure variation, PPV) has been found to accurately predict volume responsiveness.22–24
Plethysmographic Variability Index
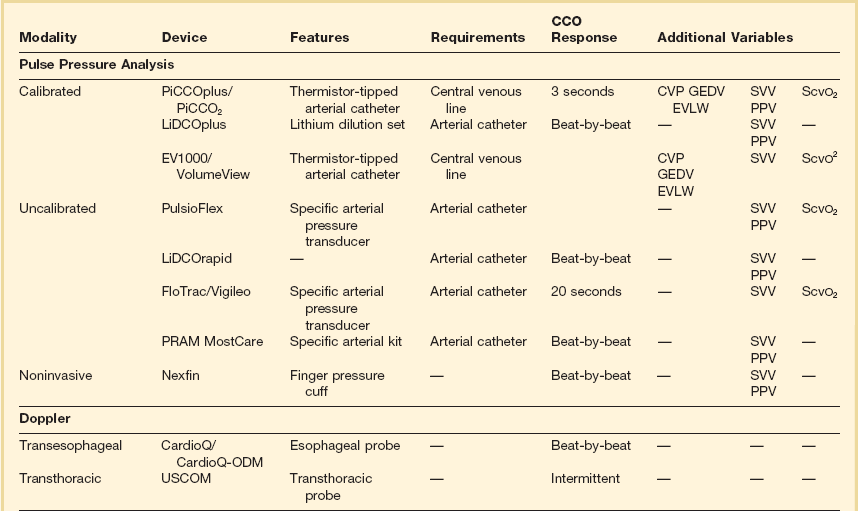
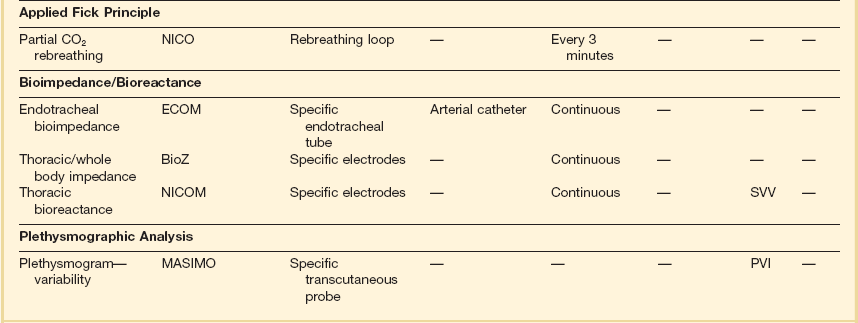
The pulse oximeter plethysmographic waveform has been shown to display respiratory variations during mechanical ventilation, which can be predictive of volume responsiveness. Calculation of the plethysmographic variability index (PVI) is performed by measuring changes of the perfusion index (PI = pulsatile infrared signal/nonpulsatile infrared signal × 100) over at least one respiratory cycle.25–27
Indices Derived by Echocardiography
Finally, respiratory variations of the inferior vena cava diameter as measured by transthoracic echocardiography (TTE) or the superior vena cava (SVC) diameter as measured by transesophageal echocardiography (TEE) have been shown to accurately predict volume responsiveness.28,29
Contractility
Factors that increase myocardial contractility:
• Drugs (inotropes, digoxin, calcium solutions)
• Metabolic state (i.e., hyperthermia)
Afterload
where T = tension, P = intraventricular pressure, and r = intraventricular radius. In this equation afterload is mainly dependent on wall thickness and ventricular radius. At a given pressure, an increase in ventricular radius (i.e., dilatation of the ventricle) will increase afterload. An increase in wall thickness (i.e., ventricular hypertrophy) will reduce afterload.
Afterload for the left ventricle is increased by the following factors:
• Anatomic obstruction (e.g., aortic valve stenosis, subvalvular obstruction)
• Raised systemic vascular resistance (SVR)
Afterload for the right ventricle is increased by the following factors:
• Anatomic obstruction (e.g., pulmonary valve stenosis)
• Raised pulmonary vascular resistance (PVR) (e.g., pulmonary hypertension, pulmonary embolism, hypoxia, and hypercarbia)
Indicators of Afterload
• Flow component—frictional opposition to blood flow through the vessels, with blood viscosity being the major determinant: Vascular resistance increases with an increase in viscosity.
• Frequency-dependent or “reactive” component—related to the compliance of the vessel walls and the inertia of the ejected blood. A low vascular compliance increases vascular resistance.
SVR and PVR cannot be measured directly and thus are calculated from Ohm’s law:

where V = voltage, I = current, and R = resistance. Applied to cardiovascular physiology this principle looks as follows:

in which ΔP is the pressure gradient, CO (cardiac output) is “flow,” and R is the resistance.

where MAP = mean arterial pressure (mm Hg), RAP = right atrial pressure (mm Hg), and CO = cardiac output. To convert from mm Hg to dyne × second/cm5 the multiplication by 80 is necessary. Normal values for SVR range from 800 to 1200 dyne × second/cm5. If standardized to body surface area, SVR is quoted as SVRI (SVR index) with normal values for SVRI ranging from 1900 to 2400 dyne × second/cm5/m2.
The following factors affect SVR:
• Vessel diameter: According to the law of Hagen-Poiseuille resistance is inversely related to the fourth power of the radius. This means that a decrease in vessel diameter during vasoconstriction will result in a significant increase in SVR. Vasodilation decreases SVR.

Values for PVR are normally below 250 dyne × second/cm5. Again, PVR is often quoted as the PVR index or PVRI with a normal range between 255 to 285 dyne × second/cm5/m2.
Clinical Limitations of Systemic Vascular Resistance and Pulmonary Vascular Resistance
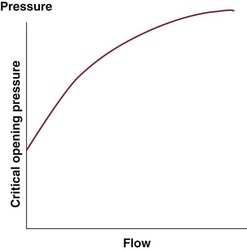
Although the concept of vascular resistance permits an intuitive understanding of the circulation, a number of limitations make it unreasonable to use SVR and PVR to guide therapy. First, because SVR and PVR are derived variables, errors inherent in the measurement of their components (i.e., filling pressures) are multiplied, making the derived number less accurate. Further, these calculations assume a linear relation between pressure and flow, which does not exist in vivo (Fig. 3.2). It is therefore wise to use these parameters with caution and consider their limitations in clinical practice.
Clinical Interpretation of Indicators of Preload
It has already been stressed that accurate assessment of the preload status of the heart is important because it may allow for the application of interventions resulting in an improvement of cardiovascular dynamics. However, without knowing whether the heart will actually respond to an increase of a certain status of volume or preload, this information is only of limited value. This concept—the individual response of cardiac output to a volume challenge—has become known as volume responsiveness.30 Intravascular volume expansion is often the initial intervention in patients with circulatory failure. However, only approximately 50% of patients given a fluid challenge will respond by increasing cardiac output. The ability to distinguish fluid-responsive patients from nonresponders is important to avoid inappropriate and potentially harmful fluid challenges in situations in which other interventions (i.e., inotropes or vasopressors) should be preferentially used. Consequences of inappropriate fluid therapy include pulmonary edema, deterioration in gas exchange, and cardiac failure.
Static Indicators of Preload
Conventional static markers of cardiac preload, such as CVP and PAOP, are poor predictors of fluid responsiveness. CVP and PAOP reflect intracavitary pressures that frequently show poor correlation with transmural pressures, which are actually related to EDV through chamber compliance. Therefore, EDV is overestimated (i.e., under the application of PEEP) or underestimated (i.e., in concentric left ventricular hypertrophy) in many clinical situations. Furthermore, static parameters do not determine the position of the heart on the “individual” Frank-Starling curve as contractile function is not taken into the account. A patient may fail to respond to a fluid challenge because of ventricular dysfunction or poor ventricular compliance (see Fig. 3.1). It is important to realize, however, that pressure is one of the driving forces responsible for edema formation in the lungs. So although the PAOP is considered to have limited utility for predicting and guiding fluid challenges, it does have a role to play in determining how much volume should be administered to patients and may be regarded as more of a safety limit, rather than as a guide to therapy.5,6
Volumetric Indicators of Preload
The continuous end-diastolic volume (CEDV), global end-diastolic volume (GEDV), and intrathoracic blood volume (ITBV) are computed by some monitoring systems. Although CEDV and GEDV seem to be better indicators of preload than static parameters, they are still poor predictors of a response to a fluid challenge in most situations. Extravascular lung water (EVLW) has been shown to help in the identification of noncardiogenic pulmonary edema and has the potential to increase the safety of fluid therapy in patients with structural lung disease or acute lung injury (ALI) and acute respiratory distress syndrome (ARDS).31,32
Dynamic Indicators of Preload
A number of dynamic parameters have been described that allow the clinician at the bedside to predict with some accuracy which patients will or will not respond to a fluid challenge. These parameters include the SVV, PPV, SPV, and the PVI and changes of vena cava diameters as derived by echocardiography. Generally, an SPV, PPV, SVV, or PVI variation greater than approximately 10% suggests that the patient will be volume responsive (Fig. 3.3). As stressed earlier in this chapter, these parameters require controlled mechanical ventilation and a tidal volume of at least 8 mL/kg of body weight to be maintained in order to remain reliable. Further, the presence of arrhythmias and severe tricuspid regurgitation precludes the safe use of these variables.16
The Passive Leg-Raising Test
Patients who are critically ill seldom fulfill criteria to allow for dynamic preload indices to be accurate predictors of volume responsiveness. The passive leg-raising test has been suggested to overcome these limitations: Traditionally performed by lifting the legs up at a 45-degree angle in a supine position, approximately 150 mL of blood can be recruited to increase venous return in order to predict a response of cardiac output to a noninvasive, endogenous fluid challenge. However, by starting the passive leg raising from a 45-degree semirecumbent position, a substantial increase of mobilized venous blood can be achieved by adding venous blood from the splanchnic compartment to that from the lower extremities, increasing the sensitivity of the maneuver for the prediction of fluid responsiveness. It is important to note that when performing the passive leg raising, the monitoring modality used must be able to track changes in cardiac output within a time frame of approximately 60 to 90 seconds.33–35
The Diagnostic Fluid Challenge
In the care of critically ill patients situations do exist in which the preceding parameters are not reliable and a passive leg-raising test may be contraindicated owing to technical constraints or based on the patient’s underlying illness, such as in brain injury with elevated intracranial pressure. In this scenario the clinician may rely on the administration of fluids as a diagnostic intervention to indicate a potential benefit from further fluid therapy by assessing the response of various hemodynamic parameters, with stroke volume being the parameter most widely used in studies investigating fluid responsiveness, with an increase of 10% to 20% indicating a positive response. Although the optimal volume to function as a fluid challenge has yet to be determined, it can be recommended in this situation to use the CVP as an indicator of a sufficient challenge of the right ventricle to ensure that an adequate preload has been achieved.36,37
Hemodynamic Status and Blood Flow

This variable (oxygen delivery) has been used in many studies, especially in the high-risk surgical population, as a target for resuscitation.
Measurement of Cardiac Output
The ideal method of measuring cardiac output would be noninvasive, accurate, continuous, safe, easy to use, and operator independent; would provide rapid data acquisition; and would be cost effective. None of the cardiac output monitoring devices currently available possesses all of these properties. Conventional thermodilution remains the clinical gold standard for accuracy in cardiac output measurement; however, newer, less invasive monitoring methods that provide continuous cardiac output data are establishing a role in patients’ hemodynamic management.38
Thermodilution
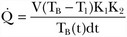
As mentioned earlier, thermodilution from the PAC is considered to be the gold standard of cardiac output measurement for accuracy and acceptability in the clinical setting. Newer methods are routinely validated against the PAC thermodilution technique. A bolus of 5 to 10 mL of cold 0.9% NaCl or 5% dextrose is injected through the proximal port of a PAC into the right atrium. Temperature changes are measured by a distal thermistor in the pulmonary artery. A plot of temperature change against time gives a thermodilution curve from which cardiac output can be calculated from the Stewart-Hamilton equation (Fig. 3.4). Application of this equation assumes three major conditions: complete mixing of blood and indicator, no loss of indicator between place of injection and place of detection, and constant blood flow. For accurate results with this technique, it is important to ensure adherence to these conditions.
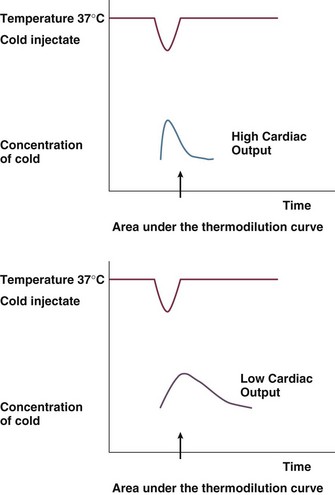
The degree of change in the temperature is inversely proportional to the cardiac output.
 = cardiac output
Arterial Pulse Pressure Analysis
Arterial pulse pressure analysis is a technique of measuring and monitoring stroke volume on a beat-to-beat basis from the arterial pulse pressure waveform. This technique has several advantages over technologies such as the PAC, including its less invasive nature, as arterial access is available in most patients. Changes in both stroke volume and cardiac output are then shown on an almost continuous basis. A fair amount of less invasive cardiac output monitoring devices based on pulse pressure analysis are now commercially available and have resulted in a decreased use of the pulmonary catheter in most institutions (Table 3.5).
The need to incorporate arterial compliance and resistance into the measurement system has hindered this technology for many years. The origins of the pulse contour method for estimation of beat-to-beat stroke volume are based on the Windkessel model described by Otto Frank in 1899. Only recently have methods been described that can compensate or correct for these compliance or resistance changes to provide an accurate determination of stroke volume. Different technologies address this by different methods. Both lithium dilution and thermodilution techniques have been validated to calibrate pulse pressure tracking systems. Other devices are being marketed with the ability to self-calibrate after identifying vascular compliance and resistance directly from the pressure waveform.39
Proprietary Systems Requiring Calibration
PiCCO System
The PiCCO system40 (Pulsion Medical Systems, Munich, Germany) utilizes a pulse contour method of tracking arterial pressure to derive changes in stroke volume. This system consists of a thermistor-tipped catheter, which is placed in the femoral or brachial artery. The device identifies the systolic area by recognizing the dicrotic notch on the arterial waveform. The systolic area is divided by the aortic impedance to calculate stroke volume. Transpulmonary thermodilution, requiring a central venous line, is used to calibrate the system in order to account for individual aortic compliance. In addition to tracking cardiac output and stroke volume, this technology also can provide dynamic indicators of volume responsiveness (SVV, SPV, and PPV), as well as a number of volumetric markers of preload (GEDV, ITBV, and EVLW). This system has been shown to be interchangeable with the pulmonary catheter in terms of the accuracy of measuring cardiac output and has been validated in a broad spectrum of clinical settings.40
LiDCOplus System
The LiDCOplus41–44 (LiDCO, Cambridge, UK) tracks the power of the arterial waveform, rather than the contour, in order to track changes in stroke volume. A theoretical advantage is that the effect of reflected waves is reduced because the device does not need to identify specific parts of the arterial waveform. Because the morphologic pattern is not assessed, this technology also decreases (but does not negate) the effects of damping on the pressure system. This system can be calibrated by any independent form of cardiac output monitoring device but is sold with the proprietary lithium dilution cardiac output modality. The LiDCOplus technology also tracks the dynamic parameters of preload: SVV, SPV, and PPV.
EV1000 System
The EV1000 system has been recently introduced as a monitoring device based on pulse pressure analysis. Its components include a proprietory thermistor-tipped femoral arterial catheter and a separate sensor connected to the EV1000 monitor. Calibration by transpulmonary thermodilution is required and the system offers additional hemodynamic variables (GEDV, EVLW, SVV). Initial evaluation studies have shown a good agreement with the PiCCO system in the measurement of cardiac output and volumetric indices.45,46
Uncalibrated Systems
PulsioFlex System.
This system (Pulsion Medical Systems, Munich, Germany), based on the PiCCO pulse contour algorithm, uses a proprietary transducer (ProAQT) integrated into the PulsioFlex system and does not require calibration. The device has recently been introduced by Pulsion Medical Systems, and initial clinical validation studies have shown good agreement with cardiac output measurements using transpulmonary thermodilution.47
Flotrac.
The Flotrac system (Edwards Lifesciences, Irvine, CA) consists of a proprietary transducer and a separate monitor (Vigileo). The technology assesses the variance of the arterial waveform in comparison with specific demographic characteristics of the patient to identify changes in stroke volume and analyzes statistical properties of the arterial pressure waveform to account for individual vascular resistance and compliance. Recent software updates have considerably improved the response time to changes in vascular dynamics (approx. 20 seconds), although concerns remain regarding the accuracy of cardiac output measurements in acute hemodynamic changes. Nonetheless, the Flotrac/Vigileo system has been integrated into protocols of hemodynamic optimization showing an improvement in clinical outcomes.48–51
Nexfin.
The Nexfin system has been introduced recently as a totally noninvasive monitor of cardiac output. This system operates by applying a stepwise approach: An arterial pressure signal generated by combining photoelectric plethysmography with an intermittently inflated pressure cuff to maintain a constant arterial diameter. This finger arterial pressure signal is converted to a brachial arterial pressure waveform, which is used to calculate cardiac output. The current algorithm uses individualized components of a three-element Windkessel model, with age, gender, height, and weight as input parameters, incorporating the nonlinear effect of mean pressure and the influence of individual characteristics on aortic mechanical properties. Clinical studies have shown adequate correlation with cardiac output derived by thermodilution. The device offers the possibility of monitoring cardiac output at a very early clinical stage and may be instrumental in early treatment initiation.52
Masimo System.
Although this is not a pulse pressure analysis-based monitor by definition, the Masimo system has the potential for use as an uncalibrated system for hemodynamic optimization. This device provides automated measurement of the PVI from a disposable finger sensor by measuring changes in perfusion index (PI = pulsatile infrared signal/nonpulsatile infrared signal × 100) over a time interval including at least one complete respiratory cycle.25–27
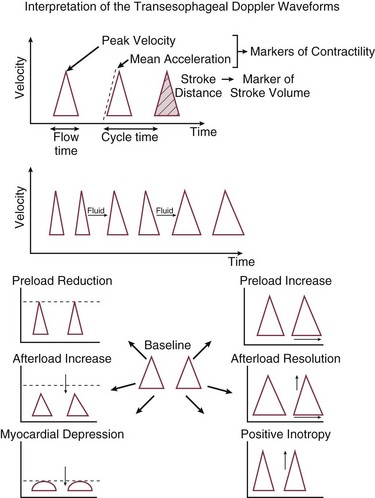
Transesophageal Doppler53–56
Despite several potential sources of error, good correlation has been observed between measures of cardiac output made simultaneously with the esophageal Doppler monitor and with conventional thermodilution. Esophageal Doppler ultrasonography has been used for intravascular volume optimization both in the perioperative period and in the critical care setting.29,32–35 One of the main advantages of the technique is the capability of rapid data acquisition after esophageal probe insertion.
Esophageal Doppler waveform analysis has been increasingly evaluated as a method for determining optimal cardiac preload. The key preload parameter of interest is the flow time (FT)—the time required from the start of the waveform upstroke to return to baseline. FT represents the duration of left ventricular systole and makes up one third of the cardiac cycle (cycle time). Because the FT is heart rate dependent, it typically is corrected (FTC) to a rate of 60 beats per minute to compensate for the change in duration of systole. The FTC reflects the afterload status of the circulation. Decreased levels commonly are seen in hypovolemic patients, but caution in interpretation is advised because this pattern also can be seen with profound vasoconstriction. A more sensible use of this device is in following the effects of a fluid challenge. Because stroke volume can be determined on a beat-to-beat basis, it is easy to see the effects on the circulation of a small fluid bolus. Diagrammatic representations of characteristic Doppler waveform patterns are shown in Figure 3.5.
Echocardiography57,58
The main disadvantages of the method are that a skilled operator is needed, the probe is large and therefore heavy sedation or anesthesia is needed, the equipment is very expensive, and an expert user is needed to adjust the probe to give continuous cardiac output readings. Nonetheless, echocardiography has an important and established clinical role. The modality is covered in detail in Chapter 8.
Bioimpedance and Bioreactance
Transthoracic bioimpedance is a technique initially developed as a noninvasive method of studying cardiovascular function during space flight. The underlying principle is the occurrence of changes in electrical impedance of the thoracic cavity with ejection of blood during systole.37 In this model, the thorax is assumed to be a cylinder having electrical length between neck and xiphoid and has a basic impedance. A constant small current is passed between two outer electrodes attached to the skin (BioZ system) or an endotracheal tube (ECOM system), voltage change is sensed by two inner electrodes, and impedance is derived according to the equations described by Sramek and Bernstein.59 Impedance is recognized to change with the cardiac cycle (related to changes in blood volume). The rate of change of impedance is a reflection of cardiac output. It is thought to be useful in estimating trends in cardiac output but not for absolute measurements. Contraction of the heart produces a cyclic change in transthoracic impedance of approximately 0.5%, unfortunately giving a rather low signal-to-noise ratio. Stroke volume and cardiac output can be measured continuously and at fixed intervals using this technique. Studies suggest that transthoracic bioimpedance is accurate in healthy volunteers, but its reliability decreases in critically ill patients, including those with sepsis or increased lung water, and in persons with pacemakers. Clinical evaluation studies have so far shown conflicting results and the technique has not gained wide clinical acceptance to date.60–62
Bioreactance
As opposed to bioimpedance, this technique is based on the delivery of an oscillating electrical current and its modification by changes in stroke volume. The currently available NICOM system (Cheetah Medical, Inc., Vancouver, WA, USA) provides estimation of cardiac output by analyzing the variations in the frequency spectra of the electrical oscillations. Initial clinical validation studies have shown promising results.63,64
Application of the Fick Principle
The NICO (Novametrix) system is a noninvasive device that applies Fick’s principle on CO2 and relies solely on airway gas measurement. The method actually calculates effective lung perfusion—that part of the pulmonary capillary blood flow that has passed through the ventilated parts of the lung. The effects of unrecognized ventilation-perfusion inequality in patients may explain why the results with this method show a lack of agreement between thermodilution and CO2-rebreathing cardiac output.65–68
Assessment of Adequacy of the Circulation
Clinical Assessment
The first step in the hemodynamic assessment must be a thorough clinical assessment. Pulse rate and quality, respiratory rate, skin temperature, capillary refill time, core-peripheral temperature gradient, level of consciousness, and urine output are strongly related to cardiovascular dynamics, and a change in these clinical parameters may indicate deterioration as well as a positive response to a hemodynamic intervention. Skin mottling, pallor, and diaphoresis are alarming signs that need immediate and appropriate intervention. Recent studies have shown a strong relationship between clinical and microcirculatory parameters and underline their importance in hemodynamic assessment.69–71
Mixed Venous Oxygenation72–75
 is the oxygen saturation of mixed venous blood in the pulmonary artery. It reflects the overall venous saturation after the blood has been fully mixed in the right side of the heart.
  is related to the balance between oxygen delivery (DO2I) and the ability to extract oxygen, or the oxygen extraction ratio (O2ER). Under normal circumstances, oxygen consumption is independent of supply until oxygen delivery falls below the anaerobic threshold. The normal O2ER is approximately 25%, giving an
  of 75%. In the face of a reduction in oxygen delivery, the tissues maintain oxygen consumption by increasing oxygen extraction, so
  decreases. However,
  does not necessarily vary with cardiac output. Not all patients can increase their O2ER if DO2I falls. Clinically, the response of
  to an increase in cardiac output or oxygen delivery can aid hemodynamic manipulation.
  can be measured by sampling blood from the distal lumen of a PAC and then measuring oxyhemoglobin saturation by means of co-oximetry, or by using an oximetric PAC that is able to continuously display
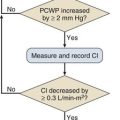
  . A flow diagram of a published protocol using PAC-derived parameters is shown in Figure 3.6.
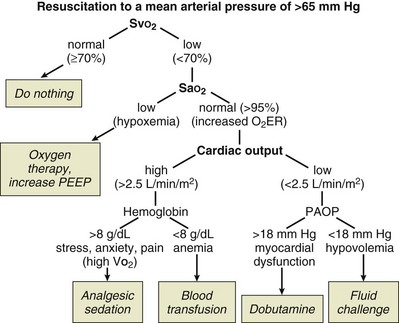
 should be monitored and the key variables manipulated to keep it within the normal range (65% to 75%). In practice, this means ensuring that the hemoglobin concentration and arterial oxygen saturation are normal and then either increasing cardiac output or decreasing oxygen utilization (such as by sedation or cooling). Thus,
  monitoring provides a means of assessing the adequacy of cardiac output for a given patient. This strategy has been used with success in post–cardiac surgery patients and has been suggested for use in critically ill patients.
Central Venous Oxygen Saturation
In patients without PACs in place, central venous oxygen saturation (ScvO2) may be measured by sampling from the distal lumen of a central venous line in the SVC. This variable bears some relationship to the mixed venous oxygen saturation, although because the venous blood is not totally mixed in the SVC, the relationship should be considered as representing a guide rather than reflecting reality. In practice, the central venous oxygen saturation should be used as a screening tool, rather than as an accurate marker of adequacy. If the level is very low, then the inference can be made that the circulation is inadequate; however, near-normal levels do not preclude underlying problems. The use of this variable in this fashion has proved successful in reducing mortality rates for early severe sepsis and is recommended as a target for therapy by the Surviving Sepsis Campaign.74–76
Blood Lactate
Blood lactate levels represent the balance between lactate production and lactate metabolism. The liver is responsible for the major part of lactate metabolism. Inadequate oxygen delivery and tissue hypoxia, irrespective of the underlying cause, results in increased lactate generation. In critically ill patients, high blood lactate levels develop from a combination of inadequate oxygen delivery secondary to poor perfusion (in terms of both perfusion pressure and flow), impaired cellular oxygen utilization from mitochondrial damage, and reduced hepatic clearance of lactate. A resolving lactic acidosis along with clinical signs of improved perfusion is an important indicator of improving perfusion after resuscitation. Lactate levels and lactate clearance have been shown to predict mortality risk and morbidity, and studies investigating protocols aimed at decreasing lactate levels have shown the potential role of lactate as a treatment goal.77–80
Venous-to-Arterial CO2 Difference (PCO2 Gap)
Oxygen-derived parameters, namely  and ScvO2, may falsely indicate adequate tissue perfusion in the presence of anaerobic metabolism due to microcirculatory compromise. In this situation, a decrease in oxygen consumption (VO2) may occur, either because of impaired oxygen delivery or reduced oxygen demand resulting in normal levels of
  or ScvO2. In hypoxic conditions due to impaired tissue perfusion a rise in the partial pressure of CO2 (PCO2) is usually seen, widening the gap between arterial and venous PCO2. Recent clinical studies have suggested that the venous-to-arterial CO2 difference using a central venous and an arterial blood sample (P(cv − a)CO2 or PCO2 gap) may be used as a complementary tool to unmask inadequate tissue perfusion in patients who are apparently resuscitated to target goals, namely, an ScvO2 of 70%. Further prospective clinical studies will show if this parameter has the potential to function as a treatment goal in the resuscitation of critically ill patients with hemodynamic compromise.81–83
Goal-Directed Therapy
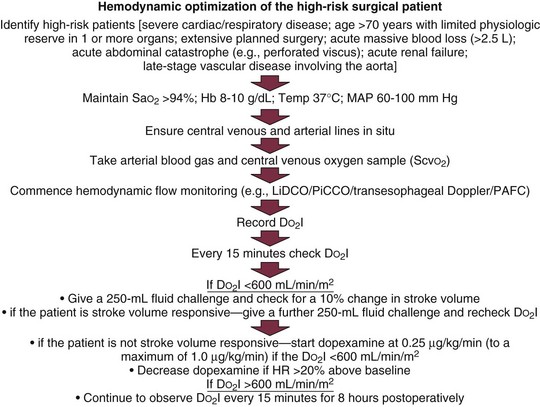
Hemodynamic Optimization of the High-Risk Surgical Patient
Many different protocols have been used for the management of the high-risk surgical patient.84–92 Initially all such protocols targeted an oxygen delivery index of 600 mL/minute/m2 with the use of fluids and positive inotropic agents. Measurement of cardiac output was performed through a PAC. Currently, many different protocols have been devised, some targeting oxygen delivery, some the mixed venous oxygen saturation, and some ensuring adequate volume loading by targeting a maximal stroke volume. The newer protocols reflect the more modern technologies, so they typically involve less invasive strategies and techniques. Data suggesting one protocol over another are essentially lacking, so it is best to choose appropriate monitoring technologies and therapeutic end points in accordance with the particular characteristics of the patient group being treated and depending on availability of appropriate devices and trained practitioners. Two protocols for optimization are shown in Figures 3.6 and 3.7.
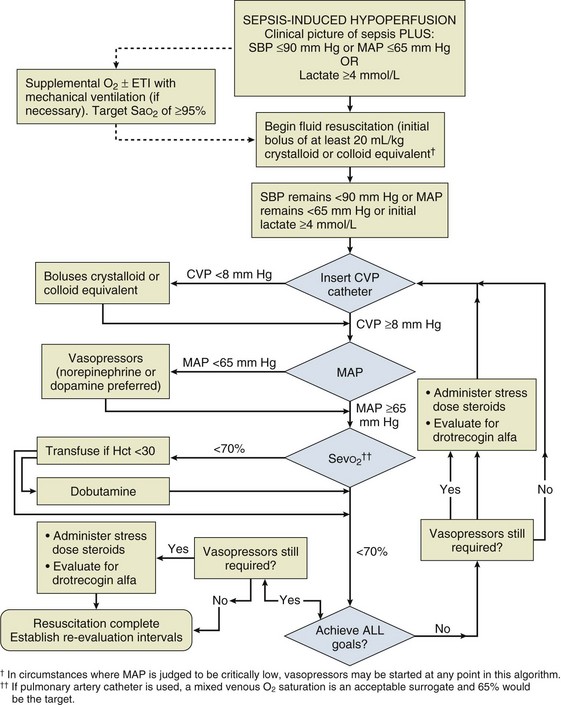
Early Goal-Directed Therapy of Severe Sepsis
Resuscitation of patients with severe sepsis and septic shock has been studied with an early goal-directed approach74 (Fig. 3.8). In this approach, cardiac output has not actually been measured; however, a number of surrogate markers of adequacy of the circulation have been targeted. Volume loading is instigated early in this protocol and then targeted against markers of lactate metabolism and central venous oxygen saturation. If these markers fail to fall, then oxygen utilization is decreased by sedation and mechanical ventilation, and oxygen delivery is increased with the use of red blood cell transfusion and a positive inotrope. It should be noticed that although different parameters are being used, this strategy is very similar in principle to that used in the high-risk surgical group of patients.
References
1. Patterson, SW, Piper, H, Starling, EH. The regulation of the heart beat. J Physiol. 1914; 48:465–513.
2. Patterson, SW, Starling, EH. On the mechanical factors which determine the output of the ventricles. J Physiol. 1914; 48:357–379.
3. Guyton, AC. Determination of cardiac output by equating venous return curves with cardiac response curves. Physiol Rev. 1955; 35:123–129.
4. Guyton, AC, Lindsey, AW, Kaufmann, BN. Effect mean circulatory filling pressure and other peripheral circulatory factors on cardiac output. Am J Physiol. 1955; 180:463–468.
5. Pinsky, MR. Clinical significance of pulmonary artery occlusion pressure. Intensive Care Med. 2003; 29:175–178.
6. Pinsky, MR, Vincent, JL. Let us use the pulmonary artery catheter correctly and only when we need it. Crit Care Med. 2005; 33:1119–1122.
7. Pinsky, MR. Pulmonary artery occlusion pressure. Intensive Care Med. 2003; 29:19–22.
8. Lichtwarck-Aschoff, M, Beale, R, Pfeiffer, UJ. Central venous pressure, pulmonary artery occlusion pressure, intrathoracic blood volume and right ventricular end diastolic volume as indicators of cardiac preload. J Crit Care. 1996; 11:180–188.
9. Kumar, A, Anel, R, Bunnell, E, et al. Pulmonary artery occlusion pressure and central venous pressure fail to predict ventricular filling volume, cardiac performance, or the response to volume infusion in normal subjects. Crit Care Med. 2004; 32:691–699.
10. Osman, D, Ridel, C, Ray, P, et al. Cardiac filling pressures are not appropriate to predict hemodynamic response to volume challenge. Crit Care Med. 2007; 35:1–5.
11. Michard, F, Teboul, JL. Predicting fluid responsiveness in ICU patients. A critical analysis of the evidence. Chest. 2002; 121:2000–2008.
12. Marik, PE, Baram, M, Vahid, B. Does central venous pressure predict fluid responsiveness ? A systematic review of the literature and the tale of seven mares. Chest. 2008; 134:172–178.
13. Hofer, CK, Furrer, L, Matter-Ensner, S, et al. Volumetric preload measurement by thermodilution: A comparison with transoesophageal echocardiography. Br J Anaesth. 2005; 94:748–755.
14. Goepfert, MS, Reuter, DA, Akyol, D, et al. Goal-directed fluid management reduces vasopressor and catecholamine use in cardiac surgery patients. Intensive Care Med. 2007; 33:96–103.
15. Bendjelid, K, Romand, JA. Fluid responsiveness in mechanically ventilated patients. A review of indices used in intensive care. Intensive Care Med. 2003; 29:352–360.
16. Marik, PE, Cavallazzi, R, Vasu, T, Hirani, A. Dynamic changes in arterial waveform derived variables and fluid responsiveness in mechanically ventilated patients: A systematic review of the literature. Crit Care Med. 2009; 37:2642–2647.
17. Tavernier, B, Makhotine, O, Lebuffe, G, et al. Systolic pressure variation as a guide to fluid therapy in patients with sepsis-induced hypotension. Anaesthesiology. 1998; 89:1313–1321.
18. Parry-Jones, AJD, Pittman, JAL. Arterial pressure and stroke volume variability as measurements for cardiovascular optimisation. Int J Intensive Care. 2003; 10:67–72.
19. Reuter, DA, Kirchner, A, Felbinger, TW, et al. Usefulness of left ventricular stroke volume variation to assess fluid responsiveness in patients with reduced cardiac function. Crit Care Med. 2003; 31:1399–1404.
20. Reuter, DA, Felbinger, TW, Schmidt, C, et al. Stroke volume variations for assessment of cardiac responsiveness to volume loading in mechanically ventilated patients after cardiac surgery. Intensive Care Med. 2002; 28:393–398.
21. Berkenstadt, H, Margalit, N, Hadani, M, et al. Stroke volume variation as a predictor of fluid responsiveness in patients undergoing brain surgery. Anesth Analg. 2001; 92:984–989.
22. Gunn, SR, Pinsky, MR. Implications of arterial pressure variation in patients in the intensive care unit. Crit Care. 2001; 7:212–217.
23. Michard, F, Boussat, S, Chemla, D, et al. Relation between respiratory changes in arterial pulse pressure and fluid responsiveness in septic patients with acute circulatory failure. Am J Resp Crit Care Med. 2000; 162:134–138.
24. Kramer, A, Zygun, D, Hawes, H, et al. Pulse pressure variation predicts fluid responsiveness following coronary artery bypass surgery. Chest. 2004; 126:1563–1568.
25. Desebbe, O, Cannesson, M. Using ventilation-induced plethysmographic variations to optimize patient fluid status. Curr Opin Anaesthesiol. 2008; 21:772–778.
26. Forget, P, Lois, F, de Kock, M. Goal-directed fluid management based on the pulse oximeter-derived pleth variability index reduces lactate levels and improves fluid management. Anesth Analg. 2010; 111:910–914.
27. Hood, JA, Wilson, RJ. Pleth variability index to predict fluid responsiveness in colorectal surgery. Anesth Analg. 2011; 113:1058–1063.
28. Feissel, M, Michard, F, Faller, JP, et al. The respiratory variation in inferior vena cava diameter as a guide to fluid therapy. Intensive Care Med. 2004; 30:1834–1837.
29. Vieillard-Baron, A, Chergui, K, Rabiller, A, et al. Superior vena caval collapsibility as a gauge of volume status in ventilated septic patients. Intensive Care Med. 2004; 30:1734–1739.
30. Monnet, X, Teboul, JL. Volume responsiveness. Curr Opin Crit Care. 2007; 13:549–553.
31. Della Rocca, G, Costa, MG, Pietropaoli, G. How to measure and interpret volumetric measures of preload. Curr Opin Crit Care. 2007; 13:297–302.
32. Sakka, SG, Klein, M, Reinhart, K, Meier-Hellmann, A. Prognostic value of extravascular lung water in critically ill patients. Chest. 2002; 122:2080–2086.
33. Monnet, X, Rienzo, M, Osman, D, et al. Passive leg raising predicts fluid responsiveness in the critically ill. Crit Care Med. 2006; 34:1402–1407.
34. Monnet, X, Teboul, JL. Passive leg raising. Intensive Care Med. 2007; 34:659–663.
35. Jabot, J, Teboul, JL, Richard, C, et al. Passive leg raising for predicting fluid responsiveness: Importance of the postural change. Intensive Care Med. 2009; 35:85–90.
36. Cecconi, M, Parsons, AK, Rhodes, A. What is a fluid challenge. Curr Opin Crit Care. 2011; 17:290–295.
37. Cecconi, M, Singer, B, Rhodes, A. The fluid challenge. In: Vincent JL, ed. Annual Update in Intensive Care And Emergency Medicine 2011. Berlin-Heidelberg: Springer-Verlag; 2011:332–339.
38. Allsager, CM, Swanevelder, J. Measuring cardiac output. Br J Anaesth CEPD Rev. 2003; 3:15.
39. Thiele, RH, Durieux, ME. Arterial waveform analysis for the anesthesiologist: Past, present, and future concepts. Anesth Analg. 2011; 113:766–776.
40. Oren-Grinberg, A. The PiCCO monitor. Int Anesthesiol Clin. 2010; 48:57–85.
41. Linton, R, Band, D, O’Brien, T, et al. Lithium dilution cardiac output measurement: A comparison with thermodilution. Crit Care Med. 1997; 25:1796–1800.
42. Kurita, T, Morita, K, Kato, S, et al. Comparison of the accuracy of the lithium dilution technique with the thermodilution technique for measurement of cardiac output. Br J Anaesth. 1999; 79:770–775.
43. Pearse, RM, Ikram, K, Barry, J. Equipment review: An appraisal of the LiDCOplus method of measuring cardiac output. Crit Care. 2004; 8:190–195.
44. Cecconi, M, Dawson, D, Grounds, RM, Rhodes, A. Lithium dilution cardiac output measurement in the critically ill patient: Determination of precision of the technique. Intensive Care Med. 2009; 35:498–504.
45. Bendjelid, K, Giraud, R, Siegenthaler, N, Michard, F. Validation of a new transpulmonary thermodilution system to assess global end-diastolic volume and extravascular lung water. Crit Care. 2010; 14:R209.
46. Kiefer, N, Hofer, CK, Marx, G, et al. Clinical validation of a new thermodilution system for the assessment of cardiac output and volumetric parameters. Crit Care. 2012; 16:R98.
47. Peetermans, M, Verlinden, W, Jacobs, J, et al. Validation of less-invasive hemodynamic monitoring with Pulsioflex in critically ill patients. Crit Care. 2012; 16(Suppl 1):P226.
48. Senn, A, Button, D, Zollinger, A, Hofer, CK. Assessment of cardiac output changes using a modified FloTrac/Vigileo algorithm in cardiac surgery patients. Crit Care. 2009; 13:R32.
49. Mayer, J, Boldt, J, Mengistu, AM, et al. Goal-directed intraoperative therapy based on autocalibrated arterial pressure waveform analysis reduces hospital stay in high-risk surgical patients: A randomized, controlled trial. Crit Care. 2010; 14:R18.
50. Cecconi, M, Fasano, N, Langiano, N, et al. Goal-directed haemodynamic therapy during elective total hip arthroplasty under regional anaesthesia. Crit Care. 2011; 15:R132.
51. Mayer, J, Boldt, J, Poland, R, et al. Continuous arterial pressure waveform-based cardiac output using the FloTrac/Vigileo: A review and meta-analysis. J Cardiothorac Vasc Anesth. 2009; 23:401–406.
52. Perel, A, Settels, JJ. Totally non-invasive continuous cardiac output measurement with the Nexfin CO-Trek. In: Vincent JL, ed. Annual Update in Intensive Care and Emergency Medicine 2011. Berlin: Springer-Verlag; 2011:434–442.
53. Marik, PE. Pulmonary artery catheterization and esophageal Doppler monitoring in the ICU. Chest. 1999; 116:1085–1091.
54. Singer, M, Clarke, J, Bennett, ED. Continuous hemodynamic monitoring by esophageal Doppler. Crit Care Med. 1989; 17:447–452.
55. Abbas, SM, Hill, AG. Systematic review of the literature for the use of esophageal Doppler monitor for fluid replacement in major abdominal surgery. Anaesthesia. 2008; 63:44–51.
56. Singer, M. Esophageal Doppler. Curr Opin Crit Care. 2009; 15:244–248.
57. DeBacker, D, Cholley, BP, Slama, M, et al. Haemodynamic Monitoring Using Echocardiography in the Critically Ill. Berlin: Springer-Verlag; 2011.
58. Fletcher, N. Echocardiography. In: Vincent JL, Hall JB, eds. Encyclopedia of Intensive Care Medicine 2011. Berlin: Springer-Verlag; 2012:798–808.
59. Bernstein, DP. A new stroke volume equation for thoracic electrical bioimpedance: theory and rationale. Crit Care Med. 1986; 14:904–909.
60. Bloch, KE. Impedance and inductance monitoring of cardiac output. In: Tobin MJ, ed. Principles and Practice of Intensive Care Monitoring. New York: McGraw-Hill; 1998:915–930.
61. Ball, TR, Culp, BC, Patel, V, et al. Comparison of the endotracheal cardiac output monitor to thermodilution in cardiac surgery patients. J Cardiothorac Vasc. 2010; 24:762–766.
62. Gujjar, AR, Muralidhar, K, Banakal, S, et al. Noninvasive cardiac output by transthoracic electrical bioimpedence in postcardiac surgery patients: Comparison with thermodilution method. J Clin Monit Comput. 2008; 22:175–180.
63. Squara, P, Denjean, D, Estagnasie, P, et al. Noninvasive cardiac output monitoring (NICOM): A clinical validation. Intensive Care Med. 2007; 33:1191–1194.
64. Raval, NY, Squara, P, Cleman, M, et al. Multicenter evaluation of noninvasive cardiac output measurement by bioreactance technique. J Clin Monit Comput. 2008; 22:113–119.
65. Van Heerden, PV, Baker, S, Lim, SI, et al. Clinical evaluation of the non-invasive cardiac output (NICO) monitor in the intensive care unit. Anaesth Intensive Care. 2000; 28:427–430.
66. Nilsson, LB, Eldrup, N, Berthelsen, PG. Lack of agreement between thermodilution and carbon dioxide rebreathing cardiac output. Acta Anaesthesiol Scand. 2001; 45:680–685.
67. Tachibana, K, Imanaka, H, Takeuchi, M, et al. Noninvasive cardiac output measurement using partial carbon dioxide rebreathing is less accurate at settings of reduced minute ventilation and when spontaneous breathing is present. Anesthesiology. 2003; 98:830–837.
68. Gueret, G, Kiss, G, Rossignol, B, et al. Cardiac output measurements in off-pump coronary surgery: Comparison between NICO and the Swan-Ganz catheter. Eur J Anaesthesiol. 2006; 23:848–854.
69. Ait-Oufella, H, Lemoinne, S, Boelle, PY, et al. Mottling score predicts survival in septic shock. Intensive Care Med. 2011; 37(5):801–807.
70. Lima, A, Jansen, TC, van Bommel, J, et al. The prognostic value of the subjective assessment of peripheral perfusion in critically ill patients. Crit Care Med. 2009; 37:934–938.
71. Sevransky, J. Clinical assessment of hemodynamically unstable patients. Curr Opin Crit Care. 2009; 15:234–238.
72. Pearse, RM, Dawson, D, Rhodes, A, et al. Low central venous saturation predicts postoperative mortality. Intensive Care Med. 2003; 29:S15.
73. Edwards, JD, Mayall, RM. Importance of the sampling site for measurement of mixed venous oxygen saturation in shock. Crit Care Med. 1998; 26:1356–1360.
74. Rivers, E, Nguyen, B, Havstad, S, et al. Early goal directed therapy in the treatment of severe sepsis and septic shock. N Engl J Med. 2001; 345:1368–1377.
75. Reinhart, K, Rudolph, T, Bredle, DL, et al. Comparison of central-venous to mixed oxygen saturation during changes in oxygen supply/demand. Chest. 1989; 95:1216–1221.
76. Marx, G, Reinhart, K. Venous oxymetry. Curr Opin Crit Care. 2006; 12:263–268.
77. Jansen, TC, van Bommel, J, Bakker, J. Blood lactate monitoring in critically ill patients: A systematic health technology assessment. Crit Care Med. 2009; 37:2827–2839.
78. Jones, AE, Shapiro, NI, Trzeciak, S, et al. Lactate clearance vs. central venous oxygen saturation as goals of early sepsis therapy: A randomized clinical trial. JAMA. 2010; 303:739–746.
79. Jansen, TC, van Bommel, J, Schoonderbeek, FJ, et al. Early lactate-guided therapy in intensive care unit patients: A multicenter, open-label, randomized controlled trial. Am J Respir Crit Care Med. 2010; 182:752–761.
80. Bakker, J, Jansen, TC. Blood lactate levels: A manual for bedside use. In: Vincent JL, ed. Annual Update in Intensive Care and Emergency Medicine 2012. Berlin: Springer-Verlag; 2012:383–390.
81. Cuschieri, J, Rivers, EP, Donnino, MW, et al. Central venous-arterial carbon dioxide difference as an indicator of cardiac index. Intensive Care Med. 2005; 31:818–822.
82. Vallée, F, Vallet, B, Mathe, O, et al. Central venous-to-arterial carbon dioxide difference: An additional target for goal-directed therapy in septic shock? Intensive Care Med. 2008; 34:2218–2225.
83. Futier, E, Teboul, JL, Vallet, B. How can we use tissue carbon dioxide measurement as an index of perfusion? In: Vincent JL, ed. Annual Update in Intensive Care and Emergency Medicine 2011. Berlin: Springer-Verlag; 2011:366–374.
84. Shoemaker, WC, Appel, PL, Kram, HB, et al. Prospective trial of supranormal values of survivors as therapeutic goals in high-risk surgical patients. Chest. 1988; 94:1176–1186.
85. Pearse, RM, Dawson, D, Fawcett, J, et al. Early goal-directed therapy after major surgery reduces complications and duration of hospital stay. Crit Care. 2005; 9:687–693.
86. Boyd, O, Grounds, RM, Bennett, ED. A randomized clinical trial of the effect of deliberate perioperative increase of oxygen delivery on mortality in high risk surgical patients. JAMA. 1993; 270:2699–2707.
87. Gan, TJ, Soppitt, A, Maroof, M, et al. Goal directed intraoperative fluid administration reduces length of hospital stay after major surgery. Anesthesiology. 2002; 97:820–826.
88. Gattinoni, L, Brazzi, L, Pelosi, P, et al. A trial of goal-orientated hemodynamic therapy in critically ill patients. SvO2 Collaborative Group. N Engl J Med. 1995; 333:1025–1032.
89. Lobo, SM, Salgado, PF, Castillo, VG, et al. Effects of maximising oxygen delivery on morbidity and mortality in high risk surgical patients. Crit Care Med. 2000; 28:3396–3404.
90. Polonen, P, Ruokonen, E, Hippelainen, M, et al. A prospective randomized study of goal-orientated hemodynamic therapy in cardiac surgical patients. Anesth Analg. 2000; 90:1052–1059.
91. Farrar D, Grocott MPW, Hamilton MA, et al: Optimal care of the higher risk surgical patient. Monograph prepared by the Centre for Anaesthesia, University College London, UK, for the October 2000 meeting on Optimization.
92. Hamilton, MA, Cecconi, M, Rhodes, A. A systematic review and meta-analysis on the use of preemptive hemodynamic intervention to improve postoperative outcomes in moderate and high-risk surgical patients. Anesth Analg. 2011; 112:1392–1402.