Chapter 3 Severity of illness and likely outcome from critical illness
At present scoring systems are not sufficiently accurate to make outcome predictions for individual patients.
Perhaps the earliest reference to grading illness was in an Egyptian papyrus which classified head injury by severity.1 More recently it has been the constellation of physiological disturbances for specific conditions which popularised an approach which linked physiological disturbance to outcome in the critically ill. Examples include the Ranson score for acute pancreatitis,2 the Pugh modification of Child–Turcotte classification for patients undergoing portosystemic shunt surgery and now widely used for classification of end-stage liver disease,3 Parsonnet scores for cardiac surgery4 and the Glasgow Coma Score (GCS) for acute head injury.5 The earliest attempts to quantify severity of illness in a general critically ill population was by Cullen et al.6 who devised a therapeutic intervention score as a surrogate for illness. This was followed in 1981 with the introduction of the Acute Physiology, Age and Chronic Health Evaluation (APACHE) scoring system by Knaus et al.7 Since then numerous scoring systems have been designed and tested in populations across the world.
The potential advantages of quantifying critical illness include:
The least controversial use for scoring systems has been as a method for comparing patient groups in clinical trials. While this seems to have been widely accepted by the critical care community, there has been less enthusiasm to accept the same systems as comparators for between-unit and even between-country performances, unless of course your performance is good. Most clinicians agree that scoring systems have limited value for individual patient decision pathways, although recently an APACHE II score above 25 under appropriate circumstances has been included in the guidelines for the administration of recombinant human activated protein C for severe sepsis and septic shock. Much of the sceptical views among clinicians are based on studies which show poor prognostic performance from many of the models proposed.8–14 The fundamental problem for these scores and prognostic models is poor calibration for the cohort of patients studied, often in countries with different health service infrastructures, to where the models were first developed. Other calibration issues arise either because there is poor adherence to the rules for scoring methodology by users, or patient outcomes improve following introduction of new techniques and treatments or models failed to include important prognostic variables. For example it has become clearer that prognosis is as much affected by local organisation, patient pathways, location prior to admission and preadmission state as it is by acute physiological disturbances.15,16
Score systems would be better calibrated if developed from a narrow number of countries with similar health services. However this limits their international usefulness for clinical studies. The latter can be improved by score systems developed from a wider international cohort; however when used for an individual country it can be expected to calibrate poorly. Simplified Acute Physiology Score 3 (SAPS 3: developed across the globe) has provided customisation formulae so that the risk-adjusted expected mortality can be related to the geographical location of the unit.16
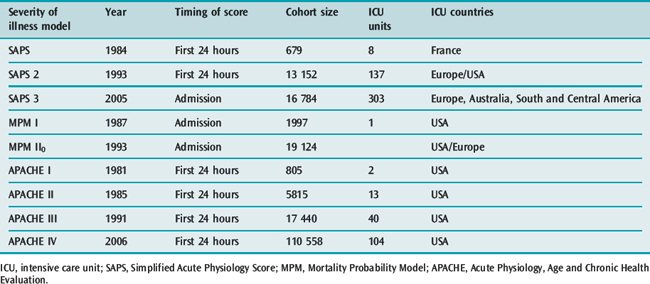
Inevitably, as advances occur, risk-adjusted mortality predictions become outdated with some old models overestimating expected mortality14,17 and others underestimating observed mortality.18 The designers of the scoring systems have recognised the changing baselines and review the models every few years, Table 3.1 outlines some characteristics of the upgraded systems.
Table 3.1 Revision dates for the most common internationally recognized risk adjusted models for mortality prediction
PHYSIOLOGICAL DISTURBANCE
PRIMARY PATHOLOGICAL PROCESS
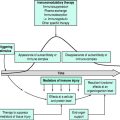
The primary pathology leading to intensive care admission has a significant influence on prognosis. Therefore, for a given degree of acute physiological disturbance, the most serious primary pathologies or underlying conditions are likely to have the worst predicted outcomes. For example, similar degrees of respiratory decompensation in an asthmatic and a patient with haematological malignancy are likely to lead to different outcomes. Furthermore the potential reversibility of a primary pathological process, whether spontaneous or through specific treatment, also greatly influences outcome, e.g. patients with diabetic ketoacidosis can be extremely unwell but insulin and volume therapy can rapidly reverse the physiological disturbance.
PHYSIOLOGICAL RESERVE, AGE AND COMORBIDITY
UNIT ORGANISATION AND PROCESSES
Soon after the introduction of APACHE II it was recognised that units with effective teams, nursing and medical leadership, good communications and run by dedicated intensive care specialists potentially had better outcomes than those without such characteristics.19–21
RISK-ADJUSTED EXPECTED OUTCOME AND ITS MEASUREMENT
Physiological disturbance, physiological reserve, pathological process and mode of presentation can be related to expected outcome by statistical methods. Common outcome measures for clinical trials are ICU mortality, or mortality at 28 days; however most models used for risk-adjusted mortality prediction are based on hospital mortality. Patient morbidity might also be considered nearly as important an endpoint as mortality, since many patients survive with serious functional impairment.22,23 For socioeconomic reasons there would be a strong argument to consider 1-year survival and time to return to normal function or work as endpoints.24,25 These latter measures however have been more closely related to chronic health status.
Hospital mortality is the most common outcome measure because it is frequent enough to act as a discriminator and is easy to define and document.
PRINCIPLES OF SCORING SYSTEM DESIGN
CHOICE OF INDEPENDENT PHYSIOLOGICAL VARIABLES AND THEIR TIMING
The designers of the original APACHE and SAPS systems chose variables which they felt would represent measures of acute illness. The chosen variables were based on expert opinion weighted equally on an arbitrary increasing linear scale, with the highest value given to the worst physiological value deviating from normal.26,27 Premorbid conditions, age, emergency status and diagnostic details were also included in these early models and from these parameters a score and risk of hospital death probability could be calculated. Later upgrades to these systems, SAPS 2, APACHE III and the MPM,28 used logistic regression analysis to determine the variables which should be included to explain the observed hospital mortality. Variables were no longer given equal importance but different weightings and a logistic regression equation were used to calculate a probability of hospital death. The more recent upgrades, APACHE IV and SAPS 3, have continued to use logistic regression techniques to identify variables that have an impact on hospital outcome.
The extent of physiological disturbance changes during critical illness. Scoring systems therefore needed to predetermine when the disturbance best reflected the severity of illness which additionally facilitated discrimination between likely survivors and non-survivors. Most systems are based on the worst physiological derangement for each parameter within the first 24 hours of ICU admission. However some systems, such as MPM II0, are based on values obtained 1 hour either side of admission; this is designed to avoid the bias that treatment might introduce on acute physiology values.29
DEVELOPING A SCORING METHODOLOGY AND ITS VALIDATION
All the scoring systems have been based on a large database of critically ill patients, usually derived from at least one country and from several ICUs (Table 3.2). Typically, in the more recent upgrades of the common scoring systems, part of the database is used to develop a logistic regression equation with a dichotomous outcome – survival or death, while the rest of the database is used to test out the performance of the derived equation. The equation includes those variables which are statistically related to outcome. Each of these variables is given a weight within the equation. The regression equation can be tested, either against patients in the developmental dataset using special statistical techniques such as ‘jack-knifing’ and ‘boot-strapping’ or against a new set of patients – the validation dataset – who were in the original database but not in the developmental dataset. The aim of validation is to demonstrate that the derived model from the database can be used not only to measure severity of illness but also to provide hospital outcome predictions.
Table 3.2 Ability of scores to discriminate correctly between survivors and non-survivors when tested on similar casemixes. A value of 1 represents perfect prediction
| Score | Area under ROC curve |
|---|---|
| APACHE II | 0.85 |
| APACHE III | 0.90 |
| SAPS 2 | 0.86 |
| MPM II0 | 0.82 |
| MPM II24 | 0.84 |
| SAPS 3 | 0.84 |
| APACHE IV | 0.88 |
ROC, receiver operating characteristic; APACHE, Acute Physiology, Age and Chronic Health Evaluation; SAPS, Simplified Acute Physiology Score; MPM, Mortality Probability Model.
DISCRIMINATION
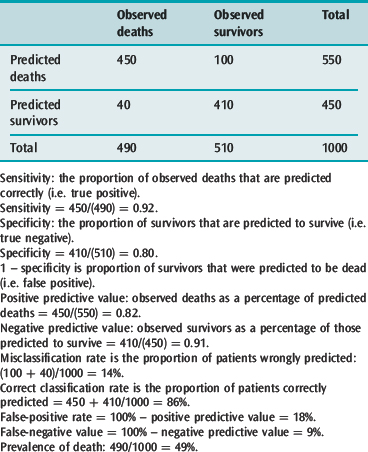
The discriminating power of a model can be determined by defining a series of threshold probabilities of death such as 50, 70, 80% above which a patient is expected to die if their calculated risk of death exceeds these threshold values and then comparing the expected number of deaths with what was observed in those patients at the various probability cut-off points. For example, the APACHE II system revealed a misclassification rate (patients predicted to die who survived and those predicted to survive who died) of 14.4, 15.2, 16.7 and 18.5% at 50, 70, 80 and 90% cut off points above which all patients with such predicted risks were expected to die. These figures indicate that the model predicted survivors and non-survivors best i.e., discriminated likely survivors from non-survivors when it was assumed that any patient with a risk of death greater than 50% would be a non-survivor.
A conventional approach to displaying discriminating ability is to plot sensitivity, true positive predictions on the y-axis against false-positive predictions (1 – specificity) on the x-axis for several predicted mortality cut-off points, and producing a receiver operator characteristic curve (ROC) (Figure 3.1).
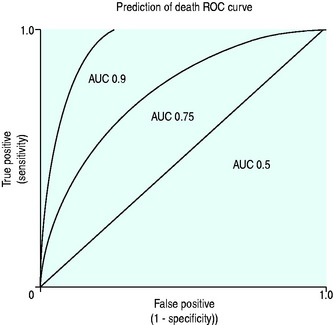
The ROC area under the curve (AUC) summarises the paired true-positive and false-positive rates at different cut-off points (Figure 3.1) and provides a curve which defines the overall discriminating ability of the model. A perfect model would show no false positives and would therefore follow the y-axis and has an area of 1, a model which is non-discriminating would have an AUC 0.5, whereas models which are considered good would have AUC greater than 0.8. The AUC can therefore be used for comparing discriminating ability of severity of illness predictor models.
CALIBRATION
A model with good calibration is one that for a given cohort predicts a similar percentage mortality as that observed. (Hosmer–Lemeshow goodness-of-fit C statistic compares the model with the patient group.)30
Observations with many models have revealed that, unless the casemix of the test patients is similar to that used to develop the model, the models may underperform due to poor calibration. This is particularly true when the testing is done for patients in different countries.12,16,31,32
COMMONLY USED SCORING SYSTEMS
GLASGOW COMA SCORE
The standard form of GCS is inapplicable to infants and children below the age of 5 years and has been modified to recognise that the expected normal verbal and motor responses must be related to the patient’s age.35
THERAPEUTIC INTERVENTION SCORING SYSTEM (TISS)
Introduced in 1974 with the aims of estimating severity of illness, the burden of work for ICU staff and nursing resource allocation,6 it requires the daily collection of 76 listed items, primarily interventions or treatments, although a cut-down version has been suggested – TISS 28.36,37
ACUTE PHYSIOLOGY AGE AND CHRONIC HEALTH EVALUATION (APACHE) SYSTEMS I–IV
In 1981 Knaus and colleagues described APACHE, a physiologically based classification system for measuring severity of illness in groups of critically ill patients. They suggested it could be used to control for casemix, compare outcomes, evaluate new therapies and study the utilisation of ICUs. APACHE II, a simplified version, was introduced in 198527 and, although superseded by APACHE III in 1991,38 APACHE II has remained the most widely studied and extensive used severity-of-illness scoring system. APACHE IV was introduced in 2006 and, like APACHE, remains a proprietary system. Consequently, worldwide it is predominantly APACHE II rather than the later versions which is continued to be used for reporting severity of illness.
It is the sum of three components:
MODIFICATIONS OF APACHE II
Bion et al.39 and Chang et al.40 separately were the first to explore the possibility of using APACHE II in a dynamic scoring system. The former used a modified APACHE II in the Sickness Score System, in which the day 1 score was compared with day 4 and risk of mortality was predicted. Chang et al., on the other hand, used the product of daily APACHE II scores with a modified Organ Failure Score and calculated thresholds above which individual patient mortality could be predicted.40
APACHE III
APACHE III, based on a larger reference database, was introduced in 1991 and was designed:
Characteristics of the new system
APACHE III represents an advance over APACHE II with improved discriminatory power (ROC 0.9 versus 0.85) and better calibration.38
Castella et al.41 reported that, whereas APACHE II proved better calibrated results than SAPS and MPM I in a mixed-patient cohort of 14 745 from European and American ICUs, it failed to be as discriminating or as well calibrated as APACHE III.
APACHE IV
It was the failure of customisation techniques with APACHE III to account for observations in subgroup analysis that indicated that a new model might be needed. Further the authors of APACHE IV revealed that when APACHE III in its modified form was applied to patients collected between 2002 and 2003, measures of calibration were poor.17
In 2006 there was consequently a further upgrade to the APACHE system based on a new database of 104 US ICUs in 45 hospitals. The selected hospitals had the APACHE III computerised data collection and analysis system already installed. The database, drawn from 131 618 admissions, analysed 110 558 patients, 60% of whom were randomly selected to make up the developmental dataset. The analysed patients excluded patients admitted for less than 4 hours, patients with burns, those < 16 years old and those who had received organ transplants other than kidney or liver. In addition patients in hospital for more than a year or who had no APS on the first day were excluded. Only first admissions were counted and those admitted from another ICU were excluded. The statistical and modelling techniques included cubic regression splines which allow a non-linear relationship between variable and outcome. This technique was applied to age, acute physiology and prior length of stay.
Variables included in APACHE IV
The AUC ROC (see Table 3.2) derived from the model used on a validation dataset was 0.88, indicating very good discrimination.
The APACHE IV mortality prediction model (Table 3.3) is in the public domain and can be found at www.criticaloutcomes.cerner.com.
Table 3.3 The relative contribution of predictor variables (%) for hospital mortality in APACHE IV
| Acute physiology | 65.5 |
| Diagnosis | 16.5 |
| Age | 9.4 |
| Chronic health | 5.0 |
| Admission source and previous length of stay | 2.9 |
| Mechanical ventilation | 0.6 |
APACHE, Acute Physiology, Age and Chronic Health Evaluation.
The APACHE IV system has not been tested outside the USA and therefore may not be appropriately calibrated. Indeed, this may also be the case within the USA, given the selected units used for the database.42
SIMPLIFIED ACUTE PHYSIOLOGY SCORE (SAPS 1–3)
The SAPS was originally based on data derived from French ICUs, based almost entirely on acute physiological variables.26 The 14 physiological variables chosen were based on expert opinion and the points ascribed to deviation of these variables from normal were arbitrary. Initially the score was not related to an equation for predicting probability of death, although later this was possible. Unlike APACHE II, this system did not include a diagnostic category or chronic health status as part of the estimate of severity of illness.
In 1993 SAPS 2 was introduced and this was based on European and North American patients43 The database contained 13 152 patients divided 65% and 35% between developmental and validation samples. Patients under 18 years, burns patients, coronary care and post cardiac surgery patients were excluded.
SAPS 3
SAPS 3 was introduced in 200515,16 and developed from a database of 16 784 patients from 303 ICUs from around the world, including South and Central America. The model used multilevel logistic regression equations based on 20 variables.
The variables were separated by the authors into those which were related to the period prior to admission, those concerning the admission itself and the acute physiological derangement (Table 3.4). These variables allow calculation of a SAPS 3 score which can be used to derive a risk of death from a logistic regression equation. Discrimination was good, with ROC AUC 0.848; however, the calibration varied depending on the geographical area tested. The best fits for the general SAPS 3 risk adjustment model were for northern European patients whereas the worst was for Central and South America, reflecting the number of patients used in the developmental dataset to derive the overall model. However the model can be customised with alternative equations to improve calibration for different regions of the world, and the authors suggest that customisation in future may allow within-country models.
| Patient characteristics before admission | Circumstances surrounding admission | Acute physiological changes within 1 hour before and after admission |
|---|---|---|
| Age | Planned or unplanned | GCS |
| Comorbidities | Reason for admission (diagnostic group) | Bilirubin |
| Length of stay before ICU admission | Medical or surgical | Temperature |
| Hospital location before admission | Anatomical site of surgery | Creatinine |
| Vasoactive agents before admission | Acute infection at time of surgery | Leukocytes |
| pH | ||
| Systolic blood pressure | ||
| Oxygenation and mechanical ventilation |
SAPS, Simplified Acute Physiology Score; GCS, Glasgow Coma Score; ICU, intensive care unit.
The authors found that 50% of the explanatory power of the model for predicting hospital mortality was from patient characteristics prior to admission while circumstances surrounding admission and acute physiology parameters accounted for 22.5 and 27.5% respectively. Thus far experience with this model remains limited.
MORTALITY PREDICTION MODELS (MPM I AND II)
Introduced in 1985 to provide an evidence-based approach to constructing a scoring system,44 the data were derived from a single US institution and included observations at the time of admission to ICU and within the first 24 hours. MPM I0 was based on the absence or presence of some physiological and diagnostic features at the time of admission while a further prediction model, MPM I24, was based on variables reflecting the effects of treatment at the end of the first ICU day. Unlike APACHE and SAPS systems, it does not calculate a score but computes the hospital risk of death from the presence or absence of factors in a logistic regression equation.
MPM II is based on the same dataset as SAPS 2.28 The system is a series of four models which provide an outcome prediction estimate for ICU patients at admission and at 24, 48 and 72 hours. In common with the early APACHE and SAPS systems the models excluded burns, coronary care and cardiac surgery patients. The models were derived by using logistic regression techniques to choose and weight the variables, with the additional criterion that variables had to be ‘clinically plausible’.
In a comparison between MPM II, SAPS 2 and APACHE III and the earlier versions of these systems, all the newer systems performed better than their respective older versions. However no system stood out as being superior to the others.41
POSSUM
In 1991 Copeland et al. introduced a scoring system in the UK as a tool for adjusting for the risk of mortality and morbidity.45 Physiological and Operative Severity Score for the enumeration of Mortality and Morbidity (POSSUM) includes 12 acute physiological parameters divided into four grades measured at the time of surgery and variables related to the severity of surgery (Table 3.5).
| Acute physiological variables at time of surgery | Variables related to operative severity |
|---|---|
| Age | Presence of malignancy |
| Cardiac signs and chest X-ray findings | Operative magnitude, e.g. minor, intermediate, major, major + |
| Respiratory signs and chest X-ray findings | Number of operations within 30 days |
| Systolic blood pressure | Blood loss per operation |
| Pulse rate | Peritoneal contamination |
| Glasgow Coma Score | Timing of operation, e.g. elective, emergency < 2 hours or < 24 hours |
| Urea | |
| Sodium | |
| Potassium | |
| Haemoglobin | |
| White cell count | |
| Electrocardiogram |
POSSUM, Physiological and Operative Severity Score for the enumeration of Mortality and Morbidity.
The POSSUM system was originally designed to predict risk of death by 30 days based on a logistic regression formula. However in 1996 Whiteley et al. noted that the POSSUM system overpredicted risk of death, particularly in those with very low risk (10%), by sixfold.46 Whiteley et al. proposed that the POSSUM system was modified using the same parameters but a different logistic regression equation predicting risk of hospital mortality. This modification was named the Portsmouth-POSSUM (P-POSSUM) based on where it was developed. The P-POSSUM equation is more commonly used.
ORGAN FAILURE SCORES
These are simple prognostic values relating the number of failed organs and their duration to probability of mortality. The organ system failures (OSF) were defined for five organs in an all-or-nothing manner and the number of failures summed.47 The outstanding observations were that:
Scores to take account of grades of dysfunction and supportive therapy have been proposed, including the multiple organ dysfunction score (MODS), which was based on specific descriptors in six organ systems (respiratory, renal, neurological, haematological, cardiovascular and hepatic). Progressive organ dysfunction was measured on a scale of 0–4; the intervals were statistically determined for each organ based on associated mortality. The summed score (maximum 24) on the first-day score was correlated with mortality in a graduated fashion.48
ICU mortality was approximately:
SEQUENTIAL ORGAN FAILURE ASSESSMENT (SOFA)
This score was originally associated with sepsis, It takes into account six organs (brain, cardiovascular, coagulation, renal, hepatic, respiratory) and scores organ function from zero (normal) to 4 (extremely abnormal). Experts defined the parameter intervals.49
Logistic Organ, Dysfunction System (LODS) is an organ failure score that could be used for hospital outcome prediction.50 Based on the patient cohort used to derive the SAPS 2 and MPM II systems, logistic regression was used on first-day data to propose an organ failure score. The LOD system identified 1–3 levels of organ dysfunction for six organ systems and between 1 and 5 LOD points were assigned to the levels of severity. The resulting LOD scores ranged from 0 to 22 points. Calibration and discrimination were good. LODS demonstrated that neurological, cardiovascular and renal dysfunction carried the most weight for predictive purposes followed by pulmonary and haematologic dysfunction, with hepatic dysfunction carrying the least weight. Unlike SOFA, the system takes into account the relative severity between organs and the degree of severity within an organ system by attributing different weights.
SCORES FOR INJURY AND TRAUMA
The Revised Trauma Score (RTS)54 is based on disturbances in three variables: (1) GCS; (2) systolic blood pressure; and (3) respiratory rate. Each is coded between 1 and 4. The physiological disturbance was further modified by use of a coefficient to indicate a relative weighting for that organ.
The ISS and RTS individually had flaws as indicators of outcome, but they were successfully combined by Boyd et al. to provide the Trauma Injury Severity Score (TRISS) methodology for outcome prediction. TRISS also included the presence of penetrating injury and age in its methodology.51,54,55
A Severity Characterisation of Trauma (ASCOT) was introduced to rectify perceived problems with TRISS.56 There are more details on injuries in the same body region, more age subdivisions and the use of emergency room acute physiology details rather than field values. ASCOT predicts survival better than TRISS, particularly for blunt injury. Reluctance to use ASCOT derives from increased complexity for only a modest gain in predictive value.
APPLICATION OF SCORING SYSTEMS
Such descriptions have led to numerous potential uses, including:
Decision-making for an individual patient based on the predictions of scoring systems is widely considered an inappropriate use because such systems are unable to discriminate patient outcome with certainty. The logistic regression equations only provide a probability for a dichotomous event, such as death or survival, and therefore they have no potential use as a guide to further treatment or limitation orders for an individual. When APACHE II was tested against an identical casemix to that from which it was derived and used as a predictor of outcome for individuals it at best had a misclassification rate of 15%.27 The performance of these systems may be worse with different casemixes.58–60
Attempts to correct for this have included recalibrating the APACHE II system61 and the use of neural networks. Neural networks use ongoing patient data input to modify predictor equations continually. This approach theoretically gets closer and closer to predicting outcome for a specific casemix but it never reaches certainty.
In the context of patient management scoring systems can be used as guidelines. A simple example is the use of a GCS cut-off value below or equal to 8 for elective intubation and ventilation of a patient before transfer from the scene of injury. This has contributed to a reduction in secondary brain injury.
More controversial is the recent protocol for administration of recombinant human activated protein C, which suggests that it is only administered to patients with APACHE II scores > 25.62
1 Breasted J. The Edwin Smith Papyrus. Chicago: University of Chicago, 1930.
2 Ranson JH, Rifkind KM, Turner JW. Prognostic signs and nonoperative peritoneal lavage in acute pancreatitis. Surg Gynecol Obstet. 1976;43:209-219.
3 Pugh RN, Murray-Lyon IM, Dawson JL, et al. Transection of the oesophagus for bleeding oesophageal varices. Br J Surg. 1973;60:646-649.
4 Parsonnet V, Dean D, Bernstein AD. A method of uniform stratification of risk for evaluating the results of surgery in acquired adult heart disease. Circulation. 1989;79:I3-12.
5 Jennett B, Teasdale G, Braakman R, et al. Predicting outcome in individual patients after severe head injury. Lancet. 1976;1:1031-1034.
6 Cullen DJ, Civetta JM, Briggs BA, et al. Therapeutic intervention scoring system: a method for quantitative comparison of patient care. Crit Care Med. 1974;2:57-60.
7 Knaus WA, Zimmerman JE, Wagner DP, et al. APACHE – acute physiology and chronic health evaluation: a physiologically based classification system. Crit Care Med. 1981;9:591-597.
8 Apolone G, Bertolini G, D’Amico R, et al. The performance of SAPS II in a cohort of patients admitted to 99 Italian ICUs: results from GiViTI. Gruppo Italiano per la Valutazione degli interventi in Terapia Intensiva. Intens Care Med. 1996;22:1368-1378.
9 Moreno R, Morais P. Outcome prediction in intensive care: results of a prospective, multicentre, Portuguese study. Intens Care Med. 1997;23:177-186.
10 Moreno R, Miranda DR, Fidler V, et al. Evaluation of two outcome prediction models on an independent database. Crit Care Med. 1998;26:50-61.
11 Rowan KM, Kerr JH, Major E, et al. Intensive Care Society’s APACHE II study in Britain and Ireland – II: Outcome comparisons of intensive care units after adjustment for case mix by the American APACHE II method. Br Med J. 1993;307:977-981.
12 Bastos PG, Sun X, Wagner DP, et al. Application of the APACHE III prognostic system in Brazilian intensive care units: a prospective multicenter study. Intens Care Med. 1996;22:564-570.
13 Zimmerman JE, Wagner DP, Draper EA, et al. Evaluation of acute physiology and chronic health evaluation III predictions of hospital mortality in an independent database. Crit Care Med. 1998;26:1317-1326.
14 Popovich MJ. If most intensive care units are graduating with honors, is it genuine quality or grade inflation? Crit Care Med. 2002;30:2145-2146.
15 Metnitz PG, Moreno RP, Almeida E, et al. SAPS 3 – from evaluation of the patient to evaluation of the intensive care unit. Part 1: Objectives, methods and cohort description. Intens Care Med. 2005;31:1336-1344.
16 Moreno RP, Metnitz PG, Almeida E, et al. SAPS 3 – from evaluation of the patient to evaluation of the intensive care unit. Part 2: Development of a prognostic model for hospital mortality at ICU admission. Intens Care Med. 2005;31:1345-1355.
17 Zimmerman JE, Kramer AA, McNair DS, et al. Acute Physiology and Chronic Health Evaluation (APACHE) IV: hospital mortality assessment for today’s critically ill patients. Crit Care Med. 2006;34:1297-1310.
18 Le Gall JR, Neumann A, Hemery F, et al. Mortality prediction using SAPS II: an update for French intensive care units. Crit Care. 2005;9:R645-652.
19 Zimmerman JE, Rousseau DM, Duffy J, et al. Intensive care at two teaching hospitals: an organizational case study. Am J Crit Care. 1994;3:129-138.
20 Zimmerman JE, Shortell SM, Rousseau DM, et al. Improving intensive care: observations based on organizational case studies in nine intensive care units: a prospective, multicenter study. Crit Care Med. 1993;1:443-451.
21 Knaus WA, Draper EA, Wagner DP, et al. An evaluation of outcome from intensive care in major medical centers. Ann Intern Med. 1986;104:410-418.
22 Connors AF, Dawson NV, Thomas C, et al. Outcomes following acute exacerbation of severe chronic obstructive lung disease. The SUPPORT investigators (Study to Understand Prognoses and Preferences for Outcomes and Risks of Treatments). Am J Respir Crit Care Med. 1996;154:959-967.
23 Hamel MB, Goldman L, Teno J, et al. Identification of comatose patients at high risk for death or severe disability. SUPPORT Investigators. Understand Prognoses and Preferences for Outcomes and Risks of Treatments. JAMA. 1995;273:1842-1848.
24 Ridley S, Plenderleith L. Survival after intensive care. Comparison with a matched normal population as an indicator of effectiveness. Anaesthesia. 1994;49:933-935.
25 Sage W, Rosenthal M, Silverman J. Is intensive care worth it? An assessment of input and outcome for the critically ill. Crit Care Med. 1986;14:777-782.
26 Le Gall JR, Loirat P, Alperovitch A, et al. A simplified acute physiology score for ICU patients. Crit Care Med. 1984;12:975-977.
27 Knaus WA, Draper EA, Wagner DP, et al. APACHE II: a severity of disease classification system. Crit Care Med. 1985;13:818-829.
28 Lemeshow S, Teres D, Klar J, et al. Mortality Probability Models (MPM II) based on an international cohort of intensive care unit patients. JAMA. 1993;270:24-86.
29 Boyd O, Grounds M. Can standardized mortality ratio be used to compare quality of intensive care unit performance? Crit Care Med. 1994;22:1706-1709.
30 Lemeshow S, Hosmer DWJr. A review of goodness of fit statistics for use in the development of logistic regression models. Am J Epidemiol. 1982;115:92-106.
31 Vazquez Mata G, Rowan K, Zimmerman JE, et al. International comparisons of intensive care: meeting the challenges of different worlds of intensive care. Intens Care Med. 1996;22:156-157.
32 Harrison DA, Brady AR, Parry GJ, et al. Recalibration of risk prediction models in a large multicenter cohort of admissions to adult, general critical care units in the United Kingdom. Crit Care Med. 2006;34:1378-1388.
33 Teasdale G, Jennett B. Assessment of coma and impaired consciousness. A practical scale. Lancet. 1974;2:81-84.
34 Teasdale G, Knill Jones R, van der Sande J. Observer variability in assessing impaired consciousness and coma. J Neurol Neurosurg Psychiatry. 1978;41:603-610.
35 Reilly PL, Simpson DA, Sprod R, et al. Assessing the conscious level in infants and young children: a paediatric version of the Glasgow Coma Scale. Childs Nerv Syst. 1988;4:30-33.
36 Keene A, Cullen D. Therapeutic Intervention Scoring System: update 1983. Crit Care Med. 1983;11:1-3.
37 Miranda DR, de Rijk A, Schaufeli W. Simplified Therapeutic Intervention Scoring System: the TISS-28 items – results from a multicenter study. Crit Care Med. 1996;24:64-73.
38 Knaus WA, Wagner DP, Draper EA, et al. The APACHE III prognostic system. Risk prediction of hospital mortality for critically ill hospitalized adults. Chest. 1991;100:1619-1636.
39 Bion JF, Aitchison TC, Edlin SA, et al. Sickness scoring and response to treatment as predictors of outcome from critical illness. Intens Care Med. 1988;14:167-172.
40 Chang RW, Jacobs S, Lee B. Predicting outcome among intensive care unit patients using computerised trend analysis of daily Apache II scores corrected for organ system failure. Intens Care Med. 1988;14:558-566.
41 Castella X, Artigas A, Bion J, et al. A comparison of severity of illness scoring systems for intensive care unit patients: results of a multicenter, multinational study. The European/North American Severity Study Group. Crit Care Med. 1995;23:1327-1335.
42 Afessa B. Benchmark for intensive care unit length of stay: one step forward, several more to go. Crit Care Med. 2006;34:2674-2676.
43 Le Gall JR, Lemeshow S, Saulnier F. A new Simplified Acute Physiology Score (SAPS II) based on a European/North American multicenter study. JAMA. 1993;270:2957-2963.
44 Lemeshow S, Teres D, Pastides H, et al. A method for predicting survival and mortality of ICU patients using objectively derived weights. Crit Care Med. 1985;13:519-525.
45 Copeland GP, Jones D, Walters M. POSSUM: a scoring system for surgical audit. Br J Surg. 1991;78:355-360.
46 Whiteley MS, Prytherch DR, Higgins B, et al. An evaluation of the POSSUM surgical scoring system. Br J Surg. 1996;83:812-815.
47 Knaus WA, Draper EA, Wagner DP, et al. Prognosis in acute organ-system failure. Ann Surg. 1985;202:685-693.
48 Marshall JC, Cook DJ, Christou NV, et al. Multiple organ dysfunction score: a reliable descriptor of a complex clinical outcome. Crit Care Med. 1995;23:1638-1652.
49 Vincent JL, Moreno R, Takala J, et al. The SOFA (Sepsis-related Organ Failure Assessment) score to describe organ dysfunction/failure. On behalf of the Working Group on Sepsis-Related Problems of the European Society of Intensive Care Medicine. Intens Care Med. 1996;22:707-710.
50 Le Gall JR, Klar J, Lemeshow S, et al. The Logistic Organ Dysfunction system. A new way to assess organ dysfunction in the intensive care unit. ICU scoring group. JAMA. 1996;276:802-810.
51 Baker S, O’Neill B, Haddon WJr, et al. The injury severity score: a method for describing patients with multiple injuries and evaluating emergency care. J Trauma. 1974;14:187-196.
52 American Association for Advancement of Automotive Medicine. The Abbreviated Injury Scale, 1990 revision. Arlington Heights, IL: American Association for Advancement of Automotive Medicine; 1990.
53 Champion HR, Sacco WJ, Carnazzo AJ, et al. Trauma score. Crit Care Med. 1981;9:672-676.
54 Champion HR, Sacco WJ, Copes WS, et al. A revision of the Trauma Score. J Trauma. 1989;29:623-629.
55 Boyd CR, Tolson MA, Copes WS. Evaluating trauma care: the TRISS method. Trauma Score and the Injury Severity Score. J Trauma. 1987;27:370-378.
56 Champion HR, Copes WS, Sacco WJ, et al. A new characterization of injury severity. J Trauma. 1990;30:539-545.
57 Zimmerman JE, Kramer AA, McNair DS, et al. Intensive care unit length of stay: benchmarking based on Acute Physiology and Chronic Health Evaluation (APACHE) IV. Crit Care Med. 2006;34:2517-2529.
58 Metnitz PG, Lang T, Vesely H, et al. Ratios of observed to expected mortality are affected by differences in case mix and quality of care. Intens Care Med. 2000;26:1466-1472.
59 Murphy Filkins R, Teres D, Lemeshow S, et al. Effect of changing patient mix on the performance of an intensive care unit severity-of-illness model: how to distinguish a general from a specialty intensive care unit. Crit Care Med. 1996;24:1968-1973.
60 Ridley S. Severity of illness scoring systems and performance appraisal. Anaesthesia. 1998;53:1185-1194.
61 Rowan KM, Kerr JH, Major E, et al. Intensive Care Society’s Acute Physiology and Chronic Health Evaluation (APACHE II) study in Britain and Ireland: a prospective, multicenter, cohort study comparing two methods for predicting outcome for adult intensive care patients. Crit Care Med. 1994;22:1392-1401.
62 Bernard GR, Vincent JL, Laterre PF, et al. Efficacy and safety of recombinant human activated protein C for severe sepsis. N Engl J Med. 2001;344:699-709.