Chapter 34 Respiratory monitoring
Clinical examination and the trend of vital signs such as respiratory rate (f), and quantity and nature of sputum are extremely important in managing patients with respiratory disease. In particular, clinical examination should look for evidence of excessive inspiratory and/or expiratory pleural pressure changes and effort such as accessory muscle use, tracheal tug, supraclavicular and intercostal indrawing, paradoxical abdominal movement (which is suggestive of diaphragmatic fatigue1) and pulsus paradoxus. During spontaneous ventilation an excessive fall in blood pressure during inspiration (> 10 mmHg) is found in a number of conditions such as cardiac tamponade, cardiogenic shock, pulmonary embolism, hypovolaemic shock and acute respiratory failure. A curvilinear relationship exists between the fall in blood pressure and the change in pleural pressure during inspiration; however, there is marked variation between individuals.2 Consequently, pulsus paradoxus is most useful in following trends; a reduction in the degree of paradox may be due to improvement and a fall in the negative pleural pressure needed for ventilation, or due to respiratory muscle insufficiency, and an inability to generate the same negative pleural pressure.
Additional information can be gained from blood gases and pulse oximetry (Chapter 14), and capnography, ventilatory pressures and waveform analysis in patients receiving respiratory assistance. This chapter will focus on tests of respiratory function that are directly relevant to critically ill patients.
Monitoring gas exchange
Oxygenation
This is reviewed in Chapter 14, and is only briefly discussed here. Hypoxaemia may be due to a low partial pressure of inspired O2 (rare), hypoventilation, diffusion impairment (rare), ventilation–perfusion  mismatch and shunt. Inert gas analysis has been used to quantitate
  mismatch, and has demonstrated that hypoxaemia in acute respiratory distress syndrome (ARDS) is predominantly due to alveoli that are perfused but not ventilated (shunt),3 consistent with computed tomography (CT) scan evidence of increased dependent lung density. However, inert gas analysis remains a research tool, and less direct methods, such as the alveolar gas equation, are used to assess hypoxaemia:

where PAO2 is the alveolar PO2, and this is usually simplified to:

 mismatch or right-to-left shunt. A commonly used alternative measure of hypoxaemia is the Pa
 is the intrapulmonary shunt blood flow,
  is the total pulmonary blood flow, Cc′
Carbon dioxide
PaCO2 is determined by alveolar ventilation  , and CO2 production
  :
:
where  is the minute ventilation
  minus the wasted or dead-space ventilation
  . The modified Bohr equation (assuming PACO2 = PaCO2) calculates the proportion of the VT which is wasted ventilation (i.e. physiological dead space: VDphys):

where  is the mixed expired
  , and VDphys is composed of anatmical dead space (VDanat) and alveolar dead space (VDalv) – notionally due to alveoli that are ventilated but not perfused. Normally VDalv is minimal and VDanat comprises 30% of VT. Since the volume of an endotracheal tube is less than the mouth or nose, and pharynx, intubation may reduce VDanat; however, when the connection from the endotracheal tube is taken into account there is little change in dead space. Positive-pressure ventilation increases dead space by distension of the airways increasing VDanat, and through a tendency to increase alveoli that are ventilated but not perfused. In patients with ARDS, marked increases in VDalv lead to marked increases in the VDphys/VT ratio (exceeding 0.6), which is an independent prognostic factor.4
Capnography
Capnography measures and displays exhaled CO2 throughout the respiratory cycle, with sampling usually by a mainstream sensor since sidestream systems tend to become blocked by secretions. However, when capnography is used in non-intubated patients, sidestream sampling is commonly used (e.g. modified nasal cannulae). Infrared spectroscopy measures the fraction of energy absorbed and converts this to a percentage of CO2 exhaled. During expiration the capnogram initially reads no CO2, but as anatomical dead space is exhaled there is a rise in the exhaled CO2 to a plateau which falls to 0% CO2 with the onset of inspiration. In patients with significant respiratory disease a plateau may never be achieved. The end-tidal CO2 (PetCO2) is the value at the end of the plateau, and is normally only slightly less than the PaCO2. However, this gradient will increase when alveolar dead space (VDalv) increases, such as low cardiac output, pulmonary embolism and elevated alveolar pressure. Consequently the PetCO2 may not reflect PaCO2 in critically ill patients. Nevertheless, in a stable patient the gradient will be fairly constant, and can be used to guide  during transport,5 and when other factors including the adequacy of minute ventilation are unchanged, sudden changes in the PetO2 may provide an early signal. Indeed, PetCO2 directly correlates with cardiac output, and PetCO2 monitoring has been used to assess adequacy of cardiopulmonary resuscitation, and its prognosis.6
The presence of exhaled CO2 is secondary confirmation of endotracheal tube placement, and is commonly recommended even when the tube is seen to pass through the vocal cords,7 since clinical assessment is not always reliable. Simple colorimetric devices may be used for this purpose. However, detection of expired CO2 is not infallible7 as false positives can rarely occur following ingestion of carbonated liquids, and false negatives may be due to extremely low pulmonary blood flow, or very large alveolar dead space such as pulmonary embolus or severe asthma. Monitoring with capnography has also been recommended for transport8 and respiratory monitoring9 in critically ill patients, and should be available for every anaesthetised patient.10

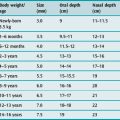
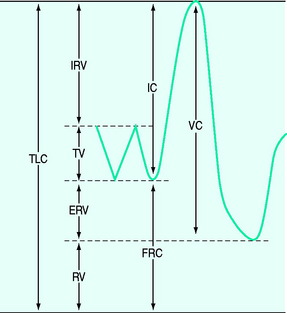
Lung volume and capacities (Figure 34.1)
The tidal volume (VT) is the volume of gas inspired and expired with each breath, with the volume at end-expiration termed the functional residual capacity (FRC). If a forced expiration is performed the expiratory reserve volume (ERV) is expired down to the residual volume (RV). If a maximum inspiratory effort is made from FRC, this is termed a vital capacity (VC) manoeuvre when the total lung capacity (TLC) is reached. Clinically, the most important of these are the FRC, VT and VC, and the latter two are easily measured using a spirometer or integrated from flow.
Tidal volume
Minute volume is composed of f and VT – normally ∼17 breaths/min and ∼400 ml respectively in adults.11 Rapid shallow breathing is common in patients with respiratory distress, and in those failing weaning. Although a proposed index, an f/VT ratio > 100 was initially shown to be highly predictive of weaning failure;12 subsequent studies have reported varying results.
Vital capacity
At TLC the forces due to the inspiratory muscles are counterbalanced by elastic recoil of the lung and chest wall. Consequently, the TLC is determined by the strength of the inspiratory muscles, the mechanics of the lung and chest wall and the size of the lung, which varies with body size and gender (Table 34.1). Since the VC is the difference between TLC and FRC, factors that reduce FRC, such as increased abdominal chest wall elastance and premature airway closure in chronic obstructive pulmonary disease (COPD), will also reduce it. The normal VC is ∼70 ml/kg and reduction to 12–15 ml/kg has previously indicated a probable need for mechanical ventilation. However, many other factors need to be considered, including the patient’s general condition, the strength of the patient’s expiratory muscles, glottic function and the use of non-invasive ventilation. Indeed, many chronically weak patients are able to manage at home with extremely low VC with the assistance of non-invasive ventilation.
| Decreased muscle strength |
Functional residual capacity
Direct measurement of FRC is rarely measured in ICU; however, techniques such as nitrogen wash-in and wash-out13 to estimate FRC are becoming available on modern ventilators. When FRC is less than the closing volume, the lung volume at which airway closure collapse is present during expiration, there is a marked increase in  mismatch. Consequently, positive end-expiratory pressure (PEEP) is commonly used to elevate FRC. Increases in lung volume above resting lung volume can be directly measured from a prolonged expiration to atmospheric pressure using either a spirometer or integration of flow,14 or by repeated FRC measurements. FRC is decreased in ARDS and pulmonary oedema, in patients with abdominal distension and following abdominal and thoracic surgery. An increase in FRC places the diaphragm at a mechanical disadvantage, and is seen with severe airflow limitation and dynamic overinflation, and when there is loss of elastic recoil (e.g. emphysema).
Measurement of lung mechanics
Elastic properties of lung and chest wall
The respiratory system (RS) is composed of the lung (L) and chest wall (CW), which is comprised of the ribcage and abdomen. Although it is often convenient to consider respiratory system mechanics as implying information about the lung, abnormal chest wall compliance can markedly influence these measurements.15–18

Although the Pes is not always an accurate measure of the absolute Ppl, the change in Pes reflects the change in Ppl. However, this requires an appropriately positioned and functioning oesophageal balloon. In spontaneously breathing subjects a thin latex balloon sealed over a catheter is introduced into the lower third of the esophagus and Pes and Pao are measured simultaneously during an end-expiratory airway occlusion. A well-positioned oesophageal balloon will have a ratio of ΔPes/ΔPao of ∼1.19 This technique is reliable in supine, intubated spontaneously breathing patients,20 and in paralysed subjects it appears that a similar pressure change, induced by manual ribcage pressure,21 can be used to verify oesophageal balloon function.
Measurement of elastance
Elastance and resistance are frequency-dependent, and respiratory mechanics depend upon the volume and volume history of the lung.22 With increasing frequency of breathing, total respiratory system resistance falls and elastance increases, and this is particularly obvious in patients with airflow obstruction.23,24 Consequently these factors must be taken into account when interpreting respiratory mechanics. In a passively ventilated subject Pao is the sum of: (1) the pressure required to overcome airway, endotracheal tube and circuit resistance (Pres); (2) the elastic pressure required to expand the lung and chest wall (Pel); (3) the elastic recoil pressure at end-expiration or total PEEP (Po); and (4) the inertial pressure required to generate gas flow (Pinert):

Since the elastance (E) is equal to ΔP/ΔV, with the resistance (R) equal to ΔP/Δ , and ignoring the inertance,25 this can be rewritten as the single-compartment equation of motion:

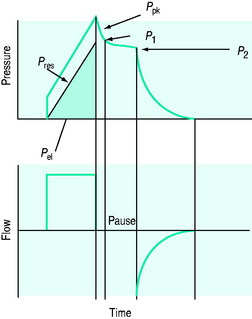
END-INSPIRATORY OCCLUSION METHOD
The simplest estimate of ERS can be made using a rapid end-inspiratory airway occlusion during a constant-flow breath, provided that the respiratory muscles are relaxed (Figure 34.2). If a plateau is introduced at end-inspiration there is a sudden initial pressure drop due to dissipation of flow resistance (Ppk – P1) followed by a slower, secondary pressure drop to a plateau (Pdif = P1 – P2) due to stress relaxation. At least 1–2 seconds are taken for this plateau to be achieved, and P2 is often called the plateau pressure; however, if Pplat is measured too soon it will lie somewhere between P1 and P2.
Stress adaptation
Stress relaxation of the respiratory system is due to both tissue viscoelasticity and time-constant inequalities of the respiratory system (pendelluft). In the normal lung pendelluft has a minimal contribution to stress relaxation;26 however, heterogeneity of regional resistance and elastance can markedly influence stress relaxation.27 Pulmonary surfactant and its contribution to changes in surface tension, parenchymal factors including elastic fibres in the lung, contractile elements such as the alveolar duct muscle and changes in pulmonary blood volume have all been implicated in the viscoelastic properties of the lung. However, it is not possible to separate either of these factors or the role of pendelluft in stress adaptation.
Calculation of respiratory mechanics
Returning to Figure 34.2, it is now simple to estimate respiratory system resistance and elastance from Pao. The static elastance (Ers,st) and the dynamic elastance (Ers,dyn) are calculated as:

where Po is the total PEEP (extrinsic plus intrinsic PEEP). The difference between Pel,dyn and Pel,st is the effective recoil pressure of the respiratory system during mechanical ventilation. Consequently, additional work is performed during inspiration to overcome stress adaptation, and this is stored and dissipated during expiration. This contributes to the hysteresis seen in dynamic volume–pressure curves during mechanical ventilation, and to the generation of expiratory flow. This latter component may be important in patients with airflow obstruction since the imposition of a pause at end-inspiration results in a 32% dissipation of the total energy loss within the respiratory system.28
The static volume–pressure curve
The V–P curve provides an advantage over an end-inspiratory elastance since, with the latter, it is not possible to know which part of the V–P curve is being measured. Consequently this ‘chord’ elastance may span either inflection point, yielding a falsely high figure. The upper inflection point represents a sudden decrease in elastance with increasing volume, and this has been interpreted as lung overinflation. The lower inflection point represents a sudden decrease in elastance with increased volume, and this has been interpreted as recruitment of atelectatic air spaces. Ventilation between these two inflection points should minimise both shearing forces secondary to repetitive collapse and reopening of alveoli, and overstretch of alveoli. However, this interpretation of the V–P curve has been questioned. In patients with acute lung injury recruitment occurs well above the lower inflection point, along the entire V–P curve and above the upper inflection point.29,30 An alternative interpretation of these inflection points is that the lower inflection point represents a zone of rapid recruitment, and that the upper inflection point is due to a reduced rate of recruitment.31
Conventionally the static V–P curve has been measured in ventilated patients with the ‘supersyringe’ method.32 In a paralysed patient the respiratory system is progressively inflated from FRC in 100-ml steps up to ∼1700 ml or a predefined pressure limit. After each step sufficient time is allowed for a well-defined plateau to become apparent (using a pause of 3–6 seconds). The effects of temperature, humidity, gas compression and ongoing gas exchange during the manoeuvre need to be taken into account,33,34 and the volume history standardised before it is performed. Since this technique is cumbersome and many patients become hypoxaemic following disconnection from the ventilator and the 60 seconds or so without PEEP, other techniques have been developed. The static V–P curve can also be measured by randomly inserting a range of single-volume inflations, followed by a prolonged pause,35 during normal mechanical ventilation. This is performed in the paralysed state at 0 cmH2O PEEP. This technique has a number of advantages, including its simplicity, the patient is not disconnected from the ventilator, the volume history is the same for each measurement and gas exchange during the measurement is negligible. However, again, many patients will become hypoxaemic due to prolonged periods without PEEP (this procedure may take ∼15 minutes), particularly following a small-volume breath. Finally, an automated low-flow V–P curve method allowing subtraction of Pres has been described, and is now available on some modern ventilators; this takes around 20 seconds to perform, and seems to correlate well with the static occlusion technique.36,37
THE DYNAMIC V–P CURVE
 and V are displayed by many ventilators, but the volume signal is not referenced to FRC and the signals are not readily available for quantitative analysis. However,
  is readily measured with a heated pneumotachograph, and volume can then be derived by simple integration if the signal is collected after analogue-to-digital conversion. If Pao is also collected it is relatively simple to measure dynamic mechanics.
The dynamic V–P curve always shows hysteresis, mainly due to the effects of airway and tissue resistance; it is unlikely that hysteresis of the static V–P occurs during tidal breathing.38 In contrast to static V–P relations, dynamic mechanics are collected during normal ventilation so they do not interfere with patient care, and they provide a ‘functional’ description of respiratory mechanics. Indeed the ‘effective’ alveolar distending pressure is more accurately Pel,dyn, not Pel,st. Since dynamic mechanics are potentially continuous they could also be used to servo-control ventilatory strategies.
There a number of ways to analyse dynamic V–P data. A line can be drawn between no-flow points at end-inspiration and end-expiration to determine elastance; however, this is relatively inaccurate as it is based on two points that can be hard to identify exactly. Multiple linear regression analysis is now the technique most commonly employed. The patient does not need to be paralysed39 provided the respiratory muscles are not active during ventilation, and the signal can be split to allow analysis of inspiratory and expiratory mechanics.

Static PEEPi is accurately calculated, as Po – PEEPe, when compared to either an end-expiratory airway occlusion method,40 or by direct measurement of end-expiratory alveolar pressure.41 However, the single-compartment model only approximates the respiratory system, and frequency and volume dependence of the derived mechanics are observed. Provided these factors are recognised and accounted for, it is sound to compare data within and between patients.
A number of techniques have been used to analyse further dynamic V–P data. The most promising of these are the stress index derived from power analysis of the Pao–t curve (Pao = at + c),42 and addition of a volume-dependent term to the equation of motion:13,43


 pattern to discount resistive effects, it is not as versatile as the volume-dependent technique; however, both measures correlate highly with each other, suggesting they measure the same parameter. The volume-dependent technique allows conceptual placement of tidal breathing on a dynamic V–P curve. If the %E2 is calculated as:
then a %E2 > 30% quantitates high stress, often interpreted as overinflation, and a negative volume dependence (negative %E2) suggests significant atelectasis during tidal breathing. During constant  ventilation, and provided VT is also constant, the change in either Ppk – PEEPtot or P1 – PEEPtot (the delta pressure: ΔP) 20–30 minutes following a change in PEEP is highly correlated with %E2.13 Using the 95% predictive interval for these data, an increase in ΔP > 2 cmH2O indicates overinflation, a %E2 > 30%.
MEASUREMENT OF THE RESISTANCE OF THE LUNG AND CHEST WALL
Lung resistance (RL) is the sum of airway (Raw) and tissue resistance (Rti). Resistance is flow-, volume- and frequency-dependent, and RL decreases as f increases. It is also important to compare measurements at similar lung volumes since there is a hyperbolic relation between lung volume and R. This is particularly obvious in ARDS, where the incremental administration of PEEP can result in a decrease in Raw due to concurrent recruitment and an increase in lung volume. Indeed, although the absolute values are increased, when corrected for end-expiratory lung volume RL, Raw + Rti are unchanged in ARDS.14 Finally, since gas flow may be a mixture of laminar and turbulent flow, resistance is often flow-dependent.
END-INSPIRATORY OCCLUSION TECHNIQUE
The total inspiratory airways resistance, including the endotracheal tube and associated ventilatory apparatus, can be calculated in a relaxed patient following an inspiratory pause (Figure 34.2) as:

and RL calculated by using P2 instead of P1. Since the endotracheal tube and apparatus will make a significant contribution to Raw it is best to measure Pao distal to the endotracheal tube with an intratracheal catheter. An alternative approach is to calculate and subtract endotracheal tube resistance using the Rohrer equation (R = K1 + K2),44 and this is now automatically included in some ventilators. However, as in vivo endotracheal tube resistance is often greater than in vitro resistance45 due to the effect of secretions and interaction with the tracheal wall, these corrections may be inaccurate. Despite these provisos, this simple measure of resistance, or the Ppk to Pplat difference at a constant  , can be clinically useful in both the diagnosis and monitoring of airflow obstruction.46
DYNAMIC TECHNIQUES
Total, inspiratory and expiratory R can also be made, using either multiple linear regression analysis or from linear interpolation of the V–P curve at a constant volume. However, this latter technique assumes a constant elastance during tidal inflation, and may be inaccurate because it relies on only two measurements. Finally, an average expiratory R can be calculated from the time constant (τ) derived from passive expiration if the E is known, since:

OTHER MEASUREMENT TECHNIQUES
The interrupter technique consists of a series of short (100–200 ms) interruptions to relaxed expiration by a pneumatic valve.47 This results in an expiratory plateau in Pao following equilibration with alveolar pressure. From the V, P and  data expiratory elastance and the expiratory P–
 relationship are measured. This technique does not make assumptions about the behaviour of the respiratory system and can identify dynamic airflow limitation.
Assuming that the respiratory system behaves linearly, it can be analysed following a forced-flow oscillation at the airway opening.48 The resultant pressure waveform depends upon the impedance of the respiratory system, which can be analysed following Fourier analysis of the P and  waveforms into resistance and reactance. This will then allow measurement of Raw, Rti, Ers and inertance, and information can be gained regarding small-airways disease by examining Raw at different oscillatory frequencies.
MEASUREMENT OF INTRINSIC PEEP
This is an important measurement in critically ill patients. PEEPi: (1) may have unrecognised haemodynamic consequences;49 (2) adds an elastic load to inspiratory work during partial ventilatory modes, which may be reduced by application of small amounts of PEEPe;50 and (3) reflects dynamic hyperinflation with the consequent risks of barotrauma51and right heart failure. If PEEPi is not taken into account during calculation of chord compliance, an incorrect denominator is used, which may markedly alter the result.52
The two most commonly described techniques for measuring PEEPi are end-expiratory airway occlusion in a relaxed subject, and the fall in oesophageal pressure during inspiration prior to initiation of inspiratory  . However, these are not really comparable measures since static and dynamic PEEPi respectively are measured. Static PEEPi is measured as the plateau Pao that is reached after ∼5 seconds following an end-expiratory occlusion. With the cessation of gas flow alveolar pressure equilibrates with Pao. Since the lung is composed of non-homogeneous units, this will represent the average static PEEPi. All respiratory effort must be absent since they may independently influence end-expiratory Pao, and end-expiration must be accurately identified. This is most easily done by the ventilator itself either using an end-expiratory hold manoeuvre or by using the next inspiration, the onset of which is concurrent with expiratory valve closure, to close a valve that directs inspiratory flow to atmosphere and seals the circuit. Static PEEPi is a surrogate measure of dynamic hyperinflation, and this volume may be directly measured using a spirometer49 or a pneumotachograph13 during a prolonged expiration.
Dynamic PEEPi is measured as the pressure change required to initiate inflation. In ventilated subjects this will be the change in Pao prior to initiation of inspiratory  ,50 and in spontaneously breathing subjects the change in oesophageal48 or transdiaphragmatic53 pressure from their end-expiratory relaxation values prior to inspiratory
  . Measurement of dynamic PEEPi in spontaneously breathing subjects is not particularly straightforward. The changes in pressure are small and influenced by cardiogenic oscillations which are preferably filtered out.54 Further dynamic PEEPi is not constant, with breath-to-breath variation probably due to variation in the extent of dynamic hyperinflation, and many patients with airflow obstruction have an active expiration. This ‘falsely’ increases PEEPi, at least with respect to its elastic load, since cessation of active expiration does not require work, with part of the measured elastic load suddenly dissipated.55 Consequently, it is preferable to measure intragastric pressure concurrently as a measure of active expiration.
Finally, PEEPi can be measured as Po from dynamic P, V and  data in ventilated subjects. This is thought to be a measure of dynamic PEEPi since static PEEPi systematically yields a slightly greater result,40 with similar discrepancies reported between other dynamic measures of PEEPi and static PEEPi.56,57 This systematic difference correlates with, and is thought to be due to, the viscoelastic properties and regional time-constant inequalities of the respiratory system.56 This has clinical significance since, although matching dynamic PEEPi with PEEPe reduces respiratory work through a decrease in elastic load,50 it does not counterbalance these forces, which represent an additional elastic load to inspiration.
PATIENT–VENTILATOR DYSSYNCHRONY
Dyssynchrony between the patient and ventilator is common during both intubated and non-invasive ventilatory support. Clinical findings include agitation and anxiety, tachycardia, tachypnoea and increased work of breathing. Failure to trigger the ventilator can be documented by comparing the frequency of ventilator breaths and inspiratory efforts. Bedside analysis of ventilator respiratory waveforms can be used to identify and help match ventilatory assistance to neural drive.58
 waveforms as abrupt decrease in
  at either the onset of inspiratory muscle activity or relaxation of the expiratory muscles. Monitoring of Pao is less sensitive unless the circuit expiratory resistance is increased (e.g. heat and moisture exchanger or poorly functioning expiratory valve) so that small changes in expiratory
  are reflected in Pao. Inadequate sensitivity may also lead to ineffective triggering with similar but more obvious waveform effects.
 distortion, as commonly seen with large cardiogenic oscillations, hiccups, condensate in tubing or a circuit leak. Again, waveform analysis may help detect and manage the problem; for example, it may be necessary to reduce trigger sensitivity to prevent cardiogenic oscillations from being detected as inspiratory effort.
 starvation. Expiratory muscle effort, as may be seen with an excessive VT or prolonged inspiratory time (Ti), leads to a rise in Pao. During an assisted-pressure control breath or during pressure support, changes in patient effort are detected from the
  waveform. Finally, excessively rapid development of the set delivered pressure, a rapid rise time, may be detected by an overshoot in Pao; an excessively long rise time will be seen as a rounded inspiratory
  profile, similar to that seen with continued inspiratory muscle effort.
 an early triggered breath follows. During pressure-cycled ventilation this will lead to a second small VT breath due to the high baseline lung volume, but in assist-volume control Pao will be excessive. Typically this is seen with a stiff respiratory system, PEEPi or inadequate pressure support.
 .
. waveform shows a typical ‘tick’ pattern; there is a rapid spike in expiratory flow due to dynamic compression of large conducting airways at the beginning of expiration, and this is followed by low, slowly declining expiratory
  due to high
  expiratory resistance. When PEEPi is present the expiratory
  fails to cease prior to the inspiratory trigger; however, this may be difficult to detect due to the poor fidelity present on most commercial ventilators.
MONITORING NEUROMUSCULAR FUNCTION
INSPIRATORY OCCLUSION PRESSURE
The pressure 100 ms (P100 or P0.1) after a random occlusion timed at the beginning of inspiration is a measure of respiratory drive. There is a large range of normal values (1.5–5 cmH2O), but it is reproducible in an individual patient. In ventilated patients the P0.1 correlates with the work of breathing during pressure support ventilation, and changes in the same direction as PEEPe is increased if work is reduced.59 Consequently, P0.1 may prove to be a useful method of titrating PEEPe in patients with dynamic hyperinflation; however, this is not valid when flow triggering is used.
MAXIMUM MOUTH PRESSURES
Maximum inspiratory (MIP) and expiratory (MEP) mouth pressures can be used to estimate the power of the respiratory muscles. MIP is usually measured in ventilated patients using a unidirectional expiratory valve for ∼20 seconds.60 This ensures the procedure is performed from a low lung volume and does not require patient cooperation. However, despite this, the results are quite variable.61 Normal values vary with age and gender; young females may exceed ∼–90 cmH2O, and young males ∼–130 cmH2O. A MIP <–20 cmH2O is predictive of weaning failure; however, this is associated with too many false positives and negatives to be useful.11 MEP may be useful in myopathic patients with expiratory muscle weakness. Transdiaphragmatic pressure is assessed using an oesophageal and gastric balloon to measure the pressure in these two cavities.
WORK OF BREATHING
The work of breathing (WB) is the sum of elastic work (Wel), flow-resistive work (Wres) and inertial work (negligible), and can be estimated from V–P data during spontaneous or assisted ventilation. An oesophageal balloon is used to examine changes in pleural pressure,  is measured with a pneumotachograph and volume is derived as its integral. Although conceptually WB is the inspiratory area of a V–P loop, this needs to be referenced to the chest wall V–P curve, and the appropriate area measured from a Campbell diagram.62
The normal WB is ∼0.5 J/l of  , and this may be significantly increased in patients with acute respiratory failure, and by additional work imposed by ventilatory apparatus, including the endotracheal tube and connector, humidifier and ventilator circuit.63 The consequences of a large increase in WB may include an increase in the O2 attributable to breathing (O2 resp), respiratory muscle insufficiency, CO2 retention and acute respiratory failure. However, WB is rarely measured outside research projects since the Campbell diagram is a relatively tedious approach. Simplifications have been used, but these are not as accurate, and WB only estimates energy expenditure during muscle shortening, with relatively poor correlation with O2 resp.64 Consequently, the pressure–time product (PTP), which does correlate with O2 resp,65 is more commonly measured.10
Pressure–time product
PTP is usually calculated from the oesophageal pressure–time integral during inspiration. In mechanically ventilated patients the oesophageal pressure during assisted breathing is compared with that during a controlled breath, or that pressure calculated from the chest wall elastance and lung volume.10 However, the early correlation of O2 resp with PTP used the transdiaphragmatic pressure in spontaneously breathing subjects.62 Using either technique, importantly, the effort expended before  occurs due to PEEPi is measured, probably accounting for the better correlation of O2 resp with PTP than WB.62 Although incremental pressure support ventilation may reduce PTP in COPD patients, the effect can be variable, with some patients also showing evidence of expiratory muscle activity due to delayed sensing of neural expiration.10
1 Cohen CA, Zagelbaum G, Gross D, et al. Clinical manifestations of inspiratory muscle fatigue. Am J Med. 1982;73:308-316.
2 Martin J, Jardim J, Sampson M, et al. Factors influencing pulsus paradoxus in asthma. Chest. 1981;80:543-549.
3 Dantzker DR, Brook CJ, Dehart P, et al. Ventilation–perfusion distributions in the adult respiratory distress syndrome. Am Rev Respir Dis. 1979;120:1039-1052.
4 Nuckton TJ, Alonso AJ, Kallet RH, et al. Pulmonary dead-space fraction as a risk factor for death in the acute respiratory distress syndrome. N Engl J Med. 2002;346:1281-1286.
5 Palmon SC, Liu M, Moore LE, et al. Capnography facilitates tight control of ventilation during transport. Crit Care Med. 1996;24:608-611.
6 Levine RL. End-tidal CO2: physiology in pursuit of clinical applications. Intens Care Med. 2000;26:1595-1597.
7 2005 American Heart Association Guidelines for Cardiopulmonary Resuscitation and Emergency Cardiovascular Care. Advanced cardiovascular life support. Circulation. 112, 2005. III-25–54
8 Joint Faculty of Intensive Care Medicine. Minimum Standards for Transport of Critically Ill Patients. Melbourne: Joint Faculty of Intensive Care Medicine, 2003. Review IC-10
9 Joint Faculty of Intensive Care Medicine. Minimum Standards for Intensive Care Units. Melbourne: Joint Faculty of Intensive Care Medicine, 2003. Review IC-1
10 Australian and New Zealand College of Anaesthetists. Monitoring During Anaesthesia. Melbourne: Australian and New Zealand College of Anaesthetists, 2006. Review PS18
11 Jubran A. Advances in respiratory monitoring during mechanical ventilation. Chest. 1999;116:1416-1425.
12 Yang K, Tobin MJ. A prospective study of indices predicting outcome of trials of weaning from mechanical ventilation. N Engl J Med. 1991;324:1445-1450.
13 Wrigge H, Sydow M, Zinserling J, et al. Determination of functional residual capacity (FRC) by multibreath nitrogen washout in a lung model and in mechanically ventilated patients. Accuracy depends on continuous dynamic compensation for changes of gas sampling delay time. Intens Care Med. 1998;24:487-493.
14 Bersten AD. Measurement of overinflation by multiple linear regression analysis in patients with acute lung injury. Eur Respir J. 1998;12:526-532.
15 Pelosi P, Cereda M, Foti G, et al. Alterations of lung and chest wall mechanics in patients with acute lung injury: effects of positive end-expiratory pressure. Am J Respir Crit Care Med. 1995;152:531-537.
16 Mergoni M, Martelli A, Volpi A, et al. Impact of positive end-expiratory pressure on chest wall and lung pressure–volume curve in acute respiratory failure. Am J Respir Crit Care Med. 1997;156:846-854.
17 Ranieri VM, Brienza N, Santostasi S, et al. Impairment of lung and chest wall mechanics in patients with acute respiratory distress syndrome: role of abdominal distension. Am J Respir Crit Care Med. 1997;156:1082-1091.
18 Gattinoni L, Pelosi P, Suter PM, et al. Acute respiratory distress syndrome caused by pulmonary and extrapulmonary disease. Different syndromes? Am J Respir Crit Care Med. 1998;158:3-11.
19 Baydur A, Behrakis PK, Zin WA, et al. A simple method for assessing the validity of the esophageal balloon technique. Am Rev Respir Dis. 1982;126:788-791.
20 Higgs BD, Behrakis PK, Bevan DR, Milic-Emili J. Measurement of pleural pressure with esophageal balloon in anesthetized humans. Anesthesiology. 1983;59:340-343.
21 Lanteri CJ, Kano S, Sly PD. Validation of esophageal pressure occlusion test after paralysis. Pediatr Pulmonol. 1994;17:56-62.
22 Fredberg JJ, Stamenovic D. On the imperfect elasticity of lung tissue. J Appl Physiol. 1989;67:2408-2419.
23 Grimby G, Takishima T, Graham W, et al. Frequency dependence of flow resistance in patients with obstructive lung disease. J Clin Invest. 1968;47:1455-1465.
24 Woolcock AJ, Vincent NJ, Macklem PT. Frequency dependence of compliance as a test for obstruction in the small airways. J Clin Invest. 1969;48:1097-1106.
25 Mead J. Measurement of inertia of the lungs at increased ambient pressure. J Appl Physiol. 1956;9:208-212.
26 Bates JH, Rossi A, Milic-Emili J. Analysis of the behavior of the respiratory system with constant inspiratory flow. J Appl Physiol. 1985;58:1840-1848.
27 Otis AB, McKerrow CB, Bartlett RA, et al. Mechanical factors in distribution of pulmonary ventilation. J Appl Physiol. 1956;8:427-443.
28 Jonson B, Beydon L, Brauer K, et al. Mechanics of respiratory system in healthy anesthetized humans with emphasis on viscoelastic properties. J Appl Physiol. 1993;75:132-140.
29 Jonson B, Richard J-C, Straus R, et al. Pressure–volume curves and compliance in acute lung injury: evidence for recruitment above the lower inflection point. Am J Respir Crit Care Med. 1999;159:1172-1178.
30 Crotti S, Mascheroni D, Caironi P, et al. Recruitment and derecruitment during acute respiratory failure: a clinical study. Am J Respir Crit Care Med. 2001;164:131-140.
31 Hickling KG. The pressure–volume curve is greatly modified by recruitment. A mathematical model of ARDS lungs. Am J Respir Crit Care Med. 1998;158:194-202.
32 Matamis D, Lemaire F, Harf A, et al. Total respiratory pressure–volume curves in the adult respiratory distress syndrome. Chest. 1984;86:58-66.
33 Gattinoni L, Mascheroni D, Basilico E, et al. Volume/pressure curve of total respiratory system in paralysed patients: artefacts and correction factors. Intens Care Med. 1987;13:19-25.
34 Dall’ava-Santucci J, Armaganidis A, Brunet F, et al. Causes of error of respiratory pressure–volume curves in paralyzed subjects. J Appl Physiol. 1988;64:42-49.
35 Levy P, Similowski T, Corbeil C, et al. A method for studying volume-pressure curves of the respiratory system during mechanical ventilation. J Crit Care. 1989;4:83-89.
36 Servillo G, Svantesson C, Beydon L, et al. Pressure–volume curves in acute respiratory failure: automated low flow inflation versus occlusion. Am J Respir Crit Care Med. 1997;155:1629-1636.
37 Lu Q, Vieira SRR, Richecoeur J, et al. A simple automated method for measuring pressure–volume curves during mechanical ventilation. Am J Respir Crit Care Med. 1999;159:275-282.
38 Beydon L, Svantesson C, Brauer K, et al. Respiratory mechanics in patients ventilated for critical lung disease. Eur Respir J. 1996;9:262-273.
39 Peslin R, da Silva JF, Chabot F, et al. Respiratory mechanics studied by multiple linear regression in unsedated ventilated patients. Eur Respir J. 1992;5:871-878.
40 Eberhard L, Guttmann J, Wolff G, et al. Intrinsic PEEP monitored in the ventilated ARDS patient with a mathematical method. J Appl Physiol. 1992;73:479-485.
41 Nicolai T, Lanteri C, Freezer N, et al. Non-invasive determination of alveolar pressure during mechanical ventilation. Eur Respir J. 1991;4:1275-1283.
42 Grasso S, Terragni P, Mascia L, et al. Airway pressure–time curve profile (stress index) detects tidal recruitment/hyperinflation in experimental acute lung injury. Crit Care Med. 2004;32:1018-1027.
43 Kano S, Lanteri CJ, Duncan AW, et al. Influence of nonlinearities on estimates of respiratory mechanics using multilinear regression analysis. J Appl Physiol. 1994;77:1185-1197.
44 Sullivan M, Paliotta J, Saklad M. Endotracheal tube as a factor in measurement of respiratory mechanics. J Appl Physiol. 1976;41:590-592.
45 Wright PE, Marini JJ, Bernard GR. In vitro versus in vivo comparison of endotracheal tube airflow resistance. Am Rev Respir Dis. 1989;140:10-16.
46 Manthous CA, Hall JB, Schmidt GA, et al. Metered-dose inhaler versus nebulized albuterol in mechanically ventilated patients. Am Rev Respir Dis. 1993;148:1567-1570.
47 Gottfried SB, Rossi A, Higgs BD, et al. Noninvasive determination of respiratory system mechanics during mechanical ventilation for acute respiratory failure. Am Rev Respir Dis. 1985;131:414-420.
48 Peslin R, Fredberg JJ. Oscillation mechanics of the respiratory system. In: Macklem PT, Mead J, editors. Handbook of Physiology, Respiratory Mechanics. Bethesda, MD: American Physiological Society; 1986:145-177.
49 Pepe PE, Marini JJ. Occult positive end-expiratory pressure in mechanically ventilated patients with airflow obstruction: the auto-PEEP effect. Am Rev Respir Dis. 1982;126:166-170.
50 Petrof BJ, Legare M, Goldberg P, et al. Continuous positive airway pressure reduces work of breathing and dyspnea during weaning from mechanical ventilation in severe chronic obstructive pulmonary disease. Am Rev Respir Dis. 1990;141:281-289.
51 Tuxen DV, Lane S. The effects of ventilatory pattern on hyperinflation, airway pressures, and circulation in mechanical ventilation of patients with severe air-flow obstruction. Am Rev Respir Dis. 1987;136:872-879.
52 Rossi A, Gottfried SB, Zocchi L, et al. Measurement of static compliance of the total respiratory system in patients with acute respiratory failure during mechanical ventilation. The effect of intrinsic positive end-expiratory pressure. Am Rev Respir Dis. 1985;131:672-677.
53 Lessard MR, Lofaso F, Brochard L. Expiratory muscle activity increases intrinsic positive end-expiratory pressure independently of dynamic hyperinflation in mechanically ventilated patients. Am J Respir Crit Care Med. 1995;151:562-569.
54 Schuessler TF, Gottfried SB, Goldberg P, et al. An adaptive filter to reduce cardiogenic oscillations on esophageal pressure signals. Biomed Eng. 1998;26:260-267.
55 Ninane V, Yernault JC, de Troyer A. Intrinsic PEEP in patients with chronic obstructive pulmonary disease. Role of expiratory muscles. Am Rev Respir Dis. 1993;148:1037-1042.
56 Maltais F, Reissmann H, Navalesi P, et al. Comparison of static and dynamic measurements of intrinsic PEEP in mechanically ventilated patients. Am J Respir Crit Care Med. 1994;150:1318-1324.
57 Yan S, Kayser B, Tobiasz M, et al. Comparison of static and dynamic intrinsic positive end-expiratory pressure using the Campbell diagram. Am J Respir Crit Care Med. 1996;154:938-944.
58 Georgopoulos D, Prinianakis G, Kondili E. Bedside waveforms interpretation as a tool to identify patient-ventilator asynchronies. Intens Care Med. 2006;32:34-47.
59 Mancebo J, Albaladejo P, Touchard D, et al. Airway occlusion pressure to titrate positive end-expiratory pressure in patients with dynamic hyperinflation. Anesthesiology. 2000;93:81-90.
60 Caruso P, Friedrich C, Denari SDC, et al. The unidirectional valve is the best method to determine maximal inspiratory pressure during weaning. Chest. 1999;115:1096-1101.
61 Multz AS, Aldrich TK, Prezant DJ, et al. Maximal inspiratory pressure is not a reliable test of inspiratory muscle strength in mechanically ventilated patients. Am Rev Respir Dis. 1990;142:529-532.
62 Banner MJ, Jaeger MJ, Kirby RR. Components of the work of breathing and implications for monitoring ventilator-dependent patients. Crit Care Med. 1994;22:515-523.
63 Bersten AD, Rutten AJ, Vedig AE, et al. Additional work of breathing imposed by endotracheal tubes, breathing circuits and intensive care ventilators. Crit Care Med. 1989;17:671-680.
64 Annat G, Viale J-P. Measuring the breathing workload in mechanically ventilated patients. Intens Care Med. 1990;16:418-421.
65 Field S, Sanci S, Grassino A. Respiratory muscle oxygen consumption estimated by the diaphragmatic pressure–time index. J Appl Physiol. 1984;57:44-51.