CHAPTER 5 Regulation of Fluids and Electrolytes
Overview of anatomy and physiology
Renal Blood Flow
Despite accounting for only 0.5% of body weight, the kidneys receive about 25% of the cardiac output, with a blood flow of approximately 4 mL/min per gram of kidney tissue. Renal plasma flow (RPF) in women is slightly lower than it is in men, even when normalized for body surface area, averaging 592 ± 153 mL/min per 1.73 m2 and 654 ± 163 mL/min per 1.73 m2, respectively (Smith, 1943). In children between the ages of 6 months and 1 year, normalized RPF is half that of adults but increases progressively to reach adult levels at about 3 years of age (McCrory, 1972). After the age of 30 years, renal blood flow (RBF) decreases progressively; by the age of 90 years, it is approximately half of the value present at 20 years (Davies and Shock, 1950). This generous supply provides not only for the basal metabolic needs of the kidneys but also for the high demands of ultrafiltration.
The basic arterial supply of the kidneys is a single renal artery that divides into large anterior and posterior branches and subsequently into segmental or interlobar arteries. The latter form the arcuate and interlobular arteries. These blood vessels are end-arteries and therefore predisposed to tissue infarction in the presence of emboli. The arcuate arteries are short, large-caliber vessels that supply blood to the afferent arterioles of the glomeruli at a mean pressure of 45 mm Hg, which is higher than that found in most capillary beds. This high hydraulic pressure and large endothelial pore size lead to enhanced glomerular filtration (Brenner and Beeuwkes, 1978).
Ninety percent of RBF goes to the cortex, which accounts for 75% of the renal weight, whereas the medulla and the rest of the kidneys receive 25% of the RBF. Although cortical blood flow is 5 to 6 mL/g per minute, outer medullary blood flow decreases to 1.3 to 2.3 mL/g per minute, and the flow to the papilla is as low as 0.22 to 0.42 mL/g per minute (Dorkin and Brenner, 1991). The unevenness in the distribution of RBF between the cortex and the medulla is necessary to develop and maintain the medullary gradient of osmotically active solutes that drive the countercurrent exchange/multiplier, which is essential for the elaboration of concentrated urine. Outer medullary blood flow may preferentially supply the loop of Henle, thereby accounting for the striking influence of loop diuretics in that region. Furthermore, papillary blood flow is far greater than the metabolic needs of the renal parenchyma and is well adapted to the countercurrent concentrating mechanism characteristic of this region.
RBF remains almost constant over a range of systolic blood pressures from 80 to 180 mm Hg, a phenomenon known as autoregulation. Consequently, glomerular filtration is also constant over this range of pressures as a result of adaptations in the renal vascular resistance (Selkurt et al., 1949, Gertz et al., 1966). Because the changes in resistance that accompany graded reductions in renal perfusion pressure occur in both denervated and isolated perfused kidneys, autoregulation appears not to depend on extrinsic neural or hormonal factors (Thurau, 1964). According to the “myogenic hypothesis” first proposed by Bayliss (1902), the stimulus for vascular smooth muscle contraction in response to increasing intraluminal pressure is either the transmural pressure itself or the increase in the tension of the vascular wall. An increase in perfusion pressure, which initially distends the vascular wall, is followed by a contraction of the resistance vessels and a return of blood flow to basal levels.
There are only a few studies of autoregulation of RBF in developing animals. Aortic constriction in adult animals reduces renal perfusion by 30% but has minimal effects on RBF and glomerular filtration rate, compared with the significant changes observed in 4- to 5-week-old rats (Yared and Yoskioka, 1989). Furthermore, it has been demonstrated that autoregulation of RBF in young rats occurs at renal perfusion pressures between 70 and 100 mm Hg, compared with pressures of 100 to 130 mm Hg in adult rats (Chevalier and Kaiser, 1985). A similar increase in the pressure set point for autoregulation has been found in dogs (Jose et al., 1975). It appears that autoregulation of RBF occurs in the very young and is sufficient to maintain blood flow constant over a wide range of perfusion pressures that are physiologically adequate for the age. No such human studies are available.
Several substances have been proposed to participate in the autoregulation of RBF, including vasoconstrictor and vasodilator prostaglandins, kinins, adenosine, vasopressin, the renin-angiotensin-aldosterone system, endothelin, and endopeptidases (Herbacznska-Cedro and Vane, 1973, Osswald et al., 1978, Maier et al., 1981, Schnermann et al., 1984). Nitric oxide (NO), previously known as endothelium-derived relaxing factor (EDRF), has also been shown to play an important role in regulating renal vascular tone through its vasodilatory action. Bradykinin, thrombin, histamine, serotonin, and acetylcholine act on endothelial receptors to activate phospholipase C, which in turn results in the formation of inositol triphosphate and diacylglycerol, resulting in the release of intracellular calcium (Marsden and Brenner, 1991, Luscher et al., 1992). This in turn stimulates the synthesis of NO from L-arginine. Other factors that stimulate the formation of NO include hypoxia, calcium ionophores, and mechanical stimuli to the endothelium. NO increases RBF by decreasing efferent arteriolar vascular resistance, while glomerular filtration remains unchanged (Marsden and Brenner, 1991).
Because in mature kidneys, autoregulation is lost at arterial pressures less than 80 mm Hg, the lower physiologic pressures prevailing in the newborn period may be expected to limit this important control mechanism. There is evidence both to support and to refute this conclusion (Kleinman and Lubbe, 1972, Jose et al., 1975).
Renal Physiology
The route by which water and other solutes are filtered from the blood is not fully understood, but it appears that plasma ultrafiltrate traverses the large fenestrations of the glomerular capillary endothelium and penetrates the basement membrane and the slit pores located between the podocyte foot processes. Filtration of large molecules is greatly influenced by the size and charge of the specific molecule, as well as by the integrity and charge of the glomerular basement membrane. Abnormalities in various structural proteins of the slit-pore diaphragm such as nephrin, podocin, and α-actinin may be responsible for several proteinuric disorders (Mundel and Shankland, 2002). In general, the endothelium and the lamina rara interna of the glomerular basement membrane slow the filtration of circulating polyanions such as albumin (Ryan and Karnovsky, 1976). The lamina rara externa and the slit pores slow the filtration of cationic macromolecules such as lactoperoxidase (Graham and Kellermeyer, 1968). Neutral polymers such as ferritin are not filtered because of their large molecular size and shape (Farauhar et al., 1961). Molecules with a radius of 4.2 nm or more are excluded from the glomerular filtrate. In practical terms, red cells, white cells, platelets, and most proteins are restricted to the circulation.
Glomerular Filtration
Among the main functions performed by the kidneys is the process of glomerular filtration. The glomerulus is primarily responsible for the filtration of plasma. The glomerular filtration rate (GFR) is the product of the filtration rate in a single nephron and the number of such nephrons, which range from 0.7 to 1.4 million in each kidney (Keller et al., 2003). Clearance, which is defined as the volume of plasma cleared of a substance within a given time, provides only an estimate or approximation of GFR.
Glomerular filtration is driven by hydrostatic pressure, which forces water and small solutes across the filtration barrier. In healthy individuals, changes in hydrostatic pressure rarely affect single-nephron GFR because autoregulatory mechanisms sustain or maintain a constant glomerular capillary pressure over a large range of systemic blood pressure (Robertson et al., 1972). Hydrostatic pressure is opposed by the oncotic pressure produced by plasma proteins and the hydrostatic pressure within Bowman’s capsule. Mathematically, this relation can be expressed by the following equation:
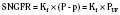
SNGFR is the single-nephron glomerular filtration rate; Kf is the glomerular ultrafiltration coefficient; P and p are the average hydraulic and osmotic pressure differences, respectively; and PUF is the net ultrafiltration pressure. As plasma water is filtered, the proteins within the capillaries become more concentrated, so oncotic pressure increases at the distal end of the glomerular capillary loop and the rate of filtration ceases at the efferent capillary (Blantz, 1977). Under normal conditions, about 20% of the plasma water that enters the glomerular capillary bed is filtered; this quantity is referred to as the filtration fraction
Serum-creatinine concentrations vary by age and gender. In 1-year-old girls values are 0.35 ± 0.05 mg/dL (mean ± SD) and rise gradually to 0.7 ± 0.02 mg/dL (mean ± SD) by 17 years of age; boys have corresponding mean values that are 0.05 mg/dL higher until 15 years of age and 0.1 mg/dL higher subsequently (Schwartz et al., 1987). Expected creatinine-excretion rates in 24-hour urine collections are often used to validate such collections. Values range from 8 to 14 mg/kg per day in neonates and in infants younger than 1 year of age, with an increase to about 22 ± 7 mg/kg per day (mean ± SD) in preadolescent children of either gender (Hellerstein et al., 2001). Subsequently, creatinine excretion in boys is 27 ± 3.4 mg/kg per day.

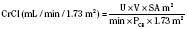
where height is in centimeters, PCR is the plasma-creatinine concentration in mg/dL, and k is a constant proportion to muscle mass. The value of k is 0.45 in full-term newborns and until 1 year of age, 0.55 in children 2 years of age and older and in adolescent girls, and 0.70 in adolescent boys (Schwartz et al., 1987). Normal CrCl ranges from 90 to 143 mL/min per 1.73 m2, with a mean of 120 mL/min per 1.73 m2
In children with impaired renal function, GFR estimates based on creatinine methods may grossly overestimate the true GFR, because tubular and gastrointestinal secretion of creatinine increases disproportionately. Hence, serum creatinine concentrations are less reflective of filtration at the glomerulus. For example, Schwartz’s formulas overestimate GFR by 10% ± 3% when GFR is greater than 50 mL/min per 1.73 m2 but by 90% ± 15% when GFR is less than 50 mL/min per 1.73 m2. Other limitations of creatinine-based GFR determinations stem from variations of analytical assays, reference values ranging from 0.1 to 0.6 mg/dL in children younger than 9 years of age, diurnal variation in serum creatinine levels resulting from high intake of cooked meat or intense exercise, influence of body mass index, and inaccurate urine collections—all of which make comparisons of GFR difficult over time, especially in growing children (Levey et al., 1988). Using cimetidine to block tubular secretion of creatinine before measuring CrCl in urine collections may improve such measurements (Hellerstein et al., 1998).
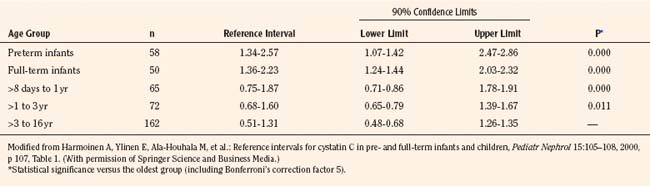
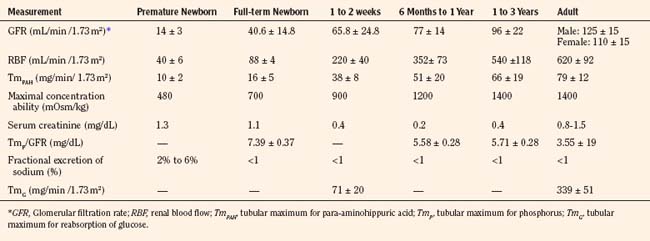
Measurement of cystatin-C, a 13-kDa serine proteinase produced at a constant rate by all nucleated cells, is purported to be a superior endogenous marker of filtration, because cystatin-C is less susceptible to variation than is plasma creatinine. A meta-analysis compared the correlation between GFR measured by inulin clearance, radiolabeled methods, nonlabeled iothalamate or iohexol, and either plasma creatinine or cystatin-C concentrations measured nephelometrically (Dharnidharka et al., 2002).The correlation between GFR and cystatin-C was significantly higher compared with plasma creatinine (0.846 versus 0.742, P < 0.001). Thus, cystatin-C measurements are becoming increasingly popular in clinical practice, and reference ranges have been generated in children up to 16 years of age (Table 5-1) (Bokenkamp et al., 1998; Finney et al., 2000; Harmoinen et al., 2000).
Studies in renal transplant donors and in individuals with various renal disorders have shown that plasma-creatinine concentration changes minimally as GFR falls to about 50 mL/min per 1.73 m2 (Fig. 5-1) (Shemesh, 1985). This compensation is largely the result of hypertrophy and hyperfiltration of the remaining nephrons. When more than 50% of the nephrons cease to function and “renal reserve” is outstripped, serum creatinine may rise rapidly in a parabolic fashion (Fig. 5-1). Thus, when a more accurate clinical assessment of GFR is desirable for research purposes, radiolabeled methods with an identity exceeding 97% give a better approximation of GFR relative to inulin clearance and may be more useful in aiding clinical decisions. In multicenter investigations conducted in the United States using a uniform method for GFR measurement, 125I-iothalamate is often used because this isotope has low radiation exposure and long isotope half-life and can be assayed at a central laboratory (Bajaj et al., 1996). Otherwise, 99mTc-diethylenetriaminepenta-acetic acid (Tc-DTPA) is commonly used to estimate GFR for routine clinical purposes. In other countries, 51Cr-ethylenediaminetetra-acetic acid (Cr-EDTA), which delivers a greater radiation dosage, is also popular, as are nonlabeled iothalamate and iohexol methods.
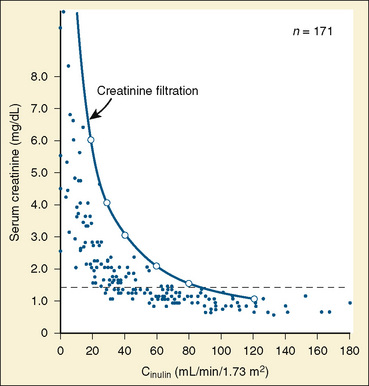
FIGURE 5-1 Relationship of serum creatinine to GFR.
(From Shemesh O, Golbetz H, Kriss JP, et al.: Limitation of creatinine as a filtration marker in glomerulopathic patients, Kidney Int 28:830, 1985.)
Although GFR may fluctuate, the kidneys retain the ability to regulate the rate of solute and water excretion according to changes in intake. This regulation is achieved by changes in tubular reabsorption rates—a phenomenon known as glomerular-tubular balance (Tucker and Blantz, 1977). The end result is preservation of ECF volume and chemical composition. Glomerular-tubular balance can be disturbed by several factors, including volume expansion, loop diuretics, and inappropriate secretion of antidiuretic hormone (ADH).
Overview of Tubular Function
The proximal tubule is the site of reabsorption of large quantities of solute and filtered fluid (Fig. 5-2). Many transporters subserving tubular electrolyte transport have been characterized at the genetic level, and various pathologic disorders have been elucidated (Epstein, 1999). Under physiologic conditions, the proximal convoluted tubule isotonically reabsorbs 50% to 60% of the glomerular filtrate (Berry and Rector, 1991). The initial portion of the proximal convoluted tubule reabsorbs most of the filtered glucose, amino acids, and bicarbonate. Glucose and amino acids are absorbed actively, whereby they are transported against their electrochemical gradient, coupled to sodium (Na+). Active Na+ transport at the peritubular membrane provides the driving force that ultimately is responsible for other transport processes. The system is driven by sodium, Na+, K+, (activated) adenosine triphosphatase (Na+–, K+-ATPase), or the Na+ “pump,” which requires the presence of K+ in the peritubular fluid and is inhibited by ouabain.Micropuncture studies show that around 50% to 70% of the filtered Na+ is reabsorbed in this segment, mostly by a process of active cotransport.
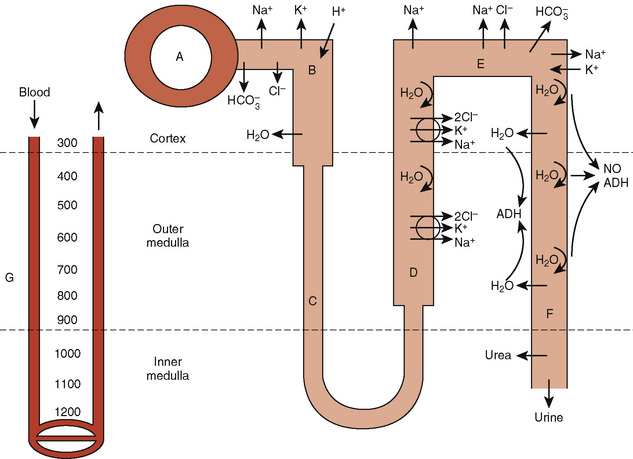
The major fraction of filtered bicarbonate (HCO3−) is absorbed early in the proximal convoluted tubule. Hydrogen (H+) gains access to luminal fluid via an Na+/H+ electroneutral exchange mechanism and forms carbonic acid. The latter is dehydrated to H2O and CO2 under the influence of carbonic anhydrase. CO2 diffuses into the cell, and HCO3− is re-formed and ultimately absorbed into the bloodstream. In general, the concentration of HCO3− is maintained at 26 mmol/L, which is slightly below the renal threshold of approximately 28 mmol/L (Pitts and Lotspeich, 1946).
The renal clearance of glucose is exceedingly low, even after complete maturation of glomerular filtration. The amount filtered increases linearly as plasma glucose increases. Initially, all filtered glucose is reabsorbed until the renal threshold has been exceeded (at around 180 mg/dL), at which point filtered glucose appears in the urine. However, maximal tubular glucose (TmG) reabsorption is attained at a filtrate glucose concentration of about 350 mg/mL (Pitts, 1974). The reabsorption of glucose in the proximal tubule occurs via a carrier-mediated, Na+/glucose cotransport process across the apical membrane, followed by passive facilitated diffusion and active Na+ extrusion across the basolateral membrane.
The loop of Henle makes the formation of concentrated urine possible and contributes to the formation of dilute urine (Kokko, 1979). This dual function is achieved through the unique membrane properties of the loop, the postglomerular capillaries, and the hypertonicity of the interstitium. The proximity of the descending and ascending portions of loop allows it to function as a countercurrent multiplier, whereas the capillaries serve as countercurrent exchangers (Fig. 5-2). The descending loop of Henle abstracts water from tubular fluid, increasing the intraluminal concentrations of NaCl and other solutes. However, the intraluminal osmolality remains in equilibrium with the interstitium, where 50% of the osmolality results from urea. In the thin ascending limb of the loop of Henle, there is passive efflux of NaCl and urea into the interstitium. The thick ascending limb of the loop of Henle, by being impermeable to water, contributes to the formation of dilute urine.
The Kidneys and Antidiuretic Hormone
ADH plays a pivotal role in water homeostasis by acting on the most distal portion of the nephron. ADH is a cyclic octapeptide that, along with its carrier protein, neurophysin, is synthesized in the supraoptic and paraventricular nuclei of the hypothalamus (Zimmerman and Defendini, 1977). The prohormone migrates along the nerve axons to the posterior pituitary gland, where it is stored as arginine vasopressin. It is released through exocytosis (Douglas, 1973).
Several variables affect ADH secretion. Physiologically, the most important factor is plasma osmolality. A very small rise in plasma osmolality is sufficient to trigger a response from the sensitive osmoreceptors located in and around the hypothalamic nuclei, leading to ADH secretion. Conversely, plasma ADH concentrations are less than 1 pg/mL at a physiologic plasma osmolality of less than 280 mOsm/kg water. The antidiuretic activity of ADH is maximal at plasma osmolality of greater than 295 mOsm/kg water, when plasma ADH exceeds 5 pg/mL (Robertson, 2001). Once plasma osmolality exceeds this limit—thus surpassing the capacity of the ADH system to affect maximal fluid retention—the organism depends on thirst to defend against dehydration. Intracerebral synthesis of angiotensin II largely mediates this thirst response and the oropharyngeal reflex. Atrial natriuretic peptide (ANP) opposes the release of ADH and of angiotensin II. In summary, plasma osmolality and Na+ are maintained within a narrow range. The upper limit of this range is determined by the sensitivity of the thirst mechanism located in the hypothalamus, whereas its lower range is affected by ADH release.
Nonhypovolemic conditions that stimulate ADH release often result in diminished urine volume, hyponatremia, fractional excretion of uric acid greater than 10%, low serum uric acid level (<4 mg/dL), and urinary sodium greater than 20 mEq/L (Albanese et al., 2001). These conditions result in hyponatremia. Conversely, inhibitors of ADH release or primary or acquired nephropathies may result in the inability to respond to ADH or to conserve water, and these inhibitors are often accompanied by polyuria with Uosm of less than 150 mOsm/kg, dehydration, and hypernatremia.
ADH has a major effect on the medullary thick ascending limb and thereby influences the countercurrent multiplier mechanism and urinary concentration. More directly, ADH binds to V2 receptors in the basolateral membrane of the collecting duct, causing the activation of adenylate cyclase and the formation of cyclic 3′,5′-adenosine monophosphate (cAMP) (Dorisa and Valtin, 1976; Schwartz et al., 1974). This results in insertion of aquaporin-2 water channels in apical membranes and in the activation of apical Na+ channels, which causes water conservation (Andreoli, 2001). These effects are counterbalanced by prostaglandin E2 (PGE2) and the calcium-sensing receptor in cells of the medullary thick ascending limb that mediate saluresis and diuresis.
Polyuric syndromes can be separated on the basis of urine osmolality and generally consist of water diuresis, solute diuresis, or a mixed water-solute diuresis with typical Uosm of less than 150 mOsm/kg, 300 to 500 mOsm/kg, and 150 to 300 mOsm/kg, respectively (Oster et al., 1997). The etiology of polyuria may be facilitated by obtaining a urinalysis; a measurement of urine pH; and measurements of electrolytes, creatinine, osmolality, glucose, urea nitrogen, and bicarbonate, preferably in a timed urine collection together with the corresponding serum values. Such assessment may serve to prevent dehydration, acid-base disturbances, hypokalemia, or hypernatremia, which often accompany such polyuric disorders (Table 5-2) (Oster et al., 1997). Proper correction of acute hypernatremia is needed to prevent brain demyelination. Normal saline infusion may be the agent of choice in polyuric conditions associated with solute diuresis, whereas ADH and electrolyte-free fluid administration may be appropriate in cases of “pure” water diuresis. The recommended rate of correction of hypernatremia is about 10 mEq/L per 24 hours, amounting to a fall in plasma osmolality of about 20 mOsm/kg H2O per day (Adrogue and Madias, 2000b).
Renin-Angiotensin-Aldosterone System
The renin-angiotensin-aldosterone axis plays a key role in control of vascular tone, Na+ and K+ homeostasis, and, ultimately, circulatory volume and cardiovascular and renal function. Renin is an enzyme with a molecular weight of 40 kDa that is synthesized and stored in the juxtaglomerular apparatus surrounding the afferent arterioles of the glomeruli (Davis and Freeman, 1976). The primary stimuli for renal renin release are reductions in renal-perfusion pressure, Na+ restriction, and Na+ loss as detected by the specialized macula densa cells located in the distal tubule. Mechanical (stretch of the afferent glomerular arterioles), neural (sympathetic nervous system), and hormonal (PGE2 and prostacyclin) stimuli act in an integrated fashion to regulate the rate of renin secretion (Fig. 5-3).
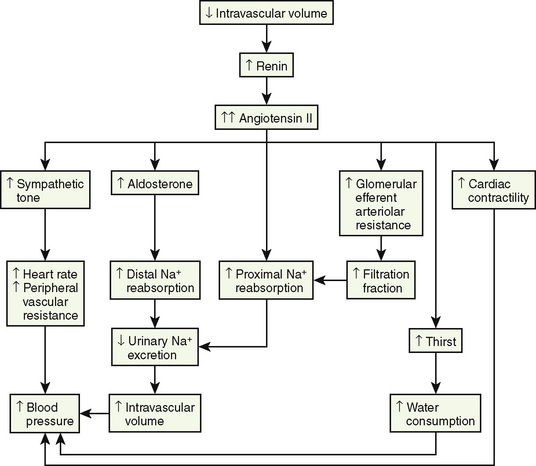
Once released into the circulation, renin cleaves the leucine-valine bond of angiotensinogen, forming angiotensin I. Angiotensin-converting enzyme that is present in the lungs, as well as in the kidneys, large caliber vessels, and other tissues, cleaves the carboxyl terminal (histidine-leucine dipeptide) from angiotensin I to form the biologically active angiotensin II (Ng and Vane, 1967).
Angiotensin II has numerous important hemodynamic functions that are mediated largely by binding to angiotensin-II T1-receptors in endothelial cells, tubular epithelial cells, and smooth muscle (Box 5-1) (Burnier and Brunner, 2000). It plays a key role in regulating blood volume and long-term blood pressure through stimulation of several tubular transporters of Na+-conversation that are mainly located in the proximal tubule, as well as through its effects in enhancing aldosterone secretion and Na+ reabsorption in the distal tubule. As a potent direct smooth-muscle vasoconstrictor and as an enhancer of ADH and sympathetic nervous system activity, angiotensin II also participates in short-term blood-pressure regulation in disorders associated with volume depletion or circulatory depression. Research has uncovered multiple nonhemodynamic functions that are primarily mediated by binding to T1 receptors of angiotensin II, which are particularly important in the pathophysiology of progressive renal injury (Hall et al., 1999).
Box 5-1 Effects of Angiotensin II Mediated via AT1 and AT2 Receptor Stimulation
Modified from Burnier M, Brunner HR: Angiotensin II receptor antagonists, Lancet 355:637, 2000.
A rise in plasma aldosterone concentration stimulates urinary K+ secretion, thus allowing maintenance of K+ balance. Aldosterone also increases the excretion of ammonium (NH4+) and magnesium (Mg2+) and increases the absorption of Na+ in the distal tubule, both by increasing the permeability of the apical membrane and by increasing the activity of Na+, K+-adenosine triphosphatase (ATPase) (Marver and Kokko, 1983). The net effect is to generate more negative potential in the lumen, a driving force for increased K+ secretion. In addition, aldosterone enhances reabsorption of sodium in the cortical collecting duct through activation of the epithelial sodium-specific channel, ENaC (Greger, 2000). In performing these functions, aldosterone plays a key role in regulating fluid and electrolyte balance. Long-term aldosterone administration to healthy volunteers increases the ECF volume. Clinical edema does not occur, however, because after several days the kidneys “escape” from the Na+-retaining effect while maintaining the K+-secretory effect (August et al., 1958).
The Kidneys and Atrial Natriuretic Peptide
ANP is secreted by atrial monocytes in response to local stretching of the atrial wall in cases of hypervolemia (e.g., congestive heart failure or renal failure) and ultimately results in the reduction of intravascular volume and systemic blood pressure (Brenner et al., 1990). In the kidneys, ANP acts in the medullary collecting duct to inhibit sodium reabsorption during ECF expansion. ANP induces hyperfiltration, natriuresis, and suppression of renin release, and it inhibits receptor-mediated aldosterone biosynthesis (Greger, 2000). In the cardiovascular system, it diminishes cardiac output and stroke volume and reduces peripheral vascular resistance. Some of these effects are mediated through the influence of ANP on vagal and sympathetic nerve activity.
Body Fluid Compartments
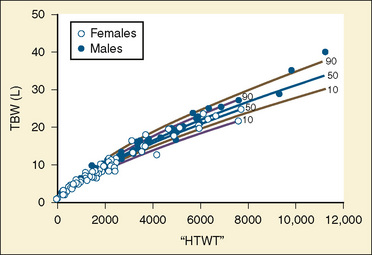
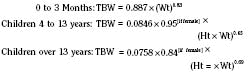
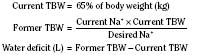
The internal environment of the body consists of fluids contained within compartments. Water accounts for 50% to 80% of the human body by weight. The variation in water content depends on tissue type: adipose tissue contains only 10% water, whereas muscle contains 75% water. Total body water (TBW) decreases with age, mainly as a result of loss of water in ECF. For clinical purposes, TBW is estimated at 60% of body weight in infants older than age 6 months, as well as in children and adolescents. This value is very inaccurate for low–birth-weight premature infants in whom TBW comprises as much as 80% of total body weight (Friis-Hensen, 1971; Kagan et al., 1972). In term infants younger than 6 months of age, TBW may be approximated as 75% of total body weight (Hill, 1990). Newer formulas that consider the height (cm) and weight (kg), but not the degree of adiposity or the child’s surface area, have improved the estimation of TBW, particularly in healthy children between 3 months and 13 years of age (Fig. 5-4) (Mellits and Cheek, 1970; Morgenstern, 2002). TBW can be determined as follows:
Maturation of renal function
Although all nephrons of the mature kidneys are formed by 36 weeks’ gestation during healthy intrauterine life, hyperplasia continues until the sixth postnatal month; thereafter, cell hypertrophy is responsible for increases in renal size. Growth in the size of the kidney tends to be directly proportional to increase in height (Schultz et al., 1962).
While the fetal kidney receives 3% to 7% of cardiac output, RBF increases gradually after birth (Rudolph et al., 1971). RBF, as measured by paraaminohippuric acid (PAH) clearance (CPAH), correlates with gestational age. For example, CPAH is 10 mL/min per square meter at 28 weeks of gestation and 35 mL/min per square meter at 35 weeks of gestation (Fawer et al., 1979). CPAH corrected for body surface area doubles by 2 weeks of age and reaches adult levels at 2 years. Furthermore, changes in RBF are associated with considerable increases in the relative RBF to the outer cortex, where most glomeruli are located (Olbing et al., 1973).
Selected renal functions measured at different ages are summarized in Table 5-3. The GFR in the full-term newborn infant averages 40.6 ± 14.8 mL/min per 1.73 m2 and increases to 65.8 ± 24.8 mL/min per 1.73 m2 by the end of the second postnatal week (Schwartz et al., 1987). GFR reaches adult levels after 2 years of age. Premature newborns have a lower GFR that increases more slowly than that in full-term infants. The low GFR at birth is attributed to the low systemic arterial blood pressure, high renal-vascular resistance, and low ultrafiltration pressure, together with decreased capillary surface area for filtration.
Despite a low GFR, full-term infants are able to conserve Na+ (Spitzer, 1982). This is explained by the existence of glomerulotubular balance, such that as GFR and the filtered load of Na+ increase, so does the ability of the proximal tubule to reabsorb Na+. In contrast, preterm infants have a prolonged glomerulotubular imbalance, so that GFR is high relative to tubular capacity to reabsorb Na+. The glomerulotubular imbalance is caused by structural immaturity of the proximal convoluted tubule and the incomplete development of the transport system responsible for conserving Na+. This, together with poor response of the distal tubule to mineralocorticoids in preterm infants, results in Na+ wastage and susceptibility to hyponatremia.
The tubular mechanisms involved in the excretion of organic acids are poorly developed in neonates. The tubular transport of PAH, which is a weak acid, is around 16 ± 5 mg/min per 1.73 m2 in full-term infants and about half this value in premature babies. It increases with age and reaches adult rates, ranging from 55 to 104 mg/min per 1.73 m2 by 12 to 18 months (Spitzer, 1978). PAH excretion is limited by a number of factors, including low GFR, immaturity of the systems providing energy for transport, and a low number of transporter molecules. This is further accentuated by a low extraction ratio for PAH and other organic acids caused by the predominance of juxtamedullary circulation in the immature kidney, a phenomenon that allows increased shunting of blood through the vasa recta and exclusion of postglomerular blood from the proximal tubular excretory surface (Calcagno and Rubin, 1963).
The kidneys’ ability to concentrate urine is lower at birth, especially in premature infants. After water deprivation in the full-term newborn, urine concentrates to only 600 to 700 mOsm/kg, or 50% to 60% of maximum adult levels. Healthy children ranging from 6 months to 3 years of age who were given 20 mcg of desmopressin intranasally demonstrated a gradual rise in urinary concentration, starting from a mean value of 525 mOsmol/kg to reach a mean maximum plateau of 825 mOsm/kg (Marild et al., 1992). The major cause for the reduced concentration of urine in the neonate is the hypotonicity of the renal medulla (Aperia and Zetterstrom, 1982). Several mechanisms that contribute to interstitial hypertonicity are not well developed, including urea accumulation in the medulla, length of the loop of Henle and the collecting ducts within the medulla, and Na+ reabsorption in the ascending, water-impermeable loop (Trimble, 1970; Horster, 1978; Edwards, 1981). In addition, the collecting duct cells in immature kidneys may be less sensitive to ADH than those of mature nephrons (Schlondorff et al., 1978).
A water-loaded infant can excrete diluted urine with osmolality as low as 50 mOsm/kg. In the first 24 hours of life, however, the infant may be unable to increase water excretion to approximate water intake (Aperia and Zetterstrom, 1982). The diluting capacity becomes mature by 3 to 5 weeks of postnatal life.
Fluid and electrolyte needs in healthy infants and children
The normal need for fluids varies markedly in low–birth-weight and full-term neonates, as well as during infancy and later childhood. This variability in fluid needs is caused by differences in the rate of caloric expenditure and growth, the ratio of evaporative surface area to body weight, the degree of renal functional maturation and reserve, and the amount of TBW at different ages. For instance, compared with older children and adults, infants have greater fluid needs because of higher rates of metabolism and growth; a surface area-to-weight ratio that is about three times greater, resulting in higher insensible fluid loss; and greater urinary excretion of solutes combined with lower tubular concentrating ability, which increases obligatory fluid loss. On the other hand, as previously noted, low–birth-weight and full-term neonates have a greater percentage of TBW compared with older children and adults (Friis-Hensen, 1971; Kagan et al., 1972). This increase in TBW results mainly from expansion of the ECF compartment, which at birth may comprise as much as 50% of the TBW. During the first 3 postnatal days, when this “extra fluid” is eliminated by the kidneys, full-term neonates require less fluid intake (Silverman, 1961; Oh, 1980; Winters, 1982).
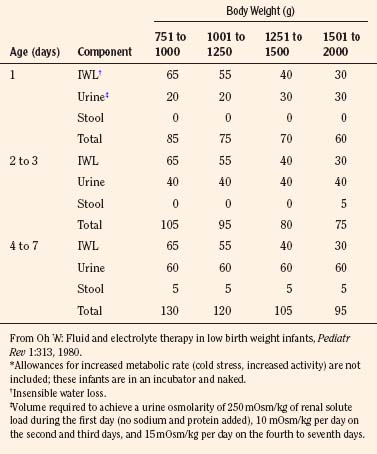
The needs of low–birth-weight infants are more variable and may be markedly altered by relatively minor changes in ambient temperature or by phototherapy (Table 5-4) (Fanaroff et al., 1972; Oh and Karecki, 1972; Wu and Hodgman, 1974). In contrast to more mature infants, the immature skin in very low–birth-weight infants (<1500 g) allows disproportionate evaporative heat loss relative to basal metabolic rate (Levine et al., 1929; Levinson et al., 1966). This greater evaporative heat loss, together with a large body surface area, accounts for the much greater insensible fluid needs in infants with very low birth weight.
TABLE 5-4 Average Fluid Needs of Low–Birth-Weight Infants (mL/kg per 24 hr) During First Week of Life*
Parenteral and Oral Fluids and Electrolytes
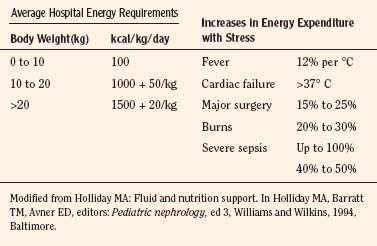
Except for the first 3 postnatal days when full-term neonates require only 40 to 60 mL/kg fluid per day, in general, 100 mL of water is needed for each 100 kcal expended. Notably, an additional 15 mL of water is generated endogenously for each 100 kcal used (water of oxidation), which is also available for body functions. In preterm infants, fluid intake may be gradually increased to 150 mL/kg per day, whereas 100 to 125 mL/kg per day generally suffices for infants weighing less than 10 kg. The fluid requirement decreases to 50 mL/kg per day for those weighing 11 to 20 kg and to 20 mL/kg per day for those with body weights above 20 kg. These fluid volumes are sufficient to allow excretion of dietary solute load, as well as to replace insensible fluid loss through the skin, lungs, and intestines (Table 5-5) (Winters, 1982). It should be noted that energy expenditure and, therefore, fluid intake may be significantly increased with stress (Table 5-6) (Holliday et al., 1994).
TABLE 5-5 Normal Losses and Maintenance Requirements for Fluid, Electrolytes, and Dextrose in Infants and Children
| H2O = 100 to 125 mL/100 kcal Expended | ||
| Components: | Insensible loss (mL) | 45 |
| Sweat (mL) | 0 to 25 | |
| Urine (mL) | 50 to 75 | |
| Stool (mL) | 5 to 10 | |
| Food oxidation (mL) | 12 | |
| Na+ = 2.5 mmol/100 kcal Expended | ||
| Components: | Body growth | |
| Sweat | Variable | |
| Urine | Variable | |
| Stool | Variable | |
| K+ = 2.5 mmol/100 kcal Expended | ||
| Components: | As for Na+ | |
| Cl– = 5 mmol/100 kcal Expended | ||
| Components: | As for Na+ | |
| Dextrose = 25 g/100 kcal Expended | ||
| Components: | Basal metabolic rate | |
| Growth and tissue repair | ||
| Physical activity | ||
| Maintenance Solution (per liter of water) | ||
| Dextrose (g) | 50 | |
| Na+ (mmol) | 25 | |
| K+ (mmol) | 25 | |
| Cl− (mmol) | 50 | |
Adapted from Winters RW: Principles of pediatric fluid therapy, ed 2. Boston, 1982, Little, Brown.
The high fractional excretion of Na+ (FENa+) in premature infants can lead to negative Na+ balance, hyponatremia, neurologic disturbances, and poor growth unless an Na+ intake of 3 to 5 mmol/kg per day is given; in full-term infants and older children, 2 to 3 mmol/kg per day is sufficient (Drukker et al., 1980). Premature infants have a lower renal threshold for bicarbonate. In addition, several functional and anatomic factors combine to limit tubular excretion of weak organic acids (Avner et al., 1990). Consequently, premature infants may need small supplements of base. Sodium bicarbonate at 1 to 2 mmol/kg per day is generally recommended for the very small premature infant. Clinically important disturbances in acid-base status are unusual in full-term neonates unless they consume excessive amounts of protein.
Dehydration in infants and children
Assessment of Dehydration
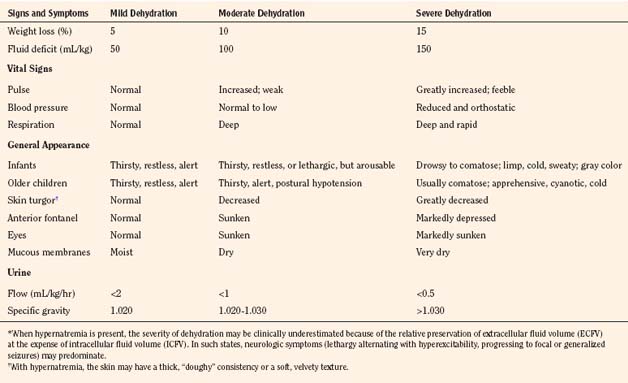
Assessment of the extent and type of dehydration is important for formulating a therapeutic strategy. Table 5-7 provides guidelines for the clinical assessment of the severity of dehydration in children (Ellis and Avner, 1985). Laboratory measurements should include hematocrit, blood gases, glucose, calcium, blood urea nitrogen, and albumin, as well as serum and urinary creatinine, osmolality, and electrolytes. A urinalysis should be done to detect cellular elements and to measure specific gravity. Urinary osmolality and specific gravity are of minimal value in assessing dehydration in premature infants with tubular immaturity and in infants with reduced urinary concentrating ability caused by low protein intake. In general, however, such data, together with a careful medical history, physical examination, and assessment of fluid input and loss, aid in the diagnosis of dehydration and guide adjustment of the amount and composition of fluid administration during various phases of therapy.
Treatment of Dehydration
Severely dehydrated infants and children should be cared for in the intensive care unit with constant monitoring of central venous pressure and serial measurements of the initial laboratory studies. Box 5-2 shows a stepwise approach to the treatment of isotonic, hypotonic, and hypertonic dehydration (Ellis and Avner, 1985). Particular attention should be given to hypernatremic dehydration and brain injury. The initial measures for fluid resuscitation are to stabilize the vital signs by administering crystalloid or colloid solutions and to correct severe acid-base imbalance, hypoglycemia, and other metabolic disturbances. The objective of subsequent measures is to assess further the kind of dehydration and to plan a time course for administration of the appropriate fluid volume and chemical composition needed to correct previous deficits and to replace ongoing losses.
Box 5-2 Stepwise Approach to Fluid Therapy in Infants and Young Children with Moderate (100 mL/kg) to Severe (150 mL/kg) Dehydration*
Phase I (0 to 4 hours)
Phase II (4 hours to 2 days)
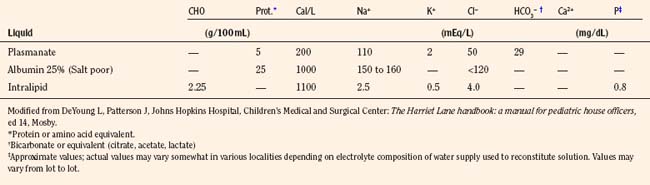
The composition of select parenteral and oral rehydration solutions are shown in Tables 5-8 and 5-9. In most infants and children receiving parenteral solutions for brief periods, the normal fluid and electrolyte needs can be easily satisfied. The caloric needs, however, are not readily met. It is customary to provide 5% dextrose in parenteral solutions. Although this concentration provides only a fraction of the optimal number of calories (20% of total kilocalories needed by infants younger than 1 year of age), it is sufficient to prevent ketosis. In less mature neonates, higher infusion rates of 5% dextrose generally suffice to maintain blood glucose concentrations between 50 to 90 mg/dL (Roy and Sinclair, 1975; Winters, 1982).
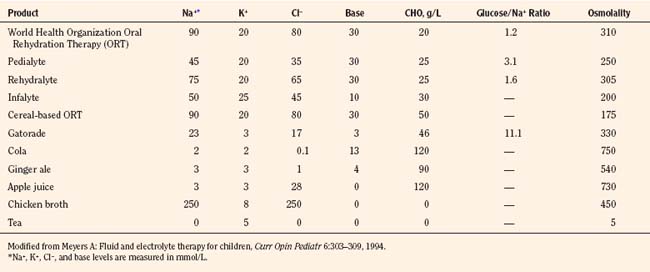
Provided that infants and children are less than 10% dehydrated and have minimal electrolyte abnormalities, a good level of consciousness, adequate bowel sounds, and absence of signs of hypovolemia, oral rehydration may be used to replace deficits and maintain fluid volume. Commercially available preparations, such as Pedialyte RS (Ross) with a Na+ content of 45 mmol/L may be used. In children with diarrhea in developing countries, the World Health Organization (WHO) has recommended the use of an inexpensive and effective oral rehydration solution consisting of 90 mmol/L Na+ and 111 mmol/L of glucose (total osmolarity, 311 mOsmol/L). However, glucose-based solutions with a lower osmolality may further optimize fluid and glucose-sodium coupled absorption in the small intestine (Hahn et al., 2001).
Perioperative parenteral guidelines of fluids and electrolytes
The optimal perioperative fluid volume and composition requirements in infants and children have not been adequately investigated. The formulas provided by Berry in Table 5-10 are widely used to determine the hourly rates of intraoperative fluid volume administration, which consists of four major components (1986):
TABLE 5-10 Guidelines for Fluids for Newborn and Children during the Perioperative Period*
| Age (yr) | Hydrating Solution During First Hour (mL/kg) | Hydrating Solution During Following Hours |
| Neonates | Maintenance fluid: 4 mL/kg /hr 5% to 10% dextrose in 0.75 normal saline plus 20 mEq sodium bicarbonate/L Trauma: 6 to 10 mL/kg/ hr for intra-abdominal or 4 to 7 mL/kg/hr for intrathoracic surgery replaced with Ringer’s lactate |
|
| <3 | 25 | Maintenance fluid: 4 mL/kg /hr 5% Dextrose in normal saline |
| 3 to 4 | 20 | Maintenance and trauma: basic hourly fluid 4 mL/kg 5% Dextrose in normal saline + If mild trauma 2 mL/kg = 6 mL/kg/hr |
| >4 | 15 | + If moderate trauma 4 mL/kg = 8 mL/kg/hr + If maximal trauma 6 mL/kg = 10 mL/kg/hr |
* Plus blood replacement with blood or 3:1 volume replacement with crystalloid. Replace blood loss in excess of 20 mL/kg with equal volume of packed red blood cells.
Modified from Berry FA: Practical aspects of fluid and electrolyte therapy. In Berry FA, editor: Anesthetic management of difficult and routine pediatric patients, New York, 1986, Churchill Livingstone.
A key goal of perioperative fluid management is to maintain an adequate intravascular volume without the development of hyponatremia. Perioperative patients are at risk for developing hyponatremia because of multiple factors, including prehydration with hypotonic fluid, and nausea, pain, and stress associated with surgery that may result in nonhypovolemic stimulation of ADH release during and after surgery (that is, the inappropriate secretion of ADH) (Burrows et al., 1983; Arieff, 1998). The limited ability of such individuals to excrete a large water load may be influenced by any preexisting edema-forming disorder, obstructive uropathy, or the use of thiazide diuretics or other drugs such as narcotics and antiemetics. However, hypotonic fluid infusion is the most important cause of acute hyponatremia developing in the intraoperative period. Acute hyponatremia results in increased water content in neurons (brain edema) without a change in solute content. This may cause subclinical symptoms such as headache, nausea, vomiting, or muscle weakness in any age group. Younger children are more susceptible to more severe hyponatremic encephalopathy because of their larger brain-to-skull ratio (Moritz and Ayus, 2002). Unless there is a free water deficit, isotonic fluid infusion is recommended during the perioperative period. The need for potassium, calcium, chloride, and bicarbonate (or lactate or citrate, which may be converted to bicarbonate in individuals without hepatic failure) is more controversial. Such components are contained in lactated Ringer’s solution, which is nearly isonatremic (Na+ = 130 mEq/L) and isotonic but also contains K+ (4 mEq/L), Ca2+ (0.9 mmol/L), Cl− (109 mEq/L), and lactate (27.7 mmol/L).
The amount of dextrose commonly used is 5% (equals 5000 mg/dL or 278 mmol/L). Although this is more than 50 times more concentrated than normal plasma glucose concentration (90 to 100 mg/dL or ≈︀5 mmol/L), the energy delivery based on the volume of fluid given to an infant weighing 10 kg amounts to 50 kcal for the first hour of surgery. Such energy supply is particularly important in preventing hypoglycemia in premature and full-term neonates, who have greater energy requirements than older children, but it may lead to hyperglycemia in 0.5% to 2% of pediatric patients. This disorder may be less common in children receiving regional anesthesia, which reduces the hyperglycemic effects of surgery. Although such transient hyperglycemia is purported to have various potential deleterious consequences, these have not been well substantiated. A review suggests that a solution of lactated Ringer’s solution with 1% dextrose is sufficient to prevent both hypoglycemia and hyperglycemia in most children, excluding premature and full-term neonates (Berleur et al., 2003). This practice, however, is not yet widely used.
Perioperative Fluid Management of Premature and Full-Term Neonates
Guidelines for the intraoperative fluid and electrolyte management of premature and full-term neonates are largely based on available knowledge of renal physiology rather than on data obtained from clinical investigations. The physiology of the healthy neonate is influenced by the short tubular length and is characterized by immature reabsorption mechanisms, an activated renin-angiotensin-aldosterone system, and low circulating ADH concentrations (Avner et al., 1990; El-Dahr and Chevalier, 1990). Thus, healthy preterm neonates weighing less than 1300 g, or of fewer than 32 weeks’ gestation, have FENa+ rates that range from 8.2% to 2.1% between 28 and 32 weeks’ gestation, with further gradual decrease to less than 1% at term; such rates may increase to 15% with stress (Arant, 1978; Delgado et al., 2003). The high FENa+ in preterm infants is ascribed to decreased Na+ reabsorption in the proximal tubule, together with hyporesponsiveness of the distal tubule to aldosterone (Sulyok et al., 1979). When combined with a negative Na+ balance that results from inadequate Na+ supplementation as well as decreased sensitivity of the collecting duct to ADH, up to one third of such infants develop significant hyponatremia (Na+ < 130 mEq/L), often manifesting with neurologic disturbances during the first 6 weeks of life (Roy and Sinclair, 1975).
Such considerations support the avoidance of boluses of hypotonic fluids while keeping in mind the lower age- and size-appropriate circulatory pressures that may serve as the goal of fluid management. In the absence of the expected physiologic fluid loss, which may range from 5% to 15% of body weight during the first 3 days of postnatal life, fluid volume during this time period may be limited to 60 mL/kg per day, whereas blood pressure support may be sustained with small infusions (5 mL/kg) of 5% albumin or other blood products as needed. Beyond 3 days of life, maintenance fluid volume is gradually increased to 150 mL/kg per day. Deficits beyond the expected physiologic losses and ongoing losses and allowance for surgical trauma may be replaced by a similar fluid composition, but the volume replacement may be more gradual or less rapid than outlined for older infants and children (Table 5-10). Na+ bicarbonate and calcium may be supplemented, while K+ should be limited. Also, a higher glucose concentration is generally desirable in premature infants. A recommended fluid composition is 0.75 normal saline with 20 mEq sodium bicarbonate/L (total Na+ = 135 mmol/L) in 5% to 10% dextrose, as well as 20 mEq/L KCl if plasma K+ falls below 3.5 mEq/L. Close attention to change in body weight and urine output and serial measurements of plasma electrolytes are essential in guiding the perioperative fluid management of the sick premature and full-term neonate.
Fluid Management of Children Undergoing Renal Transplantation
The key goal of intraoperative management is to expand the circulatory volume and to maintain systemic blood pressure between the 90th and 95th percentiles for age, gender, and height percentile, so as to allow for adequate perfusion of the renal allograft (Update on the 1987 Task Force Report on High Blood Pressure in Children and Adolescents, 1996). An adult kidney may sequester up to 250 mL of blood, and in infants nearly 50% of the cardiac output may be directed toward perfusion of the allograft. To ensure adequate perfusion of the allograft, the anesthesiologist actually needs to maximize the circulatory volume of the recipient, mainly with crystalloid or packed cytomegalovirus-safe, leukocyte-poor red blood cells if hemoglobin is below 9 g/dL, while closely monitoring the central venous pressure (CVP) and systemic MABP during vessel anastomosis. Near the completion of the vascular anastomoses, 20% mannitol (0.5 to 1.0 g/kg) and intravenous furosemide, 1 mg/kg, may be given before the cross-clamps are released. Before cross-clamp release, CVP should be maintained at 8 to 12 cm H2O, and the systolic blood pressure and MABP should be kept above 120 mm and 70 mm Hg, respectively. If the MABP is inadequate to achieve good renal perfusion of the adult kidneys, a constant dopamine infusion of up to 5 mcg/kg per minute may be started. Intraoperative blood gases may be monitored frequently, because clamping of the aorta and accumulation of lactic acid can result in metabolic acidosis and vasoconstriction. The critical goal is to obtain immediate allograft function; hypotension after cross-clamp release in an infant with inadequate circulatory volume and an underperfused allograft is a potential catastrophe.
Disorders of sodium metabolism
Among the many kidney functions, sodium homeostasis via multiple or redundant systems is paramount (Greger, 2000). About 75% of the filtered Na+ is reabsorbed in the proximal tubule by the luminal Na+/H+ exchanger and by the basolateral Na+, K+-ATPase. Such reabsorption is increased by the action of angiotensin II, which preferentially constricts the efferent arteriole, thereby increasing filtration fraction and limiting fluid reentry into the peritubular capillaries. Dopamine has an opposing effect in this tubule segment, causing natriuresis. About 20% of NaCl reabsorption occurs in the ascending loop of Henle via the electroneutral Na+/K+/2Cl− transporter (NKCC2), causing the formation of dilute urine. Vasopressin and loop diuretics inhibit such reabsorption. In the distal tubule, Na+ is reabsorbed by a thiazide-sensitive Na+/Cl− cotransporter. In the connecting tubule and in the cortical collecting duct, Na+ is reabsorbed by the sodium-specific amiloride-sensitive ENaC. The ENaC is activated by aldosterone. In the medullary collecting duct, Na+ reabsorption is under the influence of ANP.
Much experimental evidence suggests that regulation of ECF volume and maintenance of systemic blood pressure prevail over Na+ homeostasis; plasma Na+ concentration and plasma osmolality are secondary regulators (Bricker, 1982; Rees et al., 1984; Gennari, 1998a; Kumar and Berl, 1998; Scheinman et al., 1999). Thus, virtually all of the conditions associated with hyponatremia are primarily disorders of ADH excess with an impaired ability to excrete free water. Disturbances in serum Na+ concentration may be associated with hypervolemia, normovolemia, or hypovolemia.
Hyponatremia (Plasma NA+ <135 mmol/L)
In infants and children, hyponatremia occurs much more often than hypernatremia. Although premature and full-term infants are capable of producing hypotonic urine, large, hypotonic fluid loads cannot be excreted, especially during the first 6 weeks of postnatal life. This is most evident during the first week of life, when only 10% to 50%, rather than 80%, of an intravenous challenge of 5% dextrose in water is excreted within 4 hours. The major factor limiting the response to a fluid challenge, especially in preterm infants during the first 5 weeks of postnatal life, is the physiologically low GFR and low urinary flow rate (Svenningsen and Aronson, 1974; Leake et al., 1976). Moreover, high urinary Na+ excretion and negative Na+ balance may contribute to the hyponatremia found in about one third of low–birth-weight premature infants (Engelke et al., 1978). This Na+ wasting has been attributed to deficient proximal and distal tubular reabsorption of Na+ in such infants (Sulyok et al., 1979).
A positive water balance, rather than Na+ wasting, has also been implicated in the hyponatremia of healthy premature infants (Rees et al., 1984; Sulyok et al., 1985). Low serum albumin concentrations and reduced plasma oncotic pressure may also bring about fluid retention and “late hyponatremia” in preterm infants (Menon et al., 1986). Thus, independent of the specific pathologic process, preterm infants are at high risk of developing hyponatremia. Therefore, electrolytes should be monitored frequently during the first 4 to 6 weeks of life, especially in infants of fewer than 34 weeks’ gestation. Other causes of hyponatremia in neonates are shown in Table 5-11. In older infants and children, hyponatremia may occur with dehydration, edema-forming states, and syndrome of inappropriate secretion of antidiuretic hormone (SIADH). Such conditions may be differentiated clinically at the bedside. In addition, the simple laboratory studies described in the section on dehydration may reveal urinary hypotonicity, suggesting water intoxication or the dilutional hyponatremia associated with renal failure.
| Neonates | Infants and Children |
| Drugs | |
| Prolonged use of diuretics in mother or infant | Diuretics (thiazides, osmotic diuretics) |
| Oxytocin for labor | Arginine vasopressin |
| Dopamine >5 mcg/kg/min | Carbamazepine |
| Prostaglandin infusion | Vincristine |
| Excessive administration of electrolyte- free solutions | Theophylline Cyclophosphamide Morphine Estrogen Barbiturates Nonsteroidal antiinflammatory agents Mannitol Hypotonic 1.5% glycine irrigant Ecstasy Selective serotonin reuptake inhibitors All conditions listed for neonates |
| Endocrine Disorders | |
| Pseudohypoaldosteronism | Hyperglycemia |
| Adrenogenital syndrome | Myxedema |
| Adrenal insufficiency problems | Glucocorticoid deficiency |
| Hypothyroidism | Decreased atrial natriuretic peptide |
| SIADH caused by asphyxia | Diabetes/ketonuria All conditions listed for neonates |
| Renal Disorders | |
| Dysplasia | Nephrotic syndrome |
| Multicystic kidneys | Acute or chronic renal failure |
| Obstructive uropathy | Medullary cystic kidneys |
| Polycystic kidney disease | Nephronophthisis |
| Renal tubular acidosis | Chronic pyelonephritis |
| Acute or chronic renal failure | Drug-induced tubulointerstitial nephritis Hypokalemic nephropathy Metabolic alkalosis Bicarbonaturia Postobstructive diuresis All conditions listed for neonates |
| Gastrointestinal Disorders | |
| Dilute formulas | Pancreatitis Cirrhosis Vomiting Diarrhea Ileus Bowel edema Protein-losing enteropathy Colonoscopy |
| Central Nervous System Disorders | |
| SIADH | |
| Cerebral salt wasting | |
| Reset osmostat | |
| Miscellaneous | |
| Negative Na+ balance caused by high FENa+ in infants ≤34 weeks gestation | Congestive heart failure |
| Hypoalbuminemia and decreased oncotic pressure | “Third-space” from burns, peritonitis, or severe muscle injury |
| Osmotic diuresis caused by hyperalimentation and low TmG | Water intoxication (psychogenic polydipsia, dilute formulas) |
| Ketonuria | Physical and emotional stress |
| Congestive heart failure | Cystic fibrosis |
| Hydrops fetalis | Pain |
| Congenital nephrotic syndrome | Postoperative |
| Surgery | Porphyria |
| Infection | Rickettsial disease |
| Pulmonary disorders | Fresh-water drowning Pseudohyponatremia in patients with hypoproteinemia, hyperglycemia, or hyperlipidemia Prolonged exercise |
FENa+, Excreted fraction of filtered sodium; SIADH, syndrome of inappropriate antidiuretic hormone; TmG, tubular maximum for glucose reabsorption.
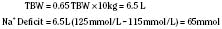
In hyponatremic patients who require parenteral fluids, the decision to correct the plasma Na+ level may be based both on clinical symptoms and signs and on the rapidity with which the disorder developed. Children are especially prone to neurologic symptoms (Laureno and Karp, 1997; Lauriat and Berl, 1997, Albanese et al., 2001). In clinical practice, the most important prophylactic measure for preventing hyponatremia is to avoid the infusion of hypotonic fluids. Common symptoms and signs of hyponatremia include headache, fatigue, nausea, and vomiting; seizures and respiratory arrest are more severe and sometimes delayed manifestations. Guidelines for replacing such sodium deficits may be based on the following formula:

With chronic hyponatremia (over 48 hours in duration), adaptive increases in neuronal osmolytes (glutamine, taurine, phosphocreatinine, myoinositol) diminish cellular uptake of water, thereby preventing brain edema (Gullans and Verbalis, 1993). Thus, in contrast to acute hyponatremia, in which brain edema combined with noncardiogenic pulmonary edema and hypoxia can disrupt neuronal function, such events are uncommon with chronic hyponatremia. Edema-forming disorders such as nephrosis, liver failure, or congestive heart failure are commonly associated with chronic hyponatremia in children. Although physiologic mechanisms stimulate both sodium and fluid retention aimed at preventing hypovolemia, hypovolemic stimuli for ADH release result in free-fluid retention and hyponatremia. Treatment includes the possible correction of the primary disorder, the elimination of diuretics and other offending agents, and limitation of electrolyte-free water intake. Because most individuals with chronic hyponatremia are asymptomatic, and because slow recovery of brain osmolytes coupled with iatrogenic correction of chronic hyponatremia can result in fatal or serious pontine and extrapontine myelinolysis, the rate of correction of serum sodium should be slow (about 0.3 mEq/L per hour) (Ayus et al., 1987; Adrogue and Madias, 2000a).
Syndrome of Inappropriate Secretion of Antidiuretic Hormone
The main causes of SIADH in infants and children are shown in Box 5-3. Hyponatremia attributable to SIADH is uncommon in premature and full-term infants younger than 4 to 6 weeks old because of factors that limit the urinary concentrating ability to values below 600 mOsm/kg. These factors include a low dietary-solute intake, low circulating levels of ADH, and tubular hyporesponsiveness to endogenous ADH (Svenningsen and Aronson, 1974; Godard et al., 1979). Because of these circumstances, it is indeed difficult to establish the diagnosis of SIADH in such infants. In children with bacterial meningitis, ADH may be directly released through leaky, inflamed vessels, with secondary alterations in the blood-brain barrier. Despite the hyponatremia, mean plasma ADH levels are relatively high rather than suppressed in such children (3.3 U/mL versus 1 U/mL), and SIADH develops in about 50% of them (Kaplan and Feigin, 1978).
Box 5-3 Disorders Associated with Syndrome of Inappropriate Secretion of Antidiuretic Hormone
The initial treatment of children with SIADH who have few or no symptoms may consist of restricting fluid intake to between one half and two thirds of the maintenance rate, or 800 to 1000 mL/m2/day. For severely symptomatic children, 3% saline may be given at a rate of 2.5 mmol/kg per hour, or 5 mL/kg per hour to maintain serum Na+ concentrations at or above 125 mmol/L. In patients with urinary osmolality greater than 500 mOsm/kg, an alternative method for faster correction of severe hyponatremia is to use loop diuretics to inhibit reabsorption of free water while replacing measured urinary Na+ losses. In young children, such treatment must be monitored especially closely to prevent volume contraction, hypokalemia, or acid-base imbalance. Furosemide at a dose of 1 mg/kg may be given intravenously one or two times daily. Other therapies used to manage adults with SIADH, such as osmotically active agents, dimethyl chlortetracycline, and lithium carbonate, are generally not used in children with this condition. V1a and V2 receptor blockers are newer agents that may soon become available and may be more effective in managing this disorder (Palm et al., 2001).
Hypernatremia (Plasma NA+ >145 mmol/L)
The causes of hypernatremia in infants and children are listed in Box 5-4. Hypernatremia commonly results from excessive water loss and inadequate water intake and occurs most often in individuals who are unable to communicate or satisfy their own thirst by accessing water. Thus, infants and debilitated individuals of any age are particularly susceptible to this disorder. A primary lack of thirst sensation is a rare cause of this disorder in children. The condition has been caused by improper mixing of formulas and is also increasingly reported with inadequate breastfeeding (Manganaro et al., 2001; Oddie et al., 2001). It is also increasingly recognized as a complication in hospitalized individuals who are very ill and have edema in association with renal failure, heart failure, hypotension, or liver failure, resulting in impaired sodium excretion and sodium overload (Kahn, 1999; Adrogue and Madias, 2000b). Administration of isotonic saline to maintain systemic blood pressure, together with associated hyperglycemia, may promote hypernatremia in these settings. Also, the deliberate use of hypertonic saline for the treatment of brain edema has occasionally resulted in severe hypernatremia (Peterson et al., 2000).
Box 5-4 Causes of Hypernatremia
Hypernatremia caused by pure water loss
Hypernatremia caused by water loss in excess of sodium loss
Premature infants and full-term neonates are also prone to hypernatremia because, in addition to an inability to excrete a water load, they are unable to excrete a large solute load (Aperia et al., 1975a, 1975b, 1977). The renal response to an Na+ load improves gradually, so that by the end of the first year of life, Na+ excretion reaches maximal levels of 16 mmol/hr per 1.73 m2 (Aperia et al., 1975b). The limited ability to excrete an Na+ load appears to result from a reduced GFR and tubular inability to significantly increase the FENa+ because of the effect of aldosterone in increasing distal tubular Na+ reabsorption.
Signs and symptoms associated with hypernatremia in infants include muscle weakness, hyperpnea, apnea, bradycardia, restlessness, a high-pitched cry, lethargy, insomnia or coma, and muscular hypertonicity (Finberg and Harrison, 1955). Older children may exhibit thirst, lethargy, confusion, muscle irritability, rhabdomyolysis, respiratory arrest, seizures, or coma. Tachycardia and hypotension are symptoms of hypovolemia, which is an ominous sign suggestive of extreme dehydration. Because of hypertonicity, fluid shift from the intracellular compartment may result in brain shrinkage, subarachnoid hemorrhage, and permanent brain injury when chronic adaptive solute gain fails to maintain cell volume. Even with such correction, the ensuing neuronal hyperosmolality may predispose a patient to cerebral edema and serious neurologic consequences when rehydration with hypotonic fluid is used aggressively.
Hypernatremic Dehydration
This disorder is relatively common in premature infants of fewer than 27 weeks’ gestation (Baumgart, 1982; Baumgart et al., 1982). Its typical presentation, however, is in infants younger than 12 months of age, with diarrhea being the usual predisposing cause. Such infants have inadequate access to free water, increased insensible water loss, proportionally greater water loss than Na+ loss from the gastrointestinal tract, and at times, a positive solute balance from the improper use of electrolyte solutions used to manage the diarrhea (Paneth, 1980). Patients with hypertonic dehydration often do not have dehydration of the interstitial fluid compartment and thus may not manifest the poor skin turgor, dryness of mucous membranes, and postural changes in pulse and blood pressure that are often associated with isotonic or hypotonic dehydration. Muscular hypertonicity may result in nuchal rigidity. Other potential complications include brain hemorrhage and edema after rehydration because of fluid shifting into the brain. Because of impaired insulin secretion, initial serum glucose concentrations often exceed 130 mg/dL in 50% and 200 mg/dL in 25% of children with hypernatremia. Hence, the amount of dextrose administered to such individuals may be limited, or insulin may be given to prevent further hyperglycemia, osmotic diuresis, and hypernatremia. Hypocalcemia also occurs in 10% to 20% of patients with hypertonic dehydration. The management of this disorder is outlined in Box 5-2.
Disorders of potassium metabolism
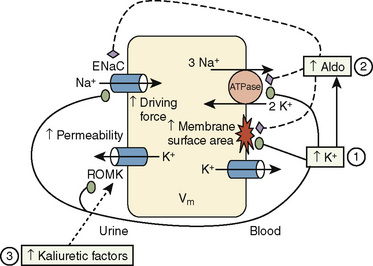
Potassium (K+) is the principal cation in the ICF, ranging in concentration from 140 to 160 mmol/L; the normal K+ concentration in ECF varies between 3.5 and 5.5 mmol/L (same as 3.5 and 5.5 mEq/L). The low proportion of ECF K+ to ICF K+ is necessary to maintain transmembrane electrical potential, which is essential for proper functioning of muscle and neural tissue (Suki, 1976).
Potassium Homeostasis
Total body K+ content correlates with body weight and height and depends on muscle mass (Pierson et al., 1974; Patrick, 1977). In a healthy 20-year-old adult, total body K+ approximates 58 mmol/kg, a value that decreases progressively with age as muscle mass decreases and body fat increases. In children, the total body K+ is 38 mmol/kg or less (Pierson et al., 1974). More than 90% of body K+ is intracellular, and most of that is in muscle tissue. Of the extracellular K+, only 1.4% is contained within the ECF, whereas the remaining 8.6% is contained in the bone matrix.
The daily need for K+ is about 2 mmol/100 kcal of expended energy. The daily intake from a standard Western diet is estimated to be 0.75 to 1.5 mmol/kg of body weight. Typically, approximately 90% of the K+ ingested each day is eliminated in the urine. Less than 15% is eliminated in the stool, while a negligible amount is lost through the skin. The amount of K+ eliminated in stool increases, however, with a significant degree of renal failure, reaching 34% of dietary intake at a GFR of less than 5 mL/min per 1.73 m2 (Hayes et al., 1967).
The renal tubular mechanisms involved in K+ homeostasis have been extensively reviewed (Halperin and Kamel, 1998). Nearly 85% of the filtered K+ is reabsorbed in the proximal tubule and the ascending thick limb of the loop of Henle. The amount of K+ in the final urine depends on the amount of intake and on the tubular secretion of K+.
Two key hormones lower ECF K+ acutely through redistribution in various tissues. Insulin causes Na+ to enter and H+ to exit cells through the electroneutral Na+/H+ exchanger, and epinephrine (and β2-adrenergic agonists) activates the Na+, K+-ATPase, which exports three Na+ ions for each two K+ ions that enter the cell. Although epinephrine possesses both α- and β-adrenergic properties, it first causes a hyperkalemic response (during the first 1 to 3 minutes) and then a sustained decrease in plasma K+ concentration through trapping of K+ in cells by maintenance of an intracellular net negative charge that is essential in determining the electronegative resting membrane potential. By contrast, α-adrenergic agonists raise plasma K+ concentration by modifying muscle K+ uptake (Rosa et al., 1980).
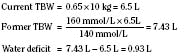
Chronic K+ homeostasis is largely regulated by secretion of K+ by principal cells that predominate in the renal cortical collecting duct and are located in smaller numbers in the connecting tubule. The main mechanisms of K+ secretion are depicted in Figure 5-5. Secretion is aided by the following factors:
Understanding such mechanisms provides physiologic explanations for plasma K+ alterations and for therapeutic rationale. An example is the individual with hypovolemia and hyperkalemia. The kidneys guard against extracellular volume contraction by raising angiotensin II levels. The latter increases bicarbonate reabsorption in the proximal and distal tubules such that the cortical collecting duct lumen becomes less electronegative and favors NaCl retention but reduced K+ secretion despite elevated aldosterone levels. In this clinical setting, low urinary flow rate also contributes to hyperkalemia. This is in contrast to individuals with euvolemia or hypervolemia, in whom a high plasma K+ concentration inhibits proximal tubular bicarbonate reabsorption while it directly stimulates aldosterone release, thereby promoting K+ secretion (along with Cl− and HCO3−) in the cortical collecting duct. In this setting Na+ is reabsorbed through the important effect of aldosterone in activating the specific ENaC at the apical membrane of principal cells (Halperin and Kamel, 1998). When ENaC is blocked by trimethoprim, amiloride, or triamterene, kaliuresis is inhibited.
Hypokalemia (Plasma K+ <3.5 mmol/L or <3.5 mEq/L)
Although hypokalemia usually implies total body K+ depletion, it can also be caused by transcellular shifts of K+ without extrarenal losses. Several classifications of hypokalemia have been devised according to whether the condition is acute or chronic, with or without K+ shift, renal or extrarenal. One classification is shown in Box 5-5. Because the etiology of renal K+ wasting is extensive, it may be facilitated by further subclassification on the basis of systemic blood pressure (Box 5-6).
Box 5-5 Causes of Hypokalemia
Box 5-6 Renal Wasting of Potassium in Relation to Systemic Blood Pressure
Hypokalemia without Potassium Depletion
Pseudohypokalemia can result from increased uptake of K+ when large numbers of leukemic cells (white blood cell count of 100,000 to 250,000 mm3) are allowed to stand at room temperature (Adams et al., 1981). This confounding effect is eliminated by rapid separation of plasma or by cold storage of blood samples at 4°C.
Hypokalemia caused by intracellular shift of K+ is particularly common in metabolic or respiratory alkalosis, and approximates a 0.6-mmol/L fall for every 0.1-unit increase in blood pH (Kim and Brown, 1968; Adrogue and Madias, 1981). Endogenous or exogenous β-adrenergic agonists such as albuterol, dopamine, dobutamine, and theophylline mediate transcellular shifts of K+. Barium poisoning or toluene intoxication resulting from the inhalation of paint or glue vapors can produce hypokalemia by trapping K+ within the cells (Roza and Berman, 1971; Streicher et al., 1981). Insulin administration activates the Na+, K+-ATPase, resulting in active K+ uptake and hypokalemia. This is commonly encountered during the treatment of diabetic ketoacidosis.
Hypokalemic periodic paralysis is a rare autosomal dominant disorder characterized by recurrent episodes of flaccid paralysis of the trunk and limbs that lasts 6 to 24 hours. Paralysis may be accompanied by cardiac arrhythmias, which may be provoked by high carbohydrate intake, exertion, and a high Na+ diet (Griggs et al., 1970). This condition is more common in the Asian population and is characterized by low urinary K+ excretion, low transtubular potassium gradient (TTKG), and no acid-base disturbances (Lin et al., 2001). Dietary restriction of salt and carbohydrates together with spironolactone may help prevent such attacks. Intravenous K+ infusion should be avoided, because rebound hyperkalemia can occur. Potassium-sparing diuretics and the ingestion of foods rich in K+ are of limited benefit in treating or in preventing the disorder. Notably, affected individuals are susceptible to malignant hyperthermia with administration of general anesthesia.
Potassium Depletion
Nutritional Causes
A deficient diet alone is seldom the only cause of symptomatic hypokalemia, because K+ is ubiquitous in foodstuffs. In adults, a reduction in K+ intake to less than 10 mmol/day for 7 to 10 days does cause a relative total body K+ deficit of 250 to 300 mmol, or a decrement of 7% to 8% (Wormersley and Darragh, 1955). Occasionally K+ depletion occurs in hospitalized patients maintained on K+-free intravenous fluids. In these instances, the kidney responds by appropriately decreasing K+ excretion, although it cannot produce K+-free urine.
Extrarenal Causes
Diarrhea, vomiting, and abuse of laxatives result in hypokalemia via a complex process. In addition to K+ loss (through vomit and stool), these conditions cause intravascular volume contraction, secondary hyperaldosteronism, and enhanced urinary excretion of K+. In children, diarrhea is often accompanied by hyperchloremic metabolic acidosis, whereas laxative abuse is associated with normal acid-base status or mild metabolic alkalosis (Welfare et al., 2002).
Copious perspiration from intense physical exertion in a hot environment causes K+ depletion (Knochel et al., 1972). This condition is characterized by normal plasma K+ concentration with total body K+ depletion and a high rate of urinary K+ excretion. Loss of K+ via sweat and secondary hyperaldosteronism explains the depletion state and the urinary loss; the sustained normal plasma K+ level, however, is not adequately explained. The human colon responds to aldosterone in a similar fashion, resulting in an increase in the renal collecting duct transepithelial potential difference followed by an increase in Na+, K+-ATPase activity (Thompson and Edmonds, 1971). Glucocorticoids are kaliuretic, and evidence suggests that their effect is independent of any action on the mineralocorticoid receptor (Bia et al., 1982). Furthermore, glucocorticoids appear to cause an increase in K+ and a decrease in Na+ stool concentration that can be associated with increased Na+, K+-ATPase activity (Charney et al., 1975).
Renal Causes
Renal wastage of K+ occurs by several different but interrelated mechanisms. First, an increased Na+/K+ exchange may occur in the distal tubule in conditions associated with increased circulating mineralocorticoid or glucocorticoid concentrations, resulting in circulatory volume expansion and suppression of plasma renin and aldosterone levels. Hypokalemia often occurs in Conn’s syndrome (Ganguly and Donohue, 1983). It also occurs in 30% of patients with adrenal hyperplasia (Cushing’s syndrome) (Prunty et al., 1963). The ingestion of certain foods and the use of glucocorticoids or other drugs that possess mineralocorticoid activity can also result in hypokalemia. Licorice, for example, contains large amounts of glycyrrhizic acid, which impairs adrenal 11β-hydroxysteroid dehydrogenase action. This impairs the degradation of endogenous glucocorticoids, resulting in a mineralocorticoid-like response (Brem, 2001).
Second, increased delivery of Na+ to the distal tubule, which occurs in various proximal tubulopathic conditions (including proximal renal tubular acidosis and Fanconi’s syndrome) may enhance K+ secretion. Similarly, thiazides and loop diuretics increase the delivery of Na+ to the distal nephron, thus promoting K+ excretion (Kassirer and Harrington, 1977). This effect by diuretics is augmented by concomitant Cl− depletion and by contraction alkalosis (Seldin and Rector, 1972; Kassirer and Harrington, 1977).
Third, large concentrations of nonabsorbable anions in the distal tubules, such as penicillins, increase the electronegativity of tubular fluid and induce kaliuresis and hydrogen ion secretion (Lipner et al., 1975). Carbenicillin is particularly notorious for causing hypokalemia, because it is secreted actively in the proximal tubule, and high concentrations of the anion are delivered to the distal nephron (Stapleton et al., 1976).
Fourth, kaliuresis may occur secondary to direct damage to the renal epithelium. Conditions such as pyelonephritis and other interstitial nephritides may be associated with hypokalemia. Similarly, antibiotics such as amphotericin B, polymyxin, and outdated tetracycline can lead to K+ depletion through their direct toxic effects on the renal tubules (Chesney, 1976). Aminoglycosides result in magnesium and K+ wasting, probably because of a change in the permeability of the renal epithelium to these cations (Humes et al., 1982). Experimentally, hypokalemia tends to occur within the first 7 days of aminoglycoside administration and often occurs in the absence of overt acute tubular necrosis and renal failure. This tubular defect and the risk of hypokalemia usually resolve within 1 to 2 weeks after discontinuation of the drug.
Fifth, several genetic disorders are known to cause K+ depletion. Box 5-6 characterizes such disorders of hypokalemia based on the presence or absence of hypertension. Hypertensive disorders may be associated with high peripheral renin activity (renovascular disorders comprise the majority of such causes in children) or low renin states that are then associated with either increased plasma mineralocorticoid or glucocorticoid levels, or with more direct activation of the principal cell amiloride- sensitive ENaC in the cortical collecting duct. The result may be salt retention, chronic volume expansion, renin and aldosterone suppression (hence “pseudoaldosteronism”), and hypertension as exemplified in Liddle’s syndrome. In Liddle’s syndrome, treatment that consists of blocking the mineralocorticoid receptor with spironolactone, or blocking the aldosterone receptor with amiloride, is less effective than the combination of triamterene and a low-salt diet.
Manifestations of Potassium Depletion
Hypokalemia results in multiple biochemical and neurophysiologic disturbances (Box 5-7) (Weiner and Wingo, 1997). Chronic hypokalemia and moderate degrees of acute K+ depletion (5% to 10% of total body K+) are generally well tolerated. More profound deficits result in clinical manifestations that are independent of the underlying cause of hypokalemia.
Box 5-7 Pathophysiologic Consequences of Hypokalemia
Gill JR, Santos F, Chan JCM: Disorders of potassium metabolism. In Chan JCM, Gill JR, editors: Kidney electrolyte disorders, New York, 1990, Churchill Livingstone.
Biochemical consequences of hypokalemia include impairment in insulin release and insulin end-organ sensitivity, thereby increasing the risk of hyperglycemia or precipitation of frank diabetes mellitus (Rowe et al., 1980). Metabolic alkalosis results from direct stimulation of proximal tubular bicarbonate reabsorption and ammonia genesis by increased proton secretion via H+, K+-ATPase located in the collecting duct and by decreasing citrate excretion. Inadequate ADH response and increased synthesis of angiotensin II in the central nervous system may cause polyuria. Hypokalemia may raise plasma ammonia levels in patients with reduced hepatic function. Also, chronic renal K+ wasting may predispose to formation of renal cysts and interstitial fibrosis (Torres et al., 1990).
Many of the symptoms of acute hypokalemia relate to disturbed neuromuscular functions. Skeletal muscle weakness caused by cell hyperpolarization is the earliest manifestation of K+ depletion. Plasma K+ concentrations below 3.0 mEq/L lower the resting cell membrane potential and thereby increase the voltage needed to reach the threshold and initiate an action potential (Fig. 5-6). The symptoms include restless legs syndrome, fatigue, muscle cramps, paralysis, and rhabdomyolysis. Frank muscle necrosis may occur with serum K+ concentrations below 2.0 mEq/L (Knochel, 1982). Cardiac manifestations of hypokalemia include abnormalities in rhythm as a result of slowed repolarization (Helfant, 1986). The presence of electrocardiographic changes helps to exclude spurious hypokalemia and may aid the decision to manage the hypokalemia urgently (see Fig. 5-6). Abnormalities include depression of the ST segment, lower T-wave voltage, and appearance of U waves. Patients receiving cardiac glycosides are especially at risk of developing such abnormalities. Hypokalemia also impairs the cardiovascular responses to norepinephrine and angiotensin II.
K+ depletion may lead to several functional and structural abnormalities in the kidneys, including reduced RBF and GFR, renal hypertrophy, tubuloepithelial dilation, vacuolization, and sclerosis (Relman and Schwartz, 1956). Functionally, patients develop urinary acidification and concentration defects and polyuria.
Treatment of Hypokalemia
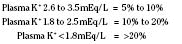
The concurrence of hypokalemia and metabolic acidosis suggests an even greater K+ depletion. In such children the correction of the acidosis should follow, rather than precede, the correction of hypokalemia. Guidelines for potassium supplementation in dietary or medication forms are available for adults but not for children (Cohn et al., 2000). Such supplements should be given with close monitoring of blood levels, particularly when combined with potassium-sparing diuretics such as amiloride and spironolactone. Providing details of managing children with specific disorders associated with chronic hypokalemia is beyond the scope of this chapter. Supplemental K+ at a dosage of 3 to 5 mEq/kg per day (plus maintenance amounts) may be given orally as the chloride salt, because most disorders are associated with chloride depletion. Several liquid and salt preparations are available. Microencapsulated salt preparations are associated with a lower rate of gastrointestinal bleeding and hemorrhage. In patients with combined K+ and phosphate depletion, the phosphate salt is recommended. Magnesium correction may help improve the hypokalemia, especially in refractory states such as appears in Gitelman’s syndrome (Whang et al., 1992). High K+-containing foods are useful in individuals whose conditions are managed with laxatives and diuretics
Hyperkalemia (Plasma K+ >5.5 mEq/L in Infants and Children, or >6 mmol/L in Neonates)
Conditions causing hyperkalemia are listed in Box 5-8. Hyperkalemia may result from a surprisingly small increase in total body K+ or may result rapidly from transcellular shift. Normally, the kidneys provide the crucial defense against slight elevations in serum K+ level. Thus, with a few exceptions, hyperkalemia commonly occurs in conditions characterized by decreased urine flow rates or marked reduction in GFR. In the absence of renal insufficiency, drugs are responsible for most cases of hyperkalemia. Several agents may cause hyperkalemia by increasing the K+ load, by facilitating transcellular K+ efflux, or by impairing renal excretion of K+ (Table 5-12) (Perazella, 2000).
Box 5-8 Causes of Hyperkalemia
Transcellular shifts
TABLE 5-12 Medications That Can Cause Hyperkalemia and Their Mechanisms of Action
| Medication | Mechanism |
| Increased Potassium Input | |
| Potassium supplements and salt substitutes | Potassium ingestion |
| Nutritional and herbal supplements | Potassium ingestion |
| Stored packed red blood cells | Potassium infusion |
| Penicillin G potassium | Potassium ingestion |
| Transcellular Potassium Shifts | |
| β-Blockers | Decrease β-driven potassium uptake |
| Intravenous amino acids (lysine, arginine, and ε-aminocaproic acid) | Release of potassium from cells |
| Succinylcholine | Depolarize cell membranes |
| Digoxin intoxication | Decrease Na+, K+-ATPase activity |
| Impaired Renal Excretion | |
| Potassium-sparing diuretics | |
| Spironolactone | Aldosterone antagonism |
| Triamterene | Block Na+ channels in principal cells |
| Amiloride | Block Na+ channels in principal cells |
| Nonsteroidal antiinflammatory drugs | Decrease aldosterone synthesis Decrease renal blood flow and glomerular filtration rate |
| ACE Inhibitors and Angiotensin II Receptor Blockers | |
| Decrease aldosterone synthesis | |
| Decrease renal blood flow and glomerular filtration rate | |
| Trimethoprim and pentamidine | Block Na+ channels in principal cells |
| Cyclosporine and tacrolimus | Decrease aldosterone synthesis Decrease Na+, K+-ATPase activity Decrease K+ channel activity |
| Heparin | Decrease aldosterone synthesis |
ACE, Angiotensin-converting enzyme.
Modified from Perazella MA: Drug-induced hyperkalemia: old culprits and new offenders, Am J Med 109:307–314, 2000.
Transcellular Shift
Among the conditions associated with altered K+ distribution across cell membranes is poorly controlled insulin-dependent diabetes mellitus. The mechanism is twofold: hyperglycemia causes hypertonicity with resultant extrusion of K+ from cells, whereas insulin deficiency does not promote K+ entry into the cells (Ammon et al., 1978). These effects are independent of aldosterone response and level of renal function.
Cellular damage from rhabdomyolysis, burns, tissue necrosis, or fulminant rejection of a grafted organ may release large quantities of K+ into the extracellular space. In patients with normal renal function, most of the excess K+ is easily excreted. In those with large tumor lysis after induction of chemotherapy or those with renal impairment, however, hyperkalemia may occur (Araseneau et al., 1973).
During metabolic acidosis, part of the H+ load is buffered within cells in exchange for K+. It has been noted that for every 0.1-U decrease in blood pH, serum K+ changes by 0.6 mEq/L. Changes in plasma HCO3− concentration may influence K+ concentration independent of changes in pH. Clinically, serum K+ can be decreased with bicarbonate administration in the absence of metabolic acidosis (Fraley and Adler, 1977).
Pseudohyperkalemia
Ischemic blood drawing is a very common cause of pseudohyperkalemia, especially in infants and young children who undergo blood sampling by lancing and squeezing the finger or heel, or because of hemolysis from prolonged application of tourniquets. Several conditions cause false elevations in plasma K+ concentrations, including thrombocytosis, leukocytosis, hemolysis, and sampling of ischemic blood (Chumbley, 1970; Ingram and Seki, 1962). In general, immediate determination of K+ in plasma instead of in serum minimizes the release of K+ from the cellular components and avoids the development of pseudohyperkalemia.
High Potassium Intake
An oral intake of as little as 50 mmol of K+ (<2% of normal body K+ content) by an adult can cause a transient increase in plasma K+ of 0.5 to 1.0 mmol/L. From 70% to 90% of this load is sequestered intracellularly within 15 to 30 minutes and ultimately excreted in the urine. Thus, when renal function is normal, large amounts of K+ may be ingested without adverse sequelae. However, the intravenous administration of K+ at a rate higher than 0.5 mmol/kg per hour may result in life-threatening hyperkalemia. In patients with renal insufficiency, hyperkalemia may occur because of increased excretory burden associated with large doses of potassium penicillin (106 units contain 1.7 mEq K+), juices with high K+ content, overuse of salt substitutes (1 g contains 10 to 13 mEq of K+), and the administration of banked stored blood (1 L contains 15 to 20 mEq of K+) (Bostic and Duvernoy, 1972).
Decreased Potassium Excretory Capacity
Regardless of the underlying cause, impaired renal function predisposes a patient to K+ retention and hyperkalemia. However, hyperkalemia is uncommon even in advanced renal failure unless endogenous or exogenous loads are excessive. Nonoliguric individuals with impaired GFR can excrete ordinary dietary intakes of K+ until GFR decreases to as low as 5 mL/min per 1.73 m2 (Gonick et al., 1971). An increase in K+ secretion per nephron, as well as increased colonic secretion, helps to prevent hyperkalemia in severe renal failure (van Ypersele de Strihou, 1977). If hyperkalemia occurs with a GFR above 10% of normal, other causes should be sought, such as worsening metabolic acidosis, increased catabolism, cell injury, hemorrhage, or use of potassium-sparing diuretics.
The most common clinical setting in which hyperkalemia occurs is acute oliguric renal failure of any etiology. In addition to the decreased excretory capacity, an increased K+ burden is imposed by an increased catabolic rate. The daily increase in K+ concentration averages 0.3 to 0.5 mmol/L in oliguric acute renal failure under optimal conditions of nutrition, whereas the increase exceeds 0.7 mmol/L in patients with trauma, a high rate of catabolism, or both (Schrier, 1979).
Hyporeninemic hypoaldosteronism accounts for more than 50% of adults or older children with unexplained hyperkalemia accompanying adequate, albeit decreased, GFR (Schambelan et al., 1980). Most such patients have a component of chronic interstitial renal disease, and more than half have diabetes mellitus.
Obstructive uropathy may be associated with a defect in K+ excretion associated with a mild hyperchloremic acidosis, decreased fractional excretion of K+, and mild hyperkalemia (Battle et al., 1981) because of end-organ resistance to the action of aldosterone or because of hypoaldosteronism by itself.
Many drugs or drug combinations can cause hyperkalemia, particularly when KCl supplements are coadministered (Table 5-12) (Perazella, 2000). For example, a potassium-sparing diuretic and an angiotensin-converting enzyme inhibitor can result in life-threatening hyperkalemia-induced arrhythmia, especially in diabetic patients with renal insufficiency or other high-risk groups. The mechanisms may involve one or more of the following:
Adrenal destruction brought on by hemorrhage, tumor, infection, autoimmune polyglandular syndrome, or adrenoleukodystrophy can cause an Addison-like presentation with fatigue, muscle weakness, hypotension, and hyponatremia. Congenital disorders associated with reduced steroidogenesis may have a similar clinical presentation (Ten et al., 2001; Bonny and Rossier, 2002). Hereditary disorders that exhibit similar sodium wasting and hyperkalemia, but that show increased, rather than low, plasma renin and aldosterone levels, include the autosomal dominant (self-limited) and autosomal recessive (permanent) forms of pseudohypoaldosteronism I. In these disorders, a defective mineralocorticoid receptor is responsible for hyponatremia, hyperkalemia, and metabolic acidosis (Ten et al., 2001; Bonny and Rossier, 2002). In contrast, pseudohypoaldosteronism Type II (Gordon’s syndrome) is a sporadic or autosomal dominant condition associated with hypertension, suppressed plasma renin activity, normal plasma aldosterone concentration, and mild hyperchloremic acidosis that respond well to thiazide diuretics (Milford, 1999).
Manifestations of Hyperkalemia
The clinical manifestations of hyperkalemia relate to interference with the electrophysiologic activities of muscle. Under the influence of hyperkalemia, the ratio of intracellular to extracellular K+ is decreased, resulting in delayed depolarization, hastened repolarization, and slow conduction velocity (Knochel, 1982). The most important effect involves the heart. Diagnostic electrocardiographic alterations include tenting or symmetric peaking of the T wave in the precordial leads and depression of the ST wave (Fig. 5-7). In severe hyperkalemia, there is widening of the QRS complex, lengthening of the PR interval, first-degree or second-degree heart block, disappearance of the P wave, and, finally, atrial standstill. Ventricular fibrillation or asystole follows the development of a sinusoid wave. Although the magnitudes of hyperkalemia and of cardiotoxicity correlate well, arrhythmias may develop with even mild hyperkalemia when other metabolic abnormalities such as hyponatremia, acidosis, or calcium disorders coexist.
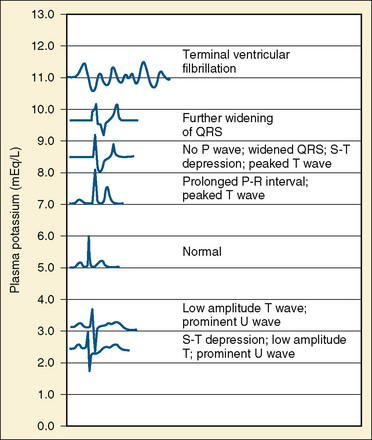
Clinical Evaluation of Dyskalemia
The initial step involves a clinical assessment of circulatory volume (Halperin and Kamel, 1998; Rodriguez-Soriano et al., 1990). Assuming that Na+ and fluid conservation mechanisms are intact, the next step is to determine whether the excretion of K+ is appropriate relative to expected values in healthy children (Rodriguez-Soriano et al., 1990). If K+ excretion is abnormal, urinary flow rate and K+ excretion rate are measured separately. The flow rate in the terminal portion of the cortical collecting duct (CCD) is proportional to the osmolar particles in urine, which consist primarily of urea derived from protein metabolism, with Na+ and Cl− contributing to a lesser extent. This is derived as follows:

If the flow rate in the CCD is adequate, then the ability of principal cells to secrete K+ depends largely on the appropriate activity and secretion of K+ by ENaC and ROMK channels (see Fig. 5-5). This is assessed by measurement of urinary chloride excretion and by estimation of the transtubular [K+] gradient, or, TTKG:
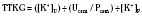
This equation provides an estimate of the K+ concentration in the CCD relative to plasma K+ concentration after correcting for further water reabsorption past the CCD, in the medullary collecting duct, under the influence of ADH. TTKG values under 4.9 in infants or under 4.1 in children indicate a reduced ability to secrete K+ as a result of hypoaldosteronism or pseudohypoaldosteronism, and the situation requires further investigation of renal and adrenal disorders (Rodriguez-Soriano, 1990). Such evaluation may consist of venous blood gas measurements; electrolyte measurement of gastric fluids, urinary nitrogen, plasma renin, aldosterone, and cortisol and corticosterone concentrations; and, possibly, identification of mutated genes.
Treatment of Hyperkalemia
The strategy of managing hyperkalemia depends on the plasma K+ concentration, renal function, and cardiac manifestations (Box 5-9). Mild to moderate hyperkalemia without major electrocardiographic changes responds to a simultaneous decrease in K+ intake and increase in Na+ intake. In certain instances, loop diuretics may be used to increase K+ excretion.
Box 5-9 Treatment of Hyperkalemia
The fastest means of reversing cardiotoxicity is to antagonize the membrane effects of high plasma K+ concentration. Calcium decreases the threshold potential of excitable tissue, thus restoring the normal differences between threshold and transmembrane potentials (see Fig. 5-6).
If the clinical setting permits administration of a high fluid volume rate, a solution consisting of glucose and insulin added to 0.9 N NaCl is the most effective means for lowering plasma K+ concentration (10% glucose solution, with insulin added at a ratio of 1 unit per 4 or 5 g of glucose). In children with metabolic acidosis, K+ can be driven intracellularly by intravenous NaHCO3 given at 1 to 2 mEq/kg per dose. Both treatment measures decrease plasma K+ levels within minutes and are effective regardless of acid-base or insulin status. Hyperventilation (with resultant hypocapnia and respiratory alkalosis) abruptly increases the urinary excretion of K+. Its effect, however, is not sustained beyond 24 hours (Gennari and Segal, 2002).