Chapter 2 Reference ranges and normal values
A number of factors affect haematological values in apparently healthy individuals. As described in Chapter 1, these include the technique and timing of blood collection, transport and storage of specimens, differences in the subject’s posture when the sample is taken, prior physical activity and whether the subject is confined to bed. Variation in the analytic methods used may also affect the measurements. These can all be standardized.
Haematological values for the normal and abnormal will overlap and a value within the recognized normal range may be definitely pathological in a particular subject. For these reasons the concept of ‘normal values’ and ‘normal ranges’ has been replaced by reference values and the reference range, which is defined by reference limits and obtained from measurements on the reference population for a particular test. The reference range is also termed the reference interval.1,2 Ideally, each laboratory should establish a databank of reference values that take account of the variables mentioned earlier and the test method, so that an individual’s result can be expressed and interpreted relative to a comparable apparently normal population, insofar as normal can be defined.
Recently new haematological parameters such as immature forms of cells, red cell fragments and detection of functional iron deficiency or malarial infection have become available. Currently these parameters are only used for research and, as internal quality control or external quality assessments are not yet available for some of these tests, their use in clinical decision making is not recommended.3
Reference ranges
A reference range for a specified population can be established from measurements on a relatively small number of subjects (discussed later) if they are assumed to be representative of the population as a whole.2 The conditions for obtaining samples from the individuals and the analytic procedures must be standardized, whereas data should be analysed separately for different variables such as individuals who are in bed or ambulant, smokers or non-smokers and so on. One approach is that specimens are collected at about the same time of day, preferably in the morning before breakfast; the last meal should have been eaten not later than 9 p.m. on the previous evening and at that time alcohol should have been restricted to one bottle of beer or an equivalent amount of other alcoholic drink.4 An alternative approach is that, unless a test is usually done on a fasting patient, specimens are collected throughout the day on subjects who are not fasting or resting, as this will produce a reference range that is more relevant to results from patients. It is sometimes appropriate that the reference population is defined as having normal results for specific laboratory tests. For example, if determining a reference range for blood count components it may be necessary, in some populations, to exclude iron deficiency and β thalassaemia heterozygosity.
Statistical procedures
In biological measurements, it is usually assumed that the data will fit a specified type of pattern, either symmetric (Gaussian) or asymmetric with a skewed distribution (non-Gaussian). With a Gaussian distribution, the arithmetic mean (×) can be obtained by dividing the sum of all measurements by the number of observations. The mode is the value that occurs most frequently and the median (m) is the point at which there are an equal number of observations above and below it. In a true Gaussian distribution they should all be the same. The standard deviation (SD) can be calculated as described on p. 625.
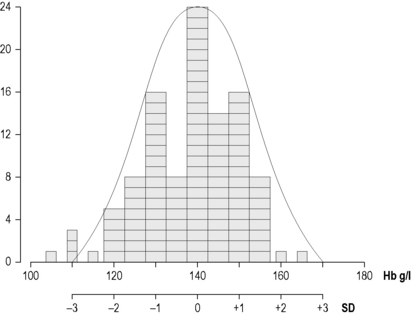
If the data fit a Gaussian distribution, when plotted as a frequency histogram the pattern shown in Figure 2.1z is obtained. Taking the mode and the calculated SD as reference points, a Gaussian curve is superimposed on the histogram. From this curve, practical reference limits can be determined even if the original histogram included outlying results from some subjects not belonging to the normal population. Limits representing the 95% reference range are calculated from arithmetic mean ± 2SD (or more accurately ± 1.96SD).
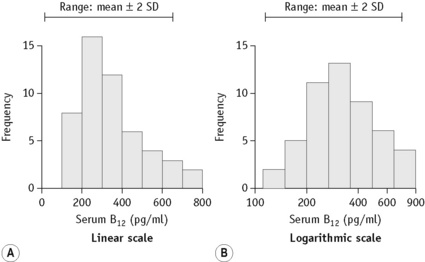
When there is a log normal (skew) distribution of measurements, the range to –2SD may even extend to zero (Fig. 2.2A). To avoid this anomaly, the data should be plotted on semilogarithmic graph paper to obtain a normal distribution histogram (Fig. 2.2B). To calculate the mean and SD the data should be converted to their logarithms. The log-mean value is obtained by adding the logs of all the measurements and dividing by the number of observations. The log SD is calculated by the formula on p. 625 and the results are then converted to their antilogs to express the data in the arithmetic scale. This process is now generally carried out using an appropriate statistical computer program.
Confidence Limits
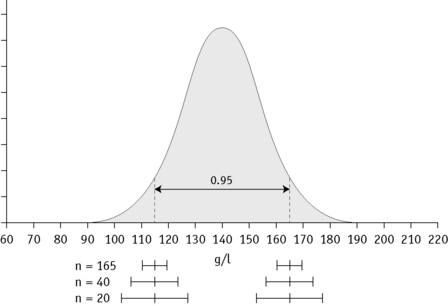
In any of the methods of analysis, a reasonably reliable estimate can be obtained with 40 values, although a larger number (≥120) is preferable (Fig. 2.3).5 When a large set of reference values is unattainable and precise estimation is impossible, a smaller number of values may still serve as a useful clinical guide. Confidence limits define the reliability (e.g. 95% or 99%) of the established reference values when assessing the significance of a test result, especially when it is on the borderline between normal and abnormal. Calculation of confidence limits is described on p. 625. Another important measurement is the coefficient of variation (CV) of the test because a wide CV is likely to influence its clinical utility (see p. 625).
Normal reference values
The data given in Tables 2.1, 2.2 and 2.3 provide general guidance to normal reference values that are applicable to most healthy adults and children, respectively, in industrialized countries. The data have been derived from personal observations as well as various published reports.6–11 However, slightly different ranges may be found in individual laboratories where different analysers and methods are used. The reference interval, which comprises a range of ± 2SD from the mean, indicates the limits that should cover 95% of normal subjects; 99% of normal subjects will be included in a range of ± 3SD. Age and sex differences have been taken into account for some values. Even so, the wide ranges that are shown for some tests reflect the influence of various factors, as described below. Narrower ranges would be expected under standardized conditions. Because modern analysers provide a high level of technical precision, even small differences in successive measurements may be significant. It is thus important to establish and understand the limits of physiological variation for various tests. The blood count data and other test results can then provide sensitive indications of minor abnormalities that may be important in clinical interpretation and health screening.
Table 2.1 Haematological values for normal adults (predominantly from Europe and North America) expressed as a mean ± 2SD (95% range)
| Red blood cell count | |
| Men | 5.0 ± 0.5 × 10¹²/l |
| Women | 4.3 ± 0.5 × 10¹²/l |
| Haemoglobin concentrationa | |
| Men | 150 ± 20 g/l |
| Women | 135 ± 15 g/l |
| Packed cell volume (PCV) or Haematocrit (Hct) | |
| Men | 0.45 ± 0.05 (l/l) |
| Women | 0.41 ± 0.05 (l/l) |
| Mean cell volume (MCV) | |
| Men and women | 92 ± 9 fl |
| Mean cell haemoglobin (MCH) | |
| Men and women | 29.5 ± 2.5 pg |
| Mean cell haemoglobin concentration (MCHC) | |
| Men and women | 330 ± 15 g/l |
| Red cell distribution width (RDW) | |
| As coefficient of variation (CV) | 12.8 ± 1.2% |
| As standard deviation (SD) | 42.5 ± 3.5 fl |
| Red cell diameter (mean values) | |
| Dry films | 6.7–7.7 μm |
| Red cell density | 1092–1100 g/l |
| Reticulocyte count | 50–100 × 109/l (0.5–2.5%) |
| White blood cell count | 4.0–10.0 × 10⁹/l |
| Differential white cell count | |
| Neutrophils | 2.0–7.0 × 10⁹/l (40–80%) |
| Lymphocytes | 1.0–3.0 × 10⁹/l (20–40%) |
| Monocytes | 0.2–1.0 × 10⁹/l (2–10%) |
| Eosinophils | 0.02–0.5 × 10⁹/l (1–6%) |
| Basophils | 0.02–0.1 × 10⁹/l (<1–2%) |
| Lymphocyte subsets (approximations from ranges in published data) | |
| CD3 | 0.6–2.5 × 10⁹/l (60–85%) |
| CD4 | 0.4–1.5 × 10⁹/l (30–50%) |
| CD8 | 0.2–1.1 × 10⁹/l (10–35%) |
| CD4/CD8 ratio | 0.7–3.5 |
| Platelet count | 280 ± 130 × 109/l |
| Bleeding timeb | |
| Ivy’s method | 2–7 min |
| Template method | 2.5–9.5 min |
| Thrombin time | 15–19 s |
| Plasma fibrinogen concentration | 1.8–3.6 g/l |
| Euglobulin clot lysis time | 90–240 min |
| Plasminogen concentrationd | 0.75–1.60 u/ml |
| Antithrombin concentrationd | 0.75–1.25 u/ml |
| Protein C concentrationd | |
| Functional | 0.70–1.40 u/ml |
| Antigen | 0.61–1.32 u/ml |
| Protein S concentrationd | |
| Total antigen | 0.78–1.37 u/ml |
| Free antigen | 0.68–1.52 u/ml |
| Pre-menopausal womenc | 0.55–1.55 u/ml |
| Function | 0.60–1.35 u/ml |
| Pre-menopausal women | 0.55–1.35 u/ml |
| Heparin cofactor II concentrationd | 0.55–1.45 u/ml |
| Median red cell fragility (MCF) (g/l NaCl) | |
| Fresh blood | 4.0–4.45 g/l NaCl |
| After 24 h at 37°C | 4.65–5.9 g/l NaCl |
| Cold agglutinin titre (4°C) | <64 |
| Blood volume (normalized to ‘ideal weight’) | |
| Red cell volume | |
| Men | 30 ± 5 ml/kg |
| Women | 25 ± 5 ml/kg |
| Plasma volume | 45 ± 5 ml/kg |
| Total blood volume | 70 ± 10 ml/kg |
| Red cell lifespan | 120 ± 30 days |
| Serum iron | |
| Men and women | 10–30 μmol/l (0.6–1.7 mg/l) |
| Total iron-binding capacity | 47–70 μmol/l (2.5–4.0 mg/l) |
| Transferrin saturation | 16–50% |
| Serum ferritin concentration | |
| Men | 15–300 μg/l (median 100 μg/l) |
| Women | 15–200 μg/l (median 40 μg/l) |
| Serum vitamin B12 concentration | 180–640 ng/l |
| Serum folate concentration | 3–20 μg/l (6.8–45 nmol/l) |
| Red cell folate concentration | 160–640 μg/l (0.36–1.45 μmol/l) |
| Plasma haemoglobin concentration | 10–40 mg/l |
| Serum haptoglobin concentration | |
| Radial immunodiffusion | 0.8–2.7 g/l |
| Haemoglobin binding capacity | 0.3–2.0 g/l |
| HbA2 | 2.2–3.5% |
| HbF | <1.0% |
| Methaemoglobin | <2.0% |
| Sedimentation rate (mm in 1 h at 20 ± 3°C) | |
| Men | |
| 17–50 years | ≤10 |
| 51–60 years | ≤12 |
| 61–70 years | ≤14 |
| >70 years | ≤30 |
| Women | |
| 17–50 years | ≤12 |
| 51–60 years | ≤19 |
| 61–70 years | ≤20 |
| >70 years | ≤35 |
| Plasma viscosity | |
| 25°C | 1.50–1.72 mPa/s |
| 37°C | 1.16–1.33 mPa/s |
a Haemoglobin concentration may sometimes be reported as g/dl.
b Bleeding time is no longer recommended for routine assessment of haemostasis but may be useful in suspected collagen disorders.
c From Dykes AC, Walker ID, McMahon AD et al 2001 Protein S antigen levels in 3788 healthy volunteers. British Journal of Haematology 113:636–641.
d These ranges are for general guidance only as each laboratory should establish its own normal range.
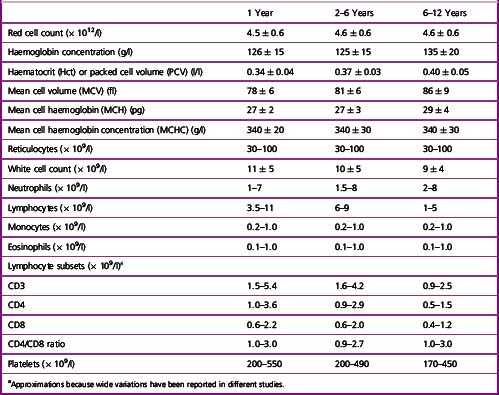
Table 2.2 Haematological values for normal infants (amalgamation of data derived from various sources; expressed as mean ± 2SD or 95% range)a
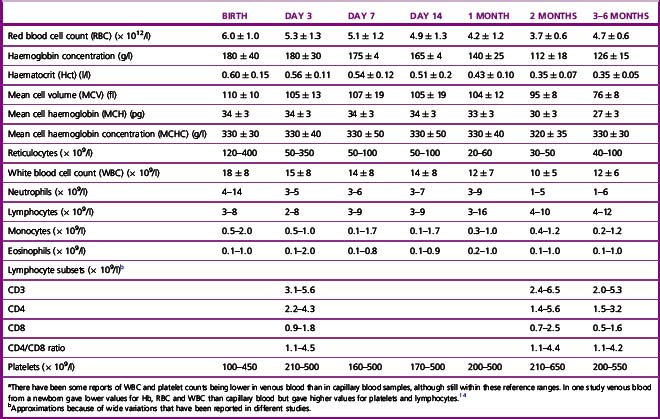
Table 2.3 Haematological values for normal children (amalgamation of data derived from various sources; expressed as mean ± 2SD or 95% range)
It should be noted that in Table 2.1 the differential white cell count is shown as percentages and in absolute numbers. Automated analysers provide absolute counts for each type of leucocyte and because proportional (percentage) counting is less likely to indicate correctly their absolute increase or decrease, the International Council for Standardization in Haematology has recommended that the differential leucocyte count should always be given as the absolute number of each cell type per unit volume of blood.12 The neutrophil:lymphocyte ratio obtained from a differential leucocyte count should be regarded only as an approximation.
Reference ranges for pre-term infants vary with gestational age. In infants in the USA between 22 and 41 weeks’ gestation, the packed cell volume increased from 40 to 52 l/l, the haemoglobin from 140 to 170 g/l and the platelet count from 200 to 250 × 109/l, whereas the MCV and MCH gradually decreased from 121 to 105 fl and 40.5 to 35.5 pg, respectively.13
Physiological variations in the blood count
Red Cell Components
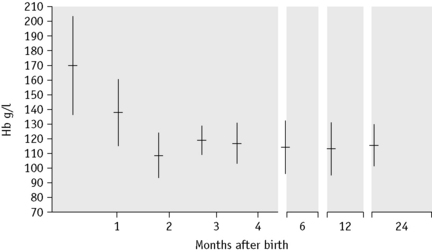
There is considerable variation in the red blood cell count (RBC) and haemoglobin concentration (Hb) at different periods of life and there are also transient fluctuations, the significance of which is often difficult to assess. At birth the Hb is higher than at any period subsequently (Table 2.2). The RBC is high immediately after birth,6 and values for Hb >200 g/l, RBC higher than 6.0 × 10¹²/l and a haematocrit (Hct) over 0.65 are encountered frequently when cord clamping is delayed and blood from the placenta and umbilical artery re-enter the infant’s circulation. After the immediate postnatal period, the Hb falls fairly steeply to a minimum by about the 2nd month (Fig. 2.4). The RBC and Hct also fall, although less steeply, and the cells may become microcytic with the development of iron deficiency. The changes in the mean cell haemoglobin (MCH), mean cell haemoglobin concentration and mean cell volume (MCV) from the neonate through infancy to early childhood are shown in Tables 2.2 and 2.3.
The Hb and RBC increase gradually through childhood to reach almost adult levels by puberty.7 However, in a health survey of apparently normal men and women in Britain, mean Hb values of 145 g/l for men and 128 g/l for women have been reported;9 the lower normal limits for Hb (i.e. 2SD below the mean) are usually taken as 130 and 120 g/l, respectively, but in some apparently normal men and women lower limits of 120 and 110 g/l, respectively, have been noted. Statistically, at least 1% of a normal population have levels more than 3SD below the mean, but in some studies there have been considerably larger numbers.9 It is possible that some have nutritional deficiencies, especially iron deficiency, without clinical effects. The levels in women tend to be significantly lower than those of men.9 Apart from a hormonal influence on haemopoiesis, iron deficiency is likely to be a factor influencing the difference; the extent to which menstrual blood loss is a significant factor is not clear because a loss of up to 100 ml of blood with each period may lead to iron depletion without causing anaemia.15 There may be ethnic differences in Hb. A major 6-year survey in the USA has shown that in socially comparable populations the Hb in Black Americans is 5–10 g/l lower than their White counterparts at all ages and as much as 20 g/l lower in the first 2 years of life.16
Pregnancy
In normal pregnancy, there is an increase in erythropoietic activity.17 However, at the same time, an increase in plasma volume occurs,18 and this results in a progressive decrease in Hb, Hct and RBC (Table 2.4). The level returns to normal about a week after delivery. There is a slight increase in MCV during the 2nd trimester.19 Serum ferritin decreases in early pregnancy and usually remains low throughout pregnancy, even when supplementary iron is given.20
| 1st trimester | 124–135 g/l |
| 2nd trimester | 110–117 g/l |
| 3rd trimester | 106–109 g/la |
| Mean values postpartum | |
| Day 2 | 104 g/l |
| Week 1 | 107 g/l |
| Week 3 | 116 g/l |
| Month 2 | 119 g/l |
a Higher values (120 g/l or higher) may be found when supplementary iron is being given.
The Elderly
In healthy men and women, Hb, RBC, Hct and other red cell indices remain remarkably constant until the 6th decade. Anaemia becomes more common in those older than 70–75 years21,22 and is associated with poor clinical outcomes due to poorer cognitive status, increased frailty and an elevated risk of hospitalization and of complications during hospitalization.23 In the elderly, the difference in Hb between men and women is less than in younger subjects, so that a difference of 20 g/l in younger age groups is reduced to 10 g/l or less in the elderly. There is a concomitant increase in serum iron in women, although serum ferritin levels remain higher in men than in women. Factors which contribute to the lower Hb in the elderly include renal insufficiency, inflammation, testosterone deficiency, diminished erythropoiesis, stem cell proliferative decline and myelodysplasia.24,25 Moderate or severe anaemia should never be attributed to ageing per se until underlying disease has been excluded; however, a significant number of elderly subjects with anaemia have no identifiable clinical or nutritional causes.
Exercise
Optimal athletic performance depends on proper function of many organs, including the blood. Several haematological parameters can affect or be influenced by physical activity including blood cells and coagulation mechanisms.26 For example endurance athletes may develop so-called ‘sports anaemia’, which is thought to be the result of increased plasma volume.27,28 Increasing oxygen delivery by raising the haematocrit is a simple acute method to improve athletic performance. Legal means of raising the haematocrit include altitude training and hypoxic tents. Illegal means include blood doping and the administration of erythropoietin (EPO) (see Chapter 6).29 Endurance athletes may also have decreased levels of serum iron and ferritin, possibly associated with loss of iron in sweat. Conversely, in sprinters who require a short burst of very strenuous muscular activity, there is a transient increase in RBC by 0.5 × 10¹²/l and in Hb by 15 g/l, largely because of reduction in plasma volume and to a lesser extent the re-entry into the circulation of cells previously sequestered in the spleen.30 The effects of exercise must be distinguished from a form of haemolysis known as ‘runner’s anaemia’ or ‘march haemoglobinuria’, which occurs as a result of pounding of the feet on the ground.31
Posture
There is a small but significant alteration in the plasma volume with an increase in haemoglobin and Hct as the posture changes from lying to sitting, especially in women32; conversely, changing from walking to lying down results in a 5–10% decrease in the Hb and Hct. Thus, subjects should rest for 5–10 min before their blood is collected. The difference in position of the arm during venous sampling, whether dependent or held at atrial level, can also affect the Hct.
These aspects highlight the relevance of using a standardized method for blood collection, although this is not necessarily practicable in routine practice. This is discussed in Chapter 1 and the differences between venous and capillary blood are described on p. 5.
Diurnal and Seasonal Variation
Changes in Hb and RBC during the course of the day are usually slight, about 3%, with negligible changes in the MCV and MCH. However, variation of 20% occurs with reticulocytes.8 Studies of diurnal variation of serum erythropoietin have shown conflicting results.33 Pronounced, but variable, diurnal variations are seen in serum iron and ferritin and in patients taking iron-containing supplements.34,35 It has been suggested that minor seasonal variations also occur, but the evidence for this is conflicting.36–38
Altitude
The effect of altitude is to reduce plasma volume, increase the Hb and Hct and raise the number of circulating red cells with a lower MCV.39 The magnitude of the polycythaemia depends on the degree of hypoxaemia. At an altitude of 2000 m (c 6500 ft), Hb is c 8–10 g/l and Hct is 0.025 higher than at sea level; at 3000 m (c 10 000 ft), Hb is c 20 g/l and Hct is 0.060 higher and at 4000 m (c 13 000 ft) Hb is 35 g/l and Hct is 0.110 higher. Corresponding increases occur at intermediate and at higher altitudes.40 These increases appear to be the result of both increased erythropoiesis which is secondary to the hypoxic stimulus and the decrease in plasma volume that occurs at high altitudes.
Leucocyte Count
The effect of age is indicated in Tables 2.1, 2.2 and 2.3; at birth, the total leucocyte count is high; neutrophils predominate, reaching a peak of c 13.0 × 10⁹/l within 6–8 h for neonates of >28 weeks’ gestation and 24 h for those delivered at <28 weeks.13 The count then falls to c 4.0 × 10⁹/l over the next few weeks and then to a level at which the count remains steady. The lymphocytes decrease during the first 3 days of life often to a low level of c 2.0–2.5 × 10⁹/l and then rise up to the 10th day; after this time, they are the predominant cell (up to about 60%) until the 5th to 7th year, when they give way to the neutrophils. From that age onwards, the levels are the same as for adults.7 There are also slight sex differences; the total leucocyte count and the neutrophil count may be slightly higher in girls than in boys,7 and in women than in men.41 After the menopause, the counts fall in women so that they tend to become lower than in men of similar age.41
People differ considerably in their leucocyte counts. Some tend to maintain a relatively constant level over long periods; others have counts that may vary by as much as 100% at different times. In some subjects, there appears to be a rhythm, occurring in cycles of 14–28 days and in women this may be related to the menstrual cycle or to oral contraception.41 There is no clearcut diurnal variation, but minimum counts are found in the morning with the subject at rest and during the course of a day there may be differences of 14% for the total leucocyte count, 10% for neutrophils, 14% for lymphocytes and 20% for eosinophils;8 in some cases this may result in a reversed neutrophil:lymphocyte ratio. Random activity may raise the count slightly; strenuous exercise causes increases of up to 30 × 109/l, partly because of mobilization of marginated neutrophils and changes in cortisol levels.42 Large numbers of lymphocytes and monocytes also enter the bloodstream during strenuous exercise. However, there have also been reports of neutropenia and lymphopenia in athletes undergoing daily training sessions.43,44
Epinephrine (adrenaline) injection causes an increase in the numbers of all major types of leucocytes (and platelets), possibly reflecting the extent of the reservoir of mature blood cells present not only in the bone marrow and spleen but also in other tissues and organs of the body. Emotion may possibly cause an increase in the leucocyte count in a similar way. A transient lymphocytosis with a reversed neutrophil:lymphocyte ratio occurs in adults with physical stress or trauma.45 The effect of ingestion of food is uncertain. Cigarette smoking has an effect on the leucocyte count (see p. 20).
A moderate leucocytosis of up to 15 × 109/l is common during pregnancy, owing to a neutrophilia, with the peak in the 2nd trimester.19 The count returns to non-pregnancy levels a week or so after delivery.46
In individuals of African ancestry there is a tendency for the neutrophil:lymphocyte ratio to be reversed primarily due to a reduction in neutrophil count. This is thought to be due to genetic rather than environmental factors because significantly lower leucocyte counts, especially neutrophil counts, have also been observed in Africans and Afro-Caribbeans living in Britain.47 ‘Benign ethnic neutropenia’ occurs in up to 5% of African Americans and is defined as a neutrophil count <1.5 × 10⁹/l without overt cause or complications.48 A region on chromosome 1, possibly the Duffy Null polymorphism, has recently been associated with the difference in WBC and neutrophil count between African Americans and European Americans.49 Elderly people receiving influenza vaccination show a lower total leucocyte count owing to a decrease in lymphocytes.50
Platelet Count
There is a slight diurnal variation in the platelet count of about 5%;8 this occurs during the course of a day as well as from day-to-day. Within the wide normal reference range, there are some ethnic differences and in healthy West Indians and Africans platelet counts may on average be 10–20% lower than those in Europeans living in the same environment.51 There may be a sex difference; thus, in women, the platelet count has been reported to be about 20% higher than in men.52 A decrease in the platelet count may occur in women at about the time of menstruation. There are no obvious age differences; however, in the 1st year after birth the platelet count tends to be at the higher level of the adult normal reference range. Strenuous exercise causes a 30–40% increase in platelet count;42 the mechanism is similar to that which occurs with leucocytes.
Effects of Smoking
Both active and passive cigarette smoking have a significant effect on many haematological normal reference values.53,54 Some effects may be transient and their severity varies between individuals as well as by the number of cigarettes smoked. Smoking ≥10 cigarettes a day results in slightly higher Hb, Hct and MCV.38,55 This is probably at least in part a consequence of the accumulation of carboxyhaemoglobin in the blood together with a decrease in plasma volume. After a single cigarette, the carboxyhaemoglobin level increases by about 1%,56 and in heavy smokers the carboxyhaemoglobin may constitute c4–5% of the total Hb. Smoking may be associated with polycythaemia.57
The leucocyte count increases, largely as a result of an increase in the neutrophils and neutrophil function may be affected.53,58 Smoking may also cause an increase in CD4-positive lymphocytes and total lymphocyte count.53,58,59
Smokers tend to have higher platelet counts than nonsmokers, but the counts decrease rapidly on cessation of smoking.53 Studies of platelet aggregation and adhesiveness have given equivocal results, but there appears to be a consistent increase in platelet turnover with decreased platelet survival and increased plasma β-thromboglobulin. Elevated fibrinogen concentration (with increased plasma viscosity) and reduced protein S have been reported, but smoking does not seem to have any consistent effects on the fibrinolytic system.53
The influence of smoking on the blood is summarized in Table 2.5.
| Increased | Decreased |
|---|---|
| Haemoglobin concentration (Hb) | Plasma volume |
| Red cell count (RBC) | Protein S |
| Haematocrit (Hct) | |
| Mean cell volume (MCV) | |
| Mean cell haemoglobin (MCH) | |
| White cell count (WBC) | |
| Neutrophil count | |
| Lymphocyte count | |
| T cells (CD4-positive) | |
| Monocyte count | |
| Carboxyhaemoglobin (>2%) | |
| Platelet count (transient) | |
| Mean platelet volume | |
| Fibrinogen concentration | |
| β-thromboglobulin concentration | |
| von Willebrand factor | |
| Red cell mass | |
| Haptoglobin concentration | |
| Plasma viscosity | |
| Whole blood viscosity | |
| Erythrocyte sedimentation rate (ESR) |
a Extent of change from normal reference values varies with individuals and amount smoked; some effects may occur only during and immediately after smoking. Some effects may be transient and their severity varies between individuals as well as with the number of cigarettes smoked.
1 International Committee for Standardization in Haematology. The theory of reference values. Clin Lab Haematol. 1981;3:369-373.
2 International Federation of Clinical Chemistry and International Council for Standardization in Haematology. The theory of reference values Part 6: Presentation of observed values related to reference values. Journal of Clinical Biochemistry. 1987;25:657-662.
3 Briggs C. Quality counts: new parameters in blood cell counting. International Journal of Laboratory Hematology. 2009;31:277-297.
4 International Committee for Standardization in Haematology. Standardization of blood specimen collection procedures for reference values. Clin Lab Haematol. 1982;4:83-86.
5 International Federation of Clinical Chemistry and International Council for Standardization in Haematology. The theory of reference values Part 5: Statistical treatment of collected reference values. Determination of reference limits. J Clin Chem Clin Biochem. 1987;25:645-656.
6 Lilleyman J.S., Hann I.M., Blanchette V.S. Pediatric Hematology, 2nd ed., London: Churchill Livingstone, 1999.
7 Taylor M.R.H., Holland C.V., Spencer R., et al. Haematological reference ranges for school children. Clin Lab Haematol. 1997;19:1-15.
8 Richardson Jones A., Twedt D., Swaim W., et al. Diurnal change of blood count analytes in normal subjects. Am J Clin Pathol. 1996;106:723-727.
9 White A., Nicolaas G., Foster K., et al. Health Survey for England: Office of population census and surveys – Social Survey Division. London: HMSO; 1991.
10 Bellamy G.J., Hinchliffe R.F., Crawshaw K.C. Total and differential leucocyte counts in infants at 2, 5 and 13 months of age. Clin Lab Haematol. 2000;22:81-87.
11 Handin R.I., Lux S.E., Stossel T.P. Blood – Principles and Practice of Hematology, 2nd ed., Philadelphia PA: Lippincott Williams and Wilkins; 2003:2219.
12 International Council for Standardization in Haematology: Expert Panel on Cytometry. Recommendation of the International Council for Standardization in Haematology on reporting differential leucocyte counts. Clin Lab Haematol. 1995;17:113.
13 Christensen R.D., Henry E., Jopling J., et al. The CBC: reference ranges for neonates. Semin Perinatol. 2009;33:3-11.
14 Kayiran S.M., Özbek N., Turan M., et al. Significant differences between capillary and venous complete blood counts in the neonatal period. Clin Lab Haematol. 2003;25:9-16.
15 Masse P.G., Roberge A.G. Long-term effect of low-dose combined steroid contraceptives on body iron status. Contraception. 1992;46:243-252.
16 Houwen B., van Assendelft O.W. Haemoglobinometry: screening and routine practice. In: Rowan R.M., van Assendelft O.W., Preston F.E., editors. Advanced Laboratory Methods in Haematology. London: Arnold; 2002:182-190.
17 McMullin M.F., White R., Lappin T., et al. Haemoglobin during pregnancy: relationship to erythropoietin and haematinic status. Eur J Haematol. 2003;71:44-50.
18 Large R.D., Dynesius R. Blood volume changes during normal pregnancy. Clin Haematol. 1973;2:433-451.
19 Balloch A.J., Cauchi M.N. Reference ranges for haematology parameters in pregnancy derived from patient populations. Clin Lab Haematol. 1993;15:7-14.
20 Howells M.R., Jones S.E., Napier J.A.F., et al. Erythropoiesis in pregnancy. Br J Haematol. 1986;64:595-599.
21 Carmel R. Anemia and aging: an overview of clinical, diagnostic and biological issues. Blood Rev. 2001;15:9-18.
22 Nilsson-Ehle H., Jagenburg R., Landahl S., et al. Blood haemoglobin declines in the elderly: implications for reference intervals from age 70 to 85. Eur J Haematol. 2000;65:297-305.
23 Steensma D.P., Tefferi A. Anemia in the elderly: how should we define it, when does it matter and what can be done? Mayo Clin Proc. 2007;82:958-966.
24 Makipour S., Kanapuru B., Ershler W.B. Unexplained anemia in the elderly. Semin Hematol. 2008;45:250-254.
25 Price E.A. Aging and erythropoiesis: current state of knowledge. Blood Cells Mol Dis. 2008;41:158-165.
26 Mercer K.W., Densmore J.J. Hematologic disorders in the athlete. Clin Sports Med. 2005;24:599-621. ix
27 Smith J.A. Exercise, training and red blood cell turnover. Sports Med. 1995;19:9-31.
28 Green H.J., Sutton J.R., Coates G., et al. Response of red cell and plasma volume to prolonged training in humans. J Appl Physiol. 1991;70:1810-1815.
29 Cooper C.E. The biochemistry of drugs and doping methods used to enhance aerobic sport performance. Essays Biochem. 2008;44:63-83.
30 Allsop P., Peters A.M., Arnot R.N., et al. Intrasplenic blood cell kinetics in man before and after brief maximal exercise. Clin Sci. 1992;83:47-54.
31 Davidson R.J.L. March or exertional haemoglobinuria. Seminars in Haematology. 1964;6:150-161.
32 Felding P., Tryding N., Hyltoft Petersen P., et al. Effects of posture on concentration of blood constituents in healthy adults: practical application of blood specimen collection procedures recommended by the Scandinavian Committee on Reference Values. Scand J Clin Lab Invest. 1980;40:615-621.
33 Gunga H.C., Kirsch K.A., Roecker L., et al. Erythropoietin regulations in humans under different environmental and experimental conditions. Respir Physiol Neurobiol. 2007;158:287-297.
34 Romslo I., Talstad I. Day-to-day variations in serum iron, serum iron binding capacity, serum ferritin and erythrocyte protoporphyrin concentration in anaemic subjects. Eur J Haematol. 1988;40:79.
35 Dale J.C., Burritt M.F., Zinsmeister A.R. Diurnal variation of serum iron, iron-binding capacity, transferrin saturation and ferritin levels. Am J Clin Pathol. 2002;117:802-808.
36 Costongs G.M., Janson P.C.W., Bas B.M., et al. Short-term and long-term intra-individual variations and critical differences of haematological laboratory parameters. J Clin Chem Clin Biochem. 1985;23:69-76.
37 Ross D.W., Ayscue L.H., Watson J., et al. Stability of hematologic parameters in healthy subjects: intraindividual versus interindividual variation. Am J Clin Pathol. 1988;90:262-267.
38 Kristal-Boneh E., Froom P., Harari G., et al. Seasonal differences in blood cell parameters and the association with cigarette smoking. Clin Lab Haematol. 1997;19:177-181.
39 Saunders P.U., Pyne D.B., Gore C.J. Endurance training at altitude. High Alt Med Biol. 2009;10:135-148.
40 Myhre L.D., Dill D.B., Hall F.G., et al. Blood volume changes during three week residence at high altitude. Clin Chem. 1970;16:7-14.
41 England J.M., Bain B.J. Total and differential leucocyte count. Br J Haematol. 1976;33:1-7.
42 Avloniti A.A., Douda H.T., Tokmakidis S.P., et al. Acute effects of soccer training on white blood cell count in elite female players. International Journal of Sports Physiology & Performance. 2007;2:239-249.
43 Watson H.G., Meiklejohn D.J. Leucopenia in professional football players. Br J Haematol. 2001;112:824-827.
44 Bain B.J., Phillips D., Thomson K., et al. Investigation of the effect of marathon running on leucocyte counts of subjects of different ethnic origins: relevance to the aetiology of ethnic neutropenia. Br J Haematol. 2000;108:483-487.
45 Karandikar N.J., Hotchkiss E.C., McKenna R.W. Transient stress lymphocytosis: an immunophenotypic characterization of the most common cause of newly identified adult lymphocytosis in a tertiary hospital. Am J Clin Pathol. 2002;117:819-825.
46 Cruickshank J.M. The effects of parity on the leucocyte count in pregnant and non-pregnant women. Br J Haematol. 1970;18:531-540.
47 Bain B.J., Seed M., Godsland I. Normal values for peripheral blood white cell counts in women of four different ethnic origins. J Clin Pathol. 1984;37:188-193.
48 Hsieh M.M., Everhart J.E., Byrd-Holt D.D., et al. Prevalence of neutropenia in the U.S. population: age, sex, smoking status and ethnic differences. Ann Intern Med. 2007;146:486-492.
49 Reich D., Nalls M.A., Kao W.H., et al. Reduced neutrophil count in people of African descent is due to a regulatory variant in the Duffy antigen receptor for chemokines gene. PLoS Genet. 2009;5:e1000360.
50 Cummins D., Wilson M.E., Foulger K.J., et al. Haematological changes associated with influenza vaccination in people aged over 65: case report and prospective study. Clin Lab Haematol. 1998;20:285-287.
51 Bain B.J., Seed M. Platelet count and platelet size in healthy Africans and West Indians. Clin Lab Haematol. 1986;8:43-48.
52 Stevens R.F., Alexander M.K. A sex difference in the platelet count. Br J Haematol. 1977;37:295-300.
53 Bain B.J. The haematological effects of smoking. Journal of Smoking-related Diseases. 1992;3:99-108.
54 Andrews J.O., Tingen M.S. The effect of smoking, smoking cessation and passive smoke exposure on common laboratory values in clinical settings: a review of the evidence. Crit Care Nurs Clin North Am. 2006;18:63-69. xii
55 Whitehead T.P., Robinson D., Allaway S.L., et al. The effects of cigarette smoking and alcohol consumption on blood haemoglobin, erythrocytes and leucocytes: a dose related study on male subjects. Clin Lab Haematol. 1995;17:131-138.
56 Russell M.A., Wilson C., Cole P.V., et al. Comparison of increases in carboxyhaemoglobin after smoking ‘extramild’ and ‘non mild’ cigarettes. Lancet. 1973;2:687-690.
57 Smith J.R., Landaw S.A. Smoker’s polycythemia. N Engl J Med. 1978;298:6-10.
58 Parry H., Cohen S., Schlarb J. Smoking, alcohol consumption and leukocyte counts. Am J Clin Pathol. 1997;107:64-67.
59 Bain B.J., Rothwell M., Feher M.D., et al. Acute changes in haematological parameters on cessation of smoking. J R Soc Med. 1992;85:80-82.