Chapter 11 Laboratory methods used in the investigation of the haemolytic anaemias
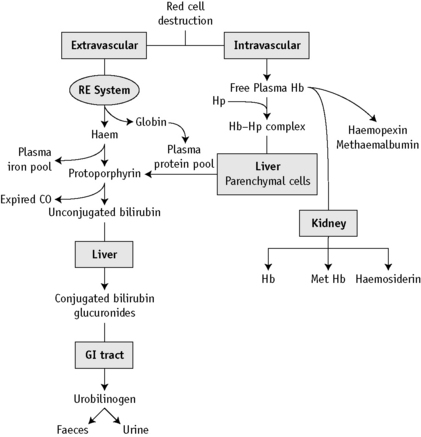
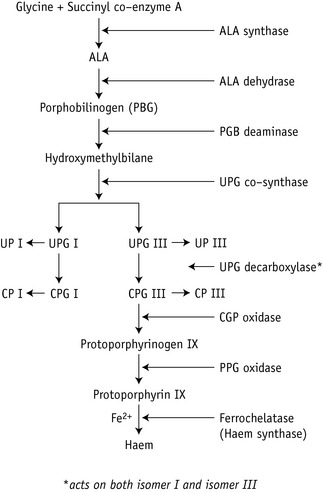
At the end of a normal lifespan, red cells are destroyed within the reticuloendothelial system in the spleen, liver and bone marrow. In some haemolytic anaemias, the haemolysis occurs predominantly in the reticuloendothelial system (extravascular) and the plasma haemoglobin concentration (Hb) is barely increased. In other disorders, a major degree of haemolysis takes place within the bloodstream (intravascular haemolysis), the plasma Hb increases substantially and in some cases, the amount of Hb so liberated may be sufficient to lead to Hb being excreted in the urine (haemoglobinuria). However, there is often a combination of both mechanisms. The two pathways by which Hb derived from effete red cells is metabolized are illustrated in Figure 11.1.
Investigation of haemolytic anaemia
Is There Evidence of Increased Haemolysis?
What is the Precise Diagnosis?
Plasma haemoglobin
Methods for estimation of plasma Hb are based on (1) peroxidase reaction and (2) direct measurement of Hb by spectrometry. In the peroxidase method, the catalytic action of haem-containing proteins brings about the oxidation of tetramethylbenzidine* by hydrogen peroxide to give a green colour, which changes to blue and finally to reddish violet. The intensity of reaction may be compared using a spectrometer with that produced by solutions of known Hb. Hi and Hb are measured together.
A pink tinge to the plasma is detectable by eye when the Hb is higher than 200 mg/l. When the plasma Hb is >50 mg/l, it can be measured as haemiglobincyanide (HiCN) or oxyhaemoglobin by a spectrometer at 540 nm1 (p. 26). Lower concentrations can also be measured reliably provided that the spectrometer plots of concentration/absorbance give a linear slope passing through the origin. This facility is provided by the Low Hb HemoCue (Hemocue Ltd, Dronfield, Derbyshire, UK), which can reliably measure plasma Hb at or higher than 100 mg/l.2
Spectrophotometric Method
Normal Range
The normal range is 10–40 mg/l.
Significance of increased plasma haemoglobin
Hb liberated from the intravascular or extravascular breakdown of red cells interacts with the plasma haptoglobins to form an Hb–haptoglobin complex,4 which, because of its size, does not undergo glomerular filtration, but it is removed from the circulation by and is degraded in, reticuloendothelial cells. Hb in excess of the capacity of the haptoglobins to bind it passes into the glomerular filtrate; it is then partly excreted in the urine in an uncomplexed form, resulting in haemoglobinuria, and partly reabsorbed by the proximal glomerular tubules where it is broken down into haem, iron and globin. The iron is retained in the cells and eventually excreted in the urine (as haemosiderin). The haem and globin are reabsorbed into the plasma.
The haem complexes with albumin forming methaemalbumin and with haemopexin (p. 235); the globin competes with Hb to form a complex with haptoglobin. In effect, the plasma Hb level is further increased in haemolytic anaemias when haemolysis is sufficiently severe for the available haptoglobin to be fully bound. The highest levels are found when haemolysis takes place predominantly in the bloodstream (intravascular haemolysis). Thus, marked haemoglobinaemia, with or without haemoglobinuria, may be found in PNH, paroxysmal cold haemoglobinuria, cold-haemagglutinin syndromes, blackwater fever, march haemoglobinuria and other mechanical haemolytic anaemias (e.g. that after cardiac surgery). In warm-type autoimmune haemolytic anaemias, sickle cell anaemia and severe β thalassaemia, the plasma Hb level may be slightly or moderately increased, but in hereditary spherocytosis, in which haemolysis occurs predominantly in the spleen, the levels are normal or only very slightly increased.
Haem within the proximal tubular epithelium undergoes further degradation to bilirubin with liberation of iron, some of which is retained intracellularly incorporated into ferritin and haemosiderin. When haemolysis is severe, the excess of Hb that occurs in the glomerular filtrate will lead to an accumulation of intracellular haemosiderin in the glomerular tubular cells; when these cells slough, haemosiderin will appear in the urine (p. 236).
Increased levels may occur as a result of violent exercise, as well as occurring in runners and joggers as a result of mechanical trauma caused by continuous impact of the soles of the feet with hard ground.4
Serum haptoglobin
Direct measurement of haptoglobin is also possible by turbidimetry or nephelometry and by radial immunodiffusion.5 The methods described below are cellulose acetate electrophoresis and radial immunodiffusion.
Electrophoresis Method6,7
Reagents
Buffer (pH 7.0, ionic strength 0.05)
Na2HPO4.H2O 7.1 g/l, 2 volumes; NaH2PO4.H2O 6.9 g/l, 1 volume. Store at 4°C.
Method
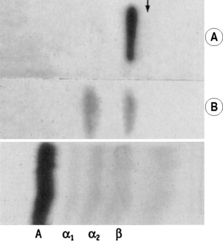
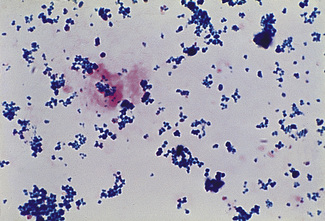
Impregnate cellulose acetate membrane filter strips (12 × 2.5 cm) in buffer solution and blot to remove all obvious surface fluid. Apply 0.75 ml samples of the serum–haemolysate mixtures across the strips as thin transverse lines. As controls, include strips with serum alone and Hb lysate alone. Electrophorese at 0.5 mA/cm width. Good separation patterns about 5–7 cm in length should be obtained in 30 min (see Fig. 11.2).
Interpretation
The patterns of free Hb and Hb–haptoglobin complex migration are shown in Figure 11.2. Hb–haptoglobin complex appears in the α2 globulin position. When there is more Hb than can be bound to the haptoglobin, the free Hb migrates in the β globulin position. The amount of haptoglobin present in the serum is determined semi-quantitatively as between the lowest concentration of Hb, which shows only a free Hb band, and the adjacent strip, which shows a band of Hb–haptoglobin complex. In the total absence of haptoglobin, an Hb band alone will be seen even at 2.5 g/l. In severe intravascular haemolysis with depleted haptoglobin, some of the haem may bind in the β-globulin position to haemopexin (see below) and some to serum albumin to form methaemalbumin.

Radial Immunodiffusion (RID) Method
Reagents
Phosphate buffer, iso-osmotic, pH 7.4:
Method
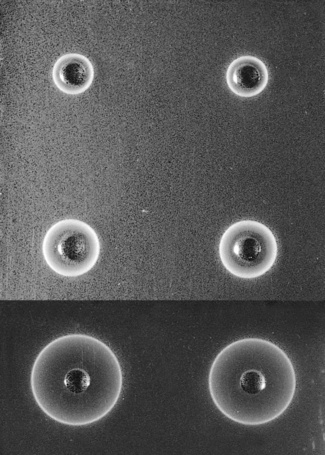
Allow the plate (in its sealed packet) and the sera to equilibrate at room temperature for 15 min. Remove the lid from the plate. Check for moisture; if present, allow to evaporate. Add 5 μl of each serum into one of the wells in the plate. Stand for about 10 min to ensure that the serum is completely absorbed into the gel. Then cover the plate, return it to its container and reseal the packet. Leave on a level surface at room temperature for 18 h. From measurements of the reference sera, construct a reference curve on log-linear graph paper by plotting haptoglobin concentration on the vertical axis (logarithmic scale) and the diameter of the rings on the horizontal scale (linear scale). Measure the diameter of the precipitation ring formed by the test serum and express concentration in g/l (Fig. 11.3).
Normal Ranges
By direct measurement5 results are expressed as haptoglobin concentration; slightly different normal reference values have been reported for the different methods:
Significance
Haptoglobins begin to be depleted when the daily Hb turnover exceeds about twice the normal rate.6 This occurs irrespective of whether the haemolysis is predominantly extravascular or intravascular; but rapid depletion, often with the formation of methaemalbumin, occurs as a result of small degrees of intravascular haemolysis, even when the daily total Hb turnover is not increased appreciably above normal. Low concentrations of haptoglobins, in the absence of increased haemolysis, may be found in hepatocellular disease and are characteristic of congenital anhaptoglobinaemia, which is uncommon except in populations of African origin.8 Low concentrations may also be found in megaloblastic anaemias, probably because of increased haemolysis and following haemorrhage into tissues.
Serum haemopexin
Haem binds in a 1:1 molar ratio to haemopexin; 6 μg/ml of free haem is required to deplete the normal binding levels of haemopexin. In normal adults of both sexes, its concentration is 0.5–1.15 g/l (by nephelometry) or 0.5–1.5 g/l (by electrophoresis);5 there is less in newborn infants, about 0.3 g/l, but adult levels are reached by the end of the first year of life. In severe intravascular haemolysis, when haptoglobin is depleted, haemopexin is low or absent and plasma methaemalbumin is elevated. With less severe haemolysis, although haptoglobin is likely to be reduced or absent, haemopexin may be normal or only slightly lowered. Haemopexin seems to be disproportionately low in thalassaemia major and low levels may be found in certain pathological conditions other than haemolytic disease: namely, renal and liver diseases. The concentration is increased in diabetes mellitus, infections and carcinoma.9
Haemopexin can be measured by the same methods as for haptoglobin with radial immunodiffusion or electrophoresis.10
Examination of plasma (or serum) for methaemalbumin
A simple but not very sensitive method is to examine the plasma using a hand spectroscope.
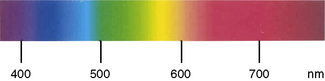
Free the plasma from suspended cells and platelets by centrifuging at 1200–1500 g for 15–30 min. Then view it in bright daylight with a hand spectroscope using the greatest possible depth of plasma consistent with visibility. Methaemalbumin gives a rather weak band in the red (at 624 nm) (Fig. 11.4). Because HbO2 is usually present as well, its characteristic bands in the yellow–green may also be visible. The position of the methaemalbumin absorption band in the red can be readily differentiated from that of Hi by means of a reversion spectroscope.
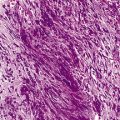
Demonstration of haemosiderin in urine
Method
Centrifuge 10 ml of urine at 1200 g for 10–15 min. Transfer the deposit to a slide, spread out to occupy an area of 1–2 cm and allow to dry in the air. Fix by placing the slide in methanol for 10–20 min and then stain by the method used to stain bone marrow films for haemosiderin (p. 334). Haemosiderin, if present, appears in the form of isolated or grouped blue-staining granules, usually from 1 to 3 μm in size (Fig. 11.5); they may be both intracellular and extracellular. If haemosiderin is present in small amounts and especially if distributed irregularly on the slide or if the findings are difficult to interpret, the test should be repeated on a fresh sample of urine collected into an iron-free container and centrifuged in an iron-free tube. (For the preparation of iron-free glassware: wash thoroughly in a detergent solution, then soak in 3 mol/l HCl for 24 h; finally, rinse in deionized, double-distilled water.)
Chemical tests of haemoglobin catabolism
Measurement of serum or plasma bilirubin, urinary urobilin and faecal urobilinogen can provide important information in the investigation of haemolytic anaemias. In this section, their interpretation and significance in haemolytic anaemias will be described, but because currently the tests are seldom performed in a haematology laboratory, for details of the techniques readers are referred to textbooks of clinical chemistry.5
Serum Bilirubin
Bilirubin is present in serum in two forms: as unconjugated prehepatic bilirubin and bilirubin conjugated to glucuronic acid. Normally, the serum bilirubin concentration is <17 μmol/l (10 mg/l) and mostly unconjugated. As illustrated in Figure 11.1, when there is increased red cell destruction, the protoporphyrin gives rise to an increased amount of unconjugated bilirubin and carbon monoxide. The bilirubin is then conjugated in the liver and this bilirubin glucuronide is excreted into the intestinal tract. Bacterial action converts bilirubin glucuronide to urobilin and urobilinogen. In haemolytic anaemias, the serum bilirubin usually lies between 17 and 50 μmol/l (10–30 mg/l) and most is unconjugated. Sometimes the level may be normal, despite a considerable increase in haemolysis. Levels >85 μmol/l (50 μg/l) and/or a large proportion of conjugated bilirubin suggest liver disease or post-hepatic obstruction. In haemolytic disease of the newborn (HDN), the bilirubin level is an important factor in determining whether an exchange transfusion should be carried out because high values of unconjugated bilirubin are toxic to the brain at this age and can lead to kernicterus. In normal newborn infants, the level often reaches 85 μmol/l, whereas in infants with HDN levels of 350 μmol/l are not uncommon and need to be urgently reduced by exchange transfusion. Moderately raised serum bilirubin levels are frequently found in dyshaemopoietic anaemias (e.g. pernicious anaemia), where there is ineffective erythropoiesis. Although part of the bilirubin comes from red cells that have circulated, a major proportion is derived from red cell precursors in the bone marrow that have failed to complete maturation.
Qualitative Test for Urobilinogen and Urobilin in Urine
Schlesinger’s Zinc Test
To 5 ml of urine, add 2 drops of 0.5 mol/l iodine to convert urobilinogen to urobilin. After mixing the sample and then leaving it standing on the bench for 1–2 min, add 5 ml of a 100 g/l suspension of zinc acetate in ethanol and centrifuge the mixture. A green fluorescence becomes apparent in the clear supernatant if urobilin or urobilinogen is present. If a spectroscope is available, the fluid may be examined for the broad absorption band (caused by urobilin) at the green–blue junction (Fig. 11.4). Urobilinogen can also be detected in freshly voided urine by commercially available reagent strip methods.
Porphyrins
Haem synthesis is initiated by succinyl coenzyme A and glycine, activated by the rate-limiting enzyme δ-aminolaevulinic (ALA)-synthase. ALA is the precursor of the porphyrins (Fig. 11.6). The porphyrins of clinical importance in man are protoporphyrin, uroporphyrin and coproporphyrin together with their precursor ALA. Protoporphyrin is widely distributed in the body and, in addition to its main role as a precursor of haem in Hb and myoglobin, it is a precursor of cytochromes and catalase. Uroporphyrin and coproporphyrin, which are precursors of protoporphyrin, are normally excreted in small amounts in urine and faeces. Red cells normally contain a small amount of coproporphyrin (5–35 nmol/l) and protoporphyrin (0.2–0.9 μmol/l). Deranged haem synthesis (e.g. in sideroblastic anaemias or lead toxicity) and iron deficiency anaemia result in an increased concentration of protoporphyrin in the red cells.
Appropriate tests are usually performed in clinical chemistry laboratories, including sophisticated methods for measuring red cell porphyrins, as described in an Association of Clinical Pathology Best Practice document.11 Simple qualitative screening tests for urinary porphobilinogen and urinary porphyrin are described later. Urinary porphobilinogen will help to diagnose the acute forms of porphyria, particularly when the patient is symptomatic and this test can lead to a definite diagnosis in a critical clinical situation.
Spectroscopic Examination of Urine for Porphyrins
Spectroscopic examination of urine for porphyrins is carried out on extracts, made as described earlier, or on urine that is acidified with a few drops of 10 mol/l HCl. If porphyrins are present, a narrow band will appear in the orange at 596 nm and a broader band will appear in the green at 552 nm (see Fig. 11.4). Qualitative tests are adequate for screening purposes. Accurate determinations require spectrophotometry or chromatography. Porphyrins are stable in ethylenediaminetetra-acetic acid (EDTA) blood for up to 8 days at room temperature if protected from light. Urine should be collected in a brown bottle or, if in a clear container, kept in a light-proof bag. If the urine is rendered alkaline to pH 7–7.5 with sodium bicarbonate, porphyrins will not be lost for several days at room temperature.
Significance of Porphyrins in Blood and Urine
Normal red cells contain <650 nmol/l of protoporphyrin and <64 nmol/l of coproporphyrin.11 Increased amounts are present during the first few months of life. At all ages, there is an increase in red cell protoporphyrin in iron deficiency anaemia or latent iron deficiency, lead poisoning, thalassaemia, some cases of sideroblastic anaemia and the anaemia of chronic disease. Zinc protoporphyrin is also elevated in these conditions (p. 192).
Normally, porphobilinogen cannot be demonstrated in urine and only traces of uroporphyrin (<50 nmol/day), not detectable by the qualitative test described earlier, are present.11 ALA excretion is normally <40 mmol/day; it is increased in lead poisoning.
There are several forms of porphyria, caused by specific enzyme defects, each with a different clinical effect and pattern of excretion of porphyrin and precursors12 (Table 11.1). The most common type is acute intermittent porphyria, in which the defect in the enzyme porphobilinogen deaminase presents in one of three ways:
Table 11.1 Distribution of porphyrins in red cells, urine and faeces in different forms of porphyria
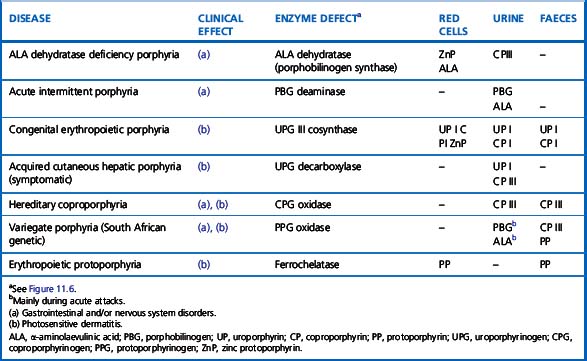
The different mutations of the porphobilinogen deaminase in the three types can be identified by DNA hybridization using specific oligonucleotides.13 Other acute forms are variegate porphyria and coproporphyria.
The most common hepatic type is porphyria cutanea tarda, which results in photosensitivity, dermatitis and often hepatic siderosis; it is the result of a defect in uroporphyrinogen decarboxylase. In this and other porphyrias associated with photosensitive dermatitis (Table 11.1) plasma porphyrins are elevated. There are two erythropoietic types: congenital erythropoietic porphyria, caused by defective uroporphyrinogen cosynthase and erythropoietic protoporphyria, caused by defective ferrochelatase. In the former, uroporphyrin and coproporphyrin are present in red cells and urine in increased amounts; in the latter, increased protoporphyrin is found in the red cells, but the urine is normal. In erythropoietic porphyria, haemolytic anaemia may occur.
Abnormal haemoglobin pigments
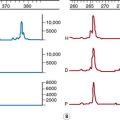
Methaemoglobin (Hi; also called MetHb), sulphaemoglobin (SHb) and carboxyhaemoglobin (HbCO) are of clinical importance and each has a characteristic absorption spectrum demonstrable by simple spectroscopy or, more definitely, by spectrometry. If the absorbance of a dilute solution of blood (e.g. 1 in 200) is measured at wavelengths between 400 and 700 nm, characteristic absorption spectra are obtained14–16 (Fig. 11.7 and Table 11.2). In practice, the abnormal substance represents usually only a fraction of the total Hb (except in carbon monoxide poisoning) and its identification and accurate measurement may be difficult. Hi can be measured more accurately than SHb.
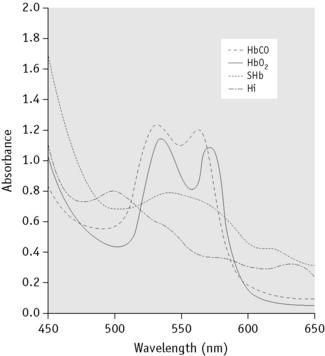
Table 11.2 Positions in spectrum for optimal absorbance of haemoglobin derivatives in absorption spectrometry (in nm)
| Oxyhaemoglobin | 542, 577 |
| Deoxygenated haemoglobin | 431, 556 |
| Carboxyhaemoglobin | 538, 568 |
| Methaemoglobin | 500, 630 |
| Sulphaemoglobin | 620 |
| Methaemalbumin | 624 |
| Haemochromogen (Schumm’s test) | 558 |
Some approximations where slightly different figures have been reported in different studies.
Absorption spectroscopy is a method by which a substance can be characterized by the wavelengths at which the colour spectrum is absorbed when light is passed through a solution of the substance. The specific absorption bands are identifiable by their positions (Fig. 11.4).
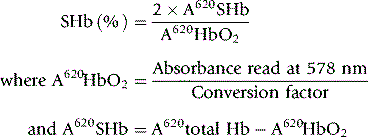
Spectroscopic Examination of Blood for Methaemoglobin and Sulphaemoglobin
Method
Dilute blood 1 in 5 or 1 in 10 with water and then centrifuge. Examine the clear solution, if possible in daylight, using a hand spectroscope. It is important that the greatest possible depth or concentration of solution consistent with visibility should be examined and that a careful search should be made (with varying depths or concentrations of solution) for absorption bands in the red part of the spectrum at 620–630 nm. If bands are seen in the red, add a drop of yellow ammonium sulphide to the solution. A band caused by Hi, but not that caused by SHb, will disappear. For comparison, lysed blood may be treated with a few drops of potassium ferricyanide (50 g/l) solution, which will cause the formation of Hi; SHb may be prepared by adding to 10 ml of a 1 in 100 dilution of blood, 0.1 ml of a 1 g/l solution of phenylhydrazine hydrochloride and a drop of water that has been previously saturated with hydrogen sulphide. The spectra of the unknown and the known pigments may then be compared in a reversion spectroscope. The absorption band in the red caused by Hi is at 630 nm (compare with methaemalbumin at 624 nm) (Fig. 11.4).
Measurement of Methaemoglobin
Principle
Hi has a maximum absorption at 630 nm. When cyanide is added, this absorption band disappears and the resulting change in absorbance is directly proportional to the concentration of Hi. Total Hb in the sample is then measured after complete conversion to HiCN by the addition of ferricyanide-cyanide reagent. The conversion will measure oxyhaemoglobin and Hi but not SHb. Thus, the presence of a large amount of SHb will result in an erroneously low measurement of total Hb. Turbidity of the haemolysate can be overcome by the addition of a non-ionic detergent.14,15
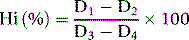
Screening Method for Sulphaemoglobin
Principle
An absorbance reading at 620 nm measures the sum of the absorbance of oxyhaemoglobin and SHb in any blood sample. In contrast to oxyhaemoglobin, the absorption band caused by SHb is unchanged by the addition of cyanide. The residual absorbance, as read at 620 nm, is therefore proportional to the concentration of SHb. The absorbance of the oxyhaemoglobin alone at 620 nm can only be inferred from a reading at 578 nm and a conversion factor, A578/A620, has to be determined experimentally for each instrument on a series of normal blood samples.16,17 The absorbance of SHb is obtained by subtracting the absorbance of the oxyhaemoglobin from that of the total Hb. This provides an approximation only, but it may be regarded as adequate for clinical purposes in the absence of a more reliable method.
Method
Mix 0.1 ml of blood with 10 ml of a 20 ml/l solution of a non-ionic detergent (Triton X-100 or Nonidet P40; see footnote p. 241). Record the absorbance (A) at 620 nm (total Hb). Add 1 drop of 50 g/l potassium cyanide, and after letting it stand for 5 min, record A at 620 nm and at 578 nm.
Calculation
Significance of methaemoglobin and sulphaemoglobin in blood
Other (rare) types of methaemoglobinaemia are caused by inherited deficiency of the enzyme NADH-Hi reductase and by inherited Hb abnormalities (types of Hb M). The absorption spectra of the Hb Ms differ from that of normal Hi and they react slowly and incompletely with cyanide; their concentration cannot be estimated by the method of Evelyn and Malloy.14 Methaemoglobinaemia leads to cyanosis which becomes obvious with as little as 15 g/l of Hi: that is, about 10%.
Demonstration of Carboxyhaemoglobin
Method
Dilute 0.1 ml of blood in 20 ml of 0.4 ml/l ammonia and add 20 mg of sodium dithionite. Measure the absorbance in a spectrophotometer at 538 nm and 578 nm within 10 min. Calculate the quotient A538/A578 and read the % HbCO in the blood from the calibration curve16 or calculate it from the equation.16,17
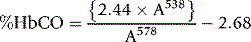
Significance of carboxyhaemoglobin in circulating blood
Carbon monoxide has an affinity for Hb c200 times that of oxygen. This means that even low concentrations of carbon monoxide rapidly lead to the formation of HbCO. Less than 1% of HbCO is present in normal blood and up to 10% in smokers.17,18 There is also an increased production and excretion in the lungs, in haemolytic anaemias. A high concentration in blood from inhalation of the gas causes tissue anoxia and may lead to death. However, recovery can take place because HbCO dissociates in time in the presence of high concentrations of oxygen.
Identification of Myoglobin in Urine
Myoglobin is the principal protein in muscle and it may be released into the circulation when there is cardiac or skeletal muscle damage. Some may be excreted in the urine where its concentration can be measured by a specific and relatively sensitive radioimmunoassay.19 Because the absorption spectra of myoglobin and Hb are similar, although not identical, it is not possible to distinguish them readily by spectroscopy or spectrometry, but they can be separated by column chromatography.20 Normally, men have <80 μg/l and women have <60 μg/l, increasing slightly in old age, whereas children have very low values.5
1 Moore G.L., Ledford M.E., Merydith A. A micromodification of the Drabkin hemoglobin assay for measuring plasma hemoglobin in the range of 5 to 2000mg/dl. Biochem Med. 1981;26:167-173.
2 Morris L.D., Pont A., Lewis S.M. Use of a new HemoCue system for measuring haemoglobin at low concentrations. Clin Lab Haematol. 2001;23:91-96.
3 Standefer J.C., Vanderjogt D. Use of tetramethyl benzidine in plasma hemoglobin assay. Clin Chem. 1977;23:749-751.
4 Davidson R.J.L. March or exertional haemoglobinuria. Semin Hematol. 1969;6:150-161.
5 Burtis C.A., Ashwood E.R. NW Tietz’s Fundamentals of Clinical Chemistry, 5th ed. Philadelphia: Saunders; 2000.
6 Brus I., Lewis S.M. The haptoglobin content of serum in haemolytic anaemia. Br J Haematol. 1959;5:348-355.
7 Valeri C.R., Bond J.C., Flower K., et al. Quantitation of serum hemoglobin-binding capacity using cellulose acetate membrane electrophoresis. Clin Chem. 1965;11:581-588.
8 Teye K., Quaye I.K., Koda Y., et al. A-61C and C-101G Hp gene promoter polymorphisms are, respectively, associated with ahaptoglobinaemia and hypohaptoglobinaemia in Ghana. Clin Genet. 2003;64:439-443.
9 Hanstein A., Muller-Eberhard U. Concentration of serum hemopexin in healthy children and adults and in those with a variety of hematological disorders. J Lab Clin Med. 1968;71:232-239.
10 Heide K., Haupt H., Störiko K., et al. On the heme-binding capacity of hemopexin. Clin Chim Acta. 1964;10:460-469.
11 Deacon A.C., Elder G.H. Frontline tests for the investigation of suspected porphyria: ACP Best Practice No. 165. J Clin Pathol. 2001;54:500-507.
12 Bottomley S.S., Muller-Eberhard U. Pathophysiology of heme synthesis. Semin Hematol. 1988;25:282-302.
13 Sassa S. Diagnosis and therapy of acute intermittent porphyria. Blood Rev. 1996;10:53-55.
14 Van Kampen E.J., Zijlstra W.G. Determination of hemoglobin and its derivates. Adv Clin Chem. 1965;8:141-187.
15 Zijlstra W.G., Buursma A., van Assendelft O.W. Visible and near infrared absorption spectra of human and animal haemoglobin: determination and applications. Zeist, Netherlands: VSP; 2003.
16 Zwart A., van Kampen E.J., Zijlstra W.G. Results of routine determination of clinically significant hemoglobin derivatives by multicomponent analysis. Clin Chem. 1986;32:972-978.
17 Shields C.E. Elevated carbon monoxide level from smoking in blood donors. Transfusion (Phil). 1971;11:89-93.
18 Russell M.A.H., Wilson C., Cole P.V., et al. Comparison of increases in carboxyhaemoglobin after smoking ‘extra mild’ and ‘non mild’ cigarettes. Lancet. 1973;ii:687-690.
19 Stone M.J., Willerson J.T., Waterman M.R. Radioimmunoassay of myoglobin. Methods Enzymol. 1982;84:172-177.
20 Cameron B.F., Azzam S.A., Kotite L., et al. Determination of myoglobin and hemoglobin. J Lab Clin Med. 1965;65:883-890.
* This is an analogue of benzidine that can be used with the standard safety precautions for handling any toxic chemicals; benzidine itself is a carcinogenic substance, the use of which is prohibited in many countries.
* Gel plates containing the antiserum are available commercially (e.g. The Binding Site Group Ltd, PO Box 11712, Birmingham, B14 4ZB, UK).