[level-membership-for-neurosurgery-category]
Chapter 9 Radiographic Evaluation of Lesions within the Vertebrae
IMAGING MODALITIES
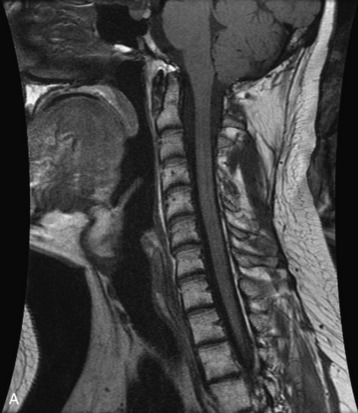
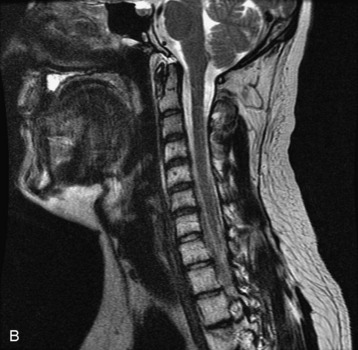
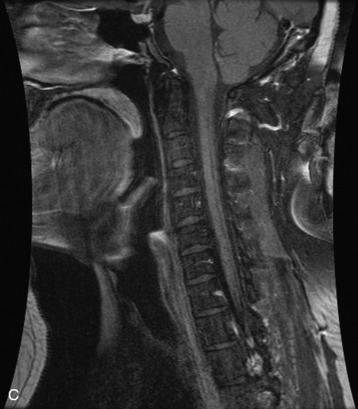
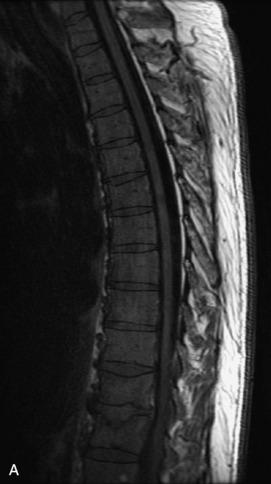
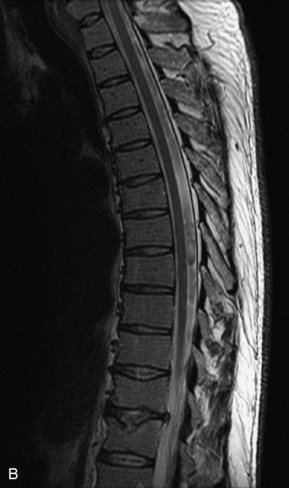
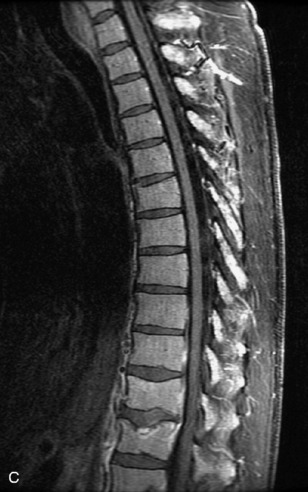
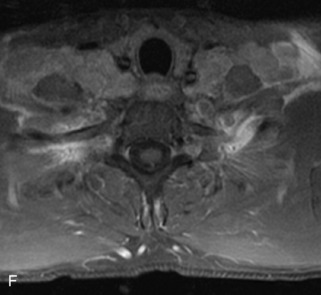
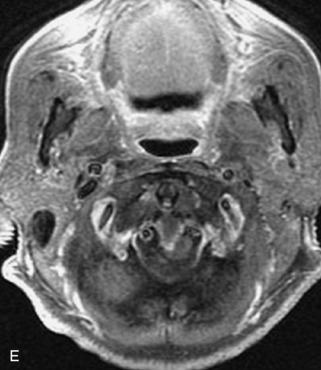
Radiographs, radionuclide scintigraphy (most often bone scan), positron-emission tomography (PET), computed tomography (CT), and magnetic resonance imaging (MRI) are the imaging modalities available for evaluating lesions of the vertebrae. Of these, CT and MRI are relied on the most heavily. CT provides useful diagnostic information, characterizing cortical destruction, lesion margins, and tumor matrix, and may demonstrate pathognomonic features for specific lesions. MRI is the most sensitive tool for detecting infiltration of bone marrow and for assessment of extension into the spinal canal and compression of the spinal cord and nerve roots.1–5 Patients should be cleared for MRI contraindications before undergoing imaging. A discussion of contraindications is beyond the scope of this chapter, but a useful reference is Shellock’s Reference Manual for Magnetic Resonance Safety, Implants, and Devices.6 Of note, metallic implants for spinal fusion are not a contraindication, but may create magnetic susceptibility artifacts, which are greatest on fat saturated images and gradient echo (GRE) sequences and are minimized with the fast spin echo (FSE) technique.7 When assessing the spine, sagittal spin echo T1-weight images (T1WI) and T2-weighted images (T2WI) with axial GRE or FSE T2WI images are part of our routine protocol. In the evaluation of neoplastic processes, post-gadolinium images and STIR (short tau inversion recovery, a fat saturated T2-weighted sequence) have been shown to increase sensitivity for detection of disease.8–10 Although some proponents advocate use of STIR instead of gadolinium-enhanced images for screening of vertebral body pathology,11,12 post-gadolinium fat saturated images may add clinically important information in cases of abnormal STIR images.13 Diffusion weighted imaging (DWI) has shown promise for differentiating benign from pathological fractures.14–17 However, there are some reservations about DWI’s specificity in this setting,18 and DWI has shown to be no better than conventional imaging in the absence of a fracture.19 For now, DWI remains unproven and technically challenging in the spine (Tables 9-1 and 9-2 and Figs. 9-1 and 9-2).
Table 9-1 Common MRI Sequences for Evaluation of Spinal Tumors
| T1-weighted SE | Marrow in adults has high signal because of fat Marrow signal lower than intervertebral disc indicates infiltrative process20 |
| T2-weighted FSE | High signal lesions may be inconspicuous on background of high signal marrow using FSE technique without fat saturation |
| T1-weighted + gadolinium | Without fat saturation, enhancing vertebral lesions may become less conspicuous8 Sequence useful for characterizing epidural, intradural, and paraspinal disease |
| STIR | Fat saturated T2-weighted sequence Shown to have better homogeneity of fat saturation than FSE T2 with fat saturation10 Lesions usually hyperintense on background of dark normal marrow |
SE, spin echo; FSE, fast spin echo; STIR, short tau inversion recovery.
Table 9-2 Classification of Vertebral Body Lesions
| Multiple Lesions | Solitary Lesions | Tumor Mimics |
|---|---|---|
| Hemangiomas | Chordoma | Infection |
| Metastases | Plasmacytoma | Heterogeneous marrow |
| Multiple myeloma | Giant cell tumor | Paget disease |
| Lymphoma | Aneurysmal bone cyst | Fibrous dysplasia |
| Leukemia | Osteoid osteoma | Renal osteodystrophy |
| Langerhans’ cell histiocytosis | Osteoblastoma | Anemia |
| Osteochondroma | Avascular necrosis | |
| (These lesions also may present as solitary lesions within the spine) | Osteogenic sarcoma | Kümmell’s disease |
| Chondrosarcoma | ||
| Ewing sarcoma | ||
| Neuroblastic tumors |
MULTIPLE LESIONS
Hemangiomas
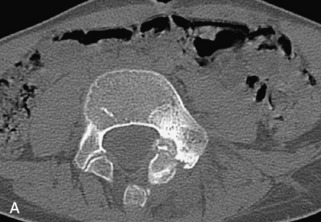
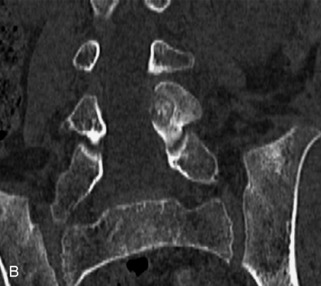
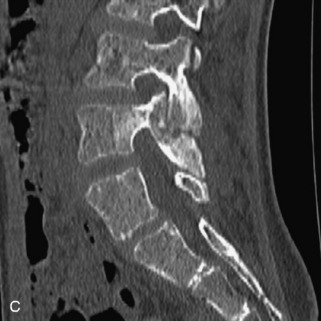
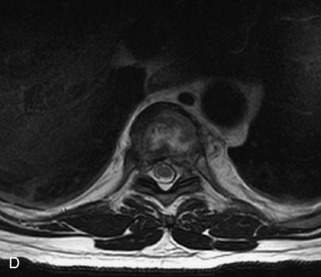
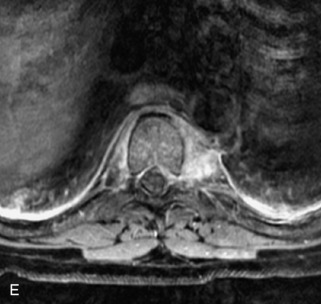
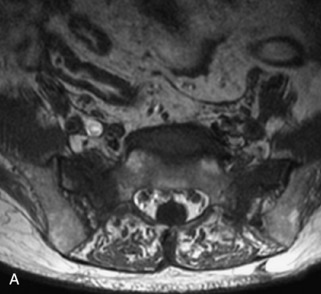
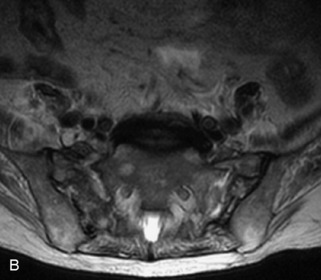
Hemangiomas are benign vascular tumors that occur in more than 10% of adults and are commonly detected as an incidental finding on imaging studies performed for unrelated indications. They are the most common primary bone tumor in adults, occur most commonly in the thoracic spine, and are usually solitary but can be multiple in approximately 30% of cases.1,2,21 They typically arise in the vertebral body but may involve the posterior elements. The CT appearance of a low attenuation lesion with coarse trabeculae throughout (giving a “polka-dot” appearance in cross-section) is diagnostic.22 MRI demonstrates the fatty stroma, which is bright on T1WI and iso-intense to hyperintense to marrow on T2WI, with avid enhancement after administration of gadolinium.23 Bone scan is typically normal.24 An aggressive subtype of hemangioma is recognized that tends to be associated more commonly with epidural extension and pathological fracture. These lesions are often iso-intense to hypointense to marrow on T1WI and can be impossible to distinguish from a malignant lesion, such as a metastasis, on imaging (Table 9-3 and Figs. 9-3 to 9-6).25,26
STIR, Short tau inversion recovery.
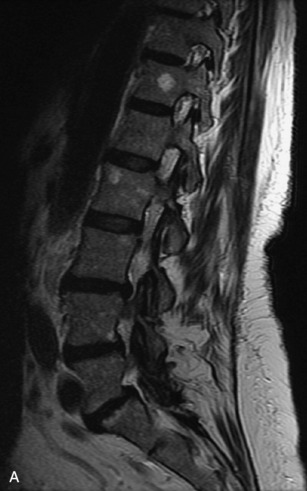
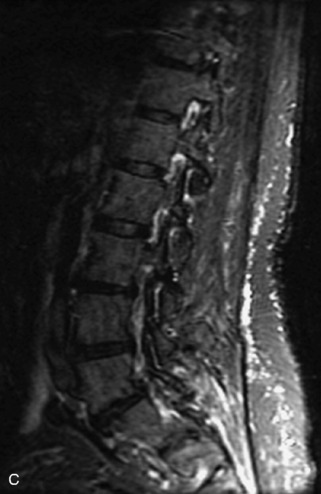
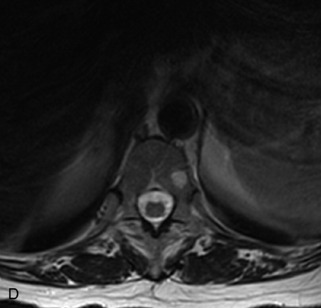
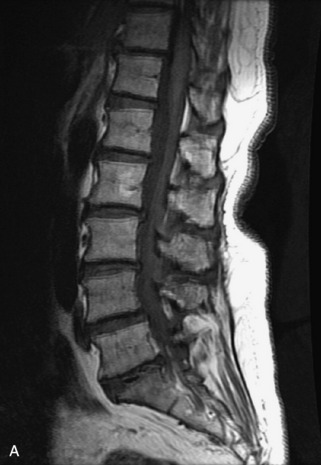
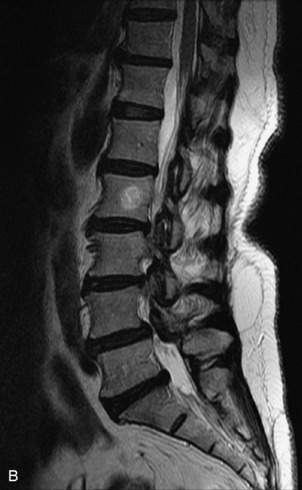
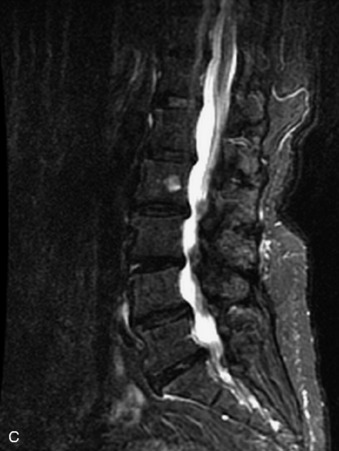
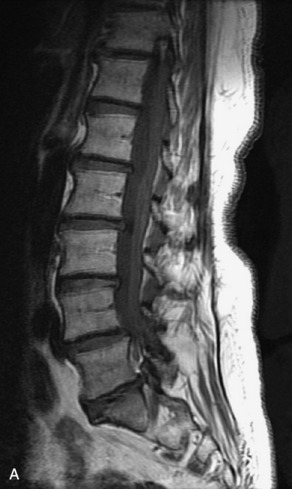
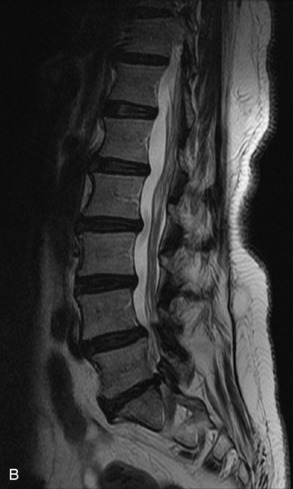
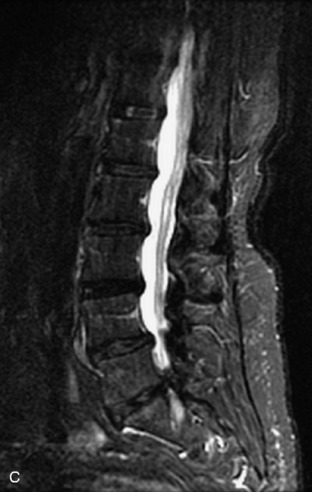
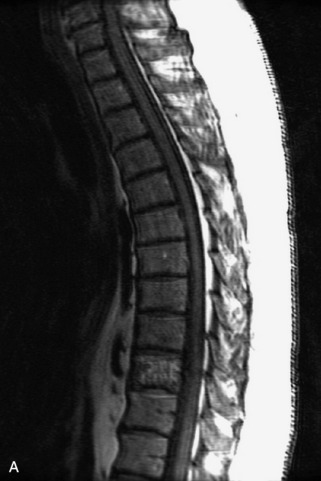
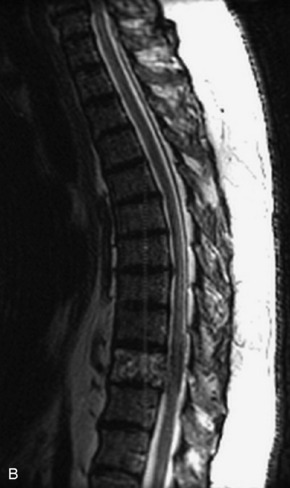
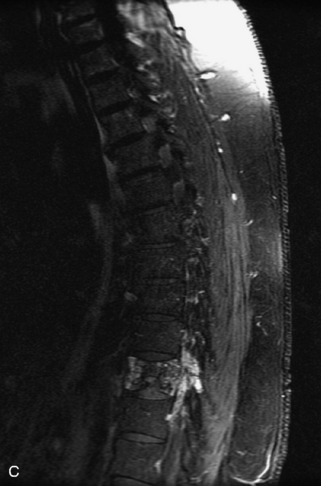
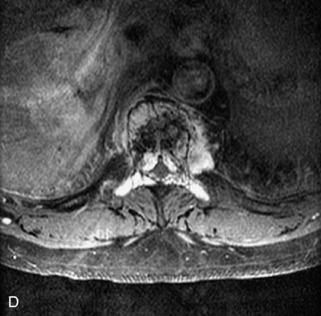
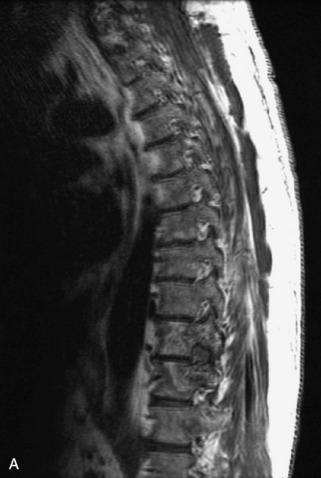
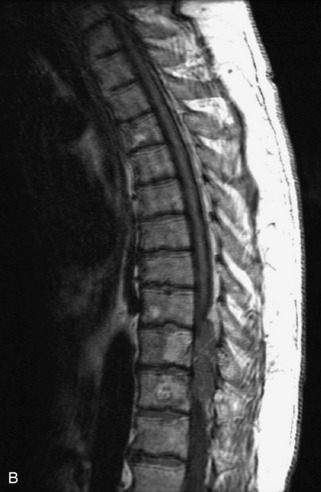
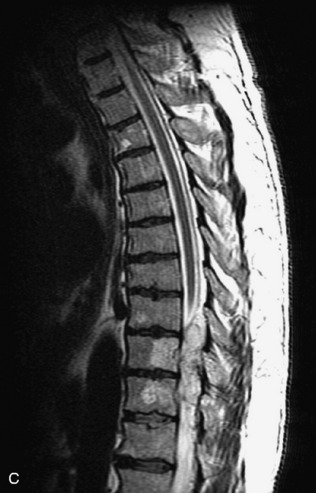
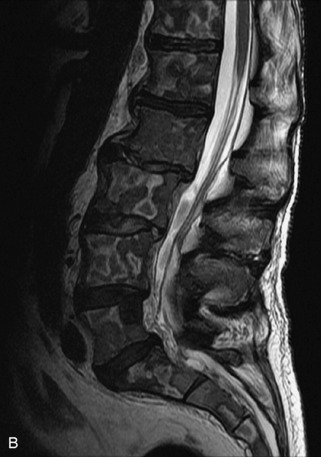
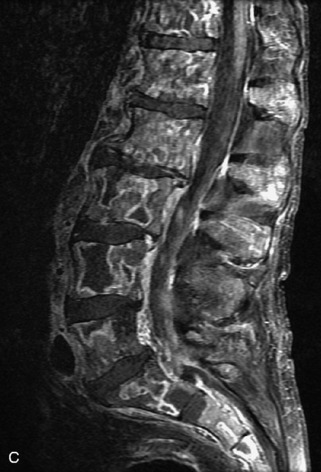
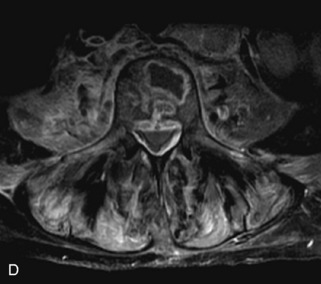
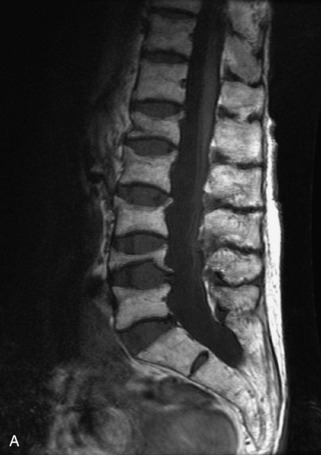
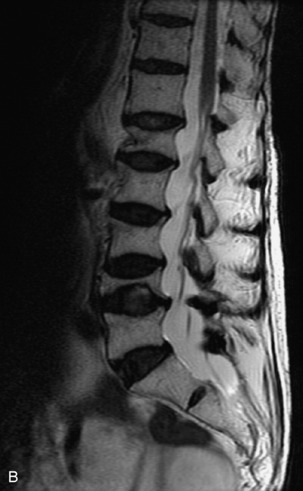
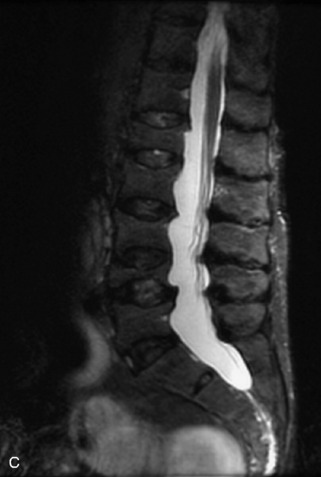
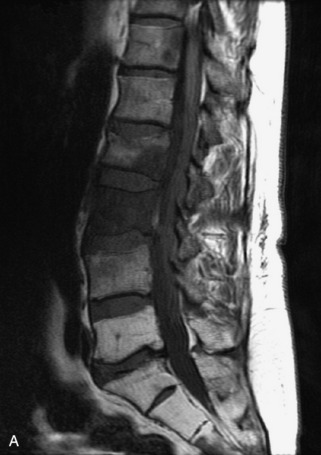
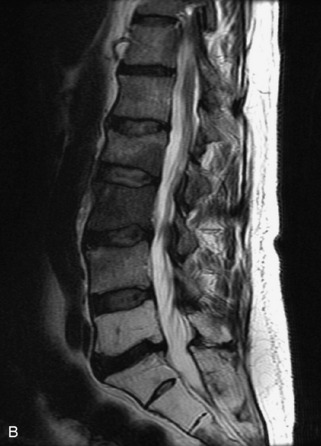
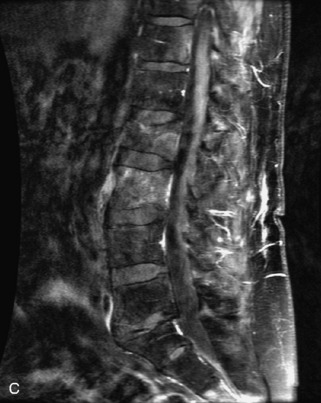
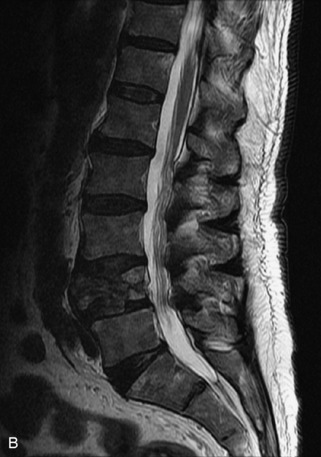
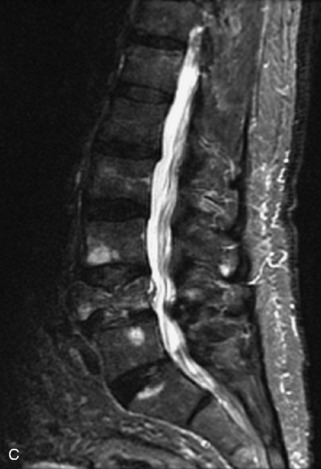
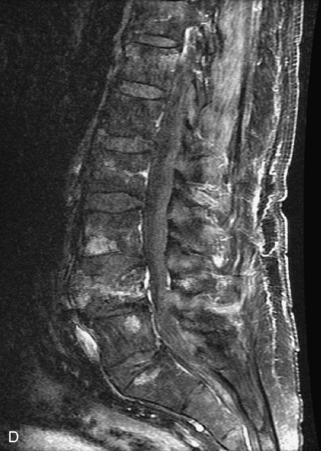
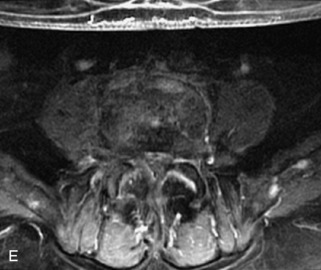
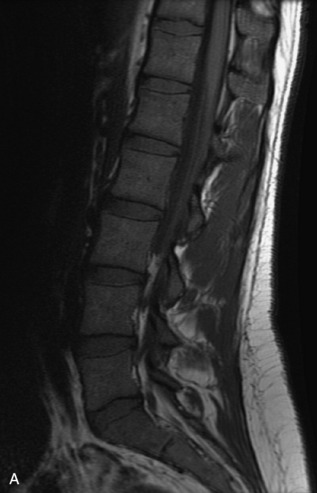
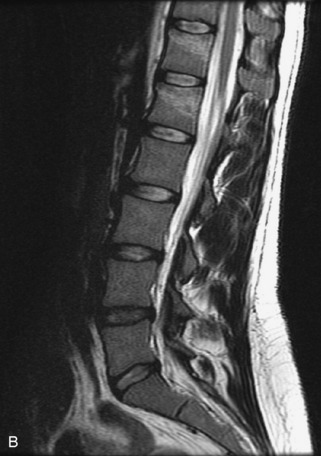
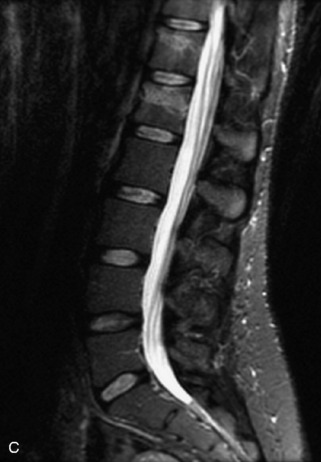
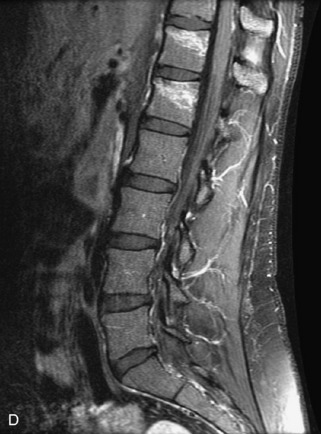
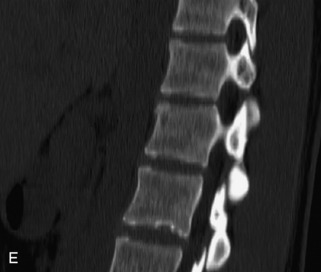
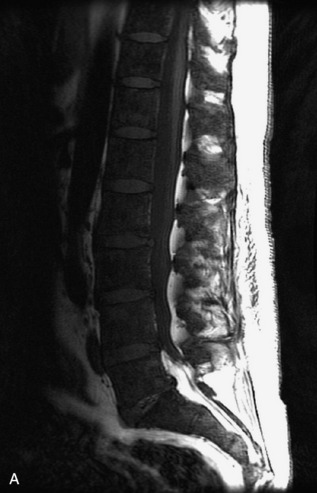
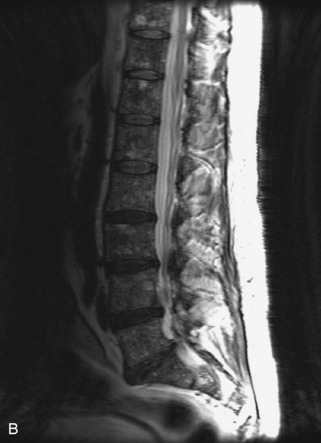
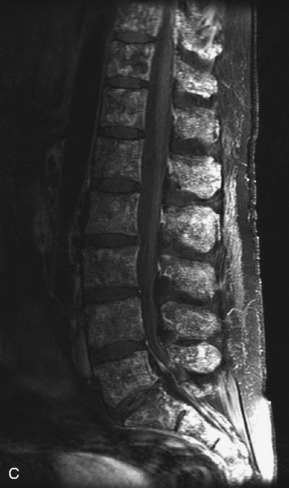
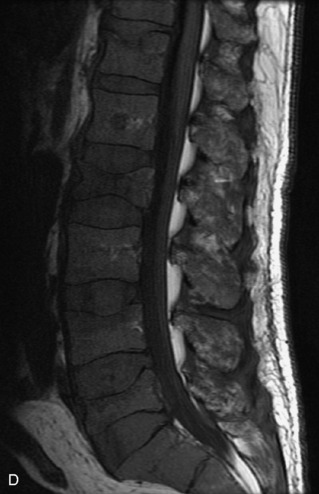
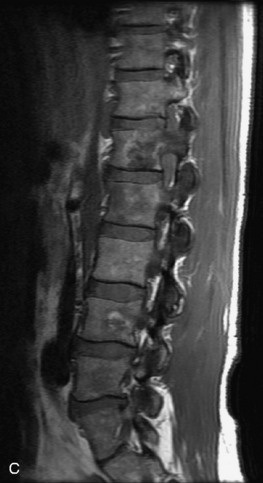
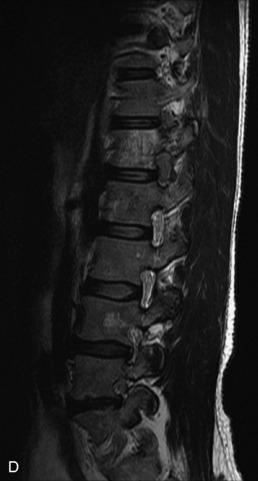
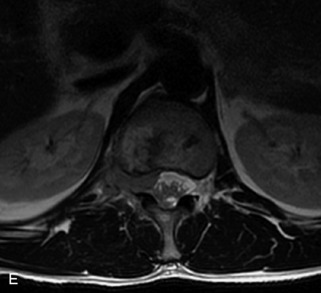
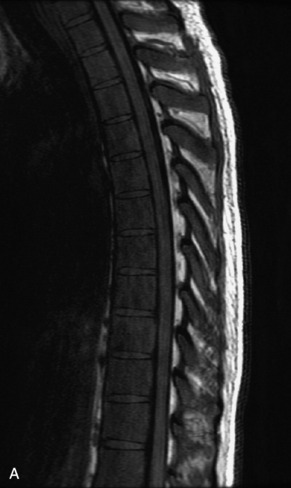
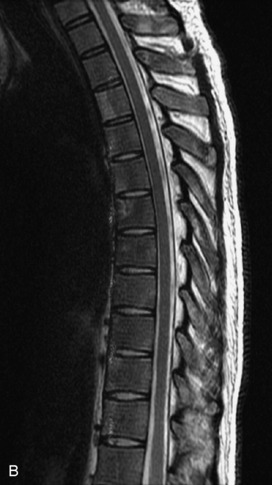
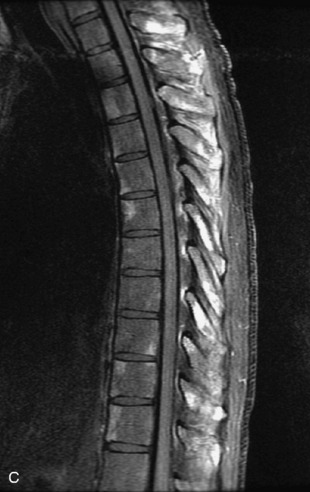
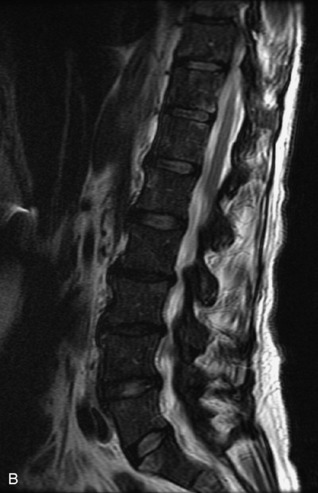
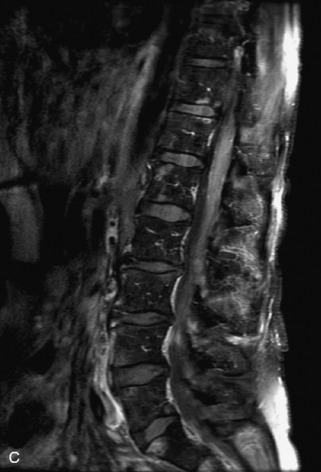
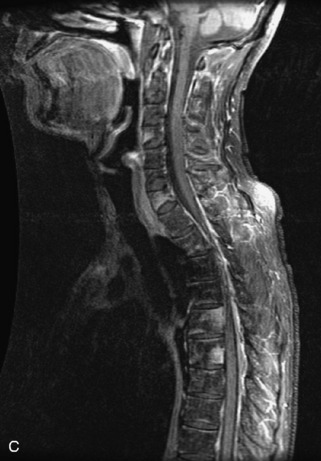
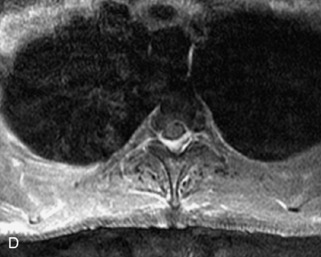
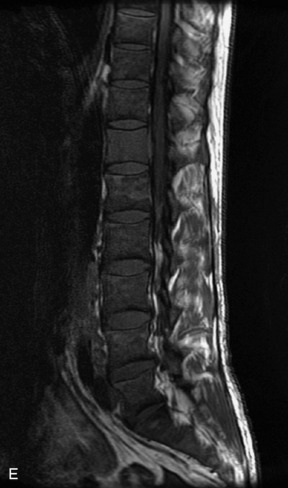
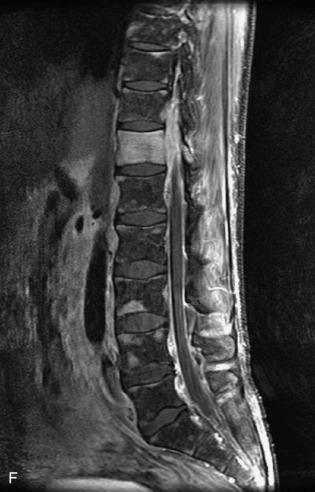
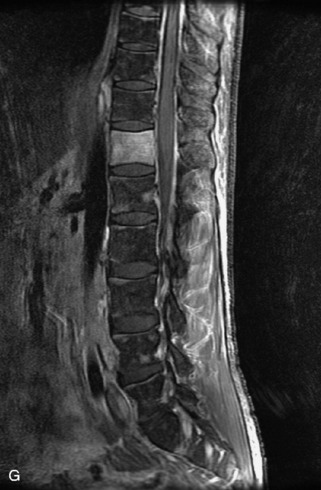
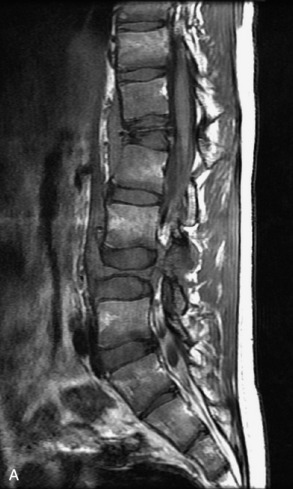
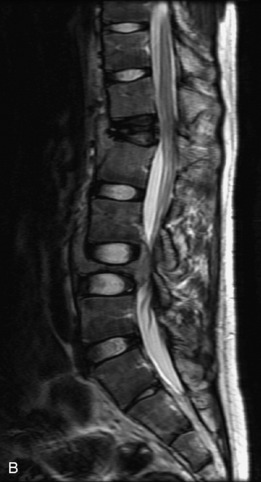
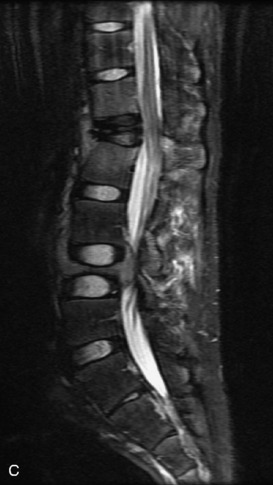
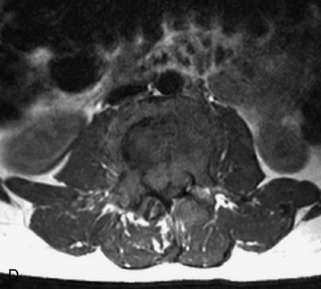
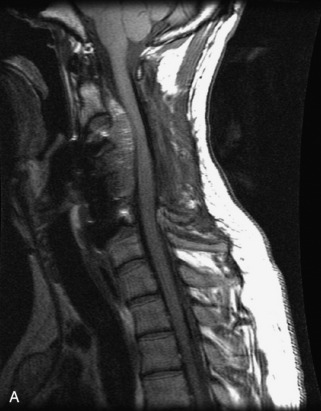
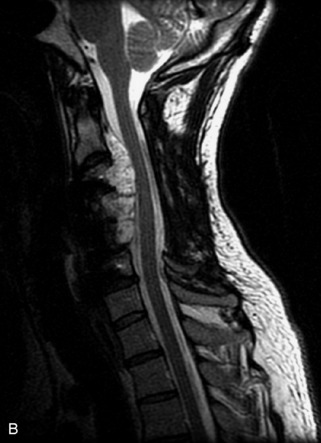
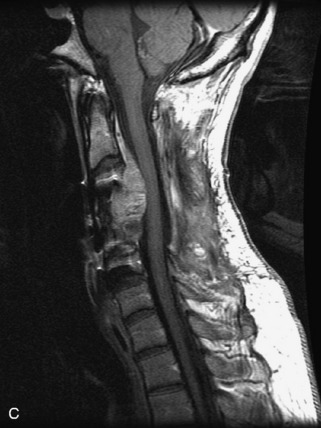
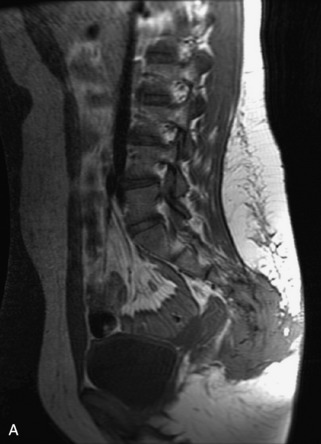
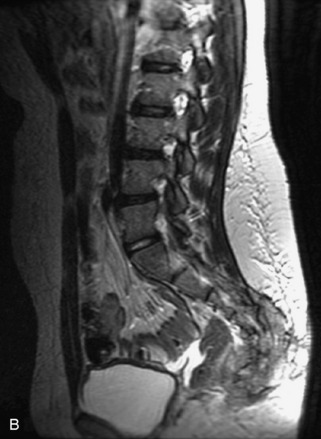
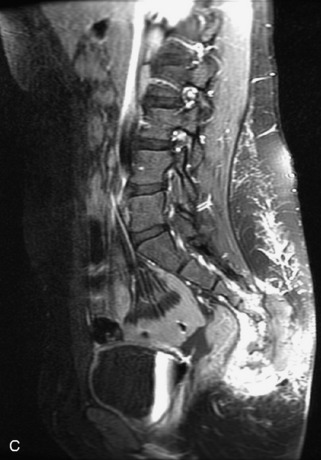
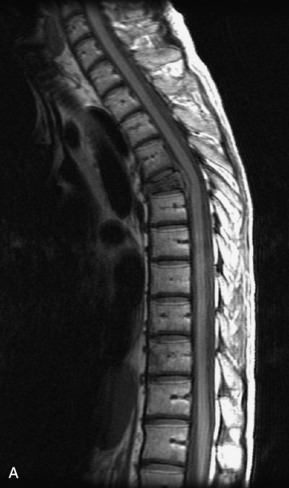
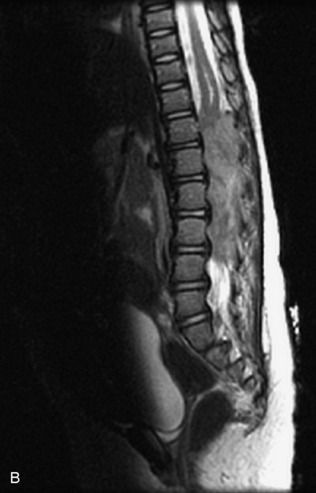
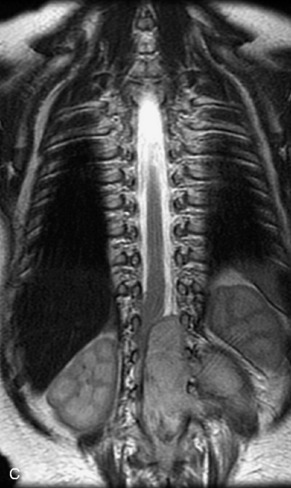
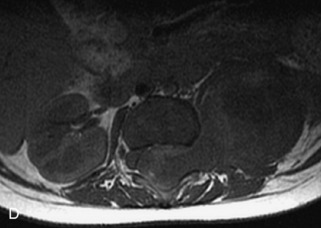
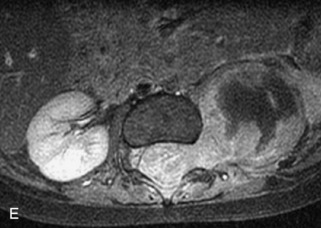
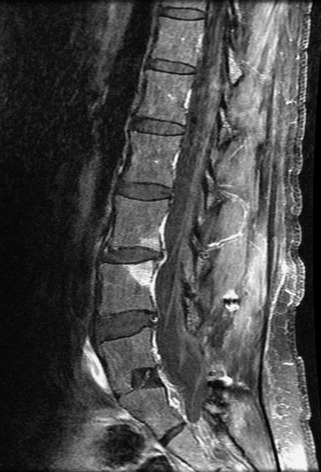
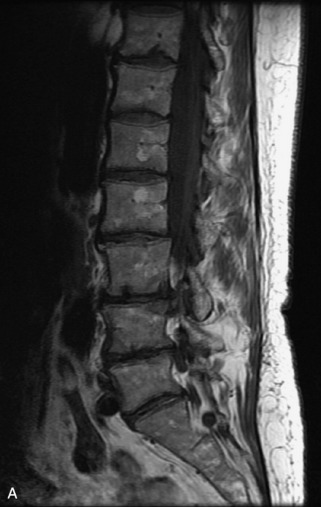
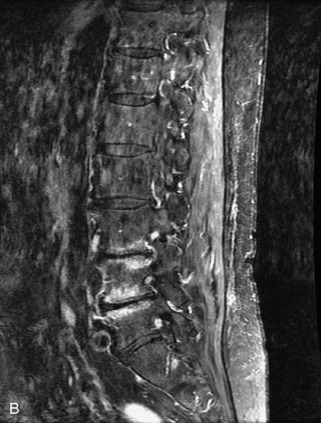
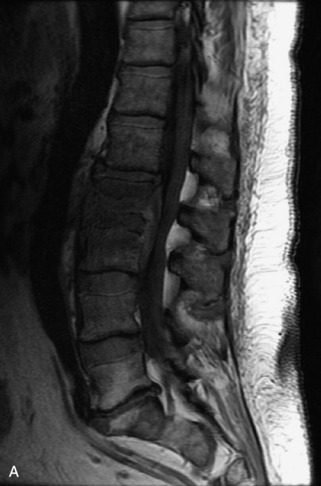
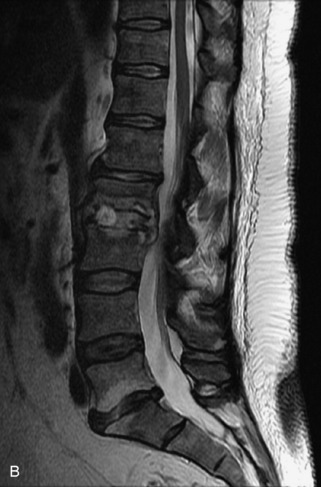
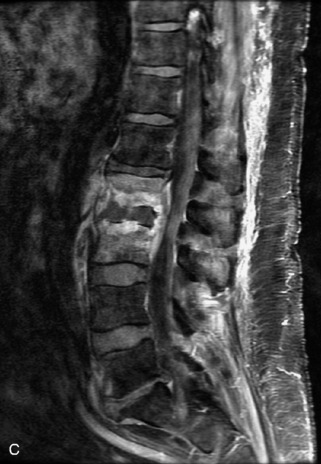
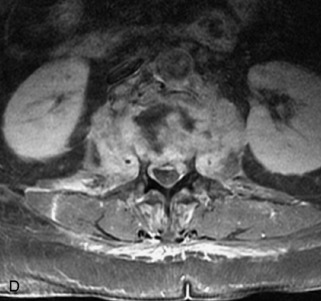
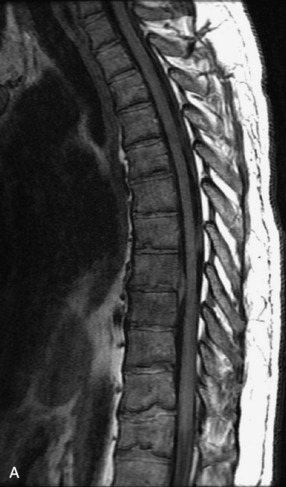
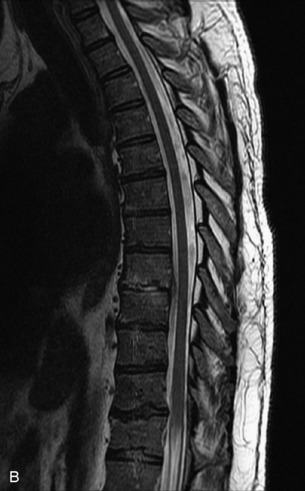
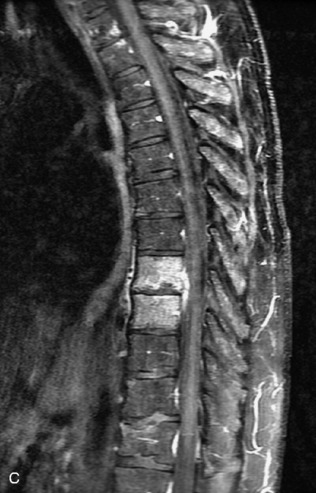
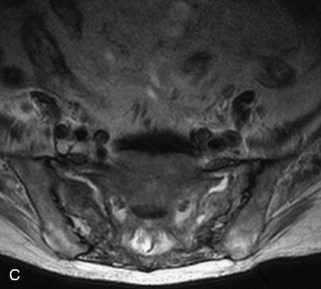
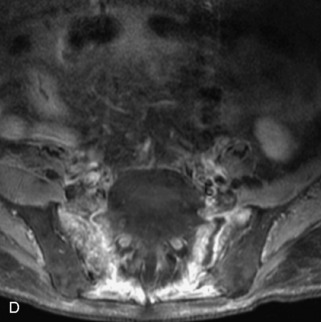
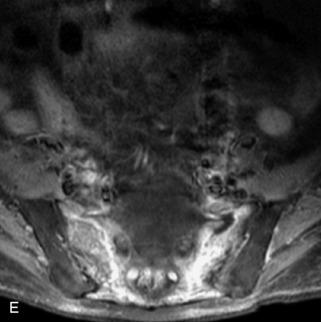
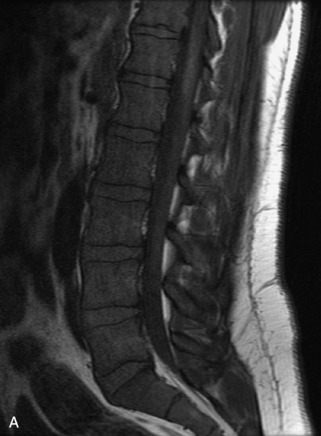
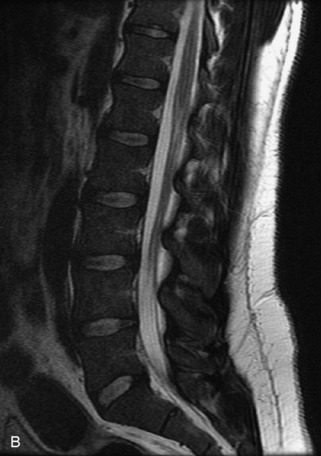
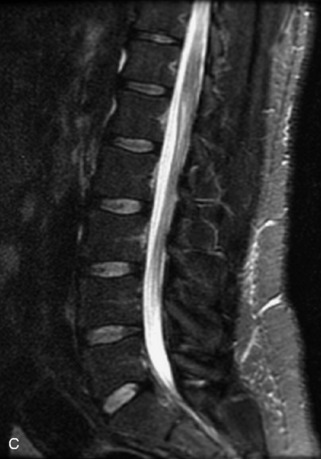
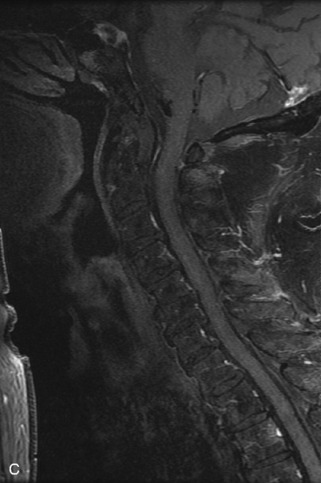
Fig. 9-4 Typical benign hemangiomas may sometimes have high signal on STIR images. A, Sagittal T1WI demonstrates a well-circumscribed hyperintense lesion within the L2 vertebral body consistent with a hemangioma. B, Sagittal T2WI demonstrates high signal within this lesion confirming the diagnosis of hemangioma. C, Sagittal STIR image. Unlike the previous example in Figure 9-3, high signal is seen within the L2 hemangioma on STIR. This does not change the diagnosis of hemangioma.
Metastases
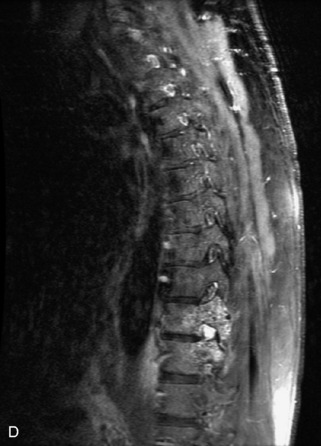
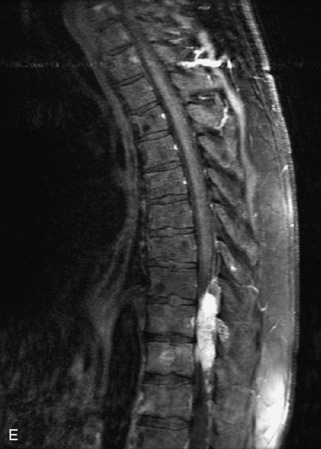
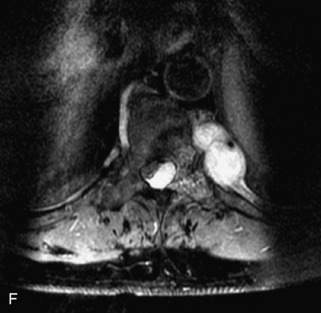
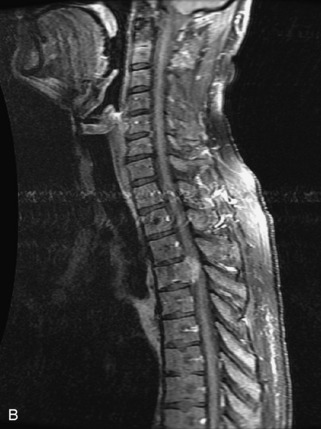
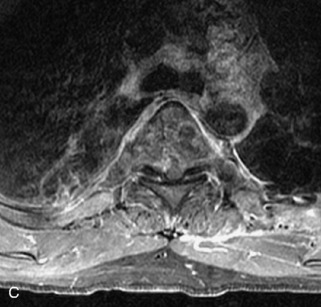
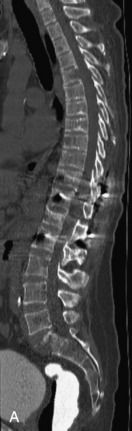
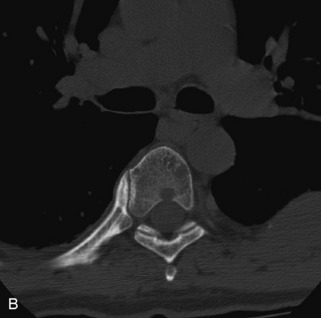
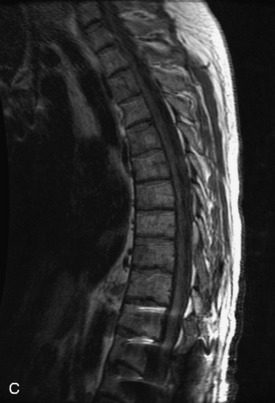
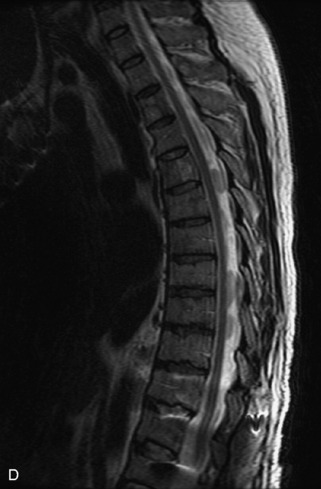
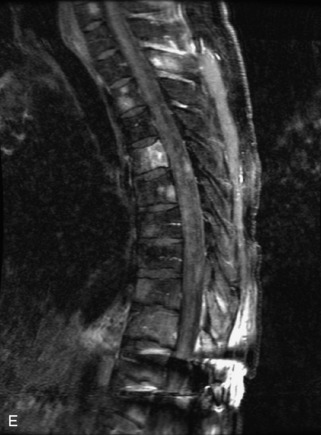
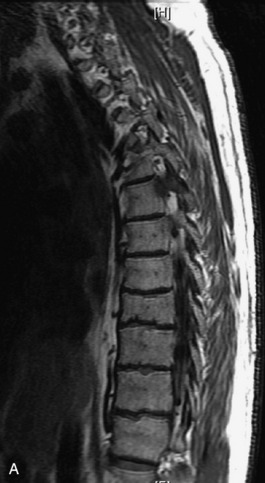
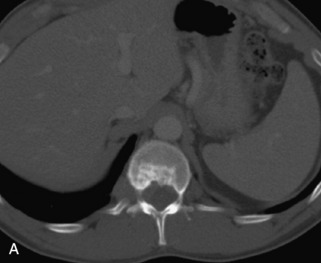
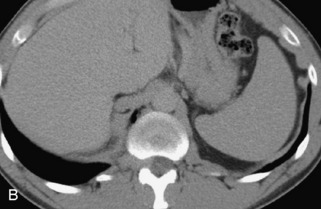
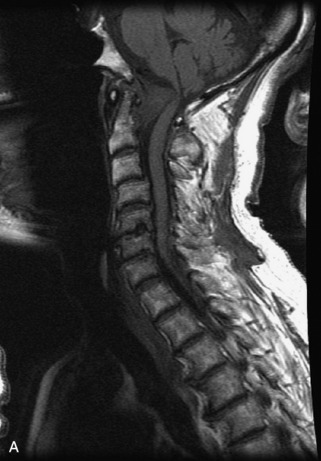
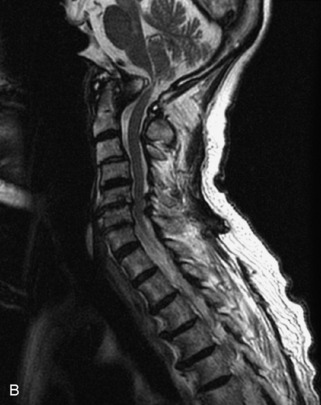
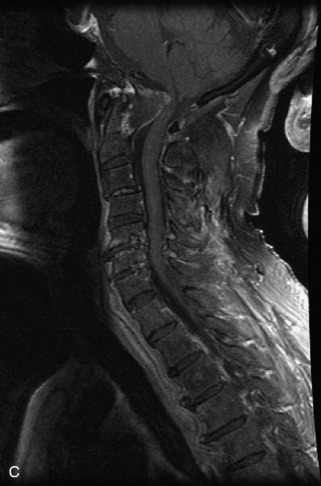
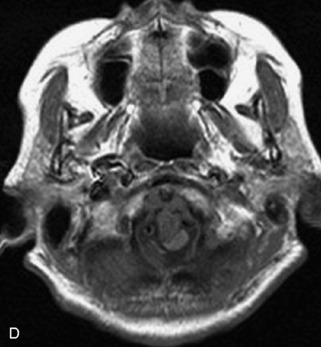
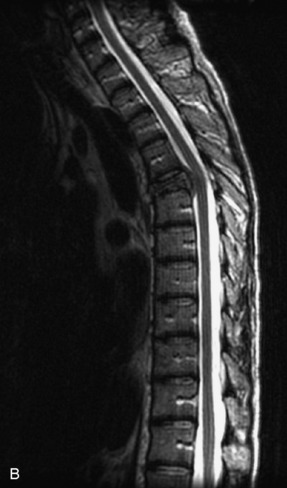
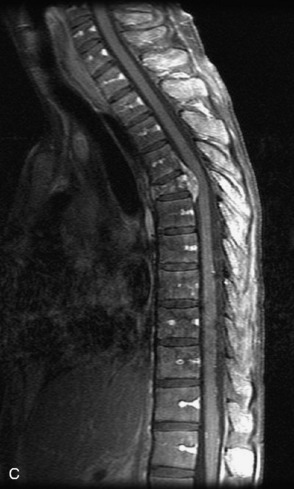
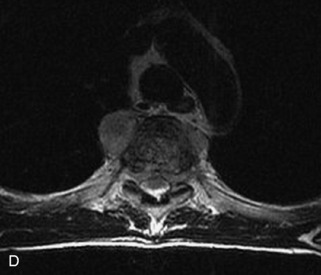
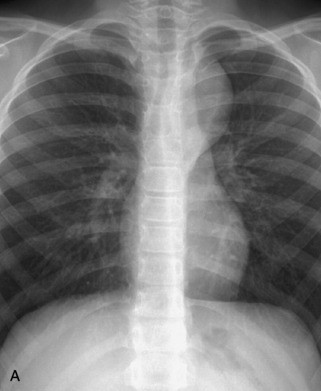
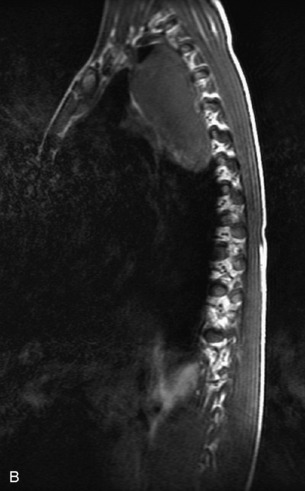
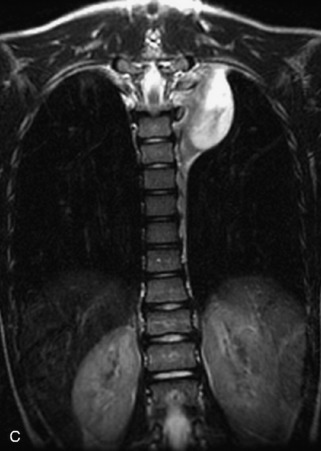
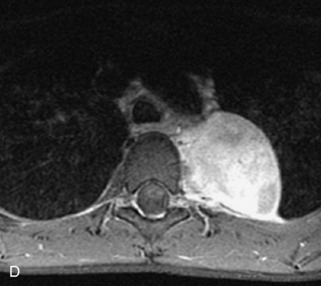
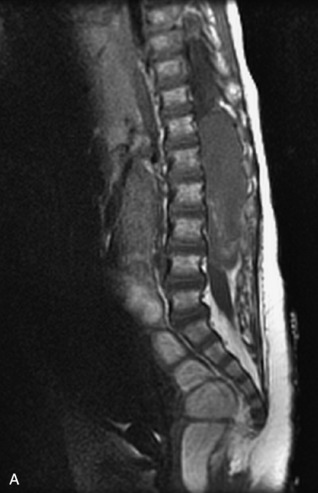
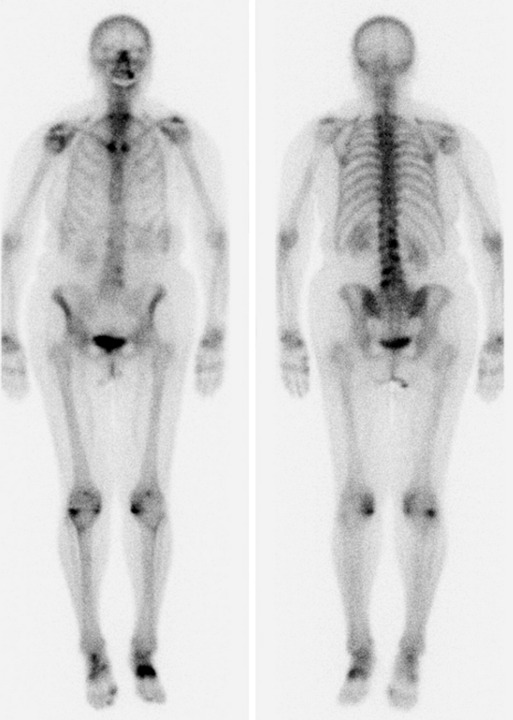
Metastatic disease is defined as dissemination or extension of tumor by direct, hematogenous, or lymphatic routes. Metastases are the most common malignancy to affect the spinal column. Bone metastases occur in 50% of all cancer patients, and 40–70% of these lesions are located within the vertebrae.27 In adults, breast, lung, prostate, lymphoma, sarcoma, and kidney account for the majority of primary sites. In children, neuroblastoma and Ewing sarcoma are the most common primary malignancies to metastasize to the spine.21,28 Metastases typically involve the vertebral body and posterior elements, and compression fractures as well as extension into the epidural space are common features. Most lesions have a lytic appearance on radiographs and CT, but blastic or sclerotic metastases can occur, especially in the setting of prostate carcinoma.1,2 Bone scan traditionally has been used to screen for metastatic disease to the spine. It has a sensitivity of approximately 95%, but can have false negatives if there is only marrow infiltration without cortical involvement, and is often non-specific. MRI has been shown to be both more sensitive and specific than scintigraphy.3 Radiographs are insensitive to assess for metastatic disease, requiring at least 50–70% bone destruction for detection of lesions.27,29,30 Classic radiographic signs include an absent or sclerotic pedicle, cortical destruction, and paraspinal soft tissue mass.29–31 CT is more sensitive than radiographs to detect bony destruction, sclerosis, and paraspinal masses but is less sensitive than MRI and is poor for assessment of cord compression. On MRI, lesions are typically hypointense to normal marrow and intervertebral discs on T1WI, usually hyperintense on T2WI, and demonstrate heterogeneous enhancement.1,2 In the case of epidural extension, the “draped curtain” sign has been described, whereby there is sparing of the midline because of an intact midline septum that attaches the dura anteriorly to the posterior longitudinal ligament, in contrast to infection, which does not spare the midline.32 When pathologic fracture occurs as a result of an underlying metastasis, restricted diffusion may be helpful to distinguish the metastatic lesion from a benign osteoporotic fracture14–17 (Table 9-4 and Figs. 9-7 to 9-10).
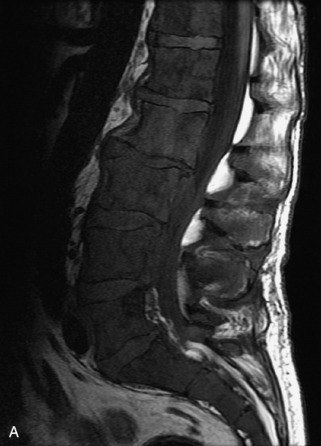
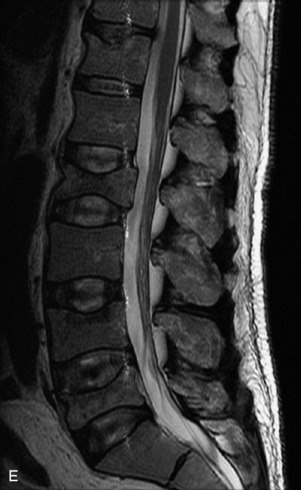
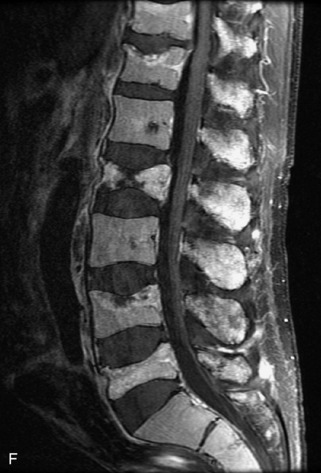
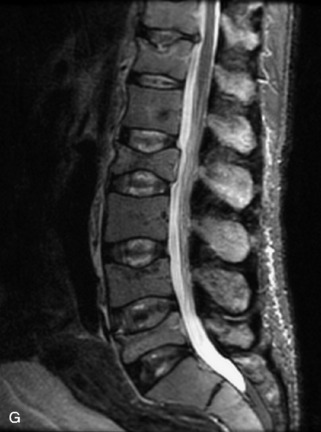
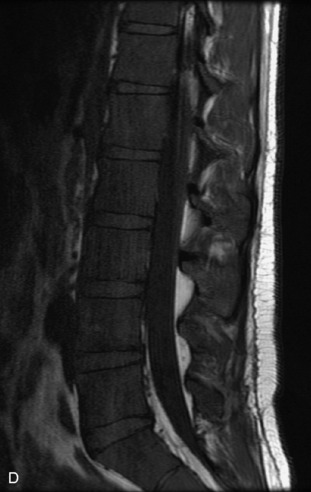
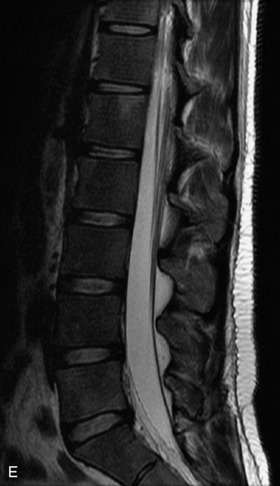
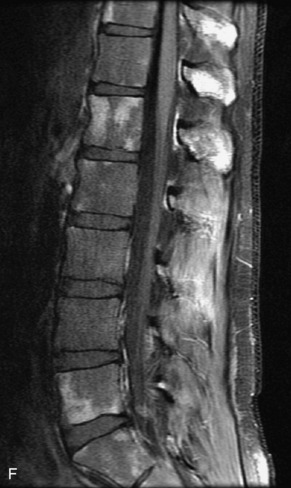
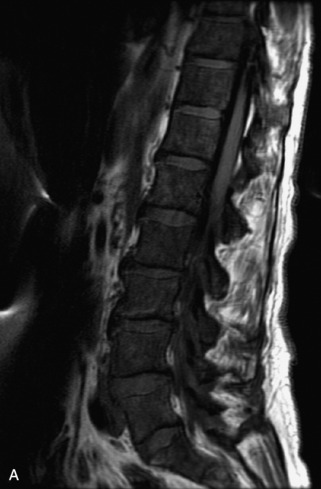
Pathological vs. Benign Compression Fractures
Vertebral compression fractures in the absence of trauma are a common clinical problem in the elderly population. Although clinical history is helpful, up to one-third of fractures in patients with known primary malignancy are benign, and approximately one-quarter of fractures in apparently osteopenic patients are caused by metastases.31 Diagnosis of an underlying lesion is important because it influences clinical staging, treatment planning, and prognosis for the patient. In the chronic setting, the differentiation between pathologic fracture as a result of underlying malignancy and benign osteoporotic fracture is fairly simple and can be made with a high level of certainty.33,34 Marrow signal of chronic benign fractures is iso-intense to normal bone marrow on all sequences, whereas fractures associated with metastases demonstrate low signal intensity on T1-weighted sequences and high signal intensity on T2-weighted sequences.33,35 STIR images provide the greatest contrast between normal and abnormal bone marrow.33 Acute compression fractures, however, may share many of the imaging findings of metastatic lesions, and differentiation is more challenging.35,36 Features that favor acute benign osteoporotic fractures include retropulsion of a bony fragment, preservation of normal marrow signal intensity, a horizontal band-like pattern of low signal intensity on T1WI and T2WI, and the presence of other compression fractures.37,38 Features more likely to be seen in metastatic compression fractures include pedicle involvement, an associated focal paraspinal soft tissue mass or epidural mass (particularly one encasing the dural sac), convex posterior cortex, diffuse low signal intensity within the vertebral body on T1WI, and the presence of other metastases.35,37–30 Some studies have suggested that a pattern of intense or heterogeneous contrast enhancement supports diagnosis of metastatic compression fracture, but this finding is inconsistent in the literature and may not be reliable.34,35,37,39 There has been increasing interest in the use of diffusion weighted imaging for differentiating benign vertebral fractures from those associated with metastases, with early results showing that reduced diffusion is highly specific for diagnosing an underlying metastatic lesion.14–17 However, even this technique is not foolproof18 and either bone biopsy or follow-up imaging is often required (Table 9-5 and Figs. 9-11 to 9-14).
Table 9-5 Imaging Features to Differentiate Benign Fracture from Malignancy
| Benign Osteoporotic Fracture | Malignant Lesion with Fracture |
|---|---|
| Acute Preservation of normal bone marrow signal Retropulsed bone fragment Horizontal band-like low signal intensity Presence of other compression fractures |
Acute Diffuse low signal intensity on T1WI Pedicle involvement Convex posterior cortex Epidural soft tissue mass Focal paraspinal soft tissue mass Presence of other metastases |
| Chronic Preservation of normal bone marrow signal |
Chronic Bone marrow replacement with abnormal signal—low signal on T1WI, high on T2WI |
Multiple Myeloma
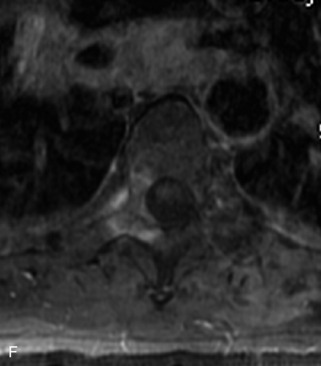
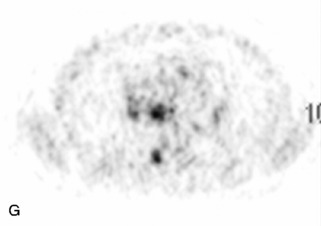
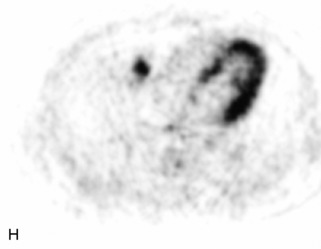
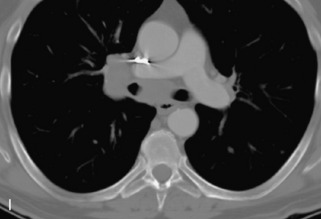
Multiple myeloma is a multifocal malignant proliferation of monoclonal plasma cells that occurs most commonly in men older than 60 years. Diagnosis is confirmed by bone biopsy or by demonstrating Bence Jones proteins (free light chains) in urine or monoclonal gammopathy in serum. Although it is the most common primary bone malignancy, multiple myeloma accounts for only 1% of all cancers.31 The axial skeleton is more commonly involved than long bones. Vertebral body destruction and fractures are common with spine involvement.40 Punched out lytic bone lesions, diffuse osteopenia, fractures, and, rarely, sclerotic lesions are the hallmarks of disease on CT and radiographs.1 MRI findings reflect a number of different patterns of bone marrow involvement. These patterns include microscopic infiltration with normal MRI appearance in up to 20%, focal lesions, homogeneous diffuse infiltration of the bone marrow (best seen as low signal on T1WI), combined diffuse and focal disease, and a heterogeneous/variegated pattern with interposition of fat islands giving a “salt and pepper” appearance.41 Marrow involvement or lesions are typically hypointense on T1WI, hyperintense on T2WI and STIR images, and enhance avidly with gadolinium. MRI is helpful for following treatment response, with decreased T2 signal abnormality and decreased enhancement representing good prognostic signs.42,43 Bone scan has limited sensitivity, detecting bone involvement in 75% of myeloma patients and only demonstrating 10% of lesions. However, technetium (Tc)-99m-sestamibi scintigraphy is both sensitive and specific for diagnosing myeloma lesions and is complementary to bone scan. Fluorodeoxyglucose (FDG) PET is gradually assuming an increasingly important role in following response to treatment44 (Table 9-6 and Figs. 9-15 and 9-16).
Lymphoma
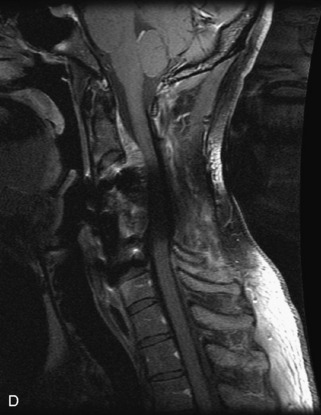
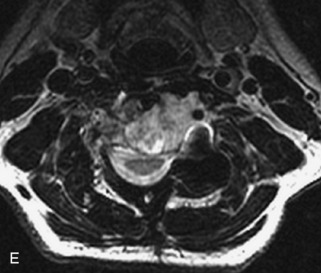
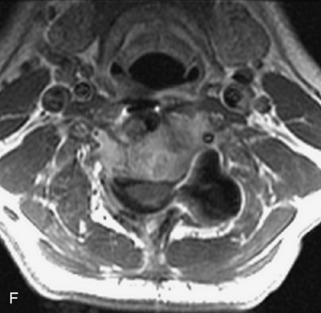
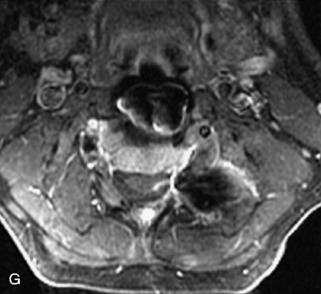
Lymphoma is a lymphoreticular neoplasm that typically occurs between the fourth and seventh decades. Secondary involvement of the spine with lymphoma is more common than primary involvement.31,45 Lymphoma may have a variety of different imaging presentations in the spine, most commonly including epidural disease and osseous involvement and less commonly leptomeningeal and intramedullary disease.46 Lymphoma demonstrates increased uptake on bone scan, 67Gallium (67Ga) scan, and FDG PET. Given its high sensitivity and adequate spatial resolution, FDG PET is the preferred imaging modality for staging of lymphoma.47 On radiographs or CT, vertebral lesions are either lytic or sclerotic. Although not a common presentation, lymphoma is considered on differential diagnosis for a sclerotic or “ivory” vertebral body and for severe compression or “vertebra plana.” The soft tissue paraspinal or epidural component is typically a homogeneous slightly hyperdense mass (as a result of hypercellularity) that often spreads over multiple levels and enhances homogeneously. MRI demonstrates bone marrow infiltration and epidural soft tissue that are hypo-intense to marrow on T1WI and variable on T2WI (but often mildly hypointense as a result of cellularity) and enhance homogeneously.31,48 Although the imaging appearance of lymphoma is often non-specific, marrow infiltration with a soft tissue mass in the absence of extensive cortical destruction is considered highly suggestive49 (Table 9-7 and Fig. 9-17).
Leukemia
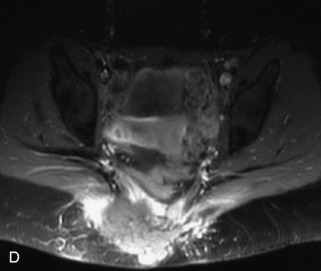
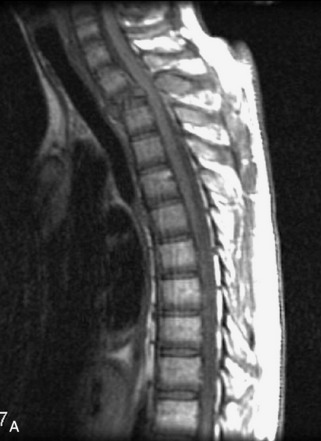
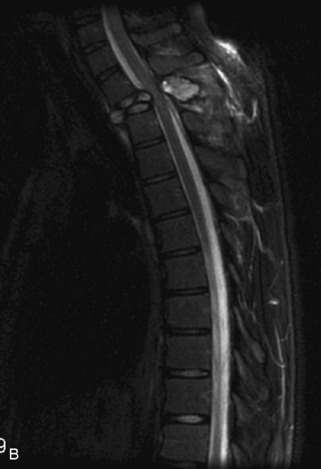
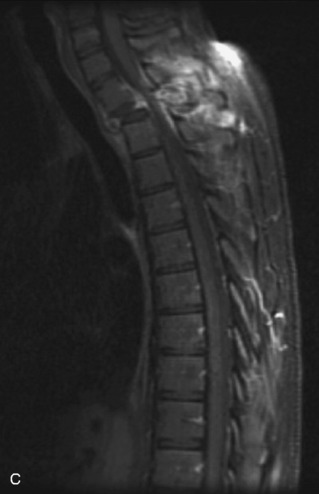
Leukemia is a white blood cell neoplasm with spinal involvement occurring as a component of systemic disease. Radiographs and CT demonstrate diffuse osteopenia often with multiple vertebral fractures and sometimes focal lytic lesions. MRI shows the leukemic marrow and focal masses (chloromas) as relatively low signal on T1WI and hyper-intense on T2WI and STIR with avid enhancement. Acute leukemia occurs frequently in the dura.27 Epidural involvement is not uncommon (Table 9-8 and Figs. 9-18 to 9-20).
Langerhans Cell Histiocytosis
Langerhans cell histiocytosis (LCH) accounts for 1% of all bone tumors and represents an abnormal histiocyte proliferation producing granulomatous skeletal lesions. It encompasses a group of disorders with different clinical presentations, including Hand-Schüller-Christian, Letterer–Siwe, and eosinophilic granuloma. Most patients are between 5 and 15 years old at diagnosis, although LCH may occur in adults.21 LCH presents with one or several destructive vertebral body lytic lesions that are often associated with pathological fracture and sometimes complete loss of height of the vertebral body (vertebra plana).1,22,49,50 Lesions are almost always limited to the vertebral body with no involvement of the posterior elements and sparing of the disc space. A soft tissue mass with spinal canal extension may be seen, but is smaller than seen with other tumors. MRI demonstrates lesions that are hypointense on T1WI, heterogeneously hyperintense on T2WI, and enhance avidly and uniformly.22,31 LCH is often difficult to distinguish from metastatic disease or even infection with imaging (Table 9-9 and Figs. 9-21 and 9-22).
|
• Destructive lytic lesion ± pathologic fracture (vertebra plana), soft tissue mass, spinal canal extension with sparing of the disc space
|
SOLITARY LESIONS
Chordoma
Chordoma is a malignant tumor that arises from notochord remnants and accounts for approximately 4% of primary bone tumors. It typically presents between 40–70 years old and most commonly involves the sacrum (50%), followed by the clivus (35%) and the vertebrae (15%; greatest frequency in the cervical spine).21,45 It is characteristically a slow-growing, lobular, midline soft tissue mass that causes osseous destruction. It may extend into the disc and may involve more than one vertebral level. It also may involve the epidural and perivertebral spaces and enlarge the neural foramina.22,51,52 Chordoma has decreased uptake on bone scan. CT demonstrates a hypodense soft tissue mass with associated bone destruction and occasionally a sclerotic component, and shows amorphous tumoral calcification in almost one-half of cases.31,51 MRI shows a heterogeneous mass that is hypointense to iso-intense to bone marrow on T1WI and hyperintense to cerebrospinal fluid (CSF) on T2WI with variable enhancement. Low signal septa and areas of hemorrhage may be seen within the lesion.22,52 MRI is considered the most useful imaging modality in diagnosing this lesion and characterizing its extent53 (Table 9-10 and Figs. 9-23 to 9-25).
Giant Cell Tumor
Giant cell tumor (GCT) is a locally aggressive neoplasm composed of osteoclast-like giant cells that accounts for less than 5% of all primary bone tumors. GCTs are more common in women than in men and usually occur in the second to fourth decades of life. Seven percent arise in the spine, mainly involving the sacrum, followed by the cervical, thoracic, and lumbar spine in descending frequency.22,31,40,54 GCT is the second most common primary sacral tumor following chordoma. Lesions are locally aggressive and rarely metastasize. Approximately 5–10% of lesions are frankly malignant.54 Typically GCT presents as an expansile lesion in the vertebral body or sacrum with a narrow zone of transition, non-sclerotic margins (on radiographs), and no tumor matrix with or without cortical break-through. GCT may extend into the posterior elements or to adjacent vertebrae, and 10–15% may have an associated aneurysmal bone cyst (ABC) component.31,40,55 Bone scan demonstrates increased uptake on all three phases most prominent at the periphery of the lesion, giving a “doughnut” sign.44 CT shows a soft tissue mass that may have a thin sclerotic rim. MRI demonstrates heterogeneous low to intermediate signal intensity on T1WI and T2WI as a result of presence of hemosiderin and collagen, and shows significant enhancement. Focal cystic areas and hemorrhage may be seen within lesions, and a low signal intensity “pseudocapsule” is commonly visualized22,40,54 (Table 9-11 and Fig. 9-26).
ABC, Aneurysmal bone cyst.
Aneurysmal Bone Cyst
ABCs demonstrate increased peripheral uptake on all three phases of a bone scan with central decreased uptake (doughnut sign).40,44 CT demonstrates an expansile mass with remodeling of bone, thin “egg-shell” overlying cortex, non-sclerotic margins, thin bony septa, and fluid-fluid levels with no tumor matrix. MRI shows a lobulated neural arch mass with extension into the vertebral body containing cystic spaces of varying sizes, septa of variable thickness, a hypo-intense rim of periosteum, and fluid-fluid levels caused by blood products. Typically lesions have only peripheral enhancement. However, a solid variant may occur that has a non-specific appearance and that cannot be differentiated from other tumors by imaging22,31,40,56 (Table 9-12 and Fig. 9-27).
|
• CT shows egg shell cortex, with expansile remodeling of bone, thin non-sclerotic margins, thin bony septa with no tumor matrix, and fluid-fluid levels caused by hemorrhage
|
Osteoid Osteoma
Osteoid osteoma is a benign osteoid-producing tumor that measures less than 1.5 cm in diameter and usually presents between 5 and 25 years of age. It accounts for 10% of benign bone tumors. Approximately 10% occur in the spine, including cortical and cancellous types but not the subperiosteal form.21 A classic history of pain worse at night that is relieved by aspirin may be given. These lesions may present with scoliosis or torticollis (concave to the side of the tumor). Osteoid osteomas are composed of a small, central, lucent, vascular nidus with surrounding sclerotic reactive bone. In the spine, they almost always involve the neural arch (75%), with only 7% occurring in the vertebral body and the remainder seen within the transverse and spinous processes.22,40 A small associated soft tissue mass may be seen but is uncommon.22 Bone scan is positive on all three phases, with marked uptake of tracer by the central nidus and sometimes a lesser degree of uptake by the surrounding osseous reaction, giving a characteristic double-intensity. The CT appearance is often characteristic, demonstrating a central, lucent nidus that may have central calcification and that is surrounded by a variable amount of sclerosis. The nidus is usually low to intermediate signal on T1WI and intermediate to high signal on T2WI. However, in small lesions the nidus may be obscured by surrounding sclerosis, edema, and inflammation, making diagnosis more challenging.40,57 Originally CT was considered more reliable for diagnosis than MRI,58 but MRI with the addition of dynamic gadolinium-enhanced MR sequences has been shown to be highly sensitive for identification of the rapidly enhancing central nidus with delayed enhancement of surrounding reactive bone59 (Table 9-13 and Fig. 9-28).
Osteoblastoma
Osteoblastoma is a benign osteoid-forming tumor that measures more than 1.5 cm and is sometimes referred to as a giant osteoid osteoma. It is less common than osteoid osteoma, accounting for less than 1% of primary bone lesions, and is usually diagnosed in the second and third decades of life. The spine is a common location, accounting for 30–40% of lesions. Most osteoblastomas are centered in the posterior elements (55% of cases), but it is not uncommon to see extension into the vertebral body (42% of cases). On bone scan, increased uptake is present on all three phases. CT demonstrates an expansile lytic lesion with bone remodeling, areas of mineralization, and a sclerotic rim. The MR appearance is typically non-specific with low to intermediate signal on T1WI and intermediate to high signal intensity on T2WI. Extensive peritumoral edema may be seen22,31,40 (Table 9-14).
|
• CT shows sclerotic rim, variable amount of mineralization, ± widespread ill-defined sclerotic bone around lesion
|
Plasmacytoma
Plasmacytoma is a solitary, monoclonal plasma cell tumor of bone or soft tissue with no evidence of multiple myeloma elsewhere. It occurs at a mean age of 55 years. Multiple myeloma may develop 5 to 10 years after diagnosis. The vertebral body is the most common site, and it typically presents as a lytic lesion with or without pathologic fracture. MRI demonstrates a lesion that is low signal on T1WI and high signal on T2WI, with low-signal curvilinear areas on both sequences that represent infolding of bony cortex, which has been referred to as the “mini brain” appearance31,60 (Table 9-15).
Osteochondroma
Osteochondromas (also called exostoses) are cartilage-covered osseous excrescences contiguous with parent bone. Fewer than 5% occur in the spine. The cervical spine is most commonly affected, with particular predilection for the C2 level. Solitary osteochondromas typically present between ages 20 and 30 years. Diagnosis is made one decade earlier in the case of multiple hereditary exostoses. Most lesions involve the posterior elements, usually the spinous or transverse process, but lesions can occasionally arise from the vertebral body. The hallmark of these lesions—continuity with the marrow and cortex of the underlying bone—is demonstrated on both CT and MRI. MRI is useful to assess the cartilage cap from which growth occurs; a cartilage cap greater than 1.5-cm thickness in adults raises concern for malignant degeneration22,31,40 (Table 9-16).
Chondrosarcoma
Chondrosarcoma is a malignant tumor that forms chondroid matrix and involves the spine as its primary site in approximately 3% of cases. Its peak incidence is between 40–60 years of age. Lesions may involve the vertebral body (15%), posterior elements (40%), or both (45%). CT demonstrates an ill-defined lytic lesion that usually has chondroid matrix, which is characterized by ring and arc calcification. Increased uptake is seen on bone scan. Because of high water content, chondrosarcomas are markedly hyperintense on T2WI and low to intermediate signal on T1-weighted sequences. Lesions are often heterogeneous with areas of hemorrhage and areas of low signal as a result of mineralization22,40,45 (Table 9-17).
Osteosarcoma
Osteosarcoma is a sarcoma that produces immature bone that rarely involves the spine as its primary site. It accounts for 5% of all primary malignant tumors of the spine. It presents as an aggressive permeative lesion with a wide zone of transition, cortical break-through, and an associated soft tissue mass that forms osteoid (bone) matrix best demonstrated on CT. MRI shows low signal on T1WI and heterogeneous signal on T2WI as a result of low signal in the mineralized portions.31,40,45 Intense uptake is demonstrated on bone scan44 (Table 9-18).
Ewing Sarcoma
Ewing sarcoma is a round cell sarcoma of bone that may originate in the vertebral body or sacrum but more commonly involves the spine as metastatic disease. Ninety percent of cases occur before 20 years old. The hallmark of Ewing sarcoma is permeative, or “moth-eaten,” bone destruction with exuberant periosteal reaction (including the classic “onion-skin” appearance).31,40,45 Bone scan usually demonstrates intense radiotracer uptake. CT typically demonstrates an ill-defined lytic lesion involving the vertebral body with an associated soft tissue mass. MRI is more sensitive than CT for the extent of marrow involvement but demonstrates non-specific features with heterogeneous low signal on T1WI and high signal on T2WI.40,45 The imaging appearance of Ewing’s sarcoma within the spine is variable, and it may mimic other lesions61 (Table 9-19 and Fig. 9-29).
Neuroblastic Tumors
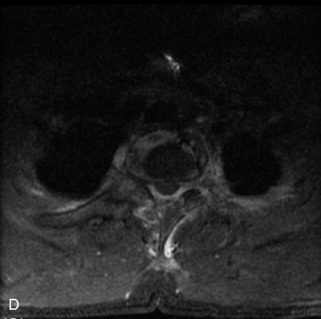
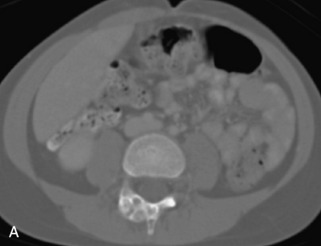
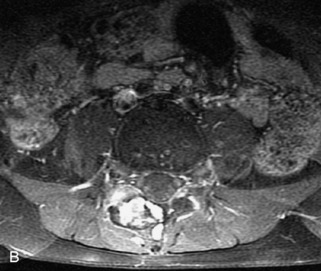
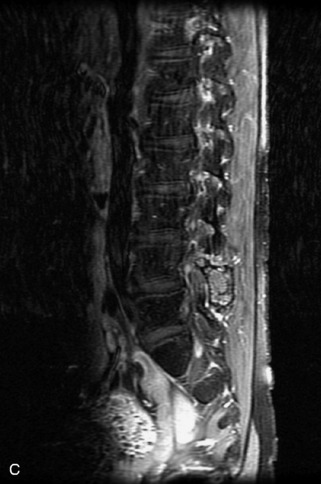
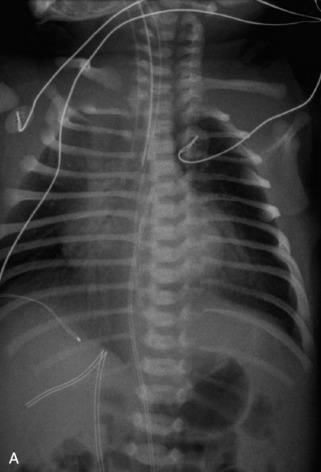
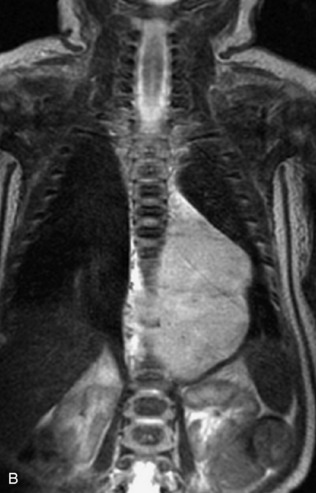
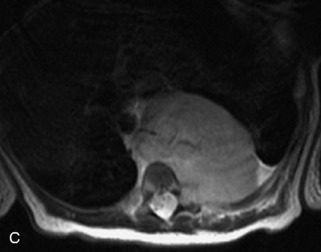
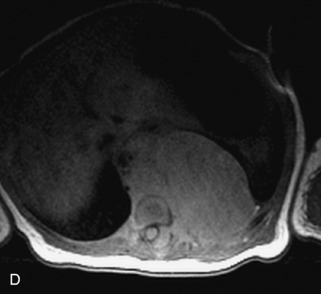
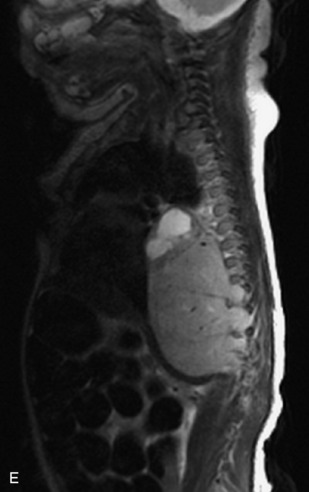
This class of lesions includes ganglioneuroma, ganglioneuroblastoma, and neuroblastoma, which are all embryonal tumors derived from neural crest cells with decreasing degree of cellular differentiation in that order. The majority of neuroblastic tumors are diagnosed by 2 years of age, and these lesions are rarely seen in patients older than 10 years. The classic appearance is of an abdominal or thoracic paraspinal mass that may have intraspinal extension. Radiographs demonstrate a paraspinal soft tissue mass that may have stippled calcification and that causes pedicle erosion, widened neural foramina, splayed intercostal spaces, vertebral body scalloping, and widening of the spinal canal. CT is more sensitive for characterizing the paraspinal soft tissue mass and bony changes, but MRI is most useful for showing epidural involvement and cord compression. Lesions are hypointense to iso-intense on T1WI and are usually mildly hypointense on T2WI as a result of hypercellularity, although patchy hyperintensity can be seen. Lesions typically enhance. Neuroblastic tumors demonstrate increased uptake on both iodine-131-meta-iodobenzylguanidine imaging and FDG PET31,45 (Table 9-20 and Figs. 9-30 to 9-32).
MIBG, Iodine-131-meta-iodobenzylguanidine.
TUMOR MIMICS
A large number of non-neoplastic conditions can be associated with bone marrow signal characteristics and enhancement that may be confused with neoplastic disease, especially by the inexperienced interpreter. These include degenerative changes, infection, anemias, metabolic disorders, bone dysplasias (including Paget disease and fibrous dysplasia), and avascular necrosis. For the most part, these disorders can be differentiated using a combination of clinical information, distribution of the abnormality (such as endplate changes and disc involvement seen in degenerative disease and infection), as well as specific imaging characteristics (such as the “ground glass,” mildly expansile appearance of fibrous dysplasia). An in-depth discussion of these disorders is beyond the scope of this chapter. Even “normal” bone marrow sometimes presents a challenge in imaging, because signal intensity changes occur with aging when cellular red marrow elements are progressively replaced by fatty marrow. There are large inter-individual variations in this process and in the appearance of bone marrow among healthy subjects of the same age.62 Heterogeneous bone marrow may be seen when there are areas of increased red marrow (as a result of anemia, obesity, and high athletic activity, among other causes) or increased yellow marrow (as a result of radiation or degenerative disc disease)31 (Figs. 9-33 to 9-40).
[/level-membership-for-neurosurgery-category][not-level-membership-for-neurosurgery-category]
Chapter 9 Radiographic Evaluation of Lesions within the Vertebrae
IMAGING MODALITIES
Radiographs, radionuclide scintigraphy (most often bone scan), positron-emission tomography (PET), computed tomography (CT), and magnetic resonance imaging (MRI) are the imaging modalities available for evaluating lesions of the vertebrae. Of these, CT and MRI are relied on the most heavily. CT provides useful diagnostic information, characterizing cortical destruction, lesion margins, and tumor matrix, and may demonstrate pathognomonic features for specific lesions. MRI is the most sensitive tool for detecting infiltration of bone marrow and for assessment of extension into the spinal canal and compression of the spinal cord and nerve roots.1–5 Patients should be cleared for MRI contraindications before undergoing imaging. A discussion of contraindications is beyond the scope of this chapter, but a useful reference is Shellock’s Reference Manual for Magnetic Resonance Safety, Implants, and Devices.6 Of note, metallic implants for spinal fusion are not a contraindication, but may create magnetic susceptibility artifacts, which are greatest on fat saturated images and gradient echo (GRE) sequences and are minimized with the fast spin echo (FSE) technique.7 When assessing the spine, sagittal spin echo T1-weight images (T1WI) and T2-weighted images (T2WI) with axial GRE or FSE T2WI images are part of our routine protocol. In the evaluation of neoplastic processes, post-gadolinium images and STIR (short tau inversion recovery, a fat saturated T2-weighted sequence) have been shown to increase sensitivity for detection of disease.8–10 Although some proponents advocate use of STIR instead of gadolinium-enhanced images for screening of vertebral body pathology,11,12 post-gadolinium fat saturated images may add clinically important information in cases of abnormal STIR images.13 Diffusion weighted imaging (DWI) has shown promise for differentiating benign from pathological fractures.14–17 However, there are some reservations about DWI’s specificity in this setting,18 and DWI has shown to be no better than conventional imaging in the absence of a fracture.19 For now, DWI remains unproven and technically challenging in the spine (Tables 9-1 and 9-2 and Figs. 9-1 and 9-2).
Table 9-1 Common MRI Sequences for Evaluation of Spinal Tumors
| T1-weighted SE | Marrow in adults has high signal because of fat Marrow signal lower than intervertebral disc indicates infiltrative process20 |
| T2-weighted FSE | High signal lesions may be inconspicuous on background of high signal marrow using FSE technique without fat saturation |
| T1-weighted + gadolinium | Without fat saturation, enhancing vertebral lesions may become less conspicuous8 Sequence useful for characterizing epidural, intradural, and paraspinal disease |
| STIR | Fat saturated T2-weighted sequence Shown to have better homogeneity of fat saturation than FSE T2 with fat saturation10 Lesions usually hyperintense on background of dark normal marrow |
SE, spin echo; FSE, fast spin echo; STIR, short tau inversion recovery.
Table 9-2 Classification of Vertebral Body Lesions
| Multiple Lesions | Solitary Lesions | Tumor Mimics |
|---|---|---|
| Hemangiomas | Chordoma | Infection |
| Metastases | Plasmacytoma | Heterogeneous marrow |
| Multiple myeloma | Giant cell tumor | Paget disease |
| Lymphoma | Aneurysmal bone cyst | Fibrous dysplasia |
| Leukemia | Osteoid osteoma | Renal osteodystrophy |
| Langerhans’ cell histiocytosis | Osteoblastoma | Anemia |
| Osteochondroma | Avascular necrosis | |
| (These lesions also may present as solitary lesions within the spine) | Osteogenic sarcoma | Kümmell’s disease |
| Chondrosarcoma | ||
| Ewing sarcoma | ||
| Neuroblastic tumors |
MULTIPLE LESIONS
Hemangiomas
Hemangiomas are benign vascular tumors that occur in more than 10% of adults and are commonly detected as an incidental finding on imaging studies performed for unrelated indications. They are the most common primary bone tumor in adults, occur most commonly in the thoracic spine, and are usually solitary but can be multiple in approximately 30% of cases.1,2,21 They typically arise in the vertebral body but may involve the posterior elements. The CT appearance of a low attenuation lesion with coarse trabeculae throughout (giving a “polka-dot” appearance in cross-section) is diagnostic.22 MRI demonstrates the fatty stroma, which is bright on T1WI and iso-intense to hyperintense to marrow on T2WI, with avid enhancement after administration of gadolinium.23 Bone scan is typically normal.24 An aggressive subtype of hemangioma is recognized that tends to be associated more commonly with epidural extension and pathological fracture. These lesions are often iso-intense to hypointense to marrow on T1WI and can be impossible to distinguish from a malignant lesion, such as a metastasis, on imaging (Table 9-3 and Figs. 9-3 to 9-6).25,26
STIR, Short tau inversion recovery.
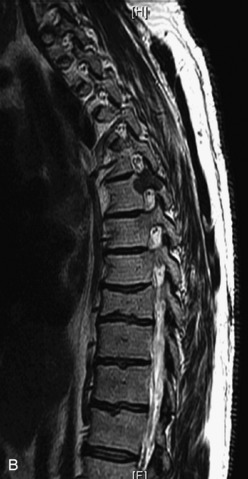
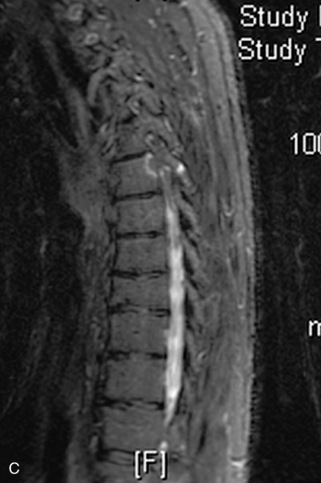
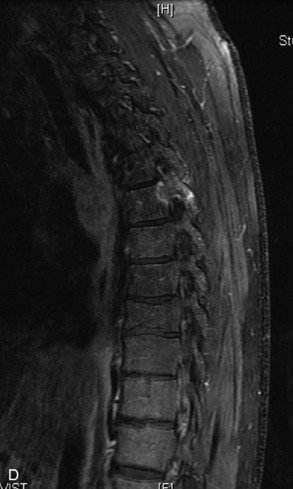
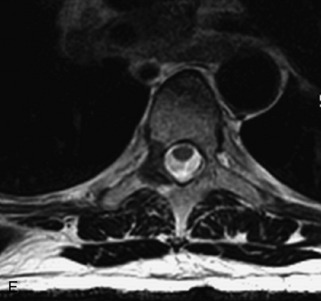
Fig. 9-4 Typical benign hemangiomas may sometimes have high signal on STIR images. A, Sagittal T1WI demonstrates a well-circumscribed hyperintense lesion within the L2 vertebral body consistent with a hemangioma. B, Sagittal T2WI demonstrates high signal within this lesion confirming the diagnosis of hemangioma. C, Sagittal STIR image. Unlike the previous example in Figure 9-3, high signal is seen within the L2 hemangioma on STIR. This does not change the diagnosis of hemangioma.
Metastases
Metastatic disease is defined as dissemination or extension of tumor by direct, hematogenous, or lymphatic routes. Metastases are the most common malignancy to affect the spinal column. Bone metastases occur in 50% of all cancer patients, and 40–70% of these lesions are located within the vertebrae.27 In adults, breast, lung, prostate, lymphoma, sarcoma, and kidney account for the majority of primary sites. In children, neuroblastoma and Ewing sarcoma are the most common primary malignancies to metastasize to the spine.21,28 Metastases typically involve the vertebral body and posterior elements, and compression fractures as well as extension into the epidural space are common features. Most lesions have a lytic appearance on radiographs and CT, but blastic or sclerotic metastases can occur, especially in the setting of prostate carcinoma.1,2 Bone scan traditionally has been used to screen for metastatic disease to the spine. It has a sensitivity of approximately 95%, but can have false negatives if there is only marrow infiltration without cortical involvement, and is often non-specific. MRI has been shown to be both more sensitive and specific than scintigraphy.3 Radiographs are insensitive to assess for metastatic disease, requiring at least 50–70% bone destruction for detection of lesions.27,29,30 Classic radiographic signs include an absent or sclerotic pedicle, cortical destruction, and paraspinal soft tissue mass.29–31 CT is more sensitive than radiographs to detect bony destruction, sclerosis, and paraspinal masses but is less sensitive than MRI and is poor for assessment of cord compression. On MRI, lesions are typically hypointense to normal marrow and intervertebral discs on T1WI, usually hyperintense on T2WI, and demonstrate heterogeneous enhancement.1,2 In the case of epidural extension, the “draped curtain” sign has been described, whereby there is sparing of the midline because of an intact midline septum that attaches the dura anteriorly to the posterior longitudinal ligament, in contrast to infection, which does not spare the midline.32 When pathologic fracture occurs as a result of an underlying metastasis, restricted diffusion may be helpful to distinguish the metastatic lesion from a benign osteoporotic fracture14–17 (Table 9-4 and Figs. 9-7 to 9-10).
Pathological vs. Benign Compression Fractures
Vertebral compression fractures in the absence of trauma are a common clinical problem in the elderly population. Although clinical history is helpful, up to one-third of fractures in patients with known primary malignancy are benign, and approximately one-quarter of fractures in apparently osteopenic patients are caused by metastases.31 Diagnosis of an underlying lesion is important because it influences clinical staging, treatment planning, and prognosis for the patient. In the chronic setting, the differentiation between pathologic fracture as a result of underlying malignancy and benign osteoporotic fracture is fairly simple and can be made with a high level of certainty.33,34 Marrow signal of chronic benign fractures is iso-intense to normal bone marrow on all sequences, whereas fractures associated with metastases demonstrate low signal intensity on T1-weighted sequences and high signal intensity on T2-weighted sequences.33,35 STIR images provide the greatest contrast between normal and abnormal bone marrow.33 Acute compression fractures, however, may share many of the imaging findings of metastatic lesions, and differentiation is more challenging.35,36 Features that favor acute benign osteoporotic fractures include retropulsion of a bony fragment, preservation of normal marrow signal intensity, a horizontal band-like pattern of low signal intensity on T1WI and T2WI, and the presence of other compression fractures.37,38 Features more likely to be seen in metastatic compression fractures include pedicle involvement, an associated focal paraspinal soft tissue mass or epidural mass (particularly one encasing the dural sac), convex posterior cortex, diffuse low signal intensity within the vertebral body on T1WI, and the presence of other metastases.35,37–30 Some studies have suggested that a pattern of intense or heterogeneous contrast enhancement supports diagnosis of metastatic compression fracture, but this finding is inconsistent in the literature and may not be reliable.34,35,37,39 There has been increasing interest in the use of diffusion weighted imaging for differentiating benign vertebral fractures from those associated with metastases, with early results showing that reduced diffusion is highly specific for diagnosing an underlying metastatic lesion.14–17 However, even this technique is not foolproof18 and either bone biopsy or follow-up imaging is often required (Table 9-5 and Figs. 9-11 to 9-14).
Table 9-5 Imaging Features to Differentiate Benign Fracture from Malignancy
| Benign Osteoporotic Fracture | Malignant Lesion with Fracture |
|---|---|
| Acute Preservation of normal bone marrow signal Retropulsed bone fragment Horizontal band-like low signal intensity Presence of other compression fractures |
Acute Diffuse low signal intensity on T1WI Pedicle involvement Convex posterior cortex Epidural soft tissue mass Focal paraspinal soft tissue mass Presence of other metastases |
| Chronic Preservation of normal bone marrow signal |
Chronic Bone marrow replacement with abnormal signal—low signal on T1WI, high on T2WI |
Multiple Myeloma
Multiple myeloma is a multifocal malignant proliferation of monoclonal plasma cells that occurs most commonly in men older than 60 years. Diagnosis is confirmed by bone biopsy or by demonstrating Bence Jones proteins (free light chains) in urine or monoclonal gammopathy in serum. Although it is the most common primary bone malignancy, multiple myeloma accounts for only 1% of all cancers.31 The axial skeleton is more commonly involved than long bones. Vertebral body destruction and fractures are common with spine involvement.40 Punched out lytic bone lesions, diffuse osteopenia, fractures, and, rarely, sclerotic lesions are the hallmarks of disease on CT and radiographs.1 MRI findings reflect a number of different patterns of bone marrow involvement. These patterns include microscopic infiltration with normal MRI appearance in up to 20%, focal lesions, homogeneous diffuse infiltration of the bone marrow (best seen as low signal on T1WI), combined diffuse and focal disease, and a heterogeneous/variegated pattern with interposition of fat islands giving a “salt and pepper” appearance.41 Marrow involvement or lesions are typically hypointense on T1WI, hyperintense on T2WI and STIR images, and enhance avidly with gadolinium. MRI is helpful for following treatment response, with decreased T2 signal abnormality and decreased enhancement representing good prognostic signs.42,43 Bone scan has limited sensitivity, detecting bone involvement in 75% of myeloma patients and only demonstrating 10% of lesions. However, technetium (Tc)-99m-sestamibi scintigraphy is both sensitive and specific for diagnosing myeloma lesions and is complementary to bone scan. Fluorodeoxyglucose (FDG) PET is gradually assuming an increasingly important role in following response to treatment44 (Table 9-6 and Figs. 9-15 and 9-16).
|
Buy Membership for Neurosurgery Category to continue reading. Learn more here
[/not-level-membership-for-neurosurgery-category] |
