Quality Assurance and Quality Control
At the conclusion of this chapter, the reader should be able to:
• Identify the regulatory and accrediting organizations that influence quality assessment in clinical laboratories.
• Describe the eight nonanalytical factors related to testing accuracy.
• Identify and give examples of the three categories of errors related to the phase of testing.
• Define the terms accuracy, precision, reproducibility, and reliability.
• Describe the use of the coefficient of variation and give the formula.
• Define true positive, true negative, false positive, and false negative.
• Provide the equations for calculating percentage sensitivity and percentage specificity.
• Define positive predictive value and negative predictive value.
• Describe the process of proficiency testing.
• Explain the use of control specimens.
• Cite seven causes for a control value being out of the acceptable range or out of control.
• Define the terms mean, median, mode, standard deviation, and reference range.
• Discuss issues related to testing outcomes.
• Describe parallel testing of test kits.
• Describe how a new procedure is validated.
• Write and evaluate a procedural write-up using CLSI requirements.
• Correctly answer case study–related multiple choice questions.
• Be prepared to participate in a discussion of critical thinking questions.
Nonanalytical Factors Related To Testing Accuracy
Qualified Personnel
The competence of personnel is an important determinant of the quality of the laboratory result. Only properly certified personnel can perform nonwaived assays (see Chapter 9 for levels of laboratory testing).
Inaccurate Results
Inaccuracies in testing can be systematic or sporadic. Systematic errors can be eliminated by a program that monitors equipment, reagents, and other supplies. Sporadic or isolated errors in technique can produce false-positive and false-negative results, depending on the technique used for testing (Box 7-2).
Errors Related to Phase of Testing
Errors occurring during the analytical phase of testing in clinical laboratories are now relatively rare. Currently, most laboratory errors are related to the preanalytical and postanalytical phases of testing. To guarantee the highest quality laboratory results and to comply with CLIA regulations, various preanalytical factors need to be considered (Boxes 7-3 and 7-4).
Quality Descriptors


Monitoring Quality
Proficiency Testing
Control Specimens
1. Deterioration of reagents or standards
2. Faulty instrument or equipment
4. Lack of attention to timing or incubation temperature
5. Use of a method not suited to the needs and facilities of the laboratory
6. Use of poor technique by the technologist doing the test
7. Statistics: a certain percentage of all determinations will be statistically out of control.
Reference Range Statistics
In analytical immunology and serology testing using methods such as enzyme immunoassay, quantitative reference range statistics can be used. Statistically, the reference range for a particular measurement is usually related to a normal, bell-shaped curve (Fig. 7-1). This Gaussian curve has been shown to be correct for almost all types of biological, chemical, and physical measurements. A statistically valid series of individuals who are thought to represent a normal healthy group are measured and the average value is calculated. This mathematical average is defined as the mean ( , called the X-bar). The distribution of all values around the average for the particular group measured is described statistically by SD.

Mean Mathematical average calculated by dividing the sum of all individual values by the number of values
Median Middle value in a body of data; if all the variables are arranged in order of increasing magnitude, the median is the variable that falls halfway between the highest and lowest variables.
Use of the mean, median, and mode is explained in the following example:
The mode is the value most frequently occurring value, or 2 in this example.
The standard deviation is the square root of the variance of the values in any one observation or in a series of test results. In a normal population, 68% of the values will be clustered above and below the average and defined statistically as falling within the first standard deviation (±1 SD; see Fig. 8-1). The second standard deviation (±2 SD) represents 95% of the values falling equally above and below the average, and 99.7% is included within the third standard deviation (±3 SD). (Again, variations occur equally above and below the average value [or mean] for any measurement.) Thus, in determining reference values for a particular measurement, a statistically valid series of people are chosen and assumed to represent a healthy population. These people are then tested and the results are averaged.
Validating New Procedures
Parallel Testing of Test Kits
The CAP asserts that CLIA-waived assays are not recognized and the laboratory must treat all tests the same way. It is best to check the immunology checklist at www.cap.org for the latest revisions to questions related to kits. Currently, CAP checklist question IMM.33150 (phase II) is “Are new reagent lots checked against old reagent lots, or with suitable reference material before, or concurrently with, being placed in service?”
A CLIA inspection focuses on the following:
• If the test is moderate or of high complexity and the change is to a new kit manufacturer, the new test kit must be validated for accuracy and precision. This can be done with controls, other known samples, or comparison with an old kit. If the laboratory is receiving a new lot shipment of the same test kit, only controls need to be done, or whatever the manufacturer requires.
• If the test is a waived test, a laboratory only needs to follow the manufacturer’s directions if a new test is put into use or if there is a lot change of a current test. This rule is also applicable if the waived test is being performed in a moderate- or high-complexity laboratory. If an assay is waived anywhere, it is performed under CLIA requirements.
 instructor site for the discussion of these questions.
Validation of a New Procedure Write-Up
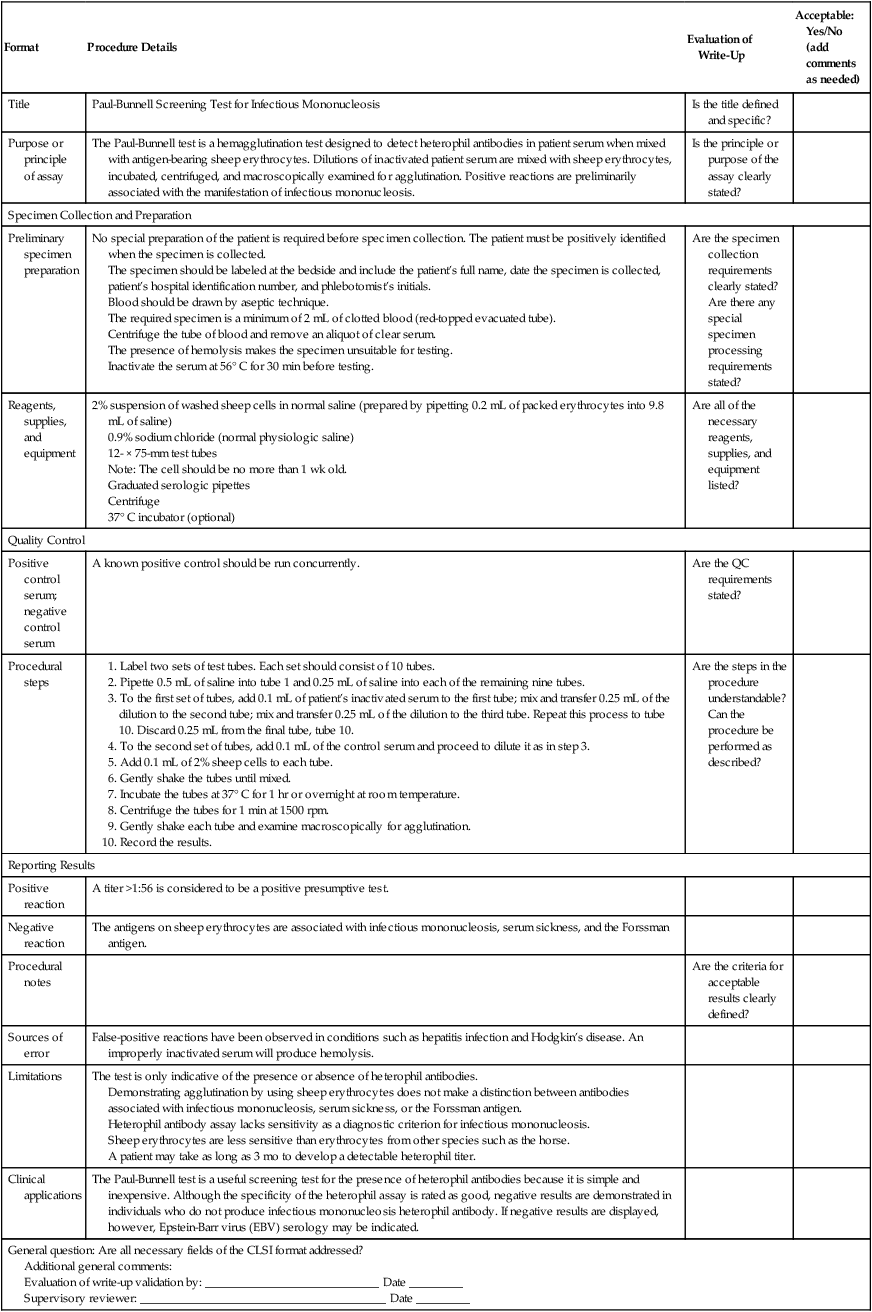
Procedure Validation Checklist Example: Traditional Screening Test for Infectious Mononucleosis
| Format | Procedure Details | Evaluation of Write-Up |
Acceptable: Yes/No (add comments as needed) |
| Title | Paul-Bunnell Screening Test for Infectious Mononucleosis | Is the title defined and specific? | |
| Purpose or principle of assay | The Paul-Bunnell test is a hemagglutination test designed to detect heterophil antibodies in patient serum when mixed with antigen-bearing sheep erythrocytes. Dilutions of inactivated patient serum are mixed with sheep erythrocytes, incubated, centrifuged, and macroscopically examined for agglutination. Positive reactions are preliminarily associated with the manifestation of infectious mononucleosis. | Is the principle or purpose of the assay clearly stated? | |
| Specimen Collection and Preparation | |||
| Preliminary specimen preparation | No special preparation of the patient is required before specimen collection. The patient must be positively identified when the specimen is collected. The specimen should be labeled at the bedside and include the patient’s full name, date the specimen is collected, patient’s hospital identification number, and phlebotomist’s initials. Blood should be drawn by aseptic technique. The required specimen is a minimum of 2 mL of clotted blood (red-topped evacuated tube). Centrifuge the tube of blood and remove an aliquot of clear serum. The presence of hemolysis makes the specimen unsuitable for testing. Inactivate the serum at 56° C for 30 min before testing. |
Are the specimen collection requirements clearly stated? Are there any special specimen processing requirements stated? |
|
| Reagents, supplies, and equipment | 2% suspension of washed sheep cells in normal saline (prepared by pipetting 0.2 mL of packed erythrocytes into 9.8 mL of saline) 0.9% sodium chloride (normal physiologic saline) 12- × 75-mm test tubes Note: The cell should be no more than 1 wk old. Graduated serologic pipettes Centrifuge 37° C incubator (optional) |
Are all of the necessary reagents, supplies, and equipment listed? | |
| Quality Control | |||
| Positive control serum; negative control serum | A known positive control should be run concurrently. | Are the QC requirements stated? | |
| Procedural steps |
1. Label two sets of test tubes. Each set should consist of 10 tubes. 2. Pipette 0.5 mL of saline into tube 1 and 0.25 mL of saline into each of the remaining nine tubes. 3. To the first set of tubes, add 0.1 mL of patient’s inactivated serum to the first tube; mix and transfer 0.25 mL of the dilution to the second tube; mix and transfer 0.25 mL of the dilution to the third tube. Repeat this process to tube 10. Discard 0.25 mL from the final tube, tube 10. 4. To the second set of tubes, add 0.1 mL of the control serum and proceed to dilute it as in step 3. 5. Add 0.1 mL of 2% sheep cells to each tube. 6. Gently shake the tubes until mixed. 7. Incubate the tubes at 37° C for 1 hr or overnight at room temperature. 8. Centrifuge the tubes for 1 min at 1500 rpm. 9. Gently shake each tube and examine macroscopically for agglutination. |
||
Can the procedure be performed as described?
Demonstrating agglutination by using sheep erythrocytes does not make a distinction between antibodies associated with infectious mononucleosis, serum sickness, or the Forssman antigen.
Heterophil antibody assay lacks sensitivity as a diagnostic criterion for infectious mononucleosis.
Sheep erythrocytes are less sensitive than erythrocytes from other species such as the horse.
A patient may take as long as 3 mo to develop a detectable heterophil titer.
Additional general comments:
Evaluation of write-up validation by: _____________________________ Date _________
Supervisory reviewer: _________________________________________ Date _________
Adapted from Paul JR, Bunnell WW: The presence of heterophil antibodies in infectious mononucleosis, Am J Med Sci 183:90–104, 1932; and Sumaya CV: Infectious mononucleosis and other EBV infections: diagnostic factors, Lab Manage 24:37–45, 1986.
Chapter Highlights
• Quality assurance indicators and quality control (QC) are tools to ensure that reported laboratory results are of the highest quality.
• The Clinical Laboratory Improvement Amendments of 1988 (CLIA ’88) established a minimum threshold for all aspects of clinical laboratory testing.
• Voluntary QC standards have been set by TJC, COLA, and CAP.
• Nonanalytical factors related to testing accuracy include the following: qualified personnel; established policies; procedure manual; test requisitioning; patient identification, specimen procurement, and labeling; preventive maintenance of equipment; appropriate testing methods; and inaccurate results.
• The Institute for Quality Laboratory Medicine has developed measures to evaluate quality in the laboratory based on the phase of testing: preanalytical, analytical, and postanalytical.
• Quality control monitors the accuracy and reproducibility of results through control specimens. Accuracy describes how close a test result is to the true value. Precision describes how close the test results are to one another when repeated analyses of the same specimen are performed. It is possible to have great precision, but without accuracy if the answer does not represent the actual value tested.
• The precision of a test, its reproducibility, may be expressed as a standard deviation (SD) or the derived coefficient of variation (CV); it is used to compare SDs of two samples. A procedure may be extremely accurate but so difficult that values are not clinically meaningful.
• Assessing sensitivity and specificity of a test involves tests positive, tests negative, disease present (positive), and disease absent (negative). Sensitivity is the proportion of subjects with a specific disease or condition who have a positive test result. Specificity is the proportion of subjects without the specific disease or condition who have a negative test result.
• Assessing the predictive value (PV) requires knowledge of the sensitivity, specificity, and disease prevalence. Prevalence is the proportion of a population who has the disease. Incidence is the number of subjects who have the disease within a defined period per 100,000 population.
• Proficiency testing (PT) is incorporated into the CLIA requirements. In addition to internal QC programs, each laboratory should participate in an external PT program to verify laboratory accuracy.
• A control specimen has a known value and is similar in composition to the patient’s blood. A control value out of the acceptable range (out of control) may result from the deterioration of reagents, faulty equipment, dirty glassware, lack of attention to timing or temperature, use of inappropriate methods, or poor technique.
• Reference range for a particular measurement is usually a normal bell-shaped curve.
• Mean is the mathematical average of the values. Median is the middle value. Mode is the most frequently occurring value. Standard deviation (SD) is the square root of the variance of the values.
• Reference range is the range of values that includes 95% of the test results for a healthy reference population, formerly referred to as normal values or normal range.
• Biometrics attempts to describe statistical variations in biological observation.
• Each laboratory must determine the reproducibility for each new procedure and establish acceptable limits of variation for control specimens.