208 Quality and Patient Safety in Emergency Medicine
 Key Points
• The great variability in local and regional clinical practice patterns indicates that the U.S. population does not consistently receive high-quality health care. Problems with overuse, underuse, and misuse of health care resources have been documented.
• Two watershed Institute of Medicine reports brought the quality problems in health care to center stage. These reports championed that health care should be safe, effective, patient-centered, timely, efficient, and equitable.
• The greatest sources of quality problems in health care are not “bad apples” (i.e., incompetent providers), but rather “bad systems,” specifically systems that promote, or at least do not mitigate, predictable human errors.
• Medical errors and adverse events are caused by both active and latent failures, as well as factors (e.g., error-producing conditions or reliance on heuristics) that lead to cognitive errors (e.g., slips, lapses, premature closure). Diagnostic errors are a leading cause of patient safety issues in emergency medicine. High-reliability organizations are preoccupied with failures and serve as models for health care.
• Both public and private sectors have a strong movement away from purchasing health care services by volume and toward purchasing value (defined as health care value per dollar spent). Future reimbursement models will inevitably center on performance measurement and accountability, with a likely shift in level of financial risk borne from payer to provider.
History of Health Care Quality
Efforts to assess quality in health care extend back to Dr. Ernest A. Codman, an early twentieth-century surgeon at Massachusetts General Hospital in Boston. Codman was the first to advocate for the tracking and public reporting of “end results” of surgical procedures and initiated the first morbidity and mortality conferences.1 Such public information would allow patients to choose among surgeons and surgeons to learn from better performers. Codman was clearly ahead of his time. The medical establishment resisted having their “results” measured and publicized, and Codman was accordingly ostracized by his peers. In 1913, however, the American College of Surgeons adopted Codman’s proposal of an “end result system of hospital standardization” and went on to develop the Minimum Standard for Hospitals. These efforts led to the formation of the forerunner of today’s Joint Commission (JC) in the 1950s. The JC’s accreditation process, local hospital quality reviews, professional boards, and other systems that developed allowed the medical profession and hospitals to judge the quality of their work and be held accountable only to themselves for most of the twentieth century.
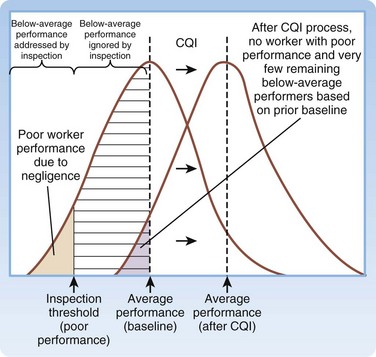
The academic science of quality management in health care is credited to Dr. Avedis Donabedian’s efforts in the 1980s. Donabedian advocated for evaluating health care quality through assessment of structure (e.g., physical plant, personnel, policies and procedures), process (how things are done), and outcome (final results).2 His ideas were first adopted in public health and later spread to administration and management. Shortly thereafter, Dr. Donald Berwick, a Harvard Medical School (Boston) pediatrician, building on a systems approach to quality management, introduced the theory of continuous quality improvement into the medical literature. In his landmark New England Journal of Medicine article,3 Berwick remarked the that the “Theory of Bad Apples” relies on inspection to improve quality (i.e., find and remove the bad apples from the lot). In health care, those who subscribe to this theory seek outliers (deficient health care workers who need to be punished) and advocate a blame and shame culture through reprimand in settings such as morbidity and mortality conferences. The “Theory of Continuous Improvement,” however, focuses on the average worker, not the outlier, and on systems problems, rather than an individual’s failure.
Examples of bad systems abound in medicine. One example provided by Berwick involves the reported deaths resulting from an inadvertent mix-up of racemic epinephrine and vitamin E.4 Newborns in a nursery received the epinephrine instead of the vitamin in their nasogastric tubes. If presented as the mix-up of a benign medication for a potentially toxic one, it is viewed as appalling, and blaming individual negligent behavior is easy. Yet when one notes that the two bottles were nearly identical, one can understand why the system “is perfectly designed to kill babies by ensuring a specific—low but inevitable—rate of mixups.” The Theory of Continuous Improvement suggests that quality can be improved by improving the knowledge, practices, and engagement of the average worker and by improving the systems environment in which they work. The “immense, irresistible quantitative power derived from shifting the entire curve of production upward even slightly, as compared with a focus on trimming the tails” is what makes a systems focus so attractive (Fig. 208.1).
Although Berwick and others were publishing new studies critiquing health care’s approach to quality and safety throughout the 1980s and 1990s, not until the publication of two reports by the Institute of Medicine (IOM) did quality and safety capture the public’s attention: To Err is Human: Building a Safer Health System,5 in 1999, and Crossing the Quality Chasm: A New Health System for the 21st Century,6 in 2001.
To Err is Human focused the attention of the U.S. public on patient safety and medical errors in health care. The report’s most famous sound bite, that medical errors result in the deaths of two jumbo jetliners full of patients in U.S. hospitals each day, gained traction with lawmakers, employers, and patient advocacy groups. This estimate, that 44,000 to 98,000 deaths occur per year in the United States as a result of medical error, would make hospital-based errors the eighth leading cause of death in the United States, ahead of breast cancer, acquired immunodeficiency syndrome, and motor vehicle crashes. These statistics were derived from two large retrospective studies. In the Harvard Medical Practice Study,7 nurses and physicians reviewed more than 30,000 hospital records and found that adverse events occurred in 3.7% of hospitalizations. Of these adverse events, 13.6% were fatal, and 27.6% were caused by negligence. The Colorado-Utah study8 reviewed 15,000 hospital records and found that adverse events occurred in 2.9% of hospitalizations. Negligent adverse events accounted for 27.4% of total adverse events in Utah and for 32.6% of those in Colorado. Of these negligent adverse events, 8.8% were fatal. Extrapolation of results from these two studies provided the upper and lower limits for deaths associated with medical errors for the IOM report. In both studies, compared with other areas of the hospital, the emergency department (ED) had the highest proportion of adverse events resulting from negligence.
Crossing the Quality Chasm focused more broadly on redesign of the health care delivery system to improve the quality of care. The report begins by stating: “The American health care delivery system is in need of fundamental change. … Between the health care we have and the care we could have lies not just a gap, but a chasm.” The report goes on to detail that this chasm exists for preventive, acute, and chronic care and reflects overuse (provision of services when potential for harm exceeds potential for benefit), underuse (failure to provide services when potential for harm exceeds potential for benefit), and misuse (provision of appropriate services, complicated by a preventable error, such that the patient does not receive full benefit). The report first defined six domains for classifying quality improvement for the health care system (Table 208.1). Together, the IOM reports solidified a key concept—quality problems are generally not the result of bad apples but of bad systems. In fact, well-intentioned, hard-working people are routinely defeated by bad systems, regardless of training, competence, and vigilance.
Table 208.1 Institute of Medicine’s Six Aims for Quality Improvement
| AIM | DEFINITION |
|---|---|
| Health Care Should Be: | |
| Safe | “Avoiding injuries to patients from care that is intended to help” |
| Effective | “Providing services based on scientific knowledge (avoiding underuse and overuse)” |
| Patient centered | “Providing care that is respectful of and responsive to individual patient preferences, needs, and values and ensuring that patient values guide all clinical decisions” |
| Timely | “Reducing waits and sometimes harmful delays for both those who receive and those who give care” |
| Efficient | “Avoiding waste, in particular waste of equipment, supplies, ideas, and energy” |
| Equitable | “Providing care that does not vary in quality because of personal characteristics such as gender, ethnicity, geographic location, and socioeconomic status” |
Adapted from Committee on Quality Health Care in America. Crossing the quality chasm: a new health system for the 21st century. Washington, DC: National Academies Press; 2001.
Costs in Health Care
In 2009, the United States spent $2.5 trillion, or $8000 per person, on health care.9 Although we spend well over twice as much per capita on health care than any other industrialized country, we repeatedly fare poorly when compared with other systems on quality and outcomes.10 Half of the U.S. population admits to being very worried about paying for health care or health care insurance.11 One in four persons in the United States reports that his or her family has had problems paying for medical care during the past year.12 Close to half of all bankruptcy filings are partly the result of medical expenses.13 U.S. businesses similarly feel shackled by health care costs, with reports of companies spending more on health care than on supplies for their main products. In Massachusetts, annual health care costs in school budgets outpaced state aid for schools and forced schools to make spending cuts in books and teacher training.14 The increased cost of U.S. health care threatens the ability of our society to pay for other needed and wanted services.
Variability in Health Care
Although the number of errors coupled with increasing health care costs paints a negative picture, the variability of care is both more concerning and a source for optimism. Dr. John (Jack) E. Wennberg’s work in regional variability has illustrated the differences in cost, quality, and outcomes of U.S. health care since the 1970s. In 1973, Wennberg and Gittelsohn15 first identified the extreme degree of variability that exists in clinical practice by documenting that 70% of women in one Maine county had hysterectomies by the age of 70 years, as compared with 20% in a nearby county with similar demographics. Not surprisingly, the rate of hysterectomy was directly proportional to the physical proximity of a gynecologist. Similarly, residents of New Haven, Connecticut are twice as likely to undergo coronary artery bypass grafting (CABG), whereas patients in Boston are twice as likely to undergo carotid endarterectomy, even though both cities are the home of top-rated academic medical centers.16
Dr. Wennberg’s work in regional variability led to the creation in the 1990s of the Dartmouth Atlas Project, which maps health care use and outcomes for every geographic region in the United States, and details care down to the referral region of each hospital. Atlas researchers, notably Dr. Elliott Fisher et al.,17,18 have looked at the pattern of health care delivery and have found no clear association between the volume, intensity, or cost of care and patient outcomes. According to the Dartmouth Atlas Project, patients in areas of higher spending receive 60% more care, but the quality of care in those regions is no better, and at times worse, when key quality measures are compared.17,18 More widely reported in the lay press was the finding that Medicare spends twice the national average per enrollee in McAllen, Texas than it does any other part of the country, including other cities in Texas, without better-quality outcomes.19 The increased expense comes from more testing, more hospitalizations, more surgical procedures, and more home care. Variability in practice pattern, however, is not limited to overuse, but also includes underuse. McGlynn et al.20 found that, in aggregate, the U.S. population receives only 55% of recommended treatments, regardless of whether preventive, acute, or chronic care is examined.
The findings of the Dartmouth Atlas Project have frequently been cited as a rationale for health care reform law. The Project’s underlying methodology, however, has been scrutinized. Some investigators have questioned whether it appropriately adjusts for the costs of medical practice in different regions. Others have pointed out the limitations of focusing analysis on health care costs incurred by patients over the 2 years before their deaths and attributing these costs to the hospital most frequently visited.21 A study by Romley et al.22 reported an inverse relationship between hospital spending and inpatient mortality. Although great variability clearly exists in clinical practice, what is not clear is how to translate maps of geographic variation into health care policies that improve quality and contain costs.
Institute of Medicine Aim: Patient Safety
Echoing the ancient axiom of medicine, Primum non nocere, or “First, do no harm,” patients expect not to be harmed by the very care that is intended to help them. As such, patient safety is the most fundamental of the IOM’s six domains. Tables 208.2 and 208.3 provide the IOM’s Patient Safety and Adverse Event Nomenclature.
Table 208.2 Institute of Medicine’s Patient Safety and Adverse Event Nomenclature
| TERM | DEFINITION |
|---|---|
| Safety | Freedom from accidental injury |
| Patient safety | Freedom from accidental injury; involves the establishment of operational systems and processes that minimize the possibility of error and maximize the probability of intercepting errors when they occur |
| Accident | An event that damages a system and disrupts the ongoing or future output of the system |
| Error | The failure of a planned action to be completed as intended or the use of a wrong plan to achieve an aim |
| Adverse event | An injury caused by medical management rather than by the underlying disease or condition of the patient |
| Preventable adverse event | Adverse event attributable to error |
| Negligent adverse event | A subset of adverse event meeting the legal criteria for negligence |
| Adverse medication event | Adverse event resulting from a medication or pharmacotherapy |
| Active error | Error that occurs at the front line and whose effects are felt immediately |
| Latent error | Error in design, organization, training, or maintenance that is often caused by management or senior-level decisions; when expressed, these errors result in operator errors but may have been hidden, dormant in the system for lengthy periods before their appearance |
Adapted from Kohn LT, Corrigan J, Donaldson MS, McKenzie D. To err is human: building a safer health system. Washington, DC: National Academies Press; 2000.
Table 208.3 Active and Latent Failure Types
| FAILURE TYPE | CHARACTERISTICS |
|---|---|
| Active |
Resulting from the actions or decisions of those not directly involved in the workplace (e.g., management or senior clinicians [blunt end])
Excessive workloads or inadequate staff
Inadequate knowledge, experience, or training
Poor maintenance of work environment
From Aghababian R, editor. Essentials of emergency care. 2nd ed. Sudbury, Mass: Jones and Bartlett; 2006.
Reason’s “Swiss Cheese” Model
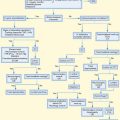
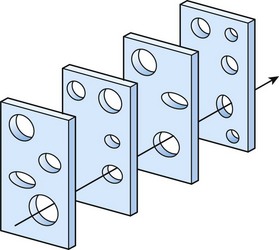
Described by James Reason in 1990,23 the “Swiss cheese” model of human error has four levels of human failure useful to evaluating a medical error (Fig. 208.2). The first level depicts active failures, which are the unsafe acts of the operator that ultimately led to the error. The next three levels depict latent failures (preconditions for unsafe acts, unsafe supervision, and organizational influence), which are underlying holes (or hazards) that allow errors to pass through to the sharp end. As with slices of Swiss cheese, when the levels of error are not aligned, an active failure can be caught before it causes harm—a near miss. With the right alignment, however, patients can be harmed by predictable human errors when systems are not appropriately designed to protect them.
High-Reliability Organizations
In the ED, we can learn from other industries (e.g., aviation, nuclear power) that have developed and incorporated systems allowing for early error corrections or prevention and leading them to function as high-reliability organizations.24 Such industries tightly couple the process of doing work with the process of learning to do it better. Operations are expressly designed to reveal problems as they occur. When problems arise, no matter how trivial, they are addressed quickly. High-reliability organizations share the following six traits:
Preoccupation with failure. These organizations are willing to examine any systems failure to identify causes. Even very small events are evaluated as opportunities to remove systems errors before they coalesce to create large, catastrophic system failures. The organizations have a strong culture of safety.
Reluctance to simplify interpretations. Such organizations seek materials and accurate appraisals of any failure. They do not simply blame individual workers and then consider the case closed.
Sensitivity to operations. These organizations methodologically approach each task with an eye toward improvement, by probing the systems factors that contributed to the failure.
Commitment to resilience. These organizations continually address a deficit until resolution occurs.
Understanding of expertise. These organizations defer decisions to the person who has the requisite knowledge, rather than the requisite rank.
Clarity in mission and vision. A common view of the world allows team members to communicate accurately.
Understanding the importance of a culture of safety in the strive for high quality, Johns Hopkins Hospital (Baltimore) researchers implemented a comprehensive, unit-based safety program (CUSPS) at almost 150 individual units in the hospital.25 This program ultimately led to the establishment of an organization-wide culture of safety at the hospital. Although in the past, organizations focused many resources on building a culture of safety, patient safety leaders have shifted to advocating for a just culture, one that balances safety with accountability.26 Whereas a culture of safety allows evaluation of suboptimal medical outcomes without fear of punitive action toward individuals, a culture of accountability also encourages providers to do the right thing, especially when doing the right thing is easy. A notable example is facilitating hand hygiene through provision of soap dispensers in key locations while holding providers accountable for their individual behavior through direct observation and feedback.
Institute of Medicine Aim: Timeliness
Timeliness is a core mission of the specialty of emergency medicine. In a little more than one decade, ED visits have grown by nearly 25%, whereas at least 10% of EDs have closed nationally. This situation has caused many EDs to experience increased waiting room times, length of stay, and boarding of inpatients in the ED.27 In fact, up to 25% of patients are not seen by an EP within acuity-based recommended times,28 and patients with AMI have experienced a 150% increase in wait times over this period.29 Deaths in the waiting room reported in the lay press serve as a stark reminder of the consequences of systems failures on individual patients.30
Although one goal of health care reform is to decrease ED visits, to date, large-scale health systems reforms have not been able to do this. In fact, given aging demographics (older patients have a higher ED use rate) and patient preferences (for rapid acute care at the time of their choosing), current crowding trends are likely to continue. Furthermore, if efforts at health care reform lead to an increased number of insured patients, Massachusetts’ experience of requiring individual to obtain health insurance (the individual mandate) suggests that more, rather than fewer, ED visits can be expected in the near term.31
A growing body of evidence links prolonged ED length of stay, ED crowding, and boarding of inpatients in the ED to lower quality care and worse patient outcomes. ED crowding has been associated with worse-quality care for patients with AMI, acute coronary syndromes, and hip fractures.32–34 For example, cardiac patients boarded in the ED for longer than 8 hours are less likely to receive guideline-recommended therapies and are more likely to have recurrent MIs. Given prolonged wait times to evaluation in the ED, one study evaluated the safety of managing potential cardiac patients in the ED waiting room.35 Although approaches such as this, to improve safety in the crowded ED, are reasonable short-term solutions, they do not address the primary latent failure of ED crowding, which is the inability to evaluate and treat patients in the appropriate location in a timely fashion.
Given the challenge of addressing quality and safety issues in a crowded ED, many departments are redesigning their operations and patient flow models to improve the timelines of care. Most notably, newer models of care have been developed to replace the traditional model of ED care that was serial (e.g., patient triage, then nursing evaluation, then physician evaluation, then laboratory or diagnostic testing, then decision on final disposition) and uniform (regardless of patient’s clinical needs). Newer models of care have several common features: optimizing front-end operations, developing multiple pathways through the ED that attempt to match a patient’s acuity and resource needs, eliminating duplicate evaluations, maximizing the use of limited ED beds, and facilitating rapid discharge of patients.36 One example is vertical patient flow, a model in which a cohort of patients, rapidly identified on arrival to the ED, is evaluated, managed, and either admitted or discharged in advance (or in lieu) of occupying a traditional ED bed.37 These patients (often a subset of Emergency Severity Index [ESI] 3 patients) require greater medical decision making and more resources than do fast-track patients, but they do not require a room and a stretcher for evaluation. Because these patients do not need to be disrobed in a private room for most of their ED visit, they can sit in recliners in an internal waiting room for most of their ED visit.
Institute of Medicine Aim: Patient-Centered Care
The IOM report identified patient-centered care as a core element of quality. Although many physicians equate patient-centeredness with patient satisfaction, satisfaction is only one component of patient-centeredness. Patient-centered care respects individual patients by addressing the values, ethnicity, social situation, and information needs of each patient.38 Although patient satisfaction surveys have been used for a long time in emergency medicine, only more recently have EPs begun to implement changes that strive to make emergency care more inclusive and responsive to patients’ values, needs, and wishes. Two notable examples are the move to include families in resuscitations39 and the use of structured decision aids to guide joint medical decision making.40–41 Historically, family members were kept out of ED resuscitation rooms when their loved one was undergoing advanced resuscitation (e.g., cardiopulmonary resuscitation). Studies show that family members benefit from their involvement at the end of the patient’s life because the resuscitation, instead of being traumatic, often helps bring closure to a tragic event. A second example is using structured decision aids to engage patients in complex diagnostic decisions, such as whether to conduct cardiac risk stratification in the ED, in the hospital, or in the outpatient environment. When presented with well-designed decision aids, patients are both less likely to request more resource-intensive testing and more likely to be satisfied with their care.
Institute of Medicine Aims: Effective, Efficient, and Equitable Care
The IOM defined equitable care as care that does not vary in quality based on personal characteristics (e.g., race, gender, geographic location, socioeconomic status). Although most EPs pride themselves on providing equal care to all, regardless of ability to pay and personal background, studies have documented racial disparities in emergency care.42–45 Significant room exists for future research on equality of emergency care because it has received little research attention.
Special Focus: Care Coordination
Appropriate care coordination around transitions of care is a topic that cuts across multiple domains of quality. The totality of care cannot be timely, efficient, and patient centered if it is poorly coordinated during the many hand-offs that occur in health care. For example, almost 20% of Medicare beneficiaries are rehospitalized within 30 days of hospital discharge, and half of these patients did not have an intervening primary care visit.46
Care coordination is especially important for “hot spotters,” patients who are extreme outliers in health care use and cost.47 Although 10% of patients account for two thirds of all U.S. health care costs (Fig. 208.3), these extreme outliers (top 1%) can account for a significant fraction of costs by themselves. Intensive outpatient care for complex high-needs patients can significantly reduce health care costs. So far, these efforts have viewed ED visits as systems failures and have not engaged emergency caregivers, but such programs will likely be more successful if they integrate coordination of care plans between the outpatient providers and the local ED providers.
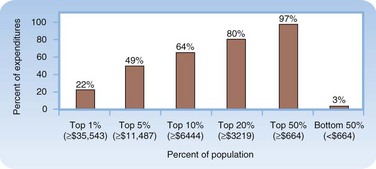
Fig. 208.3 The high concentration of U.S. health care expenditures.
(Modified from Conwell LJ, Cohen JW. Characteristics of people with high medical expenses in the U.S. civilian noninstitutionalized population, 2002. Statistical brief no. 73. Rockville, Md: Agency for Healthcare Research and Quality; 2005. [http://www.meps.ahrq.gov/mepsweb/data_files/publications/st73/stat73.pdf].)
More directly affecting ED care are the hand-offs between physicians at change of shift or on patient admission. Communication errors are the root cause of most safety events that occur in the ED. Many quality lapses occur when critical information is lost in such transitions. Many barriers to effective communication exist, including the need to balance conciseness with completeness, the lack of a standardized approach, and ambiguous time stamp for when transition of care occurs. Nonetheless, Cheung et al.48 provided with strategies to improve hand-offs, including reducing the number of unnecessary hand-offs, limiting interruptions and distractions, communicating outstanding tasks and anticipated changes along with a clear care plan, encouraging questioning of assessment, and signaling a clear moment in transition of care.
Special Focus: From “Never Events” to “Serious Reportable Events”
The most high-profile patient safety errors have been those that were serious and preventable. This is not surprising because explaining to a patient or patient’s family how a system allows such events to occur again and again is difficult. For example, at one hospital in Rhode Island, neurosurgeons operated on the wrong side of a patient’s brain three times over the course of 3 years, and an additional two other wrong-site surgical procedures occurred in this time.49,50 Such errors were initially labeled “never events”—events that should never occur. However, as the number of preventable events (e.g., hospital-acquired infections) grew, maintaining the paradigm of never events became difficult. Instead, the focus was changed from events that should never occur to ones that should not occur.
Financial Strategies to Improve Health Care Quality and Value
Center for Medicare and Medicaid Services
As the country’s largest insurer and purchaser of health care services, the Centers for Medicare and Medicaid Services (CMS) is very interested in making sure its health care dollars are being well spent. Toward the aim of increased transparency and accountability, CMS launched a public reporting effort in 2004. Initially, participation in Hospital Compare (www.hospitalcompare.hhs.gov) was voluntary, and only quality measures related to pneumonia, AMI, and congestive heart failure were reported. Since then, the number of measures reported on this website has dramatically increased, and it includes risk-adjusted death and readmission rates, as well as patient satisfaction.
In January 2011, the CMS launched a Physician Compare website. Although it started with simple provider-specific information (e.g., whether a physician accepts Medicare and uses electronic prescribing), by 2015 it is expected to have public reports of physician-specific quality measures, including patient satisfaction. Developing physician profiles is replete with challenges.51 One of the most important unintended consequences of physician profiling is risk aversion (physician’s avoiding complex or high-risk patients), which inevitably leads to decreased health care access for minorities and economically disadvantaged populations.52–54 Most problematic has been physician cost profiling because current methods misclassify physician ranking one fourth of the time.55 The reliability of these profiling schemes therefore is paramount.
The Affordable Care Act established an Innovation Center within the CMS to test innovative payment and health care delivery models, aimed at reducing health care expenditures and improving quality. For example, the Innovation Center will likely link payment to hospitals to their ability to reduce hospital-acquired infections and readmissions. The effectiveness of such financial incentive programs has been drawn into question. Looking at data from the United Kingdom’s Quality and Outcomes Framework, researchers did not find any improvement in outcome measures for patients treated before or after the introduction of the incentive program.56
Future Reimbursement Models
In both public and private sectors, a strong movement is leading away from purchasing health care services by volume and toward purchasing value (defined as health care value per dollar spent).57,58 Reimbursement models are evolving to motivate providers to be more cost and quality conscious. Since 2000, several schemes have emerged that have been called pay-for performance (P4P) programs. Many of these programs were simply fee-for-service models, with either a bonus or withhold based on achieving certain performance thresholds.
A newer, emerging reimbursement model is bundled payment, in which hospitals and providers share in the accountability for delivering value. Geisinger Health System’s ProvenCare program59 defined and implemented best practices for patients undergoing CABG and then offered risk-based pricing to insurers. Specifically, preoperative, inpatient, and postoperative care within 90 days was packaged into a fixed price and touted in the lay press as a “CABG warranty.” The success of this program in improving care and reducing costs brought the concept of bundled payments to the center stage of health care reform.
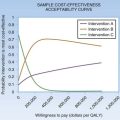
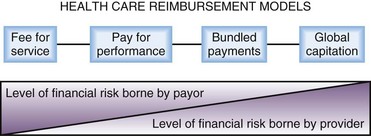
Global or capitated payment is also reemerging as a viable way to reimburse for care. Blue Cross/Blue Shield of Massachusetts reported that its global payment system improved patient care during its first year, including decreasing avoidable ED visits by 25% through one of its contracts.60 Under an alternative quality contract, physicians are provided a monthly per-patient budget, as well as bonuses for improving care. Future reimbursement models will inevitably center on performance measurement and accountability, with a likely shift in level of financial risk borne from payer to provider (Fig. 208.4).
To be fiscally viable within potential future reimbursement models, health care providers are being encouraged to organize themselves into accountable care organizations (ACOs).61–63 ACOs are meant to encompass various provider arrangements (e.g., integrated delivery systems, multispecialty group practices, physician-hospital organizations, independent practice associations) that lead involved parties (e.g., physician group and hospital) to be jointly accountable for improving patient care and reducing spending. Unlike an HMO, this needs to be accomplished within the context of patients’ choice to visit providers internal or external to the ACO for which their care is attributed. Ideally, ACOs will be able to bend the cost curve of increasing health care expenditures. Many different prototypes have been reported in the lay and medical literature. Certification of ACOs for participation in the Affordable Care Act’s Shared Savings Program for Medicare still must occur. A fine balance will need to be reached because a liberal policy may lead to provider mergers and market dominance that have driven up costs in the past.
Measure Development
Without representation, poorly framed, yet nationally endorsed, quality measures may negatively affect emergency care. For example, the initial measure set for community-acquired pneumonia was developed using low-quality evidence from cross-sectional Medicare studies. EPs contended that these measures had many unintended consequences, including the administration of inappropriate antibiotics and excessive use of blood cultures.64 As more research was published showing that these measures were not linked to improved patient outcomes, the CMS revised the measures (Box 208.1).
Box 208.1 Blood Cultures for Community-Acquired Pneumonia
• 1998 and 2000: Clinical guidelines for CAP published by specialty societies recommend routine blood cultures for patients admitted with CAP (e.g., the Infectious Disease Society of America).
• 2000: A technical panel charged to develop CAP quality measures from the Oklahoma Foundation for Medical Quality reviews the guidelines and recommends blood cultures in pneumonia as a CAP measure to CMS and the Joint Commission.
• 2000: Once approved by CMS and the Joint Commission, the measures are then submitted and endorsed by the National Quality Forum.
• 2002: The measures are adopted as National Hospital Quality Measures, and results are reported on the Hospital Compare website.
• 2004 and 2006: Because of feedback from emergency physicians, the measures were revised several times to limit the eligible population. The first revision limited the applicable patient population to those admitted to an ICU within the first 24 hours of their stay. The second revision further refined the eligible population as the subset of patients with CAP who have cultures drawn in the ED.
Tips and Tricks
Quality in the Emergency Department
• Do what is right for the patient regardless of timing (e.g., off hours) or circumstances (e.g., overcrowding).
• At change of shift, briefly evaluate patients turned over to your care so that you have a baseline in mind should an acute deterioration in a patient’s condition occur.
• Before discharge, make sure to review all laboratory results and radiographs even if you expect the results to be normal.
• Explain diagnostic uncertainties at discharge so that the patient will seek care if his or her condition deteriorates.
Health Care Quality Lapses and Individual Providers
Despite an increased focus on transparency and systems improvement (Box 208.2), physicians and hospitals continue to underreport their errors and quality lapses. Too often, providers react to medical errors with shame, fear, and secrecy. To most physicians, the admission of wrongdoing has the dual effect of causing humiliation in front of patients and peers and introducing fear of lawsuits into everyday life. Ofri65 reported, “No doctor will easily confess to error when a core sense of self is at risk. … Unless we can defuse the shame and loss of self that accompany admitting medical errors, there will always be that taut inner core of resistance.”
Box 208.2 Quality Improvement Toolkit
Investigate
• RCA (root-cause analysis): This is an attempt to learn the underlying systems cause of problems (e.g., equipment, staffing, policies and procedures, information systems), frequently by asking “why” five times until the root cause is identified; it is facilitated by use of a fishbone diagram.
• FMEA (failure modes and effects analysis): This is a systematic, proactive method for evaluating a process to identify where and how it may fail and to assess the relative impact of different failures to identify the parts of the process that are most in need of change.
Mitigate
• Standardization: Consistency minimizes errors caused by varied processes (e.g., using the same tube thoracostomy set throughout the hospital).
• Simplification: The more steps a process has, the more likely it will be that a given process will go wrong (e.g., different admitting procedures for different services within the same hospital).
• Checklist: This was made famous by Provonost’s Keystone Initiative, which showed that a simple checklist for central venous catheter placement in the ICU could substantially decrease the infection rate.
• Forcing function: Systems designs make it difficult to do the wrong thing (e.g., gas connectors on anesthesia machines are designed so that oxygen and nitrous oxide tanks can be attached only to proper ports, thus eliminating the potential of a fatal mix-up) or make it easy to do the right thing (e.g., opt-out provisions for deep venous thrombosis prophylaxis as part of inpatient order sets decrease the rate of subsequent pulmonary embolus).
Improve
• PDCA (plan, do, check, act): Identify a problem, plan a solution, execute the plan on a small scale, measure performance, check to see whether the plan resulted in the desired outcome, make changes to improve the plan, and/or execute the plan on a larger scale. In terms of improving the daily practice of medicine, PDCA cycles are more useful than formal studies (e.g., randomized trials) and erratic trial and error approaches.
• LEAN: with the use of value stream maps, lean thinking identifies value-added and non–value-added steps in every process, with the goal of driving out waste so that all work adds value and serves the patient’s needs.
In most emergency medicine residency programs, the morbidity and mortality conference is the most widely used error-based teaching conference. The culture of this conference helps shape physicians’ view of medical errors. One step in the right direction is for senior EPs to share their own mistakes with the next generation of physicians in an open and safe manner and to encourage reporting of errors, especially when appropriate peer-review protected systems are in place. Another cultural change is for EDs and hospitals to adopt policies encouraging rapid and open admissions of error to patients. Although individual physicians can adopt this strategy, it may be most effective if adopted by an institution and supported with changes in the way patients are compensated for medical errors. In 2001, the University of Michigan adopted a program of full disclosure of medical errors with offers of compensation. This approach both decreased the number of lawsuits and the time to resolution, without increasing the overall amount spent on medical malpractice.66
Tips and Tricks
Tell the Truth: Disclosure of Medical Errors
• An explicit statement that an error occurred
• A basic description of the error, why the error happened, and how recurrences will be prevented
Adapted from Gallagher TH, Waterman AD, Ebers AG, et al. Patients’ and physicians’ attitudes regarding the disclosure of medical errors. JAMA 2003;289:1001–7.
Remaining Challenges
Although more than a decade has passed since the IOM reports were published, studies still show that nearly 20% of patients continue to be harmed by their care.67 In addition, one in seven Medicare beneficiaries will experience adverse events while hospitalized, and SREs (e.g., wrong site surgery) continue to occur.68 Furthermore, physician involvement in quality improvement activities varies considerably and will become mandatory only as each specialty board incorporates quality improvement into its maintenance of certification programs.69 The American Board of Emergency Medicine requires a “patient care practice improvement activity” for those diplomates recertifying in 2013 and beyond.
1 Donabedian A. The end results of health care: Ernest Codman’s contribution to quality assessment and beyond. Milbank Q. 1989;67:233–256.
2 Donabedian A. The quality of care: how can it be assessed? JAMA. 1988;260:1743–1748.
3 Berwick DM. Continuous improvement as an ideal in health care. N Engl J Med. 1989;320:53–56.
4 Berwick DM. Why the Vasa sank. In: Escape fire: designs for the future of health care. San Francisco: Jossey-Bass; 2004.
5 Kohn LT, Corrigan JM, Donaldson MS. To err is human: building a safer health system. Washington, DC: National Academies Press, 1999.
6 Committee on Quality Health Care in America. Crossing the quality chasm: a new health system for the 21st century. Washington, DC: National Academies Press; 2001.
7 Brennan TA, Leape LL, Laird NM, et al. Incidence of adverse events and negligence in the hospitalized patients: results of the Harvard Medical Practice study. N Engl J Med. 1991;324:370–376.
8 Thomas EJ, Studdert DM, Burstin HR, et al. Incidence and types of adverse events and negligent care in Utah and Colorado. Med Care. 2000;38:261–271.
9 Martin A, Lassman D, Whittle L, et al. Recession contributes to slowest annual rate of increase in health spending in five decades. Health Aff (Millwood). 2011;30:11–22.
10 Davis K, Schoen C, Stremikis K. Mirror, mirror on the wall: how the performance of the US health care system compares internationally, 2010 update. New York: Commonwealth Fund; 2010.
11 Henry J Kaiser Family Foundation. Health care worries in the context with other worries. Menlo Park, Calif: Henry J Kaiser Family Foundation; 2004.
12 ABC News/Kaiser Family Foundation/USA Today. Health care in America 2006 survey. Menlo Park, Calif: Henry J Kaiser Family Foundation; 2006.
13 Himmelstein D, Warren E, Thorne D, et al. Illness and injury as contributors to bankruptcy. Health Aff (Millwood). 2005. W5-63–W5-73, (Web Exclusive)
14 Levenson M. Health costs sap state aid for schools. Boston Globe, December 9, 2010.
15 Wennberg JE, Gittelsohn A. Small area variations in health care delivery. Science. 1973;182:1102–1108.
16 Wennberg JE, Freeman JL, Culp WJ. Are hospital services rationed in New Haven or over-utilized in Boston? Lancet. 1987;1:1185–1190.
17 Fisher ES, Wennberg DE, Stukel TA, et al. The implications of regional variations in Medicare spending. Part I: the content, quality, and accessibility of care. Ann Intern Med. 2003;138:273–287.
18 Fisher ES, Wennberg DE, Stukel TA, et al. The implications of regional variations in Medicare spending. Part 2: health outcomes and satisfaction with care. Ann Intern Med. 2003;138:288–298.
19 Gawande A. The cost conundrum. The New Yorker, June 1, 2009.
20 McGlynn EA, Asch SM, Adams J, et al. The quality of health care delivered to adults in the United States. N Engl J Med. 2003;348:2635–2645.
21 Bach PB. A map to bad policy: hospital efficiency measures in the Dartmouth Atlas. N Engl J Med. 2010;362:569–574.
22 Romley JA, Jena AB, Goldman DP. Hospital spending and inpatient mortality: evidence from California. Ann Intern Med. 2011;154:160–167.
23 Reason J. Human error. Cambridge: Cambridge University Press; 1990.
24 Spear SJ. Fixing health care from the inside, today. Harvard. Bus Rev. 2005;83:78–91.
25 Paine LA, Rosenstein BJ, Sexton JB, et al. Assessing and improving safety culture throughout an academic medical centre: a prospective cohort study. Qual Saf Health Care. 2010;19:547–554.
26 Dekker SWA. Just culture: balancing safety and accountability. Farnham, UK: Ashgate; 2007.
27 McCarthy ML, Zeger SL, Ding R, et al. Crowding delays treatment and lengthens emergency department length of stay, even among high-acuity patients. Ann Emerg Med. 2009;54:511–513.
28 Horwitz LI, Bradley EH. Percentage of US emergency department patients seen within the recommended triage time: 1997 to 2006. Arch Intern Med. 2009;169:1857–1865.
29 Wilper AP, Woolhandler S, Lasser KE, et al. Waits to see an emergency department physician: US trends and predictors, 1997-2004. Health Aff (Millwood). 2008;27:W84–W95. (Web Exclusive)
30 Leonard J, Ornstein C. Untreated Oliver View patient dies. Los Angeles Times, October 31, 2007.
31 Kowalczyk L. Emergency room visits grow in Mass. Boston Globe, July 4, 2010.
32 Schull MJ, Vermeulen M, Slaughter G, et al. Emergency department crowding and thrombolysis delays in acute myocardial infarction. Ann Emerg Med. 2004;44:577–585.
33 Diercks DB, Roe MT, Chen AY, et al. Prolonged emergency department stays of non–ST segment-elevation myocardial infarction patients area associated with worse adherence to the American College of Cardiology/American Heart Association guidelines for management and increased adverse events. Ann Emerg Med. 2007;50:489–496.
34 Hwang U, Richardson L, Livote E, et al. Emergency department crowding and decreased quality of pain care. Ann Emerg Med. 2008;15:1248–1255.
35 Scheuermeyer F, Christenson J, Innes G, et al. Safety of assessment of patients with potential ischemic chest pain in an emergency department waiting room: a prospective comparative cohort study. Ann Emerg Med. 2010;56:455–462.
36 White BA, Brown DF, Sinclair J, et al. Supplemented triage and rapid treatment (START) improves performance measures in the emergency department. J Emerg Med. 2010. June 14 [Epub ahead of print]
37 Hamedani AG, Liu SW, Brown DF, et al. Vertical patient flow: an innovative approach to crowding in US academic emergency departments (abstract). Ann Emerg Med. 2010;56:S60.
38 Berwick DM. What “patient-centered” should mean: confessions of an extremist. Health Aff (Millwood). 2009;28:W555–W565. (Web Exclusive)
39 Boudreaux ED, Francis JL, Loyacano T. Family presence during invasive procedures and resuscitations in the emergency department: a critical review and suggestions for future research. Ann Emerg Med. 2002;40:193–205.
40 Kline JA, Zeitouni RA, Hernandez-Nino J, et al. Randomized trial of computerized quantitative pretest probability in low-risk chest pain patients: effect on safety and resource use. Ann Emerg Med. 2009;53:727–735.
41 Pierce MA, Hess EP, Kline JA, et al. The chest pain choice trial: a pilot randomized trial of a decision aid for patients with chest pain in the emergency department. Trials. 2010;11:57.
42 Richardson LD, Babcock IC, Tamayo-Sarver JH. Racial and ethnic disparities in the clinical practice of emergency medicine. Acad Emerg Med. 2003;10:1184–1188.
43 Cone DCC. Health care disparities in emergency medicine. Acad Emerg Med. 2003;10:1176–1183.
44 Todd KH, Samarco N, Hoffman JR. Ethnicity as a risk factor for inadequate emergency department analgesia. JAMA. 1993;269:1537–1539.
45 Todd KH, Deaton C, D’Adarno AP, et al. Ethnicity and analgesic practice. Ann Emerg Med. 2000;35:11–16.
46 Jencks SF, Williams MV, Coleman EA. Rehospitalizations among patients in the Medicare fee-for-service program. N Engl J Med. 2009;360:1418–1428.
47 Gawande A. The hot spotters. The New Yorker, January 24, 2011.
48 Cheung DS, Kelly JJ, Beach C, et al. Improving handoffs in the emergency department. Ann Emerg Med. 2010;55:171–180.
49 Trial of errors led to 3 wrong brain surgeries. Associated Press, December 14, 2007.
50 Freyer FJ. Hospital fined for wrong site surgery. Rhode Island News, November 3, 2009.
51 Hong CS, Atlas SJ, Chang Y, et al. Relationship between patient panel characteristics and primary care physician clinical performance rankings. JAMA. 2010;304:1107–1113.
52 Werner RM, Asch DA. The unintended consequences of publicly reporting quality information. JAMA. 2005;293:1239–1244.
53 Resnic FS, Welt FGP. The public health hazards of risk avoidance associated with public reporting of risk-adjusted outcomes in coronary intervention. J Am Coll Cardiol. 2009;53:8225–8830.
54 Califf RM, Peterson ED. Public reporting of quality measures: what are we trying to accomplish? J Am Coll Cardiol. 2009;53:831–833.
55 Adams JL, Mehrotra A, Thomas JW, McGlynn EA. Physician cost profiling: reliability and risk misclassification. N Engl J Med. 2010;362:1014–1021.
56 Serumaga B, Ross-Degnan D, Avery AJ, et al. Effect of pay for performance on management and outcomes of hypertension in the United Kingdom interrupted time series study. BMJ. 2011;342:d201.
57 Porter ME. What is value in health care? N Engl J Med. 2010;363:2477–2481.
58 Lee TH. Putting the value framework to work. N Engl J Med. 2010;263:2481–2483.
59 Berry SA, Doll MC, McKinley EK, et al. ProvenCare: quality improvement model for designing highly reliable care in cardiac surgery. Qual Saf Health Care. 2009;18:360–368.
60 Kowalczyk L. Insurer says new pay plan working. Boston Globe, January 21, 2011.
61 Fisher E, Staiger D, Bynum J, et al. Creating accountable care organizations: the extended hospital medical staff. Health Aff (Millwood). 2007;26:W44–W57. (Web Exclusives)
62 Shortell SM, Casalino LP, Fisher ES. How the Center for Medicare and Medicaid Innovation should test accountable care organizations. Health Aff (Millwood). 2010;29:1293–1298.
63 Greaney TL. Accountable care organizations: the fork in the road. N Engl J Med. 2010;364:e1.
64 Walls RM, Resnick J. The Joint Commission on Accreditation of Healthcare Organizations and Center for Medicare and Medicaid Services community-acquired pneumonia initiative: what went wrong? Ann Emerg Med. 2005;46:409–411.
65 Ofri D. Ashamed to admit it: owning up to medical error. Health Aff (Millwood). 2010;29:1549–1551.
66 Kaufman KA, Boothman R, Anderson S, et al. Liability claims and costs before and after implementation of a medical error disclosure program. Ann Intern Med. 2010;153:213–221.
67 Landrigan CP, Parry GJ, Bones CB, et al. Temporal trends in rates of patient harm resulting from medical care. N Engl J Med. 2010;263:2124–2134.
68 Levinson DR. Adverse events in hospitals: national incidence among Medicare beneficiaries. Office of the Inspector General. Washington, DC: Department of Health and Human Services; 2010.
69 Pronovost PJ, Marsteller JA. A physician management infrastructure. JAMA. 2011;305:500–501.
Berwick DM. Continuous improvement as an ideal in health care. N Engl J Med. 1989;320:53–56.
Committee on Quality Health Care in America. Crossing the quality chasm: a new health system for the 21st century. Washington, DC: National Academies Press; 2001.
Croskerry P, Cosby KS, Schenkel S, Wears RL. Patient safety in emergency medicine. Philadelphia: Lippincott Williams & Wilkins; 2009.
Fisher ES, Wennberg DE, Stukel TA, et al. The implications of regional variations in Medicare spending. Part I: the content, quality, and accessibility of care; Part II: health outcomes and satisfaction with care. Ann Intern Med. 2003;138:273–287. 288–298
Kohn LT, Corrigan JM, Donaldson MS. To err is human: building a safer health system. Washington, DC: National Academies Press, 1999.