Pulmonary ventilation and perfusion
 /
/ ) ratio of 1 in a situation of continuous countercurrent flow of gas to blood, with a blood-to-gas exposure of 0.75 sec. Human lung, by contrast, is only relatively efficient, showing a range of
  /
/ ratios for its many alveoli, determined by the distribution of
  and
and  throughout the lungs.
Ventilation
 within the lungs. The right lung is larger than the left lung, receiving approximately 52% to 53% of a tidal breath in the supine position, during both spontaneous breathing and with mechanical ventilation. These percentages change under the influence of gravity with change in posture. Anesthesia, paralysis, and mechanical ventilation introduce further changes.
At functional reserve capacity, in each slice of lung, from nondependent (apex in sitting position, anterior lung in supine, up lung in lateral decubitus position) to most dependent portion, the alveolar volume decreases. Basal alveoli are one quarter the volume of apical alveoli at end expiration. This puts the basal alveolar characteristics on a steeper portion of their pressure-volume (P-V) curve (Figure 29-1); although the basal alveoli are smaller than apical alveoli at functional reserve capacity, the basal alveoli expand more than do the apical alveoli during inspiration. Therefore, in an awake, spontaneously breathing patient, in all positions, ventilation per unit of lung volume is smallest at the highest portion (e.g., the apex in an upright patient) and increases with vertical distance down the lung.
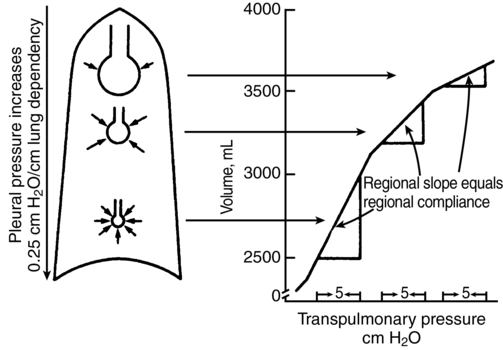
In the supine patient, general anesthesia with paralysis and mechanical ventilation decreases the difference between the ventilation of the dependent and nondependent alveoli, causing nearly uniform distribution of ventilation throughout the lung. This is attributed to a decreased functional reserve capacity, shifting alveolar characteristics downward on their P-V curves (see Figure 29-1). When the patient is in the lateral decubitus position, anesthesia reverses the distribution of ventilation so that the nondependent (upper) part of the lung receives more ventilation than does the dependent (lower) part of the lung. This arrangement holds for both spontaneous and mechanical ventilation and is clinically significant because the dependent lung has greater perfusion, which causes increased  /
/ mismatch. The change in distribution of
  to lung regions in the lateral decubitus position is attributed to (1) decreased functional reserve capacity, causing a shift along the P-V curve (which can be partially reversed by positive end-expiratory pressure); (2) more compression of the dependent lung by the mediastinum and abdominal contents; and (3) increased compliance of the nondependent hemithorax.
 /
/ mismatching. Anesthesia may reverse bronchoconstriction and favorably impact this factor.
Pulmonary blood flow
The two major determinants of distribution of pulmonary blood flow ( ) within the lung are (1) gravity and (2) hypoxic pulmonary vasoconstriction (HPV). Pulmonary artery pressure (PPA) decreases by 1 mm Hg or 1.35 cm H2O for every cm of vertical distance up the lung. Because the pulmonary circulation is a low-pressure system, this causes significant differences in
  between the lower and higher regions of the lung, with greater
  going to the lower lung regions. The actual
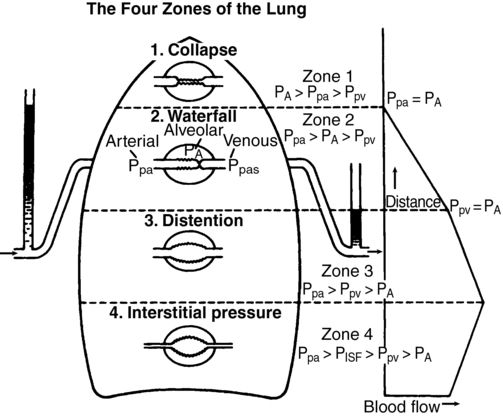
  to an alveolus also depends on the alveolar pressure (PALV), which opposes the PPA and pulmonary venous pressure (PPV). This interaction is summarized in Figure 29-2. All of these relationships are dynamic, varying throughout the cardiac and respiratory cycles. There are four defined zones of blood flow in the lung. In zone 1, at the apex of an upright lung, PALV is greater than PPA, preventing any blood flow and thereby creating alveolar dead space. Zone 1 is negligible in healthy lungs. In zone 2, PPA is greater than PALV, which is greater than PPV, so that
  depends only on PPA minus PALV. In zone 3, PPA is greater than PPV, which is greater than PALV, and
  is a function of PPA minus PPV independent of PALV. In zone 4 flow is determined by the difference between PPA and PISF. In general, decreases in PPA (e.g., hemorrhagic shock) will increase the size of the upper zones (1 and 2) at the expense of the lower zones (2 and 3), whereas increases in PPA have the opposite effect. Increases in PALV (e.g., with positive end-expiratory pressure) may recruit alveoli from lower zones into higher zones (i.e., increase the volumes of zones 1 and 2).
 to underventilated regions of lung and maintain normal
  /
/ . HPV is effective only when there is a significant section of normally ventilated and oxygenated lung to which flow can be diverted (e.g., one-lung ventilation during thoracic operations). Intravenously administered anesthetic agents do not inhibit HPV, whereas the inhaled anesthetic agents and potent vasodilators do. Therapeutically inhaled NO is a unique pulmonary-specific vasodilator that may attenuate HPV and often improves oxygenation because it is delivered only to alveoli that are already being ventilated.
Ventilation/perfusion ratio
Both  and
and  increase toward the dependent part of the lung, but at different rates (Figure 29-3). Therefore,
  /
/ is greater than 1 at the top,
  /
/ equals 1.0 at the third rib in upright lungs, and
  /
/ is less than 1 below the third rib.
  /
/ is, of course, also affected by the factors that affect
  or
or  separately.
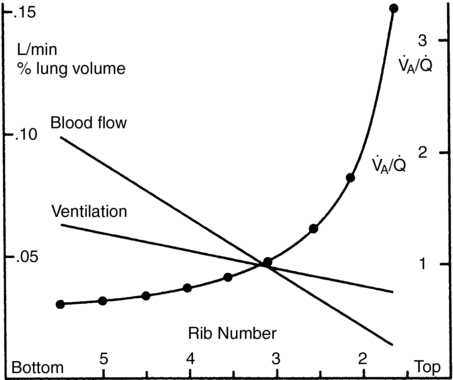
 , alveolar ventilation-perfusion ratio. (From West JB. Respiratory Physiology. 2nd ed. Baltimore: Williams & Wilkins; 1970.)
 /
/ and the anatomy of the conducting airways. Decreased P
Shunt
Shunt ( S) is that portion of blood flow that does not participate in gas exchange.
  S/
S/ T is that fraction of pulmonary blood flow (total cardiac output) that is shunt. There are anatomic contributions to shunt from thebesian veins, bronchial veins, and any other anatomic right-to left shunt paths directly emptying into the left side of the heart beyond the lungs. These shunts may deflect up to 5% to 7% of
  T.
T.  /
/ mismatching may contribute about a further 1% to 3% such that total shunt may be 6% to 10% of cardiac output in normal lungs (Box 29-1).
  S/
S/ T may be estimated using the Fick principle embodied in the shunt equation:
Box 29-1 Factors Affecting Shunt
Thebesian veins drain blood directly from left ventricular muscle wall into the left ventricle; this blood has a very low O2 content but is only 0.3% of  T.
T.
Flow in the bronchial veins may be large in patients with bronchial disease and up to 7% to 10% of  T in patients with a coarctation.
Congenital right-to-left cardiac shunt
Pulmonary edema increases  S in dependent and flooded alveoli.
Pulmonary diseases may increase diffusion block and create regions of low  .
.
Any airway closure will increase  S; thus, use of PEEP and alveolar-recruitment maneuvers may decrease
  S and improve oxygenation.
PEEP, Positive end-expiratory pressure;  S, shunt;
  T, total cardiac output;
  , ventilation/perfusion.