4 Pulmonary Function Testing
Note 1: This book is written to cover every item listed as testable on the Entry Level Examination (ELE), Written Registry Examination (WRE), and Clinical Simulation Examination (CSE).
The listed code for each item is taken from the National Board for Respiratory Care’s (NBRC) Summary Content Outline for CRT and Written RRT Examinations (http://evolve.elsevier.com/Sills/resptherapist/). For example, if an item is testable on both the ELE and WRE, it is shown simply as (Code: …). If an item is testable only on the ELE, it is shown as (ELE code: …). If an item is testable only on the WRE, it is shown as (WRE code: …).
MODULE A
3. Pulmonary mechanics (e.g., maximum inspiratory pressure, vital capacity) (Code: IA7b) [Difficulty: ELE: R; WRE: Ap]
MODULE B
1. Perform bedside spirometry tests
a. Recommend lung mechanics (bedside spirometry) tests to obtain additional data (Code: IC7) [Difficulty: ELE: R, Ap; WRE: An]
The bedside lung mechanics tests typically include the following:
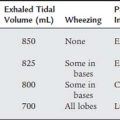
2. Tidal volume
a. Perform the procedure (Code: IB9d) [Difficulty: ELE: R; WRE: Ap, An]
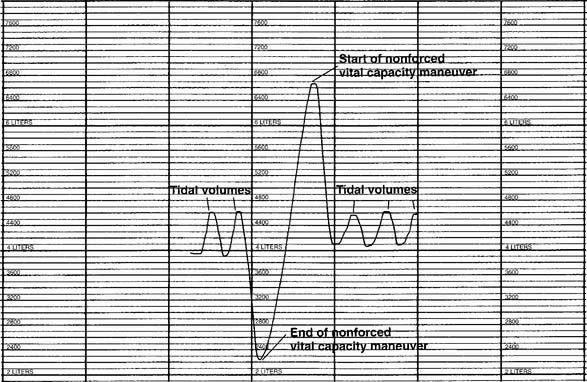
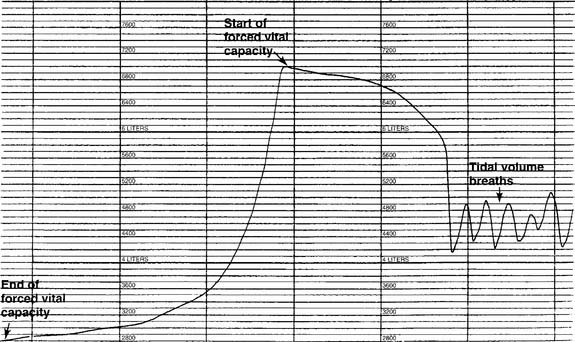
The tidal volume (VT) is the volume of gas breathed out in each respiratory cycle. Realize that individual tidal volumes are rarely identical. Figure 4-1 shows several different tidal volumes before and after a nonforced (slow) vital capacity (VC). For that reason, it is recommended that the tidal volumes be accumulated for 1 minute (thus providing a minute volume [ ]) and the respiratory rate (f) counted. An average VT is found by dividing the
  by the f. If this cannot be done, find the average volume of at least six breaths. The average predicted tidal volume for a resting, afebrile, alert adult should be about


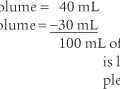
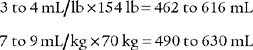
For example, the predicted tidal volume range of a 154-lb (70-kg) patient is calculated as follows:
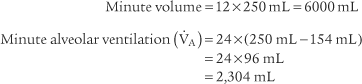
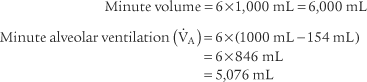
3. Minute volume
 ) is the volume of gas exhaled in 1 minute. It usually is a more stable value than are individual tidal volumes. The minute volume is found by adding the accumulated tidal volumes for 1 minute. A simple handheld spirometer often is used to accumulate the tidal volume breaths. If the patient cannot perform the test for 1 minute, do it for 30 seconds and double the value.
b. Interpret the results (Code: IB10d) [Difficulty: ELE: R, Ap; WRE: An]
The predicted range for a minute volume in a resting, afebrile, alert adult should be 5 to 10 L/min. The wide range is found in part because the minute volume is a product of two factors: tidal volume and respiratory rate. It is possible for either one or both of these factors to be normal, abnormally high, or abnormally low. For these reasons, the minute volume must be evaluated along with the tidal volume and respiratory rate to reach any conclusion about the patient’s condition. The same factors that have an impact on the tidal volume affect the patient’s minute ventilation.
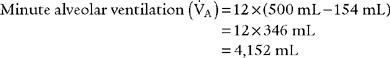
4. Alveolar ventilation

 ) is the volume of gas that reaches the alveoli in 1 minute. It is found by multiplying the alveolar volume by the respiratory rate in 1 minute.
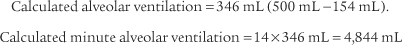
5. Maximum inspiratory pressure
a. Perform the procedure (Code: IB79n [Difficulty: ELE: R, Ap; WRE: An]
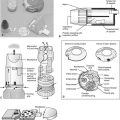
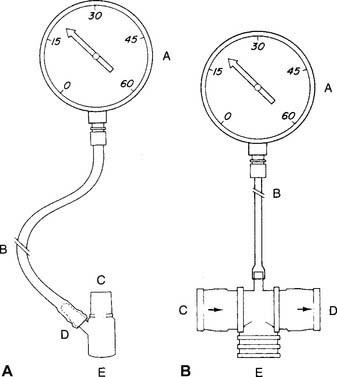
A study of the literature reveals that a number of measurement devices have been assembled and that different bedside techniques have been used to determine the effort of a patient breathing naturally, an intubated patient, and a patient breathing with assistance from a mechanical ventilator. Branson and colleagues (1989) and Kacmarek and colleagues (1989) make a strong case for the use of a double one-way valve to connect the intubated patient to the manometer (Figure 4-2). Use of the one-way valve lets the patient exhale but prevents an inhalation when the practitioner occludes the opening. This forces the patient to inhale from closer to residual volume with each breathing effort. These researchers also recommend that the patient make inspiratory efforts for 15 to 20 seconds.
Steps in the MIP procedure for a normally breathing patient include the following:
b. Interpret the results (Code: IB10n) [Difficulty: ELE: R, Ap; WRE: An]
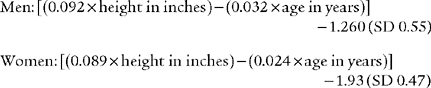
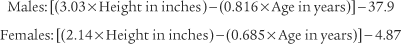
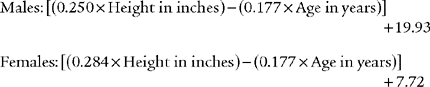
Black and Hyatt (1969) published MIP prediction formulas for spontaneous breathing in nonintubated adults 20 to 86 years old who are breathing from residual volume; these formulas are presented in Table 4-1. The values are in centimeters of water pressure (cm H2O). As can be seen, the older the patient, the lower the predicted negative inspiratory force.
TABLE 4-1 Age and Gender in Predicting Negative Inspiratory Force
| Age and Gender | Lower Limits of Normal |
|---|---|
| Males: 143 – (0.55 × age) | − 75 cm H2O |
| Females: 104 – (0.51 × age) | − 50 cm H2O |
6. Maximum expiratory pressure
a. Perform the procedure (Code: IB9n) [Difficulty: ELE: R, Ap; WRE: An]
As with the MIP test, a study of the literature reveals that a number of measurement devices have been assembled and that different bedside techniques have been used to determine the effort of a patient breathing naturally and the effort of one who is intubated and breathing by way of a mechanical ventilator. A strong case can be made for the use of a double one-way valve to connect the intubated patient to the manometer (see Figure 4-2). Use of the one-way valves lets the patient inhale but prevents an exhalation when the practitioner occludes the expiratory opening. This forces the patient to exhale from closer to TLC with each breathing effort. However, the expiratory efforts should not be held for longer than 3 seconds. This test is similar to the Valsalva maneuver and can cause a reduction in cardiac output because of the high intrathoracic pressure.
Steps in the MEP procedure for a normally breathing patient include the following:
b. Interpret the results (Code: IB10d) [Difficulty: ELE: R, Ap; WRE: An]
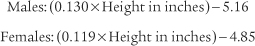
Black and Hyatt published MEP prediction formulas for spontaneously breathing, nonintubated adults 20 to 86 years old who are breathing from TLC; these formulas are presented in Table 4-2. The values are in centimeters of water pressure. As can be seen, the older the patient, the lower the predicted maximum expiratory force.
TABLE 4-2 Age and Gender in Predicting Maximum Expiratory Force
| Age and Gender | Lower Limits of Normal |
|---|---|
| Males: 268 – (1.03 × age) | +140 cm H2O |
| Females: 170 – (0.53 × age) | +95 cm H2O |
7. Vital capacity
a. Perform the test (Code: IB9d) [Difficulty: ELE: R; WRE: Ap, An]
The nonforced (slow) vital capacity (VC or SVC) is the greatest volume of gas the patient can exhale after the lungs have been completely filled. The therapist should demonstrate the procedure to the patient. He or she must understand that there is no need to blow out fast while emptying the lungs. The measurement device can be a simple handheld spirometer if a printout of the result is not needed. A portable, computer-based spirometer can be used, if needed, to generate a printout of the results or a graphic tracing. Normally at least three efforts are made, and the largest is recorded.
b. Interpret the results (Code: IB10d) [Difficulty: ELE: R, Ap; WRE: An]
See Figure 4-1 for a graphic tracing of a nonforced VC. Compare it with the tracing on Figure 4-3, which shows a forced vital capacity (FVC). In a patient without obstructive lung disease, the same volume should be found in a nonforced VC and an FVC. A patient with asthma or chronic obstructive lung disease may have a smaller FVC than nonforced VC because of small airway collapse during the maximum effort. The following discussion on the FVC includes predicted values for male and female patients and guidelines on the interpretation.
c. Monitor the vital capacity (Code: IA7b) [Difficulty: ELE: R; WRE: Ap]
The VC and other simple spirometry values are commonly measured at the bedside in patients with neuromuscular disease and those who are being weaned from mechanical ventilation. A VC that is increasing toward the normal, predicted patient value is a good sign, because it indicates that the patient is recovering. If the VC is decreasing, the patient likely is becoming weaker and will not be able to cough out secretions effectively. Mechanical ventilation may be needed. See Module C for more discussion on the vital capacity. See Chapter 15 for more discussion on how the VC is used to evaluate a patient’s need for mechanical ventilation.
A bedside vital capacity test is widely used to help in the assessment of a mechanically ventilated patient’s ability to breathe effectively. This issue and weaning guidelines are discussed in Chapter 15. In general, a decreasing VC is a sign that the patient is tired and failing. (Racial adjustment and BTPS correction are not typically done when the VC is used for bedside spirometry.)
8. Forced expiratory volume in one second
MODULE C
2. Exhaled nitric oxide
3. Forced vital capacity
a. Perform the test (Code: IB9e and IIIE7a) [Difficulty: ELE: R, Ap; WRE: An]
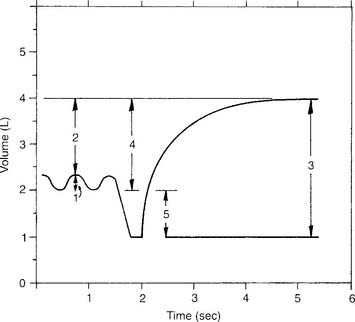
If the measurement instrument does not give a printout, simply record the patient’s efforts in the chart. If the measurement instrument does give a printout, include copies of the efforts. See Figure 4-3 for the tracing of a properly performed FVC. The tracing allows comparison of the volumes exhaled in a series of 1-second intervals. Because of this, the tracing often is referred to as a volume-time curve. Note that the start of the effort is smooth and without interruption. The initial fast flow of gas from the upper airway is seen as the nearly vertical part of the tracing. The rest of the tracing is smooth without any coughing or other interruptions in the patient’s effort. The tracing becomes progressively more horizontal as the end of the effort is reached. Encourage the patient to try to push out as much air as possible as the end approaches. To provide an acceptable FVC, the patient must show maximum effort without coughing or closing the glottis, and the expiratory effort must last at least 6 seconds. The patient’s final 2 seconds of expiratory effort should show no appreciable airflow. Each of the three acceptable FVCs must show these traits and close similarity of the patient’s efforts.
b. Interpret FVC and spirometry graphics
Figure 4-3 was made on a chain-compensated, water-seal spirometry system. Note how the tracing progresses from the right to the left. The Stead-Wells system shows the same tracing “upside down” compared with the chain-compensated system. The tracing starts on the left and moves to the right (Figures 4-4 and 4-5). Other tracings may show either the chain-compensated or the Stead-Wells tracings in a mirror image or opposite shape.
c. Interpret the results (Code: IB10e and IIIE7a) [Difficulty: ELE: R, Ap; WRE: An]
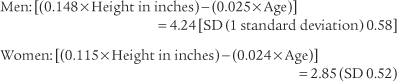
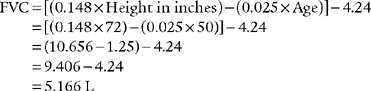
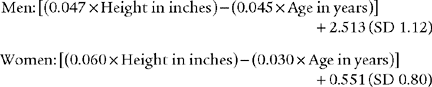
Normal racial differences in the FVC must be taken into consideration. Most modern pulmonary function systems automatically adjust the measured values for racial differences when so programmed by the operator. If not, the predicted values should be mathematically adjusted by the therapist. The predicted normal values, in liters, for the FVC in Caucasian patients were reported by Morris, Koski, and Johnson (1971) as:*
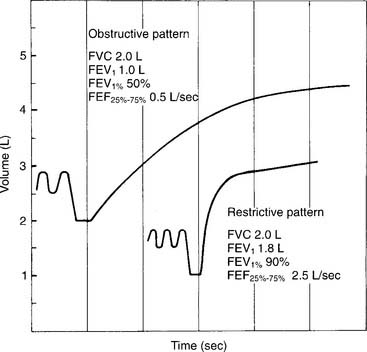
Restrictive problems, such as advanced pregnancy, obesity, ascites, neuromuscular disease, sarcoidosis, and chest wall or spinal deformity, can result in a small FVC. Patients with chronic obstructive lung diseases, such as emphysema, bronchitis, asthma, cystic fibrosis, and bronchiectasis, commonly have a small FVC. (Figure 4-5 shows a comparison of the spirometry tracings of a normal, an obstructed, and a restricted patient.)


4. Peak flow
a. Perform the procedure (Code: IB9d) [Difficulty: ELE: R; WRE: Ap, An]
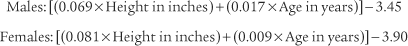
For bedside spirometry or home care, the patient’s effort is easily measured directly with a handheld peak flowmeter. Usually at least three efforts are required to find two that are acceptably close. PF values that are consistent and low despite variable patient efforts probably indicate a malfunctioning unit that should not be used. It is reasonable to record the patient’s effort in liters per second, because the effort takes place in about that much time. However, do not be confused by some measurement instruments and other prediction equations giving the value in liters per minute. Simply multiply or divide by 60 to convert your patient’s effort from one time frame to the other. For example, a young man’s PF might be recorded as 10 L/sec or 600 L/min. Cherniack and Raber (1972) published the following formulas for predicting PF in liters per second*:
Timed forced expiratory volume tests
All of the timed forced expiratory volume tests are derived from a properly performed FVC test (see Figure 4-3). When the FVC is done correctly, the following values can be properly calculated and evaluated to determine the patient’s condition. As discussed earlier, an FVC within 80% of predicted is interpreted as within normal limits. Therefore, if the results of the following tests show patient values within 80% of predicted, the results are interpreted as being within normal limits.
5. Forced expiratory flow25%-75% (FEF25%-75%)
a. Perform the procedure (Code: IB9u) [Difficulty: ELE: R, Ap; WRE: An]
The FEF25%-75% is the mean forced expiratory flow during the middle half of an acceptable FVC (Figure 4-6). The FVC effort to use for this test is the one that has the greatest combination of FVC volume and FEV1. As mentioned earlier, the patient must give his or her best effort. The measurement usually is recorded in liters per second but may be recorded in liters per minute.
b. Interpret the results (Code: IB10u) [Difficulty: ELE: R, Ap; WRE: An]
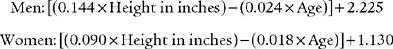
The results are normally less than in the PF test, because the flow being measured comes from medium-size and small airways (smaller than 2 mm in diameter). The results should decline with age and should be lower in women than in men. A patient with a restrictive lung disease may have a normal or increased value, whereas a low value is seen in a patient with obstructive lung disease. A small FEF25%-75% value when the FVC and FEV1 values are normal often is taken to indicate early small airway disease. A normal, 68-kg (150-lb) young man should have values of 4 to 5 L/sec or 240 to 300 L/min. The following formulas were developed by Morris, Koski, and Johnson (1971) and can be used to calculate the predicted values in liters per second:
6. Forced expiratory volume timed (FEVT)
a. Perform the procedure (Code: IB9u) [Difficulty: ELE: R, Ap; WRE: An]
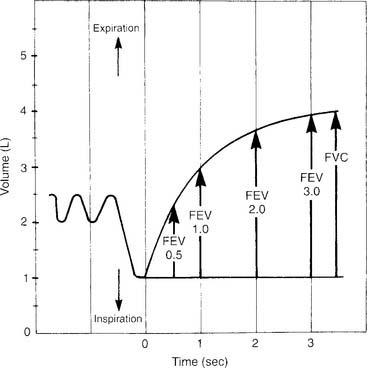
The timed forced expiratory volumes (FEV0.5, FEV1, FEV2, FEV3) effectively “cut” the FVC into sections based on how much volume the patient forcibly exhales in 0.5, 1, 2, and 3 seconds. Some patients with severe obstructive lung disease require several more seconds to exhale completely. In these cases, simply keep measuring the volume exhaled in each additional second. Figure 4-7 shows an FVC tracing that is subdivided at 0.5-, 1-, 2-, and 3-second intervals. Some bedside units give a numeric value for some or all of the timed intervals; however, it is best to have a spirometer that produces a printed copy of the patient’s FVC effort. The individual volumes can be determined by marking the vertical distance on the volume scale from the baseline (total lung capacity) to the respective arrow tips.
b. Interpret the results (Code: IB10u) [Difficulty: ELE: R, Ap; WRE: An]
The FEVT values often are reduced in both restrictive and obstructive lung diseases. Patients with a severe restrictive lung disease exhale almost all of their small FVC within the first second. Patients with severe obstructive lung disease show low values at all time intervals, with the volumes at FEV2, FEV3, and so on, becoming progressively smaller. The most commonly evaluated values are the FEV1 and the FEV1%. The following formulas* were developed by Morris, Koski, and Johnson (1971) and can be used to calculate the predicted values for FEV1 in liters:
7. Forced expiratory volume/forced vital capacity ratio (FEVT/FVC or FEVT%)
a. Perform the procedure (Code: IB9u) [Difficulty: ELE: R, Ap; WRE: An]
The FEVT to FVC ratio compares, by division, the volume exhaled at 0.5, 1, 2, and 3 (or more) seconds (see Figure 4-7) with the FVC. This results in a series of decimal fractions. These are multiplied by 100 to convert the answers to percentages.
| FEV0.5 | 50% to 60% of the FVC |
| FEV1 | 75% to 85% of the FVC |
| FEV2 | 94% of the FVC |
| FEV3 | 97% of the FVC |
b. Interpret the results (Code: IB10u) [Difficulty: ELE: R, Ap; WRE: An]
Patients with restrictive lung diseases often exhale the FVC more quickly than expected. This happens because these patients have a smaller than normal FVC and stiff lungs, which recoil more quickly than expected to their resting volume. See Figure 4-4 to compare the FVC curves of a patient with restrictive lung disease with the FVC curves of a patient with obstructive lung disease.
8. Spirometry before and after inhalation of an aerosolized bronchodilator
a. Perform the procedure (Code: IB9u) [Difficulty: ELE: R, Ap; WRE: An]
The following are common indications for the procedure:
9. Bronchoprovocation studies
a. Perform the procedure (Code: IIIE7f) [Difficulty: ELE: R, Ap; WRE: An]
The basic procedure is as follows:
If the patient is normal, continue as follows:
10. Flow-volume loops
b. Interpret the results (Code: IB10u) [Difficulty: ELE: R, Ap; WRE: An]
1. Normal
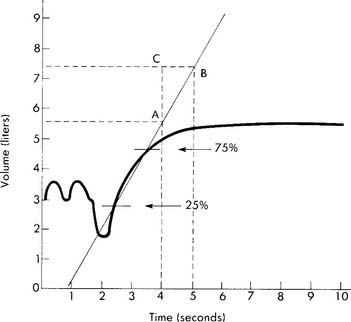
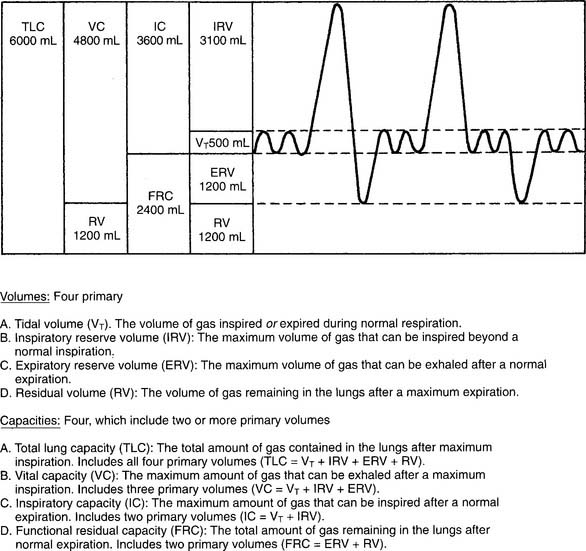
A normal flow-volume loop is shown in Figures 4-8 and 4-9. First look at Figure 4-8, in which the various volumes are measured on the horizontal scale. The tidal volume (VT) of 500 mL is the small loop within the larger VC loop. The ERV and IRV are shown on both sides of the tidal volume. The FVC is shown as the total of all three volumes. Finally, TLC and residual volume (RV) are marked.
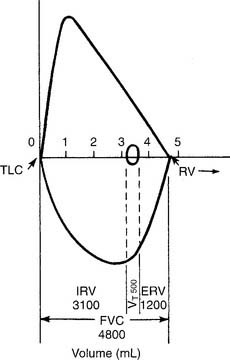
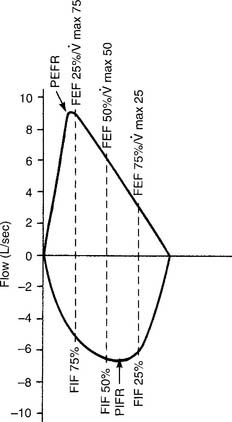
Figure 4-9 shows the same normal flow-volume loop in which the various flows are measured on the vertical scale. Starting from TLC with the FEVC, the peak expiratory flow rate is seen as the greatest flow generated; it is about 9 L/sec. Starting from RV with the FIVC, the peak inspiratory flow rate is seen as the greatest flow that is generated; it is about 7 L/sec. It is normal for the PEFR to be greater than the PIFR.
To find the instantaneous flow at any FVC lung volume, the FVC must be divided by 4 to find the 25th, 50th, and 75th percentile points. In Figure 4-8, the FVC is 4,800 mL. Dividing by 4 gives 1,200 mL per quarter of the FVC. These points are marked on the horizontal volume scale. If a vertical (dashed) line is drawn through these three points to the flow-volume tracing, the instantaneous flows at these volumes can be found. Expiratory flows are reported as follows:
 (maximum flow with 75% of the FVC remaining), or FEF25% (forced expiratory flow with 25% of the FVC exhaled)
 (maximum flow with 50% of the FVC remaining), or FEF50% (forced expiratory flow with 50% of the FVC exhaled)
 (maximum flow with 25% of the FVC remaining), or FEF75% (forced expiratory flow with 75% of the FVC exhaled)
Inspiratory flows are reported in this way:
The PEFR and FEF25 or  values should be about the same, because they all measure flow through the large upper airways. Either test is a good gauge of the patient’s effort, because it will be low if the patient is not trying hard. The FEF50 or
  values should approximate the FEF25%-75% values, because they both show flow through the medium to small airways in the middle half of the FVC effort. It is normal for the FIF50 to be greater than the FEF50. The FEF75 or
  values are the best indicator of early small airway disease because both show flow through the small airways as the patient approaches the residual volume. Note that the tracing from the FEF25 or
  point to the residual volume is close to a straight line. In normal patients, the flow decreases in proportion to the decreasing lung volume, resulting in the straight-line tracing. Cherniack and Raber (1972) published formulas for predicting adult MEFV flows in liters per second; see the bibliography.
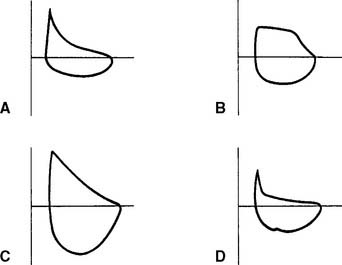
2. Small airway disease
Figure 4-10 shows representative flow-volume loops for patients with asthma and emphysema superimposed over a normal flow-volume loop. Note that both loops are shifted to the left, toward the TLC, because the residual volumes are increased. Also note that the flows are decreased more than normal as the patient exhales closer to the residual volume. This “scooped out” appearance is very characteristic of small airway disease. Having the patient inhale a bronchodilator and repeating the flow-volume loop shows the degree of reversibility. Some computer-based systems allow the before and after bronchodilator loops to be superimposed to show further the amount of improvement.
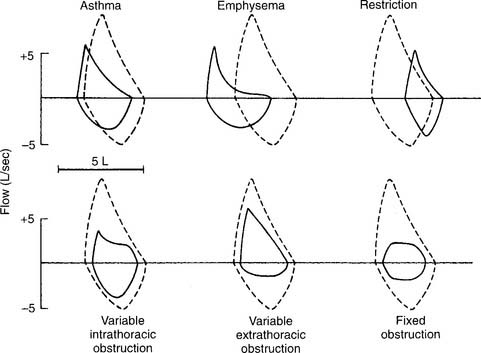
3. Restriction
A restriction can be caused by a pulmonary condition, such as fibrosis; a thoracic condition, such as pleural effusion, pneumothorax, hemothorax, or kyphoscoliosis; or obesity, advanced pregnancy, or ascites pushing up on the diaphragm. Only fibrosis and kyphoscoliosis are permanent. Figure 4-10 shows a representative flow-volume loop for a patient with restrictive lung disease. Note that the volume is small and shifted to the right, toward the small residual volume.
4. Variable intrathoracic obstruction
A variable intrathoracic obstruction can be caused by a tumor or foreign body that partly blocks a bronchus. Figure 4-10 shows a representative flow-volume curve. Note that the FVC volume is almost normal, with a greatly decreased peak expiratory flow rate.
5. Variable extrathoracic obstruction
A variable extrathoracic obstruction can be caused by vocal cord paralysis, laryngeal tumor, or a foreign body that partly obstructs the upper airway. Figure 4-10 shows a representative flow-volume curve. Note that the FVC volume is almost normal, with a greatly reduced inspiratory flow. This same pattern is commonly seen in patients with obstructive sleep apnea. The FEF50% will be greater than the FIF50%.
6. Fixed obstruction
A fixed obstruction usually is caused by a tumor in the trachea or a mainstem bronchus. Figure 4-10 shows a representative flow-volume loop. Again, the FVC volume is close to normal. Note the abnormally reduced inspiratory and expiratory flow rates. The tracing looks almost squared off, with the FEF50% and FIF50% values being about the same.
11. Maximum voluntary ventilation
a. Perform the procedure (Code: IB9u) [Difficulty: ELE: R, Ap; WRE: An]
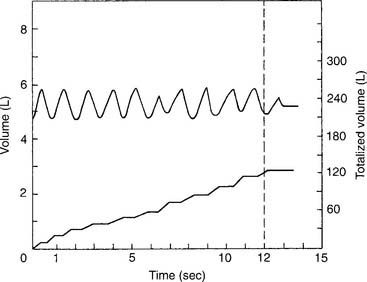
The patient should breathe at a volume that is greater than the tidal volume but less than the VC, at a rate of 70 to 120 per minute. The minimum time for the test is 12 seconds. Figure 4-11 shows two different tracings of the MVV effort. The total volume exhaled in the given period is mathematically adjusted for 1 minute so that the derived value is in liters per minute. This is done by multiplying a 5-second effort by 12 or a 12-second effort by 5. The derived value then is BTPS corrected to give the final value.
b. Interpret the results (Code: IB10u) [Difficulty: ELE: R, Ap; WRE: An]
Cherniack and Raber (1972) published the following equations* for predicting the MVV in liters per minute:
The following considerations are important in the evaluation of an abnormally low MVV value:
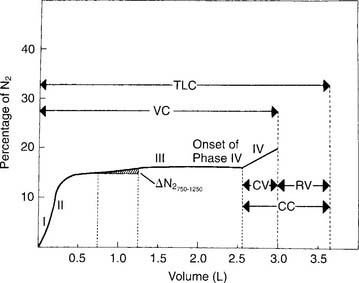
12. Single-breath nitrogen washout test and closing volume
b. Interpret the results (Code: IB10u) [Difficulty: ELE: R, Ap; WRE: An]
Figure 4-12 shows a normal tracing, which shows these phases:
13. Functional residual capacity by the helium dilution method
a. Perform the procedure (Code: IIIE7c) [Difficulty: ELE: R, Ap; WRE: An]
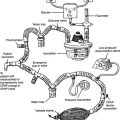
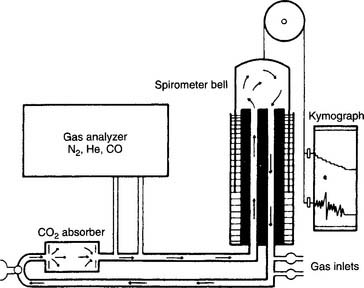
The helium (He) dilution method basically involves diluting the resident gases in the lungs (mainly nitrogen and oxygen) with helium to mathematically determine the FRC. This also is called the closed-circuit method, because the patient and circuit are sealed off. Figure 4-13 shows a schematic drawing of the components that make up the circuit. These include a two-way valve to switch the patient from breathing room air to the helium mix, soda lime to absorb the patient’s exhaled carbon dioxide from the circuit, a combined carbon dioxide (CO2) and water vapor absorber to prevent these gases from entering the helium analyzer, the helium analyzer, a variable speed blower to move the gases through the circuit, a spirometer for monitoring tidal volumes, an attached kymograph to trace the patient’s breathing pattern, and an oxygen supply to meet the patient’s needs. The helium supply is not shown.

It is beyond the scope of this text to cover all the steps in the helium dilution test; however, the following features of the procedure are important to know. Add enough helium to the room air in the circuit to create a 10% to 15% He mix. At the end of a normal exhalation, the patient is switched to breathing the mix so that the FRC can be determined. The patient breathes the gas mix until the helium is evenly distributed throughout the lungs and the helium percentage is stable. Typically, the test is performed for up to 7 minutes, if needed, to reach an equilibrium point. Extending the test longer may help to reach a stable equilibrium point in abnormal patients. The calculation of RV is rather complex and usually is done through the computer built into the pulmonary function system. Spirometry also must be performed, because the ERV is subtracted from the FRC to find the RV. Commonly the test is repeated. The patient should be allowed to breathe room air for 5 minutes between tests to clear the helium from the lungs. Patients with severe obstructive lung disease may need more time. Bates, Macklem, and Christie (1971) published the following equations* for calculating the normal FRC in liters:
Goldman and Becklake (1959) published the following equations* for calculating the normal RV in liters:
b. Interpret the results (Code: IIIE7c) [Difficulty: ELE: R, Ap; WRE: An]
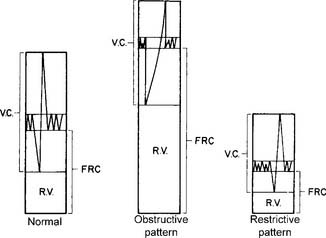
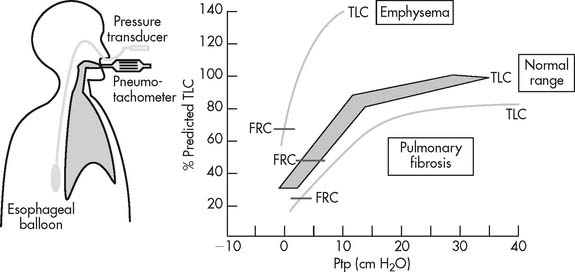
A normal young man has an FRC volume of about 2,400 mL. As shown in Figure 4-14, it is composed of the ERV and the RV. The FRC and RV values are invaluable for diagnosing obstructive and restrictive lung diseases. See Figure 4-6 for the relative volumes and capacities for a normal patient, a patient with an obstructive pattern, and a patient with a restrictive pattern. Note that the obstructive patient has a disproportionate increase in the RV, with a resulting decrease in the FVC. The TLC may be normal, as shown, or, more commonly, lung capacity may be increased. The patient with restrictive disease has a proportionate decrease in all the lung volumes and capacities. It is commonly accepted that the normal limits of TLC are about ±20% of the predicted value. This ±20% of the normal limit applies to the FRC and RV values as well. In other words, obstructive lung disease can be diagnosed by an RV, FRC, or TLC that is more than 120% of the predicted value. Common examples of obstructive diseases include asthma, bronchitis, and emphysema. Restrictive lung disease can be diagnosed by an RV, FRC, or TLC that is less than 80% of the predicted value. Examples of restrictive diseases include fibrotic lung disease, air or fluid in the pleural space, obesity, kyphoscoliosis, pectus excavatum, and neuromuscular weakness or paralysis.
The following factors are important to ensure that the measured values are accurate:
14. Functional residual capacity by the nitrogen washout method
a. Perform the procedure (Code: IIIE7c) [Difficulty: ELE: R, Ap; WRE: An]
Figure 4-15 shows a schematic drawing of the components that make up the automated nitrogen washout system and circuit. These include a solenoid valve to switch the patient from breathing room air to breathing pure oxygen, an oxygen source with demand valve, a nitrogen analyzer with recorder, a pneumotachometer, and a microprocessor that directs all the necessary activities for the test. It is beyond the scope of this text to go into the complete procedure for the test; however, the following features should be known. The circuit is filled with pure oxygen. The patient is switched from room air to oxygen at the end of a normal exhalation so that the nitrogen in the FRC can be determined. Typically, the test is performed for up to 7 minutes or until the nitrogen percentage falls below a target level. This target percentage has been reported by various authors as 1% (best results) up to 3%. Extending the test longer may help to reach a target level in patients with increased airway resistance or an increased lung volume. As before, the calculation of RV is rather complex and is usually done through the computer built into the pulmonary function system. Spirometry also must be performed, because the ERV is subtracted from the FRC to find the RV. Commonly the test is repeated. The patient should be allowed to breathe room air for at least 15 minutes between tests to clear the oxygen from the lungs. Patients with severe obstructive lung disease may need more time.
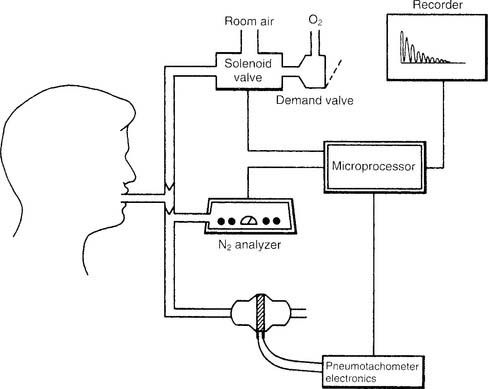
b. Interpret the results (Code: IIIE7c) [Difficulty: ELE: R, Ap; WRE: An]
The following considerations are important to ensure that the measured values are accurate:
15. Total lung capacity
a. Perform the procedure (Code: IIIE7c) [Difficulty: ELE: R, Ap; WRE: An]
See Figure 4-14 for an example of the relationships between lung volumes and capacities. As can be seen, the TLC can be found by adding several combinations of volumes and capacities. Most commonly, it is calculated by adding the FRC to the inspiratory capacity (IC) found through spirometry. However, be prepared to add or subtract various combinations of volumes and capacities to find the TLC.
b. Interpret the results (Code: IIIE7c) [Difficulty: ELE: R, Ap; WRE: An]
The TLC results cannot be interpreted without looking at the volumes and capacities that compose it. Figure 4-5 shows representative TLC patterns for a normal patient and a patient with an obstructive pattern and a restrictive pattern. Note that with the abnormal patterns, the FRC and its components, the ERV and RV, are out of proportion. Patients with emphysema, bronchitis, or asthma often show the obstructive pattern with its large FRC of trapped gas. Patients with fibrotic lung disease, thoracic deformities, or obesity often show the restrictive pattern, with its decreased FRC and other lung volumes.
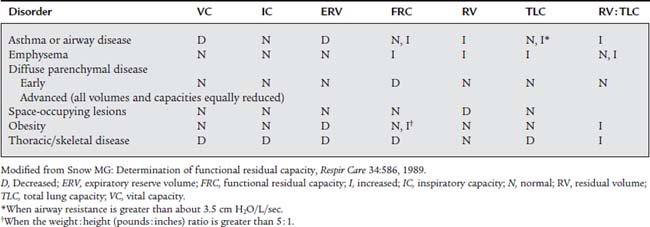
Some practitioners use the general rule that a TLC more than 120% of predicted indicates an obstructive pattern, and a TLC less than 80% of predicted indicates a restrictive pattern. However, this may be an oversimplification. It is more reliable to calculate the RV to TLC (RV/TLC) ratio. This takes into account the interrelation of the two. Normal healthy adults have an RV/TLC ratio of 0.20 (20%) to 0.35 (35%). An increased RV/TLC ratio is commonly seen in patients with emphysema and an increased RV. However, if the patient’s TLC is increased in proportion to the RV, the ratio may be within normal limits. A decreased RV/TLC ratio is commonly seen in patients with fibrotic lung disease. The ratio will be normal, however, if the patient’s TLC is decreased in proportion to the RV. Table 4-3 shows the relationship of the lung volumes and capacities, TLC, and the RV/TLC ratio found in a number of conditions.
16. Body plethysmography
The body plethysmography unit (sometimes called the body bubble or body box) is a sealable chamber large enough for an adult to sit inside. Auxiliary equipment includes a differential pressure pneumotachometer, a monitor/storage oscilloscope, a computer, and a recording device (Figure 4-16). The plethysmograph can be used to measure (1) the FRC and, from that, the RV and TLC; (2) lung compliance; and (3) airway resistance. Each of these tests is discussed later.
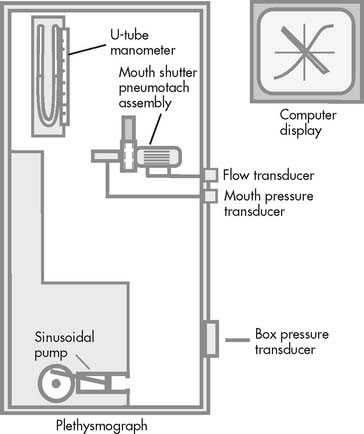
a. Thoracic gas volume
1. Perform the procedure (Code: IIIE7c) [Difficulty: ELE: R, Ap; WRE: An]
It is not possible to go into a complete discussion of the procedure; however, the following steps are important. The unit must be sealed so that it is airtight during the patient’s breathing. The patient is instructed to breathe a normal tidal volume through the pneumotachometer. At the end of exhalation (FRC), a shutter is closed on the pneumotachometer so that no air leaks. The patient is instructed to continue to make tidal volume breathing efforts. The computer integrates the following two pressure changes: (1) a decrease in mouth pressure as the patient attempts to inhale, and (2) an increase in plethysmograph chamber pressure as the patient’s chest expands. The patient’s TGV is then determined at FRC. Figure 4-17, A, shows a normal TGV loop on the oscilloscope. Through spirometry, the patient’s ERV, RV, and TLC can be calculated.
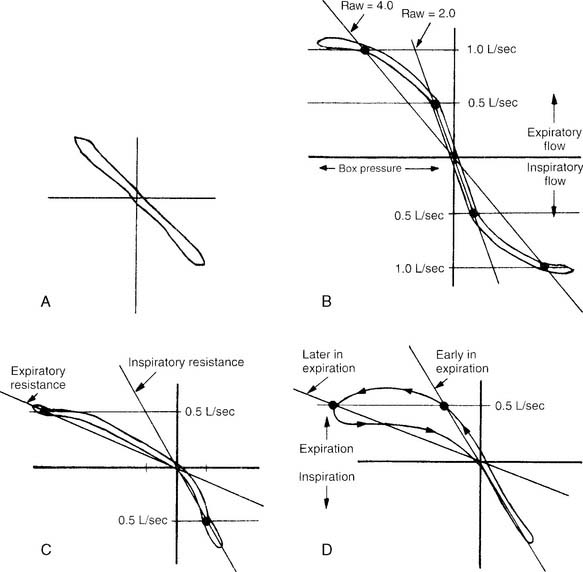
2. Interpret the results (Code: IIIE7c) [Difficulty: ELE: R, Ap; WRE: An]
The interpretation of the TGV and TLC results from a body plethysmograph are about the same as the interpretation of the FRC and TLC results from the helium dilution or nitrogen washout methods. (Review these earlier discussions if needed.) The only difference would be if the TGV were significantly larger than the FRC. This would indicate that the patient has trapped gas that was measured only in the plethysmograph. The TGV is commonly larger than the FRC measured by the preceding two methods when the patient has chronic obstructive pulmonary disease (COPD). This is because it includes all the gas found in the thorax. That gas may be found in normal alveoli connected by a patent airway to the atmosphere, but the TGV may also include gas trapped in emphysematous blebs and bullae, pneumothorax, pneumomediastinum, and so forth.
b. Lung compliance
2. Perform the procedure (Code: IB9n and IIIE7b) [Difficulty: ELE: R, Ap; WRE: An]
The patient must swallow a balloon 10 cm long to the midthoracic level. A catheter connects the proximal end of the balloon to a pressure transducer outside the patient. Air is injected into the balloon, and the transducer is calibrated accurately to measure changes in intrathoracic pressure as the patient breathes. The patient is then placed into a body plethysmograph that is sealed. He or she is told to breathe through the differential pressure pneumotachometer to measure lung volumes. The patient is then instructed to inhale slowly from the resting level (FRC) to TLC. As this is done, the pneumotachometer shutter is periodically closed to measure the intrathoracic pressure decrease at the increasing volumes (Figure 4-18). As the patient slowly exhales from TLC, the shutter is again periodically closed to measure the increasing intrathoracic pressure as the patient returns to FRC volume. Lung compliance is usually calculated from the pressure and volume points of FRC and FRC plus 500 mL (for a tidal volume).
c. Airway resistance
2. Perform the procedure (Code: IB9n and IIIE7b) [Difficulty: ELE: R, Ap; WRE: An]
The patient is placed into a plethysmograph that is sealed. He or she is instructed to breathe through a differential pressure pneumotachometer. With the pneumotachometer shutter open, the patient is told to pant several tidal volumes of about 500 mL at a rate of 1 breath per second. Data on flow rate, tidal volume, mouth pressure changes, and chamber pressure changes are recorded and graphed (Figure 4-19). Then the shutter is closed at the patient’s resting FRC volume. The patient is told to continue panting at the same volume and rate. Again, flow rate, tidal volume, mouth pressure changes, and chamber pressures are recorded and graphed. The computer integrates the data to calculate the patient’s airway resistance during tidal volume breathing.
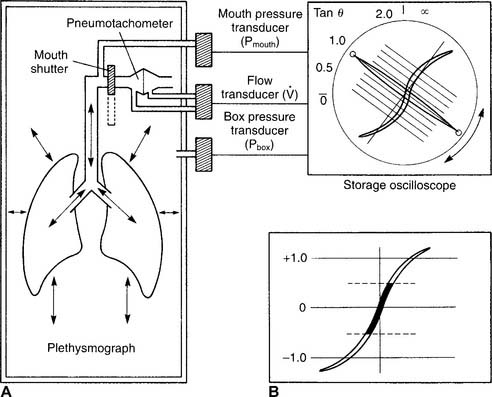
3. Interpret the results (Code: IIIE7b) [Difficulty: ELE: R, Ap; WRE: An]
Increased airway resistance is abnormal. It is most readily noticed if the problem is in the upper airway, trachea, or major bronchi, because most resistance is normally found there. Patients with asthma, bronchitis, and emphysema have most of their resistance in the airways that are 2 mm or less in diameter. Because of this, significant disease must be present before a large enough airway resistance is noticed to alert the therapist or physician to the problem. Figure 4-17, B through D, shows normal and increased expiratory resistance curves. Madama (1998) lists the following airway resistance values and their severity:
| Raw (cm H2O/L/sec) | Severity |
| 2.8 to 4.5 | Mild |
| 4.5 to 8 | Moderate |
| Over 8 | Severe |
17. Diffusing capacity
a. Perform the procedure (Code: IIIE7d) [Difficulty: ELE: R, Ap; WRE: An]
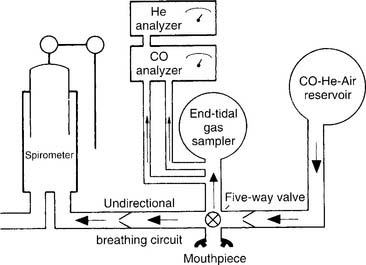
The following are key steps in the procedure. A reservoir or spirometer is filled with a mix of 0.3% CO, 10% He, 21% O2, and the balance of N2 (Figure 4-20). The patient is connected to the apparatus and breathes room air while being instructed in the test. After the patient is told to exhale completely (to RV), the practitioner switches the patient to the gas mix. The patient is instructed to rapidly inhale an IVC. A shutter automatically closes so that the patient cannot exhale for 10 seconds. This allows time for some of the carbon monoxide to diffuse into the patient’s bloodstream.
b. Interpret the results (Code: IIIE7d) [Difficulty: ELE: R, Ap; WRE: An]
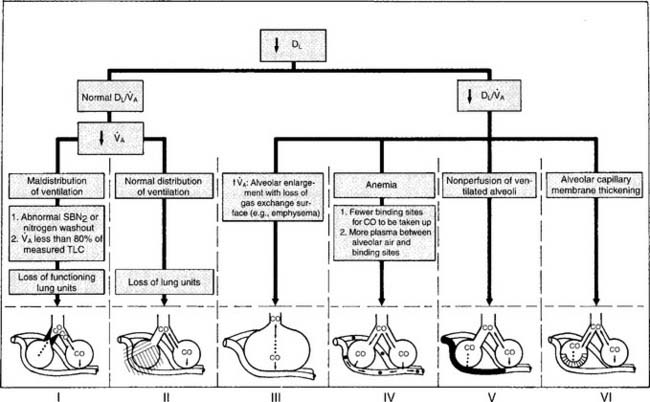
It should be noted that a number of other authors have developed their own prediction equations. In general, patients who show DLCO-SB results within ± 20% of the predicted values (80% to 120% of predicted) are considered to be within normal limits. A patient who has actual results that are significantly below the predicted values (<80% of predicted) has a problem with lung diffusion. Figure 4-21 shows a number of common conditions that can lead to poor lung diffusion. The following factors also should be taken into consideration when interpreting the measured values:
MODULE E
1. Manipulate water, digital, and aneroid manometers (pressure gauges) by order or protocol (ELE code: IIA16) [Difficulty: ELE: R, Ap, An]
a. Get the necessary equipment for the procedure
Water (or mercury) manometers have a vertical column of the liquid and are commonly used in a blood pressure sphygmomanometer. The pressure units depend on the type of liquid. A water manometer will have units of centimeters of water (cm H2O) pressure; mercury manometers will have units of millimeters of mercury (mm Hg). The fluid column must be kept vertical for accuracy. An aneroid (spring-loaded) unit should be selected if the pressure gauge cannot be kept in a vertical position. Aneroid manometers can be calibrated in either mm Hg or cm H2O pressure and look like a Bourdon gauge. Newer, digital manometers will display the measured pressure on a light emitting diode (LED) or other display. (Note: The NBRC recently substituted digital for mercury manometers in this section. Mercury manometers are being phased out because of environmental concerns over mercury spills.)
2. Manipulate inspiratory or expiratory force meters (pressure gauges) by order or protocol (ELE code: IIA16) [Difficulty: ELE: R, Ap, An]
b. Put the equipment together and make sure that it works properly
No standard setup exists for these devices. See Figure 4-2 for two possible assemblies. The system can be sealed and pressure checked with a known force to make sure that the pressure manometer is accurate and all the connections are airtight.
3. Manipulate a pressure transducer by order or protocol (ELE code: IIA16) [Difficulty: ELE: R, Ap, An]
c. Troubleshoot any problems with the equipment
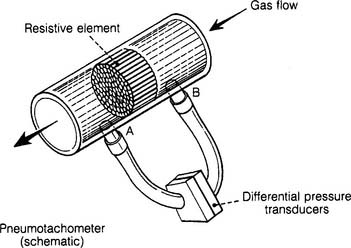
Each type of pressure transducer should be assembled as described by the manufacturer. As seen in Figure 4-22, the differential pressure transducer has small-bore tubing connecting it before and after a resistive element. These small tubes transmit the pressures before and after the resistance element to the transducer as gas flows through the large, main tube. Make sure that the tubing is properly connected to the main tube and transducer. If a tube were to disconnect, the transducer would give a reading of zero.
4. Manipulate a pneumotachometer respirometer by order or protocol (ELE code: IIA17) [Difficulty: ELE: R, Ap, An]
d. Differential-pressure (flow sensing) pneumotachometer
Some articles refer to a differential pressure pneumotachometer as a Fleisch-type device. These units have a resistive element (tubes or mesh screen) in the flow tube. The faster the flow of gas through the flow tube, the greater the pressure difference before and after the resistance. Hoses connect the flow tubes before and after the resistive element to the differential pressure transducer. The transducer converts this pressure difference into an electrical signal. A microprocessor calculates the various patient values from this information (see Figure 4-22).
e. Heat-transfer pneumotachometer
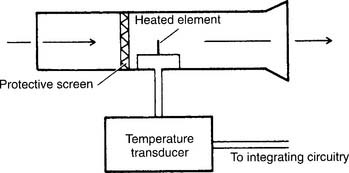
Some articles refer to a heat-transfer pneumotachometer as a thermistor-type device or hot-wire anemometer. These units have a heated thermistor that is cooled as the gas flows past it. The temperature transducer automatically increases and measures the flow of electricity to the thermistor to keep it at the required temperature. A microprocessor calculates the various patient values from this information. The earlier discussion on assembly, calibration, and troubleshooting applies to the heat-transfer pneumotachometers, except that no pressure-relaying hoses are present (Figure 4-23).
5. Manipulate bedside screening spirometers by order or protocol (ELE code: IIA25) [Difficulty: ELE: R, Ap, An]
a. Get the necessary equipment for the procedure
Following are typical pulmonary function tests performed at the patient’s bedside:
The tidal volume and VC volumes can be measured on a handheld, turbine-type flow sensor, such as the Wright respirometer. The patient’s peak flow is measured on a dedicated, handheld PF meter. A pressure gauge capable of measuring both positive and negative pressure is used for the MEP and MIP (see Figure 4-2). In addition, there are electrically powered, portable PFT units that contain a micropressor and can measure all of the standard spirometry volumes and flow.
6. Manipulate CO, He, O2, and specialty gas analyzers by order or protocol (Code: IIA26) [Difficulty: ELE: R, Ap; WR: An]
a. Get the necessary equipment for the procedure
b. Put the equipment together and make sure that it works properly
Check the label on the tank to be sure it is the correct gas at the correct percentage. Review Table 6-1 for color codings for tanks, if needed. Each specialty gas has its own diameter index safety system (DISS) reduction valve to connect to the tank. A high-pressure hose connects the reduction valve outlet to the pulmonary function testing machine inlet.
MODULE F
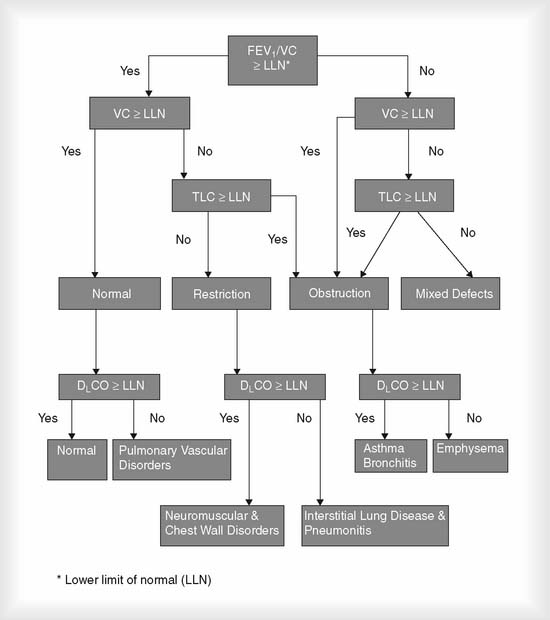
1. Analyze available information to determine the patient’s pathophysiologic state (Code: IIIH1) [Difficulty: ELE: R, Ap; WRE: Ap]
Even though a physician must legally determine the patient’s diagnosis, a therapist must be able to understand the cause, pathophysiology, diagnosis, treatment, and prognosis for patients with cardiopulmonary disorders. Interpretation of patient data that is tested by the NBRC was discussed earlier. Figure 4-24 shows an algorithm demonstrating several key pulmonary function differences between normal people and those with common pulmonary conditions. The following is a brief summary of the PFT test results that would indicate an obstructive or restrictive lung condition.
MODULE G
1. Develop outcomes of quality improvement programs (Code: IIIH7a) [Difficulty: ELE: R; WRE: Ap, An]
3. Record and monitor the quality control (QC) data using accepted statistical methods (Code: IIC8) [Difficulty: ELE: R, Ap; WRE: An]
4. Perform quality control procedures for pulmonary function equipment (Code: IIC4) [Difficulty: ELE: R, Ap; WRE: An]
a. Water-seal spirometers
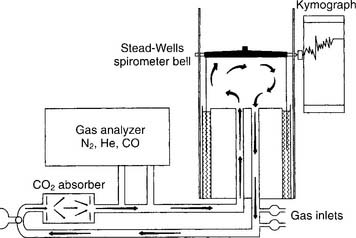
Water-seal spirometers are the commonly found chain-compensated and Stead-Wells units made by Collins Medical (see Figure 4-25 for the cutaway appearance of the chain-compensated type). The bell falls and rises as the patient breathes in and out. A pulley system attached to the bell and the marking pens record the patient’s efforts on the rotating kymograph paper. Note that the tracing is inverted from the patient’s actual breathing effort. The Stead-Wells units have the marking pen attached directly to the bell, and the tracing directly shows the patient’s breathing efforts (Figure 4-26). The newer chain-compensated and Stead-Wells units also have microprocessors for calculating patient information.
b. Dry rolling-seal spirometers
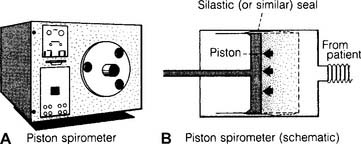
Dry rolling-seal spirometers are sometimes called piston spirometers. As can be seen in Figure 4-27, these units use a flexible silicone rubber (Silastic) or Teflon-coated rubber seal instead of water. The large volume piston moves in and out as the patient breathes. The patient’s efforts can be directly recorded by pen on paper.
c. Wedge-type spirometers
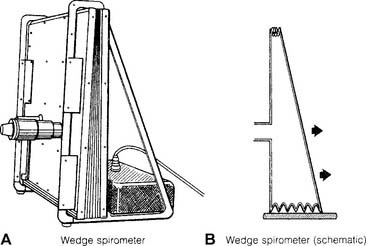
Wedge-type spirometers are sometimes called bellows spirometers (Figure 4-28). Note that these units have plastic or rubber bellows that are fixed on one side and flexible like an accordion on other sides. The bellows move in and out as the patient breathes. The patient’s efforts can be directly recorded by pen on paper. Newer units also have microprocessors for calculating the information.
d. Spirometry equipment
Body plethysmography equipment
(See Figure 4-16 for the basic components of the system.) The plethysmograph chamber must be airtight when the door and all vents are closed. This can be confirmed by attaching a pressure manometer to a chamber port and applying a known volume or pressure into the sealed chamber. The pressures should be identical between the chamber pressure gauges and outside pressure manometer. The differential-pressure pneumotachometer must also read accurately when a known volume is pumped through it. Most manufacturers have a series of calibration check procedures listed in the equipment literature.
5. Perform quality control procedures for gas analyzers (Code: IIC4) [Difficulty: ELE: R, Ap; WRE: An]
a. Nitrogen washout equipment for measuring functional residual capacity
(See Figure 4-15 for the basic setup and breathing circuit of a nitrogen washout system.) Review the troubleshooting of volume-displacement and pneumotachometer spirometers; they are used with the nitrogen washout procedure to find the FRC. The nitrogen washout–type RV test uses an emission spectroscopy ionization chamber analyzer for nitrogen. It is more commonly called a Giesler tube ionizer. It uses a vacuum pump to draw a gas sample into the ionization chamber. The intensity of the light spectrum given off by the ionized nitrogen directly relates to its percentage in the sample. A two-point calibration check should be performed at least every 6 months to check for linearity. It involves the following steps:
b. Helium dilution equipment for measuring functional residual capacity
(See Figure 4-13 for the basic setup of the helium dilution equipment and breathing circuit.) Again, review the troubleshooting of volume-displacement and pneumotachometer spirometers; they are used with the helium dilution procedure to find the FRC. Both the helium dilution FRC test and the lung diffusion tests require the analysis of helium in the gas mixture. A thermal conductivity analyzer typically is used. It operates under the principle of a Wheatstone bridge, in which differences in gas density lead to different cooling rates of heated thermistor beads. The different rates of cooling change electrical resistances and cause different electrical currents to flow. In a helium analyzer, the greater the helium concentration, the faster the thermistor bead cools, and the more electricity flows through the circuit. This is then read off a meter as the helium percentage.
American Association for Respiratory Care. Clinical practice guideline: spirometry—1996 update. Respir Care. 1996;41:629.
American Association for Respiratory Care. Clinical practice guideline: single-breath carbon monoxide diffusing capacity. Respir Care. 1999;44:539.
American Association for Respiratory Care. Clinical practice guideline: static lung volumes—2001 revision and update. Respir Care. 2001;46:531.
American Association for Respiratory Care. Clinical practice guideline: static lung volumes. Respir Care. 1994;39:830.
American Association for Respiratory Care. Clinical practice guideline: infant/toddler pulmonary function tests—2008 revision and update. Respir Care. 2008;53:929.
American Association for Respiratory Care. Clinical practice guideline: methacholine challenge testing. Respir Care. 2001;46:523.
American Association for Respiratory Care. Clinical practice guideline: body plethysmography—2001 revision and update. Respir Care. 2001;46:506.
American Association for Respiratory Care. Clinical practice guideline: assessing response to bronchodilator therapy at point of care. Respir Care. 1995;40:1300.
American Thoracic Society. Standardization of spirometry—1987 update. Am Rev Respir Dis. 1987;136:1285.
Ayers LN, Whipp BJ, Ziment I. A guide to the interpretation of pulmonary function tests, ed 2. New York: Roerig, 1978.
Bates DV, Macklem PT, Christie RV. Respiratory function in disease, ed 2. Philadelphia: WB Saunders, 1971.
Beauchamp RK. Pulmonary function testing procedures. In: Barnes TA, editor. Respiratory care practice. Chicago: Mosby, 1988.
Black LF, Hyatt RE. Maximal respiratory pressures: normal values and relationship to age and sex. Am Rev Respir Dis. 1969;99:696.
Branson RD, Hurst JM, Davis KJr, et al. Measurement of maximal inspiratory pressure: a comparison of three methods. Respir Care. 1989;34:789.
Buist SA, Ross BB. Predicted values for closing volumes using a modified single-breath nitrogen test. Am Rev Respir Dis. 1975;111:405.
Cairo JM. Assessment of pulmonary function. In Cairo JM, Pilbeam SP, editors: Mosby’s respiratory care equipment, ed 7, St Louis: Mosby, 2004.
Cherniack RM. Pulmonary function testing, ed 2. Philadelphia: WB Saunders, 1992.
Cherniack RM, Raber MD. Normal standards for ventilatory function using an automated wedge spirometer. Am Rev Respir Dis. 1972;106:38.
Clausen JL, editor. Pulmonary function testing guidelines and controversies. Orlando: Grune & Stratton, 1984.
Clausen JL. Clinical interpretation of pulmonary function test. Respir Care. 1989;34:638.
Crapo RO. Reference values for lung function tests. Respir Care. 1989;34:626.
Douce FH. Pulmonary function testing. In Wilkins RL, Stoller JK, Kacmarek RM, editors: Egan’s fundamentals of respiratory care, ed 9, St Louis: Mosby, 2009.
Enright PL, Hodgkin JE. Pulmonary function tests. In Burton GG, Hodgkin JE, Ward JJ, editors: Respiratory care: a guide to clinical practice, ed 4, Philadelphia: Lippincott-Raven, 1997.
Gaensler EA, Wright GW. Evaluation of respiratory impairment. Arch Environ Health. 1966;12:146.
Gardner RM. Pulmonary function laboratory standards. Respir Care. 1989;34:651.
Gardner RM, et al. Computer guidelines for pulmonary laboratories. Am Rev Respir Dis. 1986;134:628.
Goldman HI, Becklake MR. Respiratory function tests: normal values at median altitudes and the prediction of normal results. Am Rev Tuberculosis. 1959;79:457.
Gursel G, Adams AB. Pulmonary function testing. In: Hess DR, MacIntyre NR, Mishoe SC, et al, editors. Respiratory care principles and practice. Philadelphia: WB Saunders, 2002.
Hess D. Measurement of maximal inspiratory pressure: a call for standardization. Respir Care. 1989;34:857.
Holland SA. Pulmonary function testing. In: Wyka KA, Mathews PJ, Clark WF, editors. Foundations of respiratory care. Albany, NY: Delmar, 2002.
Hunt GE. Diagnostic procedures at the bedside. In: Fink JB, Hunt GE, editors. Clinical practice in respiratory care. Philadelphia: Lippincott Williams & Wilkins, 1999.
Kacmarek RM, Cycyk-Chapman MC, Young-Palazzo PJ, et al. Determination of maximal inspiratory pressure: a clinical study and literature review. Respir Care. 1989;34:868.
Knudson RJ, Kaltenborn WT, Knudson DE, et al. The single-breath carbon monoxide diffusing capacity. Am Rev Respir Dis. 1987;135:805.
Knudson RJ, Lebowitz MD, Holberg CJ, et al. Changes in the normal maximal expiratory flow-volume curve with growth and aging. Am Rev Respir Dis. 1983;127:725.
Kory RC, Callahan R, Syner JC. The Veterans Administration–Army cooperative study of pulmonary function. I. Clinical spirometry in normal men. Am J Med. 1961;30:243.
MacIntyre NR. Diffusing capacity of the lung for carbon monoxide. Respir Care. 1989;34:489.
Madama VC. Pulmonary function testing and cardiopulmonary stress testing, ed 2. Albany, NY: Delmar, 1998.
Morris JF, Koski A, Johnson LC. Spirometric standards for healthy nonsmoking adults. Am Rev Respir Dis. 1971;103:57.
National Institutes of Health. Practical guide for the diagnosis and management of asthma, Pub No 97-4053. Atlanta: US Department of Health and Human Services, 1997.
Paoletti P, Viegi G, Pistelli G, et al. Reference equations for the single-breath diffusing capacity. Am Rev Respir Dis. 1985;132:806.
Ruppel G. Manual of pulmonary function testing, ed 9. St Louis: Mosby, 2009.
Single breath carbon monoxide diffusing capacity (transfer factor): recommendations for a standard technique. Am Rev Respir Dis. 1987;136:1299.
Snow MG. Determination of functional residual capacity. Respir Care. 1989;34:586.
Wanger J. Pulmonary function testing, ed 2. Baltimore: Williams & Wilkins, 1996.
Zamel N, Altose MD, Speir WAJr. Statement on spirometry. Chest. 1983;3:547.
SELF-STUDY QUESTIONS FOR THE ENTRY LEVEL EXAM See page 585 for answers
Note: Refer to the figure on p. 147 for questions 15 and 16.
SELF-STUDY QUESTIONS FOR THE WRITTEN REGISTRY EXAM See page 608 for answers
* The atmospheric temperature, pressure, saturated (ATPS) to body temperature, pressure, saturated (BTPS) correction has been calculated into these equations.
* The ATPS to BTPS correction has been calculated into these equations.
* The ATPS to BTPS correction has been calculated into these equations.
* The ATPS to BTPS correction has been calculated into these equations.
* The ATPS to BTPS correction has been calculated into these equations.