[level-membership-for-pulmolory-and-respiratory-category]
15 Mechanical Ventilation of the Adult
Note 1: This book is written to cover every item listed as testable on the Entry Level Examination (ELE), Written Registry Examination (WRE), and Clinical Simulation Examination (CSE).
The listed code for each item is taken from the National Board for Respiratory Care (NBRC) Summary Content Outline for CRT (Certified Respiratory Therapist) and Written RRT (Registered Respiratory Therapist) Examinations (http://evolve.elsevier.com/Sills/resptherapist/). For example, if an item is testable on both the ELE and the WRE, it will be shown simply as: (Code: …). If an item is testable only on the ELE, it will be shown as: (ELE code: …). If an item is testable only on the WRE, it will be shown as: (WRE code: …).
MODULE A
1. Ventilator flow, volume, and pressure waveforms
a. Review the patient’s chart for information on airway graphics (Code: IA7c) [Difficulty: ELE: R; WRE: Ap]
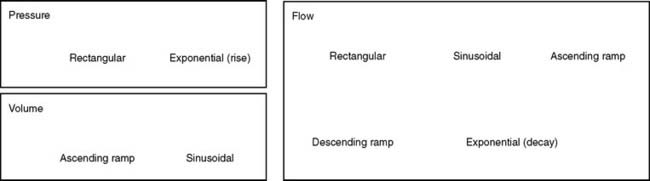
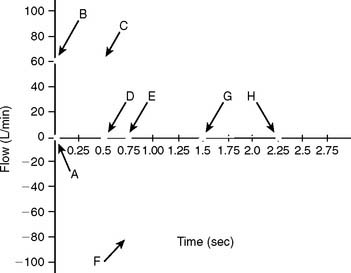
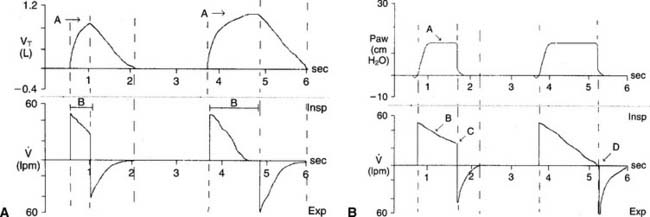
A patient who has been intubated and placed on a modern mechanical ventilator with a microprocessor and graphics software can have ventilator flow, volume, and pressure waveforms visualized on the monitor, stored in memory, or printed out. Look for this information and compare it with the patient’s current situation. See Figure 15-1 for examples of pressure, volume, and flow tracings. See Figure 15-2 for key points of information available from a flow vs. time graph.
b. Perform the procedure to measure ventilator pressure/volume and flow/volume loops (WRE Code: IB9o) [Difficulty: WRE: R, Ap, An]
c. Select ventilator graphics (Code: IIID3) [Difficulty: ELE: R, Ap; WRE: An]
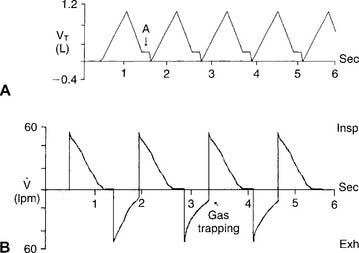
The operator typically can select any two of the following for display on the monitor: time, flow, pressure, and/or volume. Certain combinations are selected to best present the needed information. For example, air trapping is best shown by comparing flow vs. time (Figure 15-3) peak and plateau pressures are best shown by comparing pressure vs. time (Figure 15-4), and lung inflection points are best shown by comparing volume vs. pressure (discussed later). Note examples of ventilator graphics throughout this chapter.
d. Interpret ventilator pressure/volume and flow/volume loops (WRE code: IB10o) [Difficulty: WRE: R, Ap, An]
A number of flow, volume, and pressure waveforms have been included in this chapter for practice. In addition, review Figures 4-1 and 4-10 for examples of pulmonary function test waveform tracings. The examples in this chapter include common clinical situations and are accompanied explanations to help with interpretation.
2. Review the patient’s chart for information on the work of breathing (Code: IA7d) [Difficulty: ELE: R; WRE: Ap]
A patient who has been intubated and placed on a modern mechanical ventilator with a microprocessor and graphics software can have WOB measured. See Figure 15-5 for a pressure/volume loop tracing that shows a patient’s WOB. WOB is minimized when the ventilator is set to minimize the negative pressure and inspiratory flow the patient has to generate.
3. Airway resistance
a. Review the patient’s chart for information on airway resistance (Code: IA7d) [Difficulty: ELE: R; WRE: Ap]
Airway resistance (Raw) may have been measured earlier in the pulmonary function laboratory or on the ventilator. Compare any earlier values with new measurements. This is important for understanding the patient’s trends toward an improving or worsening pulmonary condition.
b. Recommend measurement of the patient’s airway resistance (Code: IC7) [Difficulty: ELE: R, Ap; WRE: An]
c. Determine the patient’s airway resistance (Code: IB9n) [Difficulty: ELE: R, Ap; WRE: An]
1. Procedure for calculating airway resistance
4. Auto-PEEP detection
a. Perform the procedure to detect auto-PEEP (WRE code: IB9w) [Difficulty: WRE: R, Ap, An]
Auto-PEEP is positive end-expiratory pressure in the lungs that cannot be seen on the ventilator’s pressure manometer. (The terms inadvertent PEEP and intrinsic PEEP also are used.) Auto-PEEP is caused by air trapping resulting from an inadequate expiratory time. It becomes more likely when the inspiratory time is increased or the expiratory time is decreased, or in patients with long time constants of ventilation. Simply put, the next breath is delivered before the patient has exhaled completely (see Figure 15-3). This problem is seen frequently in patients with status asthmaticus or COPD because of early small airway closure. In patients with acute respiratory distress syndrome (ARDS) who are receiving pressure-controlled inverse ratio ventilation (PCIRV), the long inspiratory times used increase the risk of expiratory air trapping. Auto-PEEP is more likely to be found when the inspiratory/expiratory (I : E) ratio becomes 2 : 1 or greater.
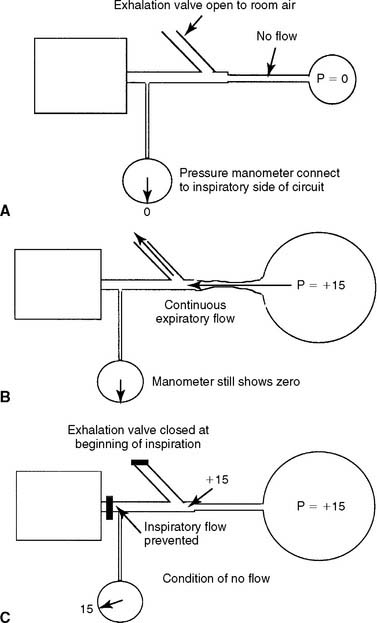
It is important to add any auto-PEEP to the amount of therapeutic PEEP the patient has. This should be recorded as the total PEEP. For example, the patient has 5 cm of therapeutic PEEP and 2 cm of auto-PEEP for 7 cm of total PEEP. It may be thought that the total PEEP level places the patient at risk for volutrauma or decreased venous return and lowered cardiac output. The amount of auto-PEEP can be reduced by decreasing the inspiratory time, increasing the expiratory time, or decreasing the tidal volume. Lack of auto-PEEP can be confirmed by this procedure. If the auto-PEEP cannot be eliminated, therapeutic PEEP can be added to match it. By increasing the baseline pressure, the patient can more easily trigger an assisted or synchronous intermittent mandatory ventilation (SIMV) breath. It is especially important to decrease auto-PEEP and therapeutic PEEP levels as the patient’s lung compliance improves and airway resistance returns to normal.
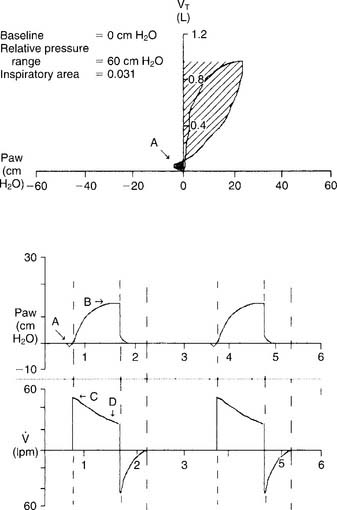
b. Interpret ventilator graphics to detect auto-PEEP (WRE code: IB10w) [Difficulty: WRE: R, Ap, An]
Figure 15-3 demonstrates two ways that air trapping on exhalation can be identified as auto-PEEP (unintended positive end-expiratory pressure). Note in Figure 15-3 (bottom) that the patient’s expiratory flow does not reach baseline pressure before another breath is delivered. This proves that air trapping has occurred. The larger the gap between the pressure at the end of expiration and at baseline, the greater is the air trapping.
5. Determine the patient’s plateau pressure (Code: IB9n) [Difficulty: ELE: R, Ap; WRE: An]
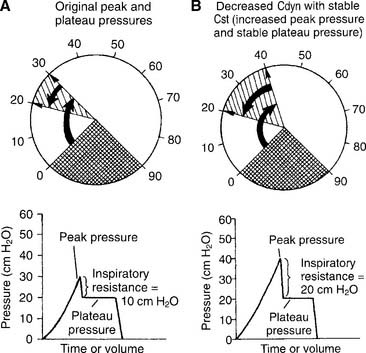
The hold should be held for about 2 seconds so that the pressure manometer value is stable. Note the pressure as the plateau pressure (see Figure 15-4, A). After the plateau pressure has been determined, the patient must exhale completely. It may be necessary to delay the next timed ventilator tidal volume breath to avoid “stacking” a new breath when the first has not yet been exhaled. It is recommended that the plateau pressure procedure be repeated to ensure that the measured pressure is accurate.
6. Lung compliance
a. Review the patient’s chart for information on lung compliance (Code: IA7d) [Difficulty: ELE: R; WRE: Ap]
b. Recommend measurement of the patient’s lung compliance (Code: IC7) [Difficulty: ELE: R, Ap; WRE: An]
c. Determine the patient’s plateau pressure and lung compliance (Code: IB9n) [Difficulty: ELE: R, Ap; WRE: An]
1. Procedure for calculating the tubing compliance factor
For greatest accuracy in the calculation of static and dynamic compliance and the calculation of actual tidal and sigh volumes, any lost volume must be subtracted from the exhaled tidal volume to find the actual tidal volume. The tubing compliance factor is used in the calculation to determine the compressed volume, through the following procedure:

2. Procedure for calculating static compliance
3. Procedure for calculating dynamic compliance
in which compressed volume is Compliance factor × Peak pressure.
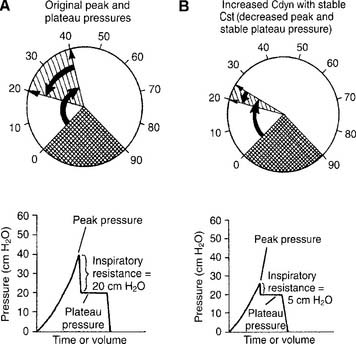
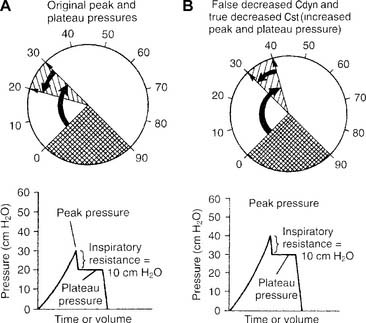
7. Interpret the patient’s lung mechanics results: plateau pressure, airway resistance, dynamic lung compliance, and static lung compliance values on the ventilator (Code: IB10n) [Difficulty: ELE: R, Ap; WRE: An]
a. Decreased dynamic compliance with stable static compliance
Decreased dynamic compliance with stable static compliance is noticed as an increase in the peak pressure with an unchanged plateau pressure (see Figure 15-4). It is caused by increased airway resistance (bronchospasm, secretions, water in the circuit, kinked circuit, or endotracheal tube). Correction of the underlying problem results in return of the peak pressure to the original level.
b. Increased dynamic compliance with stable static compliance
Increased dynamic compliance with stable static compliance is noticed as a decrease in peak pressure with an unchanged plateau pressure (Figure 15-7). This represents an improvement in the patient’s airway resistance from the original condition. Secretions can be diminished, mucus plugs cleared, bronchospasm corrected, and so forth.
c. False decreased dynamic compliance with true decreased static compliance
False decreased dynamic compliance with true decreased static compliance is noticed as an increase in both peak and plateau pressures (Figure 15-8). This is seen when the patient’s lung/thoracic compliance worsens. The plateau pressure is elevated, and the static compliance is decreased.
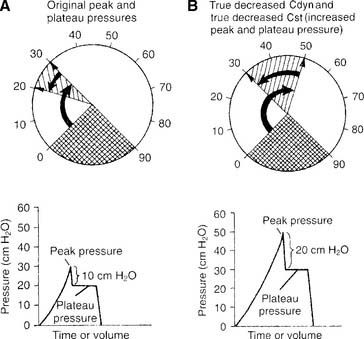
d. True decreased dynamic compliance with true decreased static compliance
True decreased dynamic compliance with true decreased static compliance also is noticed as an increase in both peak and plateau pressures (Figure 15-9). This is seen with the combination of decreased lung compliance and increased airway resistance. Causes of both of these problems were discussed earlier.
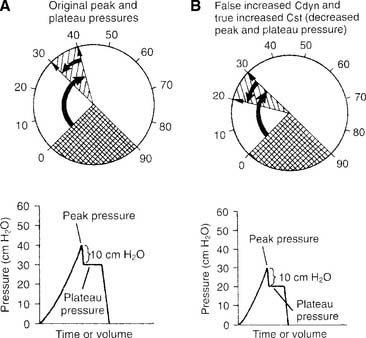
e. False increased dynamic compliance with true increased static compliance
False increased dynamic compliance with true increased static compliance is noticed as a decrease in both peak and plateau pressures (Figure 15-10). This is seen when the patient’s lung/thoracic compliance improves. The plateau pressure decreases, and, as an artifact, the peak pressure also decreases. Notice that the difference between peak and plateau pressures remains the same. This indicates that the patient’s airway resistance is unchanged.
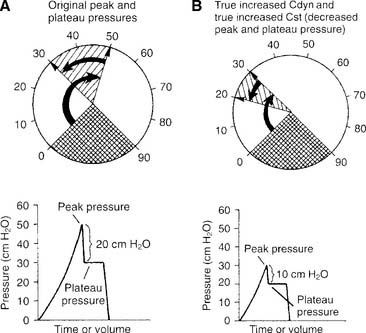
f. True increased dynamic compliance with true increased static compliance
True increased dynamic compliance with true increased static compliance also is noticed as a decrease in both peak and plateau pressures (Figure 15-11). This is seen when the patient’s airway resistance and his or her lung/thoracic compliance improve. Notice that the plateau pressure has decreased, thus indicating more compliant lungs. Also notice that the difference between peak and plateau pressures has decreased. This demonstrates that the airway resistance also has decreased.
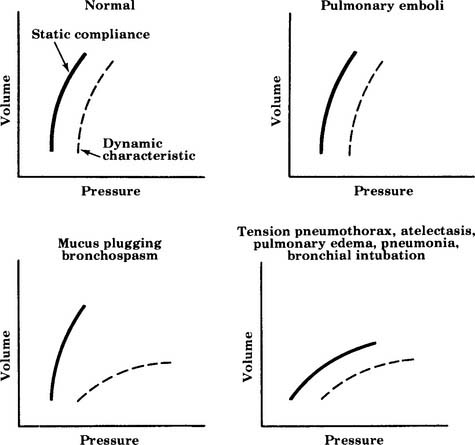
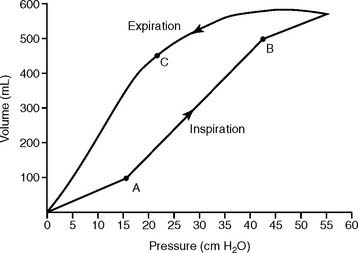
All six examples of increasing or decreasing static or dynamic lung compliance or both make use of a single tidal volume that is analyzed for peak and plateau pressures. Some practitioners advocate using several different tidal volumes (e.g., 8, 10, and 12 mL/kg of ideal body weight) when measuring dynamic and static pressures. The measured values are plotted on a graph to find the patient’s optimal tidal volume that results in the highest static compliance value. Figure 15-12 shows a series of these graphs. The curves for diseased lungs and airways are quite different from those of a normal person or a patient with a pulmonary embolism. Because of this, a pulmonary embolism should be considered if the patient’s condition deteriorates rapidly and no change in dynamic or static compliance values is observed.
MODULE B
Conventional mechanical ventilation is defined here as the use of a single ventilator that can provide the customary modes and options needed by the large majority of patients. This ventilatory support is provided through an endotracheal tube or a tracheostomy tube. Several physiologic criteria have been compiled to help the clinician determine when a patient is in respiratory or ventilatory failure (Box 15-1) and needs ventilatory support. Remember that the patient may not fail each and every criterion; however, the patient often will fail one or more criteria in each category.
BOX 15-1 Indications for Ventilatory Support
VENTILATION
PaCO2 ≥55 torr in a patient who is not ordinarily hypercapneic
Dead space: tidal volume (VD/VT ratio) of >0.55–0.6 (55%-60%)
PULMONARY MECHANICS
Spontaneous tidal volume 3-4 mL/lb or 7-9 mL/kg of ideal body weight
Maximum inspiratory pressure (MIP) <-20 to −25 cm water pressure
Forced expiratory volume in 1 second (FEV1) <10 mL/kg
Respiratory rate <12 breaths/min or >35 breaths/min in an adult
Rapid, shallow breathing index (breaths/minute divided by tidal volume in liters) >105
1. Perform the following procedures to make sure that the patient is adequately oxygenated
a. Minimize hypoxemia by positioning the patient properly (WRE code: IIID7) [Difficulty: Ap, An]
b. Administer oxygen, as needed, to prevent hypoxemia (ELE code: IIID6) [Difficulty: ELE: R, Ap, An]
Oxygen administration and adjustment were discussed in Chapter 6. In brief, the goal of oxygen administration is to keep the Pao2 level of most patients between 60 and 90 torr and the Spo2 level greater than 90%. Exceptions are the patient with COPD who is breathing on hypoxic drive and the patient who is in a cardiac arrest situation. The following formula can be used to help guide the use of supplemental oxygen in most stable patients:


in which F1 is the flow of first gas (oxygen), C1 is the concentration of oxygen in the first gas (1.0 for pure oxygen), F2 is the flow of second gas (air), C2 is the concentration of oxygen in the second gas (0.21 for air), FT is the total flow of both gases, and CT is the concentration of oxygen in the mix of both gases. Use algebraic manipulation to solve for the unknown.
c. Adequately oxygenate the patient to prevent accidental hypoxemia before and after suctioning, changing the ventilator circuit, or performing other procedures in which the patient is disconnected from the ventilator (ELE code: IIID9) [Difficulty: ELE: R, Ap, An]
Ensuring adequate oxygenation during suctioning is discussed in Chapter 13. In brief, remember to give the adult patient 100% oxygen for at least 30 seconds before suctioning. Perform the task as quickly and safely as possible to minimize time off the ventilator. Leave the patient on 100% oxygen for at least 1 minute after the procedure is completed, or until he or she returns to a stable condition as before the procedure. Children younger than 6 months can have the FIo2 increased by 10% for the procedure.
2. Initiate and adjust continuous mechanical ventilation settings (Code: IIID2b) [Difficulty: ELE: R, Ap; WRE: An]
b. Flow
Flow is adjusted to set the inspiratory time and the I : E ratio. In addition, flow is set to meet the patient’s needs. Inspiratory flow should be great enough to minimize the WOB. Increase flow if the patient has signs of greater demand, such as using accessory muscles of inspiration or lack of synchrony with the ventilator, or if the pressure manometer deflects greatly below the baseline pressure or shows a low initial increase in inspiratory pressure.
In addition, most current generation ventilators offer more than one inspiratory flow pattern (see Figure 15-1). The sine wave is most physiologically like a normal, spontaneous inspiration. The other waveforms can be compared with the sine wave to determine which one best meets the patient’s needs. Ideally, the best flow pattern is one in which the patient’s peak and mean airway pressures are lowest, exhalation is complete, breath sounds are improved bilaterally, heart rate and blood pressure are stable, and the patient feels most comfortable.
c. I : E ratio
The I : E ratio is adjusted to ensure that the patient can inhale in as physiologically appropriate a manner as possible and completely exhale the inspired tidal volume. Typically, the I : E ratio should be 1 : 2 or more. Incomplete exhalation will cause air trapping and auto-PEEP (see Figure 15-3).
f. Modes of ventilation
1. Control
Control (C) is the simplest method of providing ventilatory support and is used on an apneic patient. The ventilator is set with a mandatory respiratory rate and tidal volume. The machine is incapable of allowing any patient interaction. For example, the ventilator might be set to deliver a tidal volume of 700 mL at a rate of 14 times/min. Because of this limitation, it is rarely, if ever, used in modern medicine except when the patient must be kept sedated or pharmacologically paralyzed (Figure 15-13 shows the pressure/time curve).
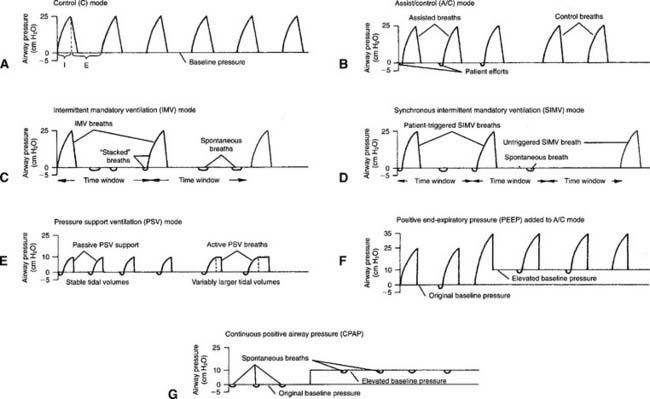
2. Assist/control
The assist/control (A/C) mode has a set backup respiratory rate but allows the patient to trigger additional machine-delivered breaths. A sensitivity control is adjusted to allow the patient to start a breath easily as needed. All tidal volumes are the same (Figure 15-13, B shows the pressure/time curve).
3. Intermittent mandatory ventilation
IMV was used in older ventilators before there was a way to synchronize the patient and ventilator breaths. With IMV, a set backup respiratory rate and tidal volume are delivered to the patient. In addition, between mandatory breaths, the patient can breathe spontaneously as frequently as desired. The patient also can take in as large a spontaneous tidal volume as needed. The sensitivity control is set so that the patient cannot trigger any extra ventilator tidal volume breaths (Figure 15-13, C shows the pressure/time curve). The IMV mode has been replaced in modern ventilators with the SIMV mode, as discussed below.
4. Synchronous intermittent mandatory ventilation
SIMV is similar to IMV except that the sensitivity control is functional. The patient can trigger a machine-delivered tidal volume during a preset time interval. The timing of the backup rate is such that the patient can get only as many ventilator breaths as are set. Spontaneous tidal volumes vary with the patient’s efforts. For example, the ventilator might be set to deliver a 700-mL tidal volume 8 times/min. Let us say that the patient breathes spontaneously 10 more times and has an average tidal volume of 400 mL. The total rate is counted at 18. The total minute volume is the combination of the machine’s minute volume and the patient’s minute volume (Figure 15-13, D shows the pressure/time curve).
5. Pressure support ventilation
Pressure support ventilation (PS or PSV) is similar to intermittent positive-pressure ventilation (IPPV) in that when the patient initiates a ventilator breath, a preset pressure is delivered to the airway. The patient has the flexibility to determine the respiratory rate. The physician orders a PSV level for one of two reasons, depending on the clinical goal. First, enough PS is ordered to overcome the patient’s calculated airway resistance. This usually is done when the patient has an increased work of breathing from a smaller than ideal endotrachal tube. Second, PS is ordered to deliver a targeted tidal volume. In most cases, the tidal volume will be stable if the patient passively takes the PSV breath, or it can be larger if the patient interacts actively with the pressure that is delivered (Figures 15-5 and 15-13, E show the pressure/time curve).
Because PS utilizes a set delivered pressure, the patient’s tidal volume can vary with changing lung compliance and/or airway resistance. To bring stability to the tidal volume under changing patient conditions, several ventilator manufacturers have developed automatic compensation systems. They are designed to provide additional volume if the patient’s lung compliance and/or airway resistance should worsen. Conversely, they will reduce automatically the set pressure when the patient is easier to ventilate, so that too large a tidal volume will not be delivered. All manufacturers have their own name for this compensation system and have developed different ways to accomplish the goal of a stable tidal volume. Examples include pressure augmentation on the Bear 1000, volume-assured pressure support on the Bird 8400, dual-control pressure ventilation on the Puritan Bennett 840, volume support on the Servo-i, and AutoFlow on the Dräger Evita 4. It is beyond the scope of this text to cover each of these. However, the practitioner is encouraged to understand their essential features and to know that they are added to the pressure support mode to ensure a stable, ordered tidal volume.
6. Pressure control ventilation
Pressure control ventilation (PC or PCV) involves the delivery of tidal volume breaths that are pressure limited and time cycled. A set ventilator rate can be set and the patient can trigger additional breaths. Because the pressure is limited, tidal volumes may vary. This must be monitored closely in patients with frequently changing lung compliance and airway resistance. As the inspiratory time is increased, it can become longer than the expiratory time. This results in pressure control inverse ratio ventilation (PCIRV). Figure 15-14 shows the volume, flow, and pressure tracings.
7. Airway pressure release ventilation
Several ventilator manufacturers offer the airway pressure release ventilation (APRV) mode (as well as other modes). These ventilators are microprocessor controlled and include a monitor for patient data and graphics. The APRV mode has been used with success in patients with ARDS who have not responded well to constant volume ventilation. APRV can be described simply as a mode in which the patient can breathe spontaneously at two different levels of CPAP. A difference from conventional CPAP is that the two levels are held for set periods. The ventilator options for this mode are simple. The practitioner sets the low pressure (Plow), the high pressure (Phigh), and the times that the patient will be at those pressure levels. Low pressure sometimes is referred to as CPAP and high pressure as release pressure. The timing changes from low pressure to high pressure and back to low pressure effectively deliver a tidal volume. (See Figure 15-15 for a pressure/time tracing.)
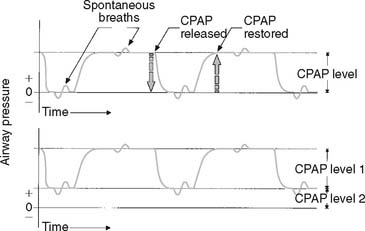
When APRV is compared with other modes of ventilation, several similarities are evident between it and PCIRV with PEEP and bilevel ventilation. All have an elevated baseline pressure that allows the patient to breathe spontaneously. All have variable inspiratory times for the higher pressure level. None delivers a set tidal volume to the patient. The only real difference seems to be that the patient can breathe spontaneously at the higher pressure level only with APRV. If the patient does not make any respiratory efforts, APRV functions like PCV or bilevel ventilation.
3. Begin and modify combinations of ventilatory techniques to oxygenate the patient adequately: synchronous intermittent mandatory ventilation, pressure support ventilation, pressure control ventilation, and positive end-expiratory pressure (Code: IIID2b) [Difficulty: ELE: R, Ap; WRE: An]
b. Hypercapnia
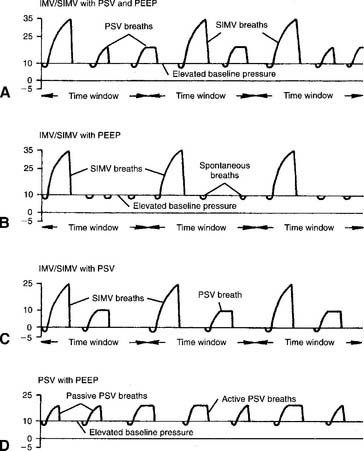
A patient may have hypercapnia (a high carbon dioxide level) because of sedation from a morphine or heroin overdose or may have COPD with worsening of the chronic hypercapnia. In either case, the patient becomes progressively more hypoxemic (unless given supplemental oxygen) as the carbon dioxide level increases. Control or A/C modes are best for setting a minimum minute volume to determine the maximum carbon dioxide level. As the patient recovers, SIMV or PSV allows the gradual reduction of ventilatory support. See Box 15-2 for indications of SIMV tolerance.
INDICATIONS THAT IMV/SIMV IS BEING WELL TOLERATED
Stable spontaneous respiratory rate
Stable spontaneous tidal volume
No use or stable use of accessory muscles of ventilation
INDICATIONS THAT IMV/SIMV IS NOT BEING WELL TOLERATED
Increased spontaneous respiratory rate
Tachycardia or dysrhythmias such as premature ventricular contractions
Decrease in spontaneous tidal volume
Decrease in vital capacity, MIP, and/or FEV1
Beginning or increased use of accessory muscles of ventilation
Deterioration of blood gases as seen by a falling Pao2 or Spo2 and a rapidly falling or rising PaCO2
c. Hypoxemia
If hypoxemia is secondary to a decreased FRC, as in ARDS or atelectasis, the treatment of choice for hypoxemia is CPAP on a free-standing system or PEEP on a conventional volume-cycled ventilator. If the problem results from an increased intrapulmonary shunt, the patient may need PEEP or CPAP, as well as up to 100% oxygen. See Box 15-3 for patient monitoring during PEEP and CPAP. PCIRV and high-frequency ventilation (HFV) have been used with success in hypoxemic patients with a pulmonary air leak for whom conventional volume ventilation has failed.
BOX 15-3 Patient Monitoring During Therapy
1. Mandatory minute ventilation
Mandatory minute ventilation (MMV) is a relatively new variation on the SIMV mode. It has been used as a weaning mode that limits the increase in carbon dioxide if the patient should tire. With MMV, the patient is assured of a preset minute volume regardless of his or her spontaneous breathing. It has been proposed as an effective way to ventilate and wean patients who can breathe spontaneously but who have an unreliable respiratory drive and unstable tidal volume. Examples include patients who have received narcotic, sedative, anesthetic, or neuromuscular blocking medications. Patient conditions for which MMV is indicated include encephalopathy and cerebral disorders such as stroke. In addition, MMV may be used during the recovery period of a neuromuscular disease. Ventilators that include the MMV mode all are controlled by a microprocessor that monitors the ventilator’s and the patient’s tidal volume and rate. The following guidelines have been recommended for the initiation of MMV:
2. Pressure control/pressure control inverse ratio ventilation, synchronous intermittent mandatory ventilation, and positive end-expiratory pressure
PCV or, if necessary, PCIRV has been used with success in patients with low compliance (ARDS) or a pulmonary air leak. When the peak pressure is limited, less air seems to leak out and the tissues are more likely to heal. Therapeutic PEEP is applied to increase the patient’s FRC to correct hypoxemia. The SIMV feature is added to let the patient breathe spontaneously if desired and to stay more synchronized with the ventilator. With lung healing, the PEEP level is decreased and the inspiratory time is shortened. SIMV with a constant tidal volume may be used during the weaning phase. Figure 15-17 shows pressure and flow tracings during PCV.
3. Synchronous intermittent mandatory ventilation with pressure support ventilation and positive endexpiratory pressure
SIMV is used to give the patient a controlled number of deep tidal volume breaths. The patient can breathe as often as desired between the mandatory breaths. The patient’s total minute volume can be determined by adding the combination of SIMV and pressure-supported breaths. A maximum acceptable Paco2 can be established with the proper combination of SIMV breaths and pressure support (PS) level. A PS level of more than 10 cm water may be needed. In addition, the PS ensures that the airway resistance of the endotracheal tube is overcome. (See the airway resistance calculation earlier in the chapter.) PEEP therapy is applied to the level necessary to obtain a clinically safe Pao2 at the lowest possible Fio2. Figure 15-17, A shows the pressure/time curve.
4. Synchronous intermittent mandatory ventilation with positive endexpiratory pressure
IMV/SIMV and PEEP therapy are applied as indicated. Pressure support is not needed if the patient is strong enough to overcome the airway resistance of the endotracheal tube and breathe with a clinically acceptable tidal volume. Figure 15-17, B shows the pressure/time curve.
5. Synchronous intermittent mandatory ventilation with pressure support ventilation
A fairly common clinical situation is seen in which the recovering patient does well on a gradually decreasing number of SIMV breaths until he or she can go no lower. The barrier seems to be the airway resistance of the endotracheal tube. (See the airway resistance calculation earlier in this chapter.) The addition of some PS overcomes that resistance so that the SIMV level can be reduced further. When the SIMV frequency is down to four or less, the patient is providing almost all of his or her minute volume. The greatest barrier to breathing is likely to be the resistance of the endotracheal tube. The decision then can be made to extubate the patient. Figure 15-17, C shows the pressure/time curve.
6. Pressure support ventilation with positive end-expiratory pressure
PSV and PEEP are applied as discussed earlier. This patient has the drive to breathe on his or her own; however, he or she has some limitation in the ability to overcome the resistance of the endotracheal tube or to generate a consistently large enough tidal volume. (See the airway resistance calculation earlier in the chapter.) In addition, the patient has a significant oxygenation problem and needs some PEEP therapy. With recovery, both PS and PEEP can be reduced. They may be reduced individually or simultaneously as the patient’s strength and/or oxygenation improves. Figure 15-17, D shows the pressure/time curve.
4. Choose and adjust the tidal volume for mechanical ventilation
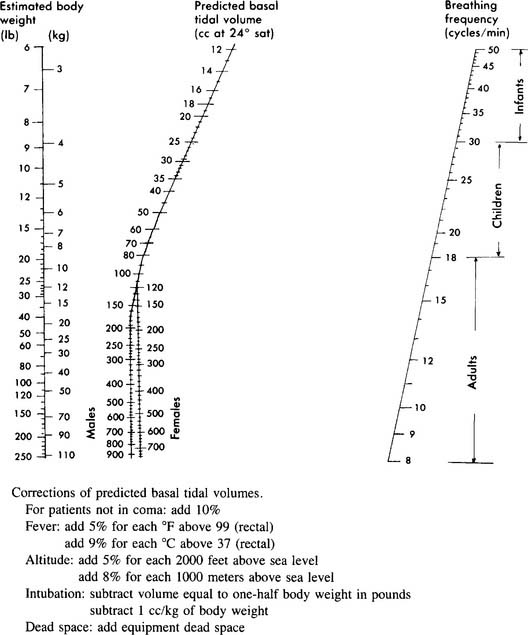
A spontaneously breathing person exhales a large enough tidal volume (at the necessary respiratory rate) to remove carbon dioxide as fast as it is produced by his/her metabolism. This results in a normal carbon dioxide level and acid-base balance. Obviously, a person’s tidal volume and respiratory rate will vary considerably with activity level. A 70-kg (154-lb) adult with normal lungs and metabolism needs a tidal volume of about 7 mL/kg (3 mL/lb) of ideal body weight to remove carbon dioxide adequately. So, this person would have a spontaneous tidal volume of about 500 mL (70 kg × 7 mL/kg). The Radford nomogram can be used for predicting normal spontaneous tidal volumes and rates on the basis of body weight (Figure 15-18). It can be used to help establish an initial target for the ventilator tidal volume for many patients with normal lungs. However, because compressed volume within the ventilator circuit causes some of the set tidal volume to not reach the patient’s lungs, a larger set tidal volume usually is needed. (Review “Procedure for calculating the tubing compliance factor” earlier in the chapter.) In addition, patients with lung problems will have different tidal volume requirements. Following are the current tidal volume recommendations based on the patient’s pulmonary condition:
This might be a patient with a normal cardiopulmonary system who is receiving mechanical ventilation because of a neurologic problem. For example, the previously mentioned 70-kg (154-lb) adult with normal lungs needs a set mechanical ventilator tidal volume in the following range:
The following formula can be used to help predict what tidal volume produces a desired Paco2 value:

in which
Placing the data and goal into the formula results in the following:
Simplifying produces the following:

The solution is to reduce the patient’s tidal volume from 1000 to 788 mL.
5. Choose and adjust the rate for mechanical ventilation
See Table 1-2 for a listing of the normal resting respiratory frequencies based on age. If the patient is apneic and has a normal temperature and an appropriately set tidal volume, respiratory rates in the indicated ranges will produce a normal Paco2 level. This must be confirmed by ABG measurements. If the tidal volume cannot be changed, adjusting the respiratory rate will modify alveolar ventilation. A higher respiratory rate, with everything else remaining the same, will result in a lower Paco2 level. Conversely, a lower respiratory rate, with everything else remaining the same, will result in a higher Paco2 level.
See Figure 15-18 for the Radford nomogram for use in predicting a normal respiratory rate and tidal volume based on weight. It can be used to establish an initial rate for most patients. As was mentioned earlier, chronically hypercapneic patients must be ventilated with some caution. Giving this type of patient a higher ventilator-delivered rate and a larger tidal volume may result in blowing off too much carbon dioxide and may cause a respiratory alkalosis. Adult patients with severe chronic restrictive lung disease or those who have had a pneumonectomy may need respiratory rates of 20 to 30 per minute or greater to meet their minute volume needs because their delivered tidal volume must be smaller than normal owing to their condition.

Placing the data and goal into the formula results in the following:
The solution is to reduce the patient’s respiratory rate from 12 to 9 breaths/min.
6. Choose and adjust the minute ventilation for mechanical ventilation
The subjects of minute ventilation and alveolar minute ventilation were covered in Chapter 4. Review the calculations as needed. Blood gases must always be evaluated for the Paco2 level to tell whether the patient’s minute ventilation is adequate. A high carbon dioxide level indicates a need to increase the tidal volume, respiratory rate, or both. A low carbon dioxide level indicates a need to decrease the tidal volume, respiratory rate, or both. In both cases, the key to modifying the carbon dioxide level is to modify the alveolar ventilation. This is best accomplished by changing the tidal volume rather than the rate. The following formula can be used to calculate a change in the minute volume:

in which

7. Initiate and adjust positive end-expiratory pressure therapy (Code: IIID2d) [Difficulty: ELE: R, Ap; WRE: An]
PEEP generally is indicated in any acute, bilateral, generalized pulmonary condition in which the FRC is decreased. When the FRC is decreased, shunt is increased, and the patient has refractory hypoxemia. Examples of small FRC conditions helped by PEEP include generalized atelectasis, pulmonary edema, ARDS, and infant respiratory distress syndrome (RDS). All of these patients show decreased lung compliance as measured by their static compliance (Cst). The higher the level of PEEP, the more progressively the patient’s FRC is increased. The therapeutic goal of this is to increase the patient’s arterial oxygen pressure (Pao2). (Figure 15-13, F shows the pressure/time curve.) Patients with chronically small FRC, such as those with pulmonary fibrosis and kyphoscoliosis, are not helped by the application of PEEP.
Specific indications for PEEP include the following:
Before PEEP is begun, the patient should be monitored carefully to establish the baseline condition. The same parameters should be monitored after each change in the PEEP level to determine how the patient is tolerating it. The best or optimal level of PEEP is the level that results in the best delivery of oxygen to the tissues (not necessarily the arterial blood). Often, a secondary goal is to reduce the inspired oxygen to a safe level. The patient is at risk for oxygen toxicity if more than 50% oxygen is inhaled for longer than 48 to 72 hours. See Box 15-3 for recommendations on what to monitor during the application of PEEP and how to evaluate the data.
a. Increasing PEEP
PEEP therapy usually is begun at initial levels of 2 to 5 cm water. After the patient’s response has been determined, 2 to 5 cm more PEEP may be applied. The patient is reevaluated. This process goes on until the desired clinical benefit is reached. See Figure 15-19 for a number of physiologic parameters that can be measured and evaluated.
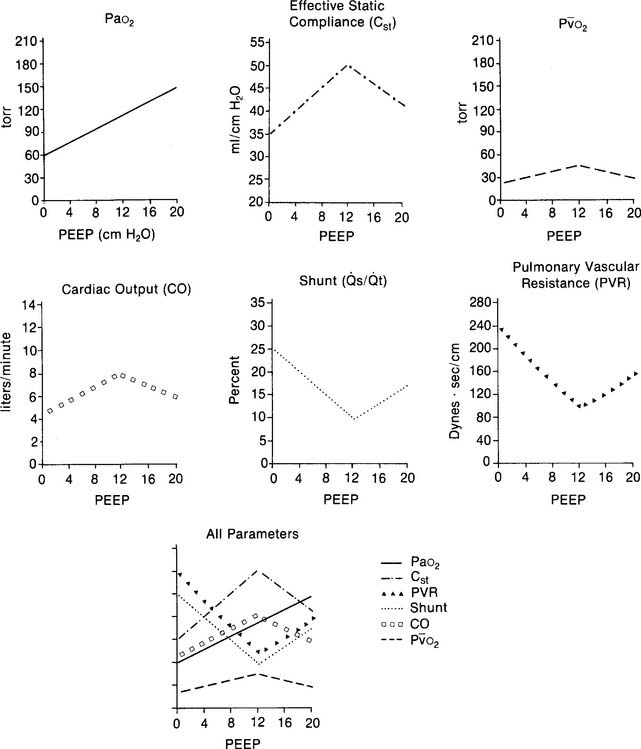
Another approach could be called best PEEP or optimum PEEP. This approach has the clinical goal of reducing the patient’s shunt fraction to less than 15%. Often this requires more pressure than the minimal PEEP approach. Because this higher pressure level is more likely to cause hemodynamic problems, the patient should have a pulmonary artery catheter inserted. With it, the patient’s cardiac output, mixed venous oxygen level, pulmonary capillary wedge pressure, and pulmonary vascular resistance can be measured (see Figure 15-19). In addition, the patient may need increased intravenous fluids, dopamine (Intropin), and digitalis (Digoxin) for cardiovascular support. The higher PEEP levels increase the risk of pulmonary barotrauma. Therefore the patient must be watched closely for signs of a pneumothorax.
MODULE C
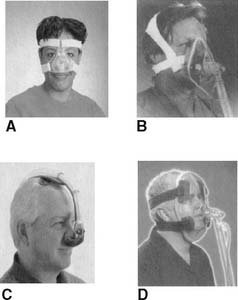
1. Initiate high-frequency ventilation and select appropriate settings
The FDA has approved HFV for use on adults during bronchoscopy and laryngoscopy procedures and when a patient with a bronchopleural fistula cannot be managed on a conventional ventilator. Although patients with ARDS have not been officially approved for HFV, the procedure has been used when a patient is hypoxic despite maximum settings on a conventional ventilator. (Box 16-5 lists clinical uses for HFV with infants and children.)
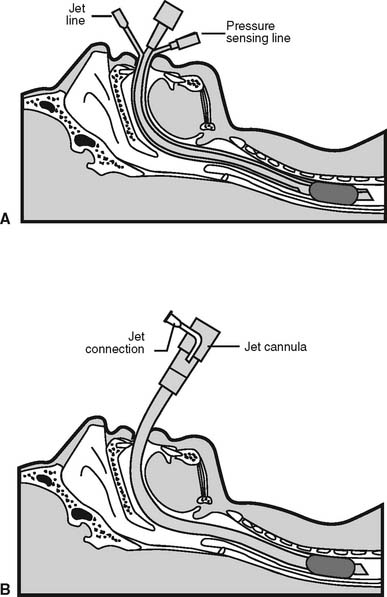
Currently HFV can be delivered in three different ways. The first involves the use of a conventional ventilator set at a rate of up to the FDA maximum of 150/min. This method is called high-frequency positive-pressure ventilation (HFPPV). With it, the set tidal volume is decreased to something less than standard (<10 mL/kg). The second involves the use of high-frequency jet ventilation (HFJV) and a special endotracheal tube with a standard lumen and an additional small-diameter air entrainment lumen (Figure 15-20). The HFJV unit is connected to the air entrainment lumen. Gas from the HFJV unit entrains other gas through the main lumen to create the patient’s tidal volume. HFJV units can deliver a small tidal volume several hundred times per minute. The third method involves a high-frequency oscillation (HFO) ventilator. HFO makes use of a conventional endotracheal tube (as does HFPPV). However, the delivered tidal volume is the smallest, and the respiratory rate can be the fastest of all three methods. Table 16-2 presents a comparison of all three methods. The equipment used for HFJV and for HFO is described later in this chapter. Table 15-1 lists considerations for the initial settings and for adjustment of HFV delivered to infants and adults by a jet ventilator or an oscillator ventilator.

Current clinical experience is recommended for any HFV method. Although adult patients have been treated successfully with HFV, far greater use of these techniques has occurred with infants and children. Therefore, Chapter 16 provides further discussion.
2. Independent (differential) lung ventilation
Independent lung ventilation (ILV) involves the use of a separate mechanical ventilator for each lung. A double-lumen endotracheal tube must be placed into the patient to allow this procedure. (See Figures 12-36 and 12-37 and the related discussion.) Box 15-4 lists indications for double-lumen endotracheal tubes and ILV. In all cases, the patient has one normal lung and one abnormal lung. Overriding concerns with ILV are to ventilate the patient adequately through the normal lung and to allow the injured lung to heal.
BOX 15-4 Indications for Double-Lumen Endotracheal Tubes and Independent Lung Ventilation
From Tuxen D: Independent lung ventilation. In: Tobin MJ, editor: Principles and practice of mechanical ventilation, New York, 1994, McGraw-Hill, pp 571-588.
When the patient has a bronchopulmonary fistula, the air leak through the bad lung can be so great that an HFV must be used rather than a conventional ventilator. In this situation, no synchronization of rate or any other parameters can be set. The good lung is ventilated conventionally to maintain the patient’s blood gas values. The HFV is set to provide some support with a small tidal volume and low ventilating pressures. The clinical goal is to prevent excessive lung pressure so that the lung tear heals.
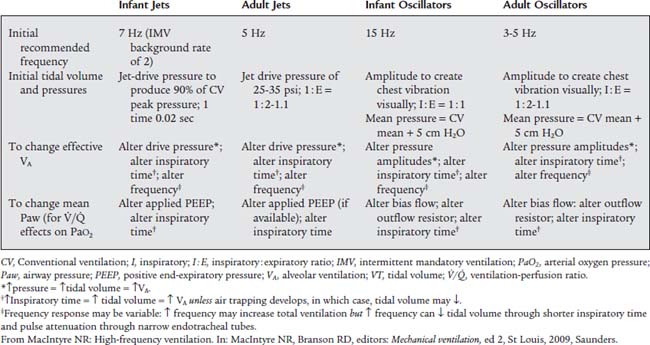
3. External negative-pressure ventilation
Negative-pressure ventilators work by creating negative pressure around the patient’s whole body or over the anterior chest and abdomen. The negative pressure expands the thorax, and a tidal volume is inhaled. If the patient needs supplemental oxygen, it must be given by nasal cannula or face mask. Three basic types of external negative-pressure ventilators are available: Drinker body respirator (so-called “iron lung”), body wrap, and chest cuirass (Figure 15-21).
The following steps are used to initiate ventilation:
4. Initiate and adjust noninvasive ventilation (Code: IIID2c) [Difficulty: ELE: R, Ap; WRE: An]
Often patients receiving NPPV are ventilated with two different levels of positive pressure. This is referred to as bilevel ventilation. The baseline pressure is greater than zero for setting a CPAP or PEEP level. The peak pressure is set to deliver a desired tidal volume (similar to PS ventilation). Both levels can be adjusted independently. If only the baseline pressure is elevated, the patient is receiving CPAP. If only the peak pressure is elevated, the patient is receiving PS ventilation. Respironics (Carlsbad, CA) has pioneered the development of ventilators for conventional ventilation or noninvasive bilevel ventilation.
As was stated above, the patient must have a properly fitting nasal or face mask to receive noninvasive ventilation. These ventilation masks are similar to CPAP masks and are referred to as such. CPAP masks are available in different sizes for children older than 3 years and for adults. Nasal masks are designed to cover only the nose. They allow the patient to eat, drink, speak, and use the mouth as a second airway for breathing in case a malfunction of the CPAP system occurs. The mouth also acts as a pressure relief route should the CPAP pressure become too great. Pressures of up to 10 to 15 cm water usually can be maintained (Figure 15-22). Usually, the mask is made of a transparent plastic. Face masks are designed to cover the nose and mouth. They are similar in design to the masks used during bag/mask ventilation and also are made of a transparent plastic. The face mask must be used if the patient has persistent mouth breathing and cannot use a nose mask. With a good seal, pressures of greater than 15 cm water can be maintained.
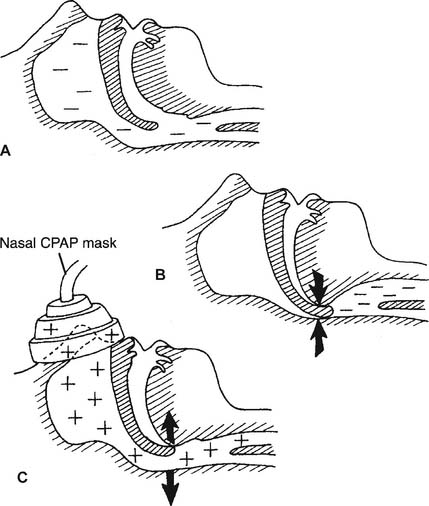
In recent years, a wide variety of NIV mask systems have been developed (Figure 15-23). In any situation, the clinical goal is to find a CPAP/NIV mask with a soft, very compliant seal that closely fits the contours of the patient’s face. A strapping system is needed to hold the mask in place. Too large a mask will not seal and will allow gas to leak and pressure to decrease. The patient may show increased snoring or airway obstruction with periods of apnea. A mask that is too small or misfitting can cause an uneven distribution of pressure on the face. This can lead to abrasions or pressure sores and ulcers on the face.
The function of the Respironics Esprit system is reviewed briefly. The operator can choose from two modes of operation and can select from the following:
When bilevel ventilation is started, set the EPAP level, if needed, to elevate the patient’s baseline pressure. The EPAP level establishes the patient’s functional residual capacity (FRC) to improve oxygenation. Increase or decrease EPAP as you would adjust PEEP or CPAP. Review Box 15-3 for patient monitoring with EPAP. Next, set the IPAP level to achieve the desired tidal volume.
With bilevel ventilation, the difference between IPAP and EPAP is called pressure boost and delivers the tidal volume. If a larger tidal volume is needed, increase the IPAP level. Conversely, decrease the IPAP level to obtain a smaller tidal volume. It is important to remember that the delivered tidal volume varies depending on changes in the patient’s airway resistance and lung/thoracic compliance, as well as in the machine settings.
5. Initiate and adjust continuous positive airway pressure (Code: IIID2d) [Difficulty: ELE: R, Ap; WRE: An]
CPAP is a pressure above atmospheric that is maintained at the airway opening throughout the respiratory cycle during spontaneous breathing. CPAP is similar to PEEP in purpose and effect. Remember that with CPAP, the patient does not receive any ventilator-delivered tidal volume breaths. The patient must be capable of providing all ventilation for carbon dioxide removal. Although CPAP usually is delivered through the mechanical ventilator, the respiratory rate is turned off. However, alarm systems still are functioning for patient safety. Some hospitals will make use of a free-standing system for delivering CPAP. This system is discussed below (Figure 15-13, G shows the pressure/time curve for CPAP).
CPAP usually is increased and decreased in steps with 2 to 5 cm water. As with PEEP, the patient is evaluated before CPAP is begun and again after each pressure change is made. See Box 15-3 for recommendations on what to monitor during the application of CPAP and how to evaluate the data.
MODULE D
A pneumatically powered ventilator is defined here as a ventilator powered by compressed gas. Older units operate without any electrically powered control systems (electrically powered alarm systems may or may not be added). More recent units will also have electrically powered controls and alarm systems. An electrically powered ventilator is defined here as a ventilator that is electrically powered or controlled. Most volume-cycled ventilators fall into this category. Microprocessor ventilators are electrically powered but are controlled by one or more microprocessors (computers). Many of the most current volume-cycled ventilators have microprocessors to control their functions. Fluidic ventilators typically make use of electrical circuits with flip-flops to respond to changes in gas flow and pressure throughout the system. Fluidic ventilators are powered by compressed gas. Noninvasive ventilators are designed for home use or short-term hospital use and are electrically powered and controlled. They have fewer controls and alarms than hospital-based critical care ventilators. A nasal or full face mask, rather than an endotracheal tube, is used to attach the ventilator to the patient. High-frequency ventilators are used in a limited population of critically ill patients who are doing poorly despite all attempts at conventional mechanical ventilation. These units are designed to deliver very rapid respiratory rates and very small tidal volumes.
1. Manipulate pneumatic ventilators by order or protocol (Code: IIA6a) [Difficulty: ELE: R, Ap; WRE: An]
a. Get the necessary equipment for the procedure
Historically, the most commonly used pneumatically powered ventilators include the Bird series and the Bennett PR-2. A control or backup rate can be set on these units in case the patient is apneic. All other controls and functions are the same as those discussed in Chapter 14. The following equipment and procedures are necessary:
b. Put the equipment together and make sure that it works properly
Refer to Figures 14-10 and 14-11 in Chapter 14 for the IPPB circuits. The ventilator and circuits are similar to those used in IPPB therapy with the following exceptions:
2. Manipulate electrical ventilators by order or protocol (Code: IIA6a) [Difficulty: ELE: R, Ap; WRE: An]
a. Get the necessary equipment for the procedure
Many mechanical ventilators are powered or controlled electrically. They function primarily as volume-cycled units, meaning that a preset volume is delivered from the ventilator with each breath regardless of the patient’s condition. Each ventilator is unique in its abilities, modes, and so forth. It is beyond the scope of this book to discuss each and every volume-cycled ventilator. They are presented in a generic manner. The learner should become familiar with the function of the Maquet Servo-i (Maquet Inc., Wayne, NJ) and other widely used machines.
b. Put the equipment together and make sure that it works properly (WRE code: IIA6a) [Difficulty: An]
3. Manipulate microprocessor ventilators by order or protocol (Code: IIA6a) [Difficulty: ELE: R, Ap; WRE: An]
4. Manipulate fluidic ventilators by order or protocol (Code: IIA6a) [Difficulty: ELE: R, Ap; WRE: An]
5. Manipulate noninvasive positive-pressure ventilators by order or protocol (Code: IIA6b) [Difficulty: ELE: R, Ap; WRE: An]
a. Get the necessary equipment for the procedure
A noninvasive ventilator is intended for an adult patient who is capable of some spontaneous breathing for a limited period. The unit typically is used for a short period with a patient who is having breathing difficulty but does not require intubation and full ventilatory support. Current ventilators include the Respironics Esprit (Respironics, Philips Healthcare, Carlsbad, CA) and the Puritan-Bennett GoodKnight 425 (Covidien-Puritan Bennett, Boulder, CO).
6. Manipulate high-frequency ventilators by order or protocol (WRE code: IIA6c) [Difficulty: WRE: R, Ap]
a. High-frequency jet ventilators (HFJVs)
1. Get the necessary equipment for the procedure
In addition, a special endotracheal tube must be placed into the patient before HFJV can be initiated. Ideally, the patient is intubated with a triple-lumen Hi-Lo Jet tube (see Figure 15-20). If the neonate has already had a standard endotracheal tube inserted, the Bunnell LifePort Endotracheal Tube Adapter (Bunnell Inc.) can be substituted for the standard adapter (Figure 15-25). Both tubes now allow the jetted gas from the Bunnell ventilator to go to the patient. The traditional ventilator is attached to the main lumen of the endotracheal tube. Based on the physical principles that govern jets, additional gas is entrained through the main lumen. This entrained gas should be humidified if the jet gas is dry. All exhaled gas passes out through this main lumen, where it can be measured through the traditional ventilator’s spirometry system. This ventilator’s alarm systems also can be used, and SIMV breaths and PEEP can be added if needed.
2. Put the equipment together and make sure that it works properly
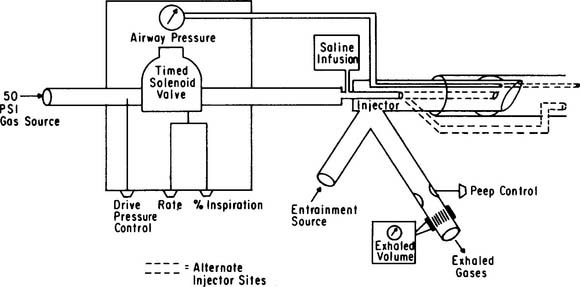
Figure 15-26 shows a schematic drawing of an HFJV. Also select a companion neonatal/pediatric ventilator and make sure it is operating properly. The following are general considerations with setting up the HFJV system:
b. High-frequency oscillator ventilators (HFOVs)
2. Put the equipment together and make sure that it works properly (WRE code: IIA6c) [Difficulty: R, Ap, An]
3. Troubleshoot any problems with the equipment (WRE code: IIA6c) [Difficulty: R, Ap, An]
Experience with the equipment is recommended for assembly of the specific circuit, as needed. Any humidification system can be added. Both ventilators’ circuits are designed to combine two separate flows of gas for the patient’s tidal volume. As with any circuit, make sure that all connections are tight.
7. Manipulate continuous mechanical ventilation and noninvasive ventilation breathing circuits by order or protocol (ELE code: IIA11a and IIA11d) [Difficulty: Ap, An]
a. Get the necessary equipment for the procedure
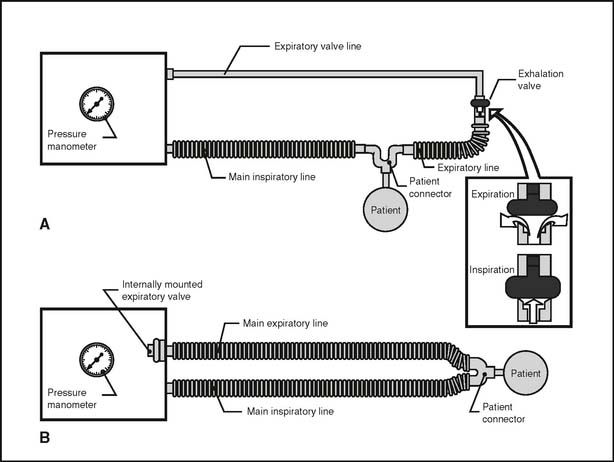
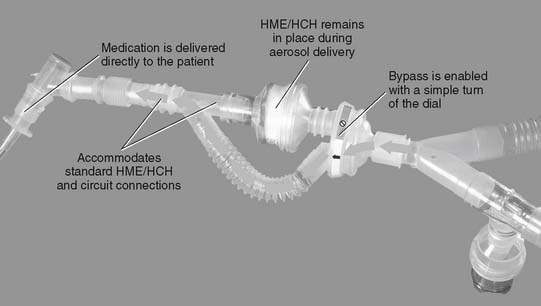
A permanent or a disposable circuit may be selected, based on the type of ventilator on which it must be placed. A circuit with an external exhalation valve must be used with older ventilators such as the Bennett MA-1 (Covidien-Puritan Bennett) and the Bear 2 (Cardinal Health, Viasys Bear Medical Systems, Palm Springs, CA). In addition, if a Bird-series unit is used as a ventilator, its circuit has an external exhalation valve (see Figure 15-24, A). All modern electrical and microprocessor ventilators feature an internal exhalation valve and do not need one included in the circuit (see Figure 15-24, B). If the patient must receive aerosolized medications, the circuit should include a nebulizer or should be able to accept one. If not included, the nebulizer or metered-dose inhaler adapter must be added into the inspiratory limb of the circuit (Figure 15-27).
Noninvasive ventilators, such as the Respironics series, have specific circuits designed only for the unit. Traditional ventilator circuits cannot be placed on a noninvasive ventilator.
b. Put the equipment together and make sure that it works properly
All circuits use a Y-connector to tie the inspiratory and expiratory limbs together and attach the circuit to the patient. See Figure 15-25 for examples of a generic ventilator circuit. Make sure that the water level is maintained properly in the humidifier.
d. Independently change the patient’s ventilator circuit as needed (ELE code: IIIF2i10) [Difficulty: R, Ap, An]
A circuit must be replaced if it is damaged in a way that prevents the patient from being ventilated. This is seen most commonly in circuits with external exhalation valves (see Figure 15-24A). If the balloon-type valve is damaged and will not close, the tidal volume will leak out rather than enter the patient. The circuit must be replaced. If the expiratory valve line is pulled off at the ventilator or exhalation valve, it must be replaced or the valve will not close.
The American Association for Respiratory Care (AARC) Clinical Practice Guideline on ventilator circuit changes (1994) included the following recommendations:
More recently, the AARC Clinical Practice Guideline on care of the ventilator circuit and its relation to ventilator-associated pneumonia (2003) included the following guidelines:
It is reasonable to expect the 2003 guidelines to be tested by the NRBC.
8. Manipulate ventilator breathing circuits: PEEP valve assembly, by order or protocol (ELE code: IIA11c) [Difficulty: ELE: R, Ap, An]
a. Get the necessary equipment for the procedure
A variety of PEEP systems can be added to a ventilator or CPAP circuit. Consult an equipment book for the details of their operation. Many of the newer ventilators have internal exhalation valves and PEEP-generating Venturi systems with nothing to assemble at the bedside. Failure to generate PEEP indicates that the exhalation valve or the PEEP-generating Venturi system has failed in some manner (see Figure 15-24, B).
Most older ventilators (Bird-series, Bennett MA-1, and Bear 2) use a balloon-like exhalation valve. A direct relationship exists between the volume of gas that is kept in the balloon, the pressure and resistance that it creates, and the PEEP level that is generated (see Figure 15-24, A).
c. Troubleshoot any problems with the equipment
Malfunctioning internal exhalation valves or PEEP-generation Venturi systems cannot be repaired easily at the bedside. The ventilator must be replaced. Balloon-type exhalation valves (see Figure 15-24, A) are prone to the following two problems:
9. Manipulate continuous positive airway pressure (CPAP) systems: breathing circuits, by order or protocol (ELE code: IIA11c) [Difficulty: ELE: R, Ap, An]
b. Put the equipment together and make sure that it works properly
Figure 15-28 shows the typical components used in a free-standing CPAP breathing circuit. Components include the following:
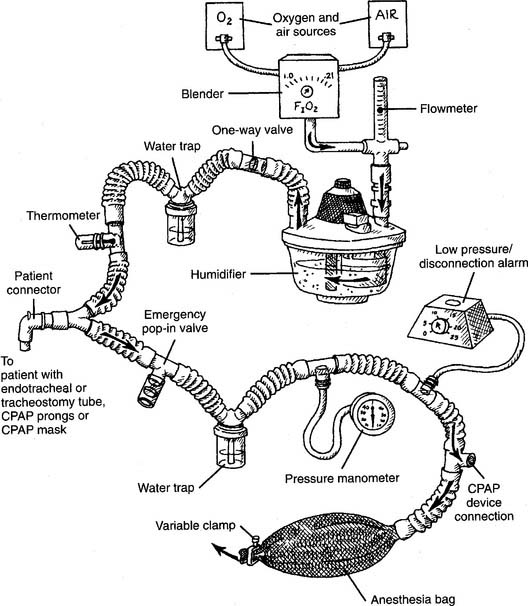
The CPAP level is adjusted by means of a variety of devices collectively called threshold resistors, which include the following:
c. Troubleshoot any problems with the equipment
Flow through the CPAP breathing circuit must be sufficient to meet the patient’s needs. Adjust the flowmeter setting and clamp on the anesthesia bag so that it is somewhat inflated, with excess air escaping out past the clamp. With all of the devices, gas escapes through the path of least resistance. All or some may escape through the anesthesia bag, the CPAP device, or both. The bag should collapse somewhat during the patient’s inspiration and expand somewhat during the expiration. The CPAP level should not decrease by more than 1 or 2 cm from baseline during an inspiration.
10. Manipulate CPAP systems: masks, nasal, and bilevel, by order or protocol (Code: IIA2) [Difficulty: ELE: R, Ap; WRE: An]
a. Get the necessary equipment for the procedure
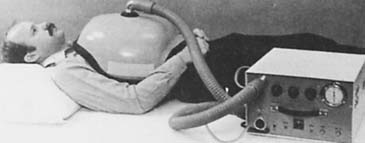
A CPAP mask and breathing circuit are used primarily for patients who have obstructive sleep apnea. CPAP, by means of the mask, forces soft tissues open to the point that the airway is never obstructed (see Figure 15-22). The patient now is able to sleep normally and remain oxygenated. The patient should have the CPAP mask, breathing circuit, and proper CPAP level determined by a sleep study in the hospital. The patient can use the system at home once it is set up properly and he or she has been trained in its use.
The two main categories of CPAP masks come in different sizes for children older than 3 years to adults. (See Figure 15-23 for examples.) Nasal mask and pillow systems are designed to cover only the nose. These allow the patient to speak and offer the mouth as a second airway for breathing in case a malfunction of the CPAP system occurs. The mouth also acts as a pressure relief route if the CPAP pressure should become too great. Pressures of up to 15 cm water usually can be maintained in an adult. Pressures of up to 10 cm water usually can be maintained in a child.
b. Put the equipment together and make sure that it works properly
Several companies manufacture mask CPAP systems for home care. These are relatively simple circuits that do not have a humidification system or the other attachments seen in the hospital. Check the manufacturer’s literature for specific directions on their application to the patient. As is shown in Figure 15-23, the straps must be tight enough to seal the mask to the face but not so tight as to cut off circulation to the skin. Any mask CPAP system must be able to generate enough flow to meet the patient’s minute volume and peak flow needs. The CPAP level must be stable throughout the breathing cycle.
11. Manipulate humidifiers by order or protocol (ELE code: IIA3) [Difficulty: ELE: R, Ap, An]
a. Get the necessary equipment for the procedure
A cascade-type, wick-type, etc. humidifier is indicated in these situations:
[/level-membership-for-pulmolory-and-respiratory-category][not-level-membership-for-pulmolory-and-respiratory-category]
15 Mechanical Ventilation of the Adult
Note 1: This book is written to cover every item listed as testable on the Entry Level Examination (ELE), Written Registry Examination (WRE), and Clinical Simulation Examination (CSE).
The listed code for each item is taken from the National Board for Respiratory Care (NBRC) Summary Content Outline for CRT (Certified Respiratory Therapist) and Written RRT (Registered Respiratory Therapist) Examinations (http://evolve.elsevier.com/Sills/resptherapist/). For example, if an item is testable on both the ELE and the WRE, it will be shown simply as: (Code: …). If an item is testable only on the ELE, it will be shown as: (ELE code: …). If an item is testable only on the WRE, it will be shown as: (WRE code: …).
MODULE A
1. Ventilator flow, volume, and pressure waveforms
a. Review the patient’s chart for information on airway graphics (Code: IA7c) [Difficulty: ELE: R; WRE: Ap]
A patient who has been intubated and placed on a modern mechanical ventilator with a microprocessor and graphics software can have ventilator flow, volume, and pressure waveforms visualized on the monitor, stored in memory, or printed out. Look for this information and compare it with the patient’s current situation. See Figure 15-1 for examples of pressure, volume, and flow tracings. See Figure 15-2 for key points of information available from a flow vs. time graph.
b. Perform the procedure to measure ventilator pressure/volume and flow/volume loops (WRE Code: IB9o) [Difficulty: WRE: R, Ap, An]
c. Select ventilator graphics (Code: IIID3) [Difficulty: ELE: R, Ap; WRE: An]
The operator typically can select any two of the following for display on the monitor: time, flow, pressure, and/or volume. Certain combinations are selected to best present the needed information. For example, air trapping is best shown by comparing flow vs. time (Figure 15-3) peak and plateau pressures are best shown by comparing pressure vs. time (Figure 15-4), and lung inflection points are best shown by comparing volume vs. pressure (discussed later). Note examples of ventilator graphics throughout this chapter.
d. Interpret ventilator pressure/volume and flow/volume loops (WRE code: IB10o) [Difficulty: WRE: R, Ap, An]
A number of flow, volume, and pressure waveforms have been included in this chapter for practice. In addition, review Figures 4-1 and 4-10 for examples of pulmonary function test waveform tracings. The examples in this chapter include common clinical situations and are accompanied explanations to help with interpretation.
2. Review the patient’s chart for information on the work of breathing (Code: IA7d) [Difficulty: ELE: R; WRE: Ap]
A patient who has been intubated and placed on a modern mechanical ventilator with a microprocessor and graphics software can have WOB measured. See Figure 15-5 for a pressure/volume loop tracing that shows a patient’s WOB. WOB is minimized when the ventilator is set to minimize the negative pressure and inspiratory flow the patient has to generate.
3. Airway resistance
a. Review the patient’s chart for information on airway resistance (Code: IA7d) [Difficulty: ELE: R; WRE: Ap]
Airway resistance (Raw) may have been measured earlier in the pulmonary function laboratory or on the ventilator. Compare any earlier values with new measurements. This is important for understanding the patient’s trends toward an improving or worsening pulmonary condition.
b. Recommend measurement of the patient’s airway resistance (Code: IC7) [Difficulty: ELE: R, Ap; WRE: An]
c. Determine the patient’s airway resistance (Code: IB9n) [Difficulty: ELE: R, Ap; WRE: An]
1. Procedure for calculating airway resistance
4. Auto-PEEP detection
a. Perform the procedure to detect auto-PEEP (WRE code: IB9w) [Difficulty: WRE: R, Ap, An]
Auto-PEEP is positive end-expiratory pressure in the lungs that cannot be seen on the ventilator’s pressure manometer. (The terms inadvertent PEEP and intrinsic PEEP also are used.) Auto-PEEP is caused by air trapping resulting from an inadequate expiratory time. It becomes more likely when the inspiratory time is increased or the expiratory time is decreased, or in patients with long time constants of ventilation. Simply put, the next breath is delivered before the patient has exhaled completely (see Figure 15-3). This problem is seen frequently in patients with status asthmaticus or COPD because of early small airway closure. In patients with acute respiratory distress syndrome (ARDS) who are receiving pressure-controlled inverse ratio ventilation (PCIRV), the long inspiratory times used increase the risk of expiratory air trapping. Auto-PEEP is more likely to be found when the inspiratory/expiratory (I : E) ratio becomes 2 : 1 or greater.
It is important to add any auto-PEEP to the amount of therapeutic PEEP the patient has. This should be recorded as the total PEEP. For example, the patient has 5 cm of therapeutic PEEP and 2 cm of auto-PEEP for 7 cm of total PEEP. It may be thought that the total PEEP level places the patient at risk for volutrauma or decreased venous return and lowered cardiac output. The amount of auto-PEEP can be reduced by decreasing the inspiratory time, increasing the expiratory time, or decreasing the tidal volume. Lack of auto-PEEP can be confirmed by this procedure. If the auto-PEEP cannot be eliminated, therapeutic PEEP can be added to match it. By increasing the baseline pressure, the patient can more easily trigger an assisted or synchronous intermittent mandatory ventilation (SIMV) breath. It is especially important to decrease auto-PEEP and therapeutic PEEP levels as the patient’s lung compliance improves and airway resistance returns to normal.
b. Interpret ventilator graphics to detect auto-PEEP (WRE code: IB10w) [Difficulty: WRE: R, Ap, An]
Figure 15-3 demonstrates two ways that air trapping on exhalation can be identified as auto-PEEP (unintended positive end-expiratory pressure). Note in Figure 15-3 (bottom) that the patient’s expiratory flow does not reach baseline pressure before another breath is delivered. This proves that air trapping has occurred. The larger the gap between the pressure at the end of expiration and at baseline, the greater is the air trapping.
5. Determine the patient’s plateau pressure (Code: IB9n) [Difficulty: ELE: R, Ap; WRE: An]
The hold should be held for about 2 seconds so that the pressure manometer value is stable. Note the pressure as the plateau pressure (see Figure 15-4, A). After the plateau pressure has been determined, the patient must exhale completely. It may be necessary to delay the next timed ventilator tidal volume breath to avoid “stacking” a new breath when the first has not yet been exhaled. It is recommended that the plateau pressure procedure be repeated to ensure that the measured pressure is accurate.
6. Lung compliance
a. Review the patient’s chart for information on lung compliance (Code: IA7d) [Difficulty: ELE: R; WRE: Ap]
b. Recommend measurement of the patient’s lung compliance (Code: IC7) [Difficulty: ELE: R, Ap; WRE: An]
c. Determine the patient’s plateau pressure and lung compliance (Code: IB9n) [Difficulty: ELE: R, Ap; WRE: An]
1. Procedure for calculating the tubing compliance factor
For greatest accuracy in the calculation of static and dynamic compliance and the calculation of actual tidal and sigh volumes, any lost volume must be subtracted from the exhaled tidal volume to find the actual tidal volume. The tubing compliance factor is used in the calculation to determine the compressed volume, through the following procedure:
2. Procedure for calculating static compliance
3. Procedure for calculating dynamic compliance
in which compressed volume is Compliance factor × Peak pressure.
7. Interpret the patient’s lung mechanics results: plateau pressure, airway resistance, dynamic lung compliance, and static lung compliance values on the ventilator (Code: IB10n) [Difficulty: ELE: R, Ap; WRE: An]
a. Decreased dynamic compliance with stable static compliance
Decreased dynamic compliance with stable static compliance is noticed as an increase in the peak pressure with an unchanged plateau pressure (see Figure 15-4). It is caused by increased airway resistance (bronchospasm, secretions, water in the circuit, kinked circuit, or endotracheal tube). Correction of the underlying problem results in return of the peak pressure to the original level.
b. Increased dynamic compliance with stable static compliance
Increased dynamic compliance with stable static compliance is noticed as a decrease in peak pressure with an unchanged plateau pressure (Figure 15-7). This represents an improvement in the patient’s airway resistance from the original condition. Secretions can be diminished, mucus plugs cleared, bronchospasm corrected, and so forth.
c. False decreased dynamic compliance with true decreased static compliance
False decreased dynamic compliance with true decreased static compliance is noticed as an increase in both peak and plateau pressures (Figure 15-8). This is seen when the patient’s lung/thoracic compliance worsens. The plateau pressure is elevated, and the static compliance is decreased.
d. True decreased dynamic compliance with true decreased static compliance
True decreased dynamic compliance with true decreased static compliance also is noticed as an increase in both peak and plateau pressures (Figure 15-9). This is seen with the combination of decreased lung compliance and increased airway resistance. Causes of both of these problems were discussed earlier.
e. False increased dynamic compliance with true increased static compliance
False increased dynamic compliance with true increased static compliance is noticed as a decrease in both peak and plateau pressures (Figure 15-10). This is seen when the patient’s lung/thoracic compliance improves. The plateau pressure decreases, and, as an artifact, the peak pressure also decreases. Notice that the difference between peak and plateau pressures remains the same. This indicates that the patient’s airway resistance is unchanged.
f. True increased dynamic compliance with true increased static compliance
True increased dynamic compliance with true increased static compliance also is noticed as a decrease in both peak and plateau pressures (Figure 15-11). This is seen when the patient’s airway resistance and his or her lung/thoracic compliance improve. Notice that the plateau pressure has decreased, thus indicating more compliant lungs. Also notice that the difference between peak and plateau pressures has decreased. This demonstrates that the airway resistance also has decreased.
All six examples of increasing or decreasing static or dynamic lung compliance or both make use of a single tidal volume that is analyzed for peak and plateau pressures. Some practitioners advocate using several different tidal volumes (e.g., 8, 10, and 12 mL/kg of ideal body weight) when measuring dynamic and static pressures. The measured values are plotted on a graph to find the patient’s optimal tidal volume that results in the highest static compliance value. Figure 15-12 shows a series of these graphs. The curves for diseased lungs and airways are quite different from those of a normal person or a patient with a pulmonary embolism. Because of this, a pulmonary embolism should be considered if the patient’s condition deteriorates rapidly and no change in dynamic or static compliance values is observed.
MODULE B
Conventional mechanical ventilation is defined here as the use of a single ventilator that can provide the customary modes and options needed by the large majority of patients. This ventilatory support is provided through an endotracheal tube or a tracheostomy tube. Several physiologic criteria have been compiled to help the clinician determine when a patient is in respiratory or ventilatory failure (Box 15-1) and needs ventilatory support. Remember that the patient may not fail each and every criterion; however, the patient often will fail one or more criteria in each category.
BOX 15-1 Indications for Ventilatory Support
VENTILATION
PaCO2 ≥55 torr in a patient who is not ordinarily hypercapneic
Dead space: tidal volume (VD/VT ratio) of >0.55–0.6 (55%-60%)
PULMONARY MECHANICS
Spontaneous tidal volume 3-4 mL/lb or 7-9 mL/kg of ideal body weight
Maximum inspiratory pressure (MIP) <-20 to −25 cm water pressure
Forced expiratory volume in 1 second (FEV1) <10 mL/kg
Respiratory rate <12 breaths/min or >35 breaths/min in an adult
Rapid, shallow breathing index (breaths/minute divided by tidal volume in liters) >105
1. Perform the following procedures to make sure that the patient is adequately oxygenated
a. Minimize hypoxemia by positioning the patient properly (WRE code: IIID7) [Difficulty: Ap, An]
b. Administer oxygen, as needed, to prevent hypoxemia (ELE code: IIID6) [Difficulty: ELE: R, Ap, An]
Oxygen administration and adjustment were discussed in Chapter 6. In brief, the goal of oxygen administration is to keep the Pao2 level of most patients between 60 and 90 torr and the Spo2 level greater than 90%. Exceptions are the patient with COPD who is breathing on hypoxic drive and the patient who is in a cardiac arrest situation. The following formula can be used to help guide the use of supplemental oxygen in most stable patients:
in which F1 is the flow of first gas (oxygen), C1 is the concentration of oxygen in the first gas (1.0 for pure oxygen), F2 is the flow of second gas (air), C2 is the concentration of oxygen in the second gas (0.21 for air), FT is the total flow of both gases, and CT is the concentration of oxygen in the mix of both gases. Use algebraic manipulation to solve for the unknown.
c. Adequately oxygenate the patient to prevent accidental hypoxemia before and after suctioning, changing the ventilator circuit, or performing other procedures in which the patient is disconnected from the ventilator (ELE code: IIID9) [Difficulty: ELE: R, Ap, An]
Ensuring adequate oxygenation during suctioning is discussed in Chapter 13. In brief, remember to give the adult patient 100% oxygen for at least 30 seconds before suctioning. Perform the task as quickly and safely as possible to minimize time off the ventilator. Leave the patient on 100% oxygen for at least 1 minute after the procedure is completed, or until he or she returns to a stable condition as before the procedure. Children younger than 6 months can have the FIo2 increased by 10% for the procedure.
2. Initiate and adjust continuous mechanical ventilation settings (Code: IIID2b) [Difficulty: ELE: R, Ap; WRE: An]
b. Flow
Flow is adjusted to set the inspiratory time and the I : E ratio. In addition, flow is set to meet the patient’s needs. Inspiratory flow should be great enough to minimize the WOB. Increase flow if the patient has signs of greater demand, such as using accessory muscles of inspiration or lack of synchrony with the ventilator, or if the pressure manometer deflects greatly below the baseline pressure or shows a low initial increase in inspiratory pressure.
In addition, most current generation ventilators offer more than one inspiratory flow pattern (see Figure 15-1). The sine wave is most physiologically like a normal, spontaneous inspiration. The other waveforms can be compared with the sine wave to determine which one best meets the patient’s needs. Ideally, the best flow pattern is one in which the patient’s peak and mean airway pressures are lowest, exhalation is complete, breath sounds are improved bilaterally, heart rate and blood pressure are stable, and the patient feels most comfortable.
c. I : E ratio
The I : E ratio is adjusted to ensure that the patient can inhale in as physiologically appropriate a manner as possible and completely exhale the inspired tidal volume. Typically, the I : E ratio should be 1 : 2 or more. Incomplete exhalation will cause air trapping and auto-PEEP (see Figure 15-3).
f. Modes of ventilation
1. Control
Control (C) is the simplest method of providing ventilatory support and is used on an apneic patient. The ventilator is set with a mandatory respiratory rate and tidal volume. The machine is incapable of allowing any patient interaction. For example, the ventilator might be set to deliver a tidal volume of 700 mL at a rate of 14 times/min. Because of this limitation, it is rarely, if ever, used in modern medicine except when the patient must be kept sedated or pharmacologically paralyzed (Figure 15-13 shows the pressure/time curve).
2. Assist/control
The assist/control (A/C) mode has a set backup respiratory rate but allows the patient to trigger additional machine-delivered breaths. A sensitivity control is adjusted to allow the patient to start a breath easily as needed. All tidal volumes are the same (Figure 15-13, B shows the pressure/time curve).
3. Intermittent mandatory ventilation
IMV was used in older ventilators before there was a way to synchronize the patient and ventilator breaths. With IMV, a set backup respiratory rate and tidal volume are delivered to the patient. In addition, between mandatory breaths, the patient can breathe spontaneously as frequently as desired. The patient also can take in as large a spontaneous tidal volume as needed. The sensitivity control is set so that the patient cannot trigger any extra ventilator tidal volume breaths (Figure 15-13, C shows the pressure/time curve). The IMV mode has been replaced in modern ventilators with the SIMV mode, as discussed below.
