[level-membership-for-pulmolory-and-respiratory-category]
Pulmonary Function Testing
After reading this chapter you will be able to:
 List the three categories of pulmonary function tests.
 State the primary purposes of pulmonary function testing.
 Describe the pathophysiologic patterns associated with obstructive and restrictive lung disease.
 State what is meant by the term spirometer, and list the parameters that can be measured by it.

 List and describe the measurements that indicate pulmonary mechanics.
 Describe the purpose and technique for the bronchial challenge test.

 Describe the purpose and techniques used to measure diffusion capacity.

 E)
E)1. The diaphragm and thoracic muscles must be capable of expanding the thorax and lungs to produce a subatmospheric pressure.
2. The airways must be unobstructed to allow gas to flow into the lungs and reach the alveoli.
3. The cardiovascular system must circulate blood through the lungs and ventilated alveoli.
4. O2 and CO2 must be able to diffuse through the alveolar-capillary membrane.
Pulmonary function tests can provide valuable information about these important individual processes that support gas exchange. Various measurements are available to aid in the diagnosis and assessment of pulmonary diseases, to determine the need for therapy, and to evaluate the effectiveness of respiratory care. For respiratory therapists (RTs), knowledge of these tests and the ability to interpret the measurements are essential for assessing patients objectively and for planning and implementing effective patient care. The key terms used in this chapter are terms adopted and defined by the pulmonary medical community and should become the standard vocabulary of all RTs.1
Pulmonary Function Testing
Purposes
Generally, the primary purposes of pulmonary function testing are to identify pulmonary impairment and to quantify the severity of pulmonary impairment if present.2 Pulmonary function testing has diagnostic and therapeutic roles and helps clinicians answer some general questions about patients with lung disease (Box 19-1).
The indications for pulmonary function testing are as follows:
• To identify and quantify changes in pulmonary function. The most common purposes of pulmonary function testing are to detect the presence or absence of pulmonary disease, to classify the type of disease as either obstructive or restrictive, and to quantify the severity of pulmonary impairment as mild, moderate, severe, or very severe. Over time, pulmonary function tests help quantify the progression or the reversibility of the disease.3
• To evaluate need and quantify therapeutic effectiveness.4 Pulmonary function tests may aid clinicians in selecting or modifying a specific therapeutic regimen or technique (e.g., bronchodilator medication, airway clearance therapy, rehabilitation exercise protocol). Clinicians and researchers use pulmonary function tests to measure changes in lung function objectively before and after treatment.
• To perform epidemiologic surveillance for pulmonary disease. Screening programs may detect pulmonary abnormalities caused by disease or environmental factors in general populations, in people in occupational settings, in smokers, or in other high-risk groups. In addition, researchers have determined what normal pulmonary function is by measuring the pulmonary function of healthy people.5
• To assess patients for risk of postoperative pulmonary complications. Preoperative testing can identify patients who may have an increased risk of pulmonary complications after surgery.6 Sometimes the risk of complications can be reduced by preoperative respiratory care, and sometimes the risk may be significant enough to rule out surgery.
• To determine pulmonary disability.7 Pulmonary function tests can also determine the degree of disability caused by lung diseases, including occupational diseases such as pneumoconiosis of coal workers. Some federal entitlement programs and insurance policies rely on pulmonary function tests to confirm claims for financial compensation.
There are also contraindications to pulmonary function testing.4 Patients with acute, unstable cardiopulmonary problems, such as hemoptysis, pneumothorax, myocardial infarction, and pulmonary embolism, and patients with acute chest or abdominal pain should not be tested. Testing could be harmful if needed treatment would be delayed. Patients who have nausea and who are vomiting should not be tested because there is a risk of aspiration. Testing for patients who have had recent cataract removal surgery should be delayed because changes in ocular pressure may be harmful to the eye. Pulmonary function testing requires patient effort and cooperation. Patients with dementia or confusion may not achieve optimal or repeatable results. Pulmonary function testing should not be performed if valid and reliable results cannot be predicted. In patients who are acutely ill or who have recently smoked a cigarette, the test validity of measuring the forced vital capacity (FVC) may be hindered.
Pathophysiologic Patterns
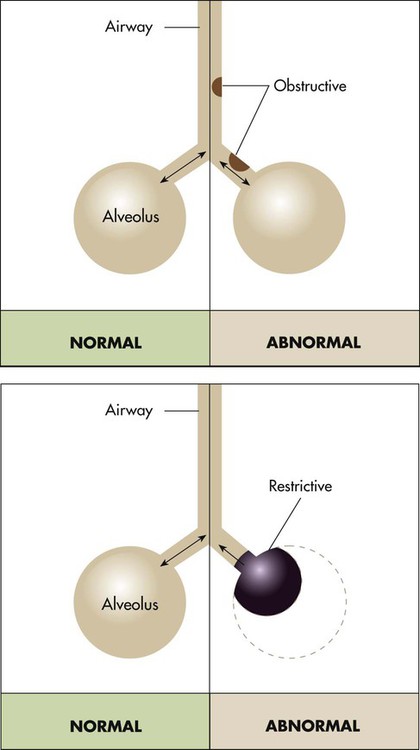
Pulmonary function testing provides the basis for classifying pulmonary diseases into two major categories, obstructive pulmonary disease and restrictive pulmonary disease. These two types of lung diseases sometimes occur together as a mixed impairment. Obstructive and restrictive types of lung diseases differ in several important ways. Figure 19-1 shows normal lungs with the pathophysiologic aspects of obstructive lung diseases and restrictive lung diseases, and the differences are summarized in Table 19-1. The primary problem in obstructive pulmonary disease is an increased airway resistance (Raw). Raw is the difference in pressure between the ends of the airways divided by the flow rate of gas moving through the airway, according to the following formula: Raw = ΔP/ .
.
TABLE 19-1
Comparison of Obstructive and Restrictive Types of Pulmonary Diseases
| Characteristic | Obstructive Disease | Restrictive Disease |
| Anatomy affected | Airways | Lung parenchyma, thoracic pump |
| Breathing phase difficulty | Expiration | Inspiration |
| Pathophysiology | Increased airway resistance | Decreased lung or thoracic compliance |
| Useful measurements | Flow rates | Volumes or capacities |
There is an inverse relationship between Raw and flow rates ( ). If the pressure difference is constant, a reduced flow rate indicates an increase in Raw. Because the radius of the airways normally lessens slightly during expiration, flow rates are usually measured during expiration. By rearranging the symbols in Poiseuille’s law (see Chapter 6), Raw is inversely related to the radius of the airways according to the following formula: Raw = ΔP/
 = η8l/r4.
 ) decreases. Airway radius can be reduced by excessive contraction of the bronchial and bronchiolar muscles (bronchospasm), excessive secretions in the airways, swelling of the airway mucosa, airway tumors, collapse of the bronchioles, and other causes. By measuring flow rates, pulmonary function tests measure indirectly the size of the airways, Raw, and the presence of obstructive disease.
< ?xml:namespace prefix = "mml" />

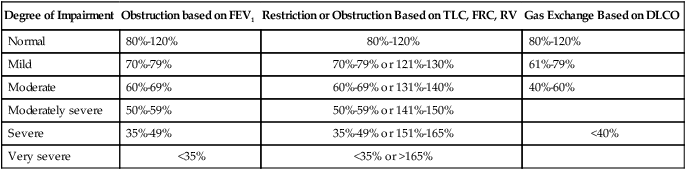
Determining if the patient’s value is within 1 or 2 standard deviations of the predicted normal value is an alternative method used in some laboratories. The predicted percentage or the number of standard deviations from the predicted normal value can be used to quantify severity of impairment. Typical degrees of severity are listed in Table 19-2.
TABLE 19-2
Severity of Pulmonary Impairments Based on a Percentage of Predicted Normal Values
| Degree of Impairment | Obstruction based on FEV1 | Restriction or Obstruction Based on TLC, FRC, RV | Gas Exchange Based on DLCO |
| Normal | 80%-120% | 80%-120% | 80%-120% |
| Mild | 70%-79% | 70%-79% or 121%-130% | 61%-79% |
| Moderate | 60%-69% | 60%-69% or 131%-140% | 40%-60% |
| Moderately severe | 50%-59% | 50%-59% or 141%-150% | |
| Severe | 35%-49% | 35%-49% or 151%-165% | <40% |
| Very severe | <35% | <35% or >165% |
Infection Control
Pulmonary function testing is considered safe, but there is potential to transmit infective microorganisms to patients and technologists.8 Transmission can occur by direct or indirect contact. Standard precautions should be applied because of the potential exposure to saliva or mucus, which could possibly contain blood or other potentially hazardous microorganisms. Patients with oral lesions pose the greatest potential hazard, and patients with compromised immune systems are at the greatest risk. Practitioners should wear gloves when handling potentially contaminated mouthpieces, valves, tubing, and equipment surfaces. When performing procedures on patients with potentially infectious airborne diseases, practitioners should wear a personal respirator or a close-fitting surgical mask, especially if the testing induces coughing. Practitioners should always wash their hands between testing patients and after contact with testing equipment. Although it is unnecessary to clean the interior surfaces of the testing instruments routinely between patients,9 the mouthpiece, nose clips, tubing, and any parts of the instrument that come into direct contact with a patient should be disposed, sterilized, or disinfected between patients. Any equipment surface showing visible condensation from exhaled air should be discarded, disinfected, or sterilized before reuse. When testing instruments are disassembled for cleaning and disinfecting, manufacturer recommendations should be considered, and recalibration may be necessary before testing resumes. The routine use of low-resistance, in-line barrier filters is controversial.10–12 Filters may be appropriate when internal surfaces of manifolds and valves proximal to mouthpieces are inaccessible or difficult to disassemble for cleaning and disinfecting. Filters provide visible evidence to reassure patients that their protection has been considered.
Equipment
Flow-measuring devices are commonly called pneumotachometers, although some practitioners reserve this term for only the device originally designed by Fleisch. These devices measure flow using a variety of unique principles. The Fleisch-type pneumotachometer measures the change in pressure as gas flows through a minimal, constant resistance according to the formula:  = ΔP ÷ R. Different manufacturers have used several materials to provide the resistance, including screens, capillary tubes, and fiber sheets made of silk, nylon, or filter paper. With multiple uses, condensation from exhaled air can collect in these devices and alter the resistance and accuracy of the device; some devices are heated to body temperature to prevent condensation. Known as thermistors or mass flowmeters, another type of flow-measuring device measures the temperature change created by gas flowing through it. There are also tubinometers, which use rotation of a fan or blades similar to a windmill. The number of rotations indicates volume, and the speed of the rotations indicates flow. How gas flow affects the transmission of sound waves and the force of flow stretching a spring have also been used to measure flow. Detailed descriptions and examples of each type of device are beyond the scope of this chapter and are available elsewhere.13
Regardless of the type of device or the principle of measurement used, several important characteristics are common to all volume-measuring and flow-measuring devices. Having an understanding of these common characteristics provides RTs the ability to select and use these devices properly. Every measuring instrument has capacity, accuracy, error, resolution, precision, linearity, and output.14,15 The ideal instrument would have unlimited capacity to measure every pulmonary parameter, and it would have perfect accuracy and precision over its entire measurement range; there are no ideal instruments.
The capacity of an instrument refers to the range or limits of how much it can measure. Most instruments are designed with capacities to measure volumes and flow rates of all adults. The accuracy of a measuring instrument is how well it measures a known reference value. For volume measurements, standard reference values are provided by a graduated 3.0-L calibration syringe.16 No measuring instrument is perfect, and there usually is an arithmetic difference between reference values and measured values. This difference is called the error. Accuracy and error are opposing terms; the greater the accuracy, the smaller is the error. Accuracy and error are commonly expressed as percentages, with their sum always equaling 100%. To determine percent accuracy and percent error, several reference values are measured, and the mean of the measured values is computed and compared with the reference values according to the following equations:


 ). Diagnostic spirometers usually measure and calculate vital capacity (VC), FVC, FEV1, peak expiratory flow (PEF) rate, and FEF rates. Some measure and calculate maximal voluntary ventilation (MVV). Some of these instruments may be a component of a laboratory system providing the volume-measuring or flow-measuring capability for other diagnostic tests of pulmonary function. For example, they may be used with gas analyzers to measure functional residual capacity (FRC) and total lung capacity (TLC) or the inspiratory VC during single-breath diffusing capacity (DLCOSB). Whether a spirometer or pneumotachometer is used in a diagnostic laboratory, a physician’s office, or at the bedside in an intensive care unit, it should meet or exceed the national performance standards for volume-measuring and flow-measuring devices.
In 1978, the American Thoracic Society (ATS) adopted the initial standards for diagnostic spirometers. These standards have been adopted by other medical organizations and government agencies. Updated most recently in 2005 in collaboration with the European Respiratory Society (ERS), the standards are now recognized internationally as the standards for the industry.17 Some instruments have been independently evaluated against the standards or compared with instruments that meet those standards. Regardless of the measuring principle used by the instrument or the purpose of the patient testing, RTs should use only devices that meet or exceed current ATS/ERS performance standards. According to the ATS/ERS standards, when measuring a slow VC, the spirometer should be able to measure for up to 30 seconds, and for the FVC, the time capacity should be at least 15 seconds. When measuring the VC, FVC, and forced expiratory volumes, a volume-measuring spirometer should have a capacity of at least 8 L and should measure volumes with less than a 3% error or within 50 ml of a reference value, whichever is greater. These standards, including the 8-L standard for capacity, also apply to children. A diagnostic spirometer that measures flow should be at least 95% accurate (or within 0.2 L/sec, whichever is greater) over the entire 0 to 14 L/sec range of gas flow. The standards are summarized in Table 19-3.
TABLE 19-3
| Test | Volume (L) | Flow (L/sec) | Accuracy | Time (sec) | Back Pressure (cm H2O/L/sec) |
| VC | 0.5-8 L | 0-14 | ≤3% or 0.05 L* | 30 | |
| FVC | 0.5-8 L | 0-14 | ≤3% or 0.05 L* | 15 | <1.5%scm H2O/L/sec at 14 L/sec |
| FEV1 | 0.5-8 L | 0-14 | ≤3% or 0.05 L* | 1 | <1.5%scm H2O/L/sec at 14 L/sec |
| PEF | 0-14 | ≤10% or 0.3 L/sec* | <1.5%scm H2O/L/sec at 14 L/sec | ||
| FEF | ±14 | ≤5% or 0.2 L/sec* | <1.5%scm H2O/L/sec at 14 L/sec | ||
| MVV | 250 L/min at 2 L/breath | ±10% or 15 L/min* | 12-15 | <1.5%scm H2O/L/sec at 14 L/sec |
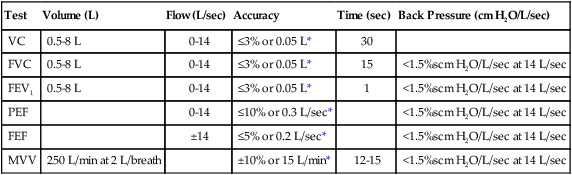
From Miller MR, Hankinson J, Brusasco V, et al: Standardisation of spirometry. Eur Respir J 26:319–338, 2005.
Principles of Measurement and Significance
 Rule of Thumb
In most pulmonary function laboratories, there are three components to pulmonary function testing: (1) performing spirometry for measuring airway mechanics, (2) measuring lung volumes and capacities, and (3) measuring the diffusing capacity of the lung (DL). For each component, there are various techniques and different types of equipment that make the measurements. When the purpose of the testing is to identify the presence and the degree of pulmonary impairment and the type of pulmonary disease, all three testing components are required. When the purpose of the testing is more limited, such as to assess postoperative pulmonary risk or to evaluate and quantify therapeutic effectiveness, the scope of measurement also is limited. Many pulmonary function laboratories also perform arterial blood gas analysis (see Chapter 18), and some laboratories provide more specialized and advanced tests, such as bronchial challenge tests and exercise stress tests.
Spirometry
Spirometry includes the tests of pulmonary mechanics—the measurements of FVC, FEV1, several FEF values, forced inspiratory flow rates, and MVV. Measuring pulmonary mechanics is assessing the ability of the lungs to move large volumes of air quickly through the airways to identify airway obstruction. Some measurements are aimed at large intrathoracic airways, some are aimed at small airways, and some assess obstruction throughout the lungs. Measuring flow rates is a surrogate for measuring airways resistance according to the formula: Raw = ΔP ÷  . A decrease in flow rate signifies an increase in airways resistance and the presence of airway obstruction when patient effort creating the difference between mouth pressure and lung pressure is constant (see Clinical Practice Guideline 19-1).17
Although performing tests of pulmonary mechanics is considered safe, some adverse reactions have occurred, including pneumothorax,18 syncope, chest pain, paroxysmal coughing, and bronchospasm associated with exercise-induced asthma.19 The contraindications for pulmonary function testing are primarily for testing mechanics. The ATS/ERS 2005 standards for spirometry17 specify the validity and reliability criteria of the measurements and accuracy and precision limits of the measuring equipment. These standards have been incorporated into the clinical practice guidelines of the AARC, medical societies, and government agencies.4,20–22
Forced Vital Capacity
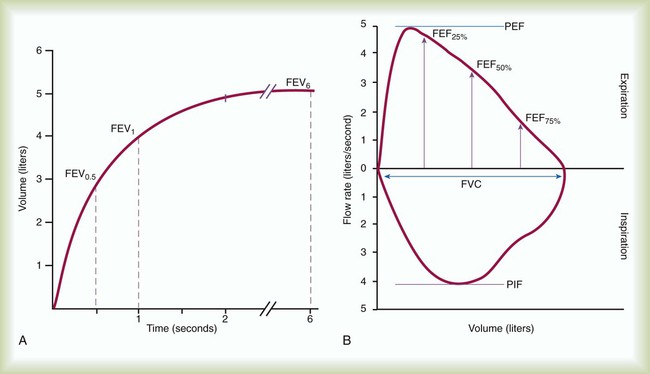
FVC is the most commonly performed test of pulmonary mechanics, and many measurements are made while the patient is performing the FVC maneuver (Figure 19-2). Measuring FVC often occurs under baseline or untreated conditions. For baseline testing, patients should temporarily abstain from bronchodilator medications. Short-acting bronchodilators (e.g., β-agonist albuterol, anticholinergic agent ipratropium bromide) should not be used for 4 hours before baseline spirometry, whereas long-acting β-agonist bronchodilators and oral therapy with aminophylline should be stopped for 12 hours. When a patient’s baseline results show airway obstruction, performing FVC after treatment (e.g., albuterol bronchodilator aerosol or metered dose inhaler) can help determine if the treatment is effective. The FVC maneuver is also performed repeatedly during bronchial provocation testing.
FVC may be measured on a spirometer that measures volumes or flows, that presents a graph of volume and time or flow and volume, that is mechanical or electronic, and that has a calculator or computer. The forced expiratory VC sometimes is followed by a forced inspiratory VC to produce a complete image of forced breathing called a flow-volume loop.23
 Rule of Thumb
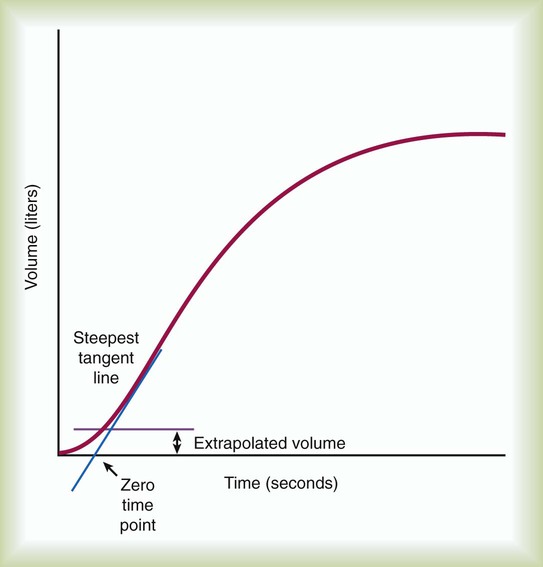
To ensure validity, each patient must perform a minimum of three acceptable FVC maneuvers. To ensure reliability, the largest FVC and second largest FVC from the acceptable trials should not vary by more than 0.150 L. To perform an FVC trial, the patient should inhale rapidly and completely to TLC from the resting FRC level. The forced exhalation of an acceptable FVC trial should begin abruptly and without hesitation. A satisfactory start of expiration is defined as an extrapolated volume at the zero time point less than 5% of FVC or 0.150 L, whichever is greater (Figure 19-3). The volume exhaled before the zero time point is called the extrapolated volume. To be valid, no more than 5% of the VC or 0.150 L is allowed to be exhaled before the zero time point. An acceptable FVC trial also is smooth, continuous, and complete. A cough, an inspiration, a Valsalva maneuver, a leak, or an obstructed mouthpiece while an FVC maneuver is being performed disqualifies the trial. FVC must be completely exhaled or an exhalation time of at least 6 seconds must occur for adults and children older than 10 years (longer times are commonly needed for patients with airway obstruction). A 3-second exhalation is acceptable for children younger than 10 years old. An end expiratory plateau must be obvious in the volume-time curve; the objective standard is less than 0.025 L exhaled during the final second of exhalation. Consistent with its definition, the largest acceptable FVC (BTPS) measured from the set of three acceptable trials is the patient’s FVC.
Forced Expiratory Volume in 1 Second
During FVC testing, several other measurements are also made. FEV1 is a measurement of the volume exhaled in the first second of FVC (see Figure 19-2, A). To ensure validity of FEV1, the measurement must originate from a set of three acceptable FVC trials. The first second of forced exhalation begins at the zero time point (see Figure 19-3). To ensure reliability of FEV1, the largest FEV1 and second largest FEV1 from the acceptable trials should not vary by more than 0.150 L. Consistent with its definition, the largest FEV1 (BTPS) measured is the patient’s FEV1. The largest FEV1 sometimes comes from a different trial than the largest FVC.
Forced Expiratory Flow Between 200 ml and 1200 ml of Forced Vital Capacity and Forced Expiratory Flow Between 25% and 75% of Forced Vital Capacity
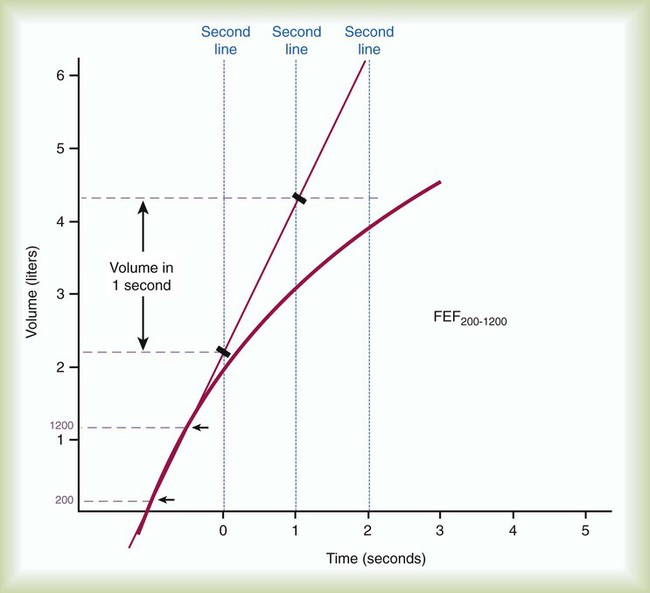
FEF200-1200 and FEF25%-75% represent average flow rates that occur during specific intervals of FVC. Both measurements can be made on a volume-time spirogram as the slope of a line connecting the two points in their subscripts. For FEF200-1200, the 200-ml point and the 1200-ml point are identified. A straight line is drawn connecting these points, and the line is extended to intersect two vertical time lines 1 second apart on the graph (Figure 19-4). The volume of air measured between the two time lines is FEF200-1200 in liters per second. The volume measured must be corrected to BTPS.
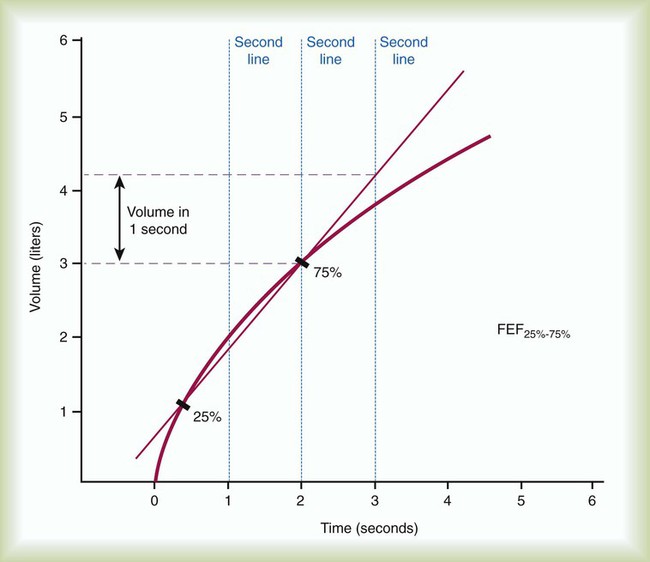
FEF25%-75% is a measure of the flow during the middle portion of FVC, or the time necessary to exhale the middle 50%. For FEF25%-75%, the VC of the best curve is multiplied by 25% and 75%, and the points are identified on the tracing. A straight line is drawn connecting these points, and the line is extended to intersect two vertical time lines 1 second apart on the graph. The volume of air measured between the two time lines is FEF25%-75% in liters per second. The volume measured must be corrected to BTPS (Figure 19-5).
Peak Expiratory Flow
PEF is difficult to identify on a volume-time graph of FVC. The peak flow is the slope of the tangent to the steepest portion of the FVC curve. PEF is easy to identify on a flow-volume graph as the highest point on the graph (see Figure 19-2, B).23 PEF is sometimes measured independently of FVC with a peak flowmeter. These devices are designed to indicate only the greatest expiratory flow rate. The validity of PEF rate is based on a preceding inspiration to TLC and a maximal effort. The FVC principles of ensuring reliability should apply to measurements of PEF rate. The two largest repeated measurements should agree within 5%.
In addition to PEF rate, the other instantaneous flow rates, such as forced expiratory flow at 25% (FEF25%) of FVC, forced expiratory flow at 50% (FEF50%) of FVC, and forced expiratory flow at 75% (FEF75%) of FVC, during FVC are graphed on a flow-volume curve. When FVC is followed by a forced inspiratory VC, a flow-volume loop is produced (see Figure 19-2, B). On the flow-volume loop, the maximal forced inspiratory flow rate at 50% (FIF50%) of VC can be measured and compared with FEF50%.
Maximal Voluntary Ventilation
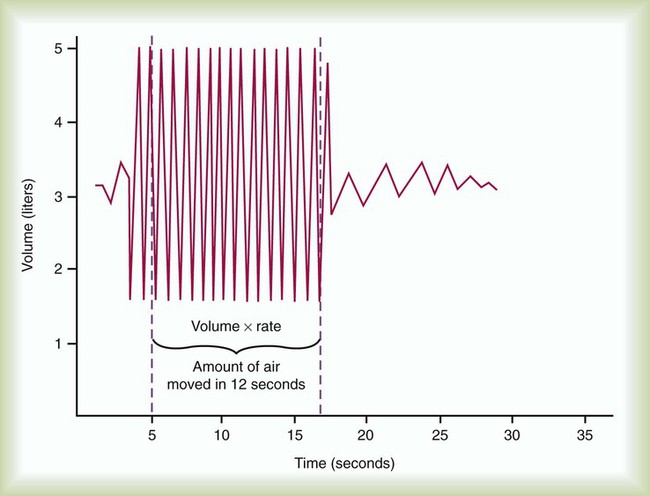
Another measurement of pulmonary mechanics is MVV. MVV is another effort-dependent test for which the patient is asked to breathe as deeply and as rapidly as possible for at least 12 seconds. MVV is a test that reflects patient cooperation and effort, the ability of the diaphragm and thoracic muscles to expand the thorax and lungs, and airway patency. Because of the potential for acute hyperventilation and fainting or coughing, the patient should be seated. Measuring systems that incorporate rebreathing may minimize hyperventilation. After a demonstration of the expected breathing pattern is performed, the patient should be instructed to breathe as rapidly and as deeply as possible for at least 12 seconds. The patient’s breathing is measured on a spirogram (Figure 19-6) or electronically for the specific number of seconds (t) and the volume (V) breathed when the MVV is converted to liters per minute. As with all volumes measured on a spirometer, the recorded values should be in BTPS conditions. The validity of MVV depends on the duration of the maneuver, which should be at least 12 seconds; the breathing frequency, which should be at least 90/min; and the average volume, which should be at least 50% of FVC. Patients should perform at least two MVV trials when the first trial does not exceed 80% of the subject’s FEV1 × 40, which may indicate less than maximal effort, or 80% of the predicted normal value, which may indicate disease. Reliability is shown when there is less than 20% variability between the two largest trials. The largest MVV (BTPS) should be reported.
 Problem
Significance
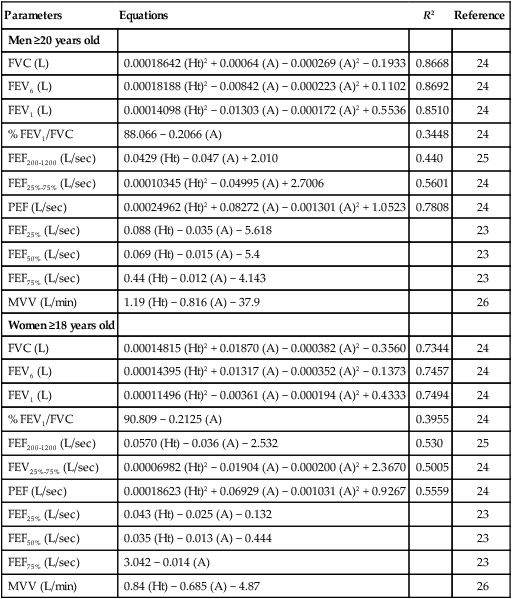
The normal values for the spirometric measurements of pulmonary mechanics are based on height, age, gender, and ethnicity. Table 19-4 provides common regression equations to predict normal values for the measurements of pulmonary mechanics for individuals of specific height (in centimeters), age (in years), and gender.24–26 A positive correlation exists between measurements of pulmonary mechanics and height, and a negative correlation exists between measurements of pulmonary mechanics and age for patients older than 20 years. Male values are larger than female values when height and age are equal. The populations that were studied to determine the normal values of pulmonary mechanics were predominantly white. To account for ethnic differences of nonwhites, the predicted normal values for whites commonly are reduced by 12% to 15% when applied to nonwhites. Ethnic-specific equations for special populations, such as African-Americans and Mexican-Americans, have also been developed.24
TABLE 19-4
Examples of Regression Equations for Predicted Normal Pulmonary Mechanics in White Adults
| Parameters | Equations | R2 | Reference |
| Men ≥20 years old | |||
| FVC (L) | 0.00018642 (Ht)2 + 0.00064 (A) − 0.000269 (A)2 − 0.1933 | 0.8668 | 24 |
| FEV6 (L) | 0.00018188 (Ht)2 − 0.00842 (A) − 0.000223 (A)2 + 0.1102 | 0.8692 | 24 |
| FEV1 (L) | 0.00014098 (Ht)2 − 0.01303 (A) − 0.000172 (A)2 + 0.5536 | 0.8510 | 24 |
| % FEV1/FVC | 88.066 − 0.2066 (A) | 0.3448 | 24 |
| FEF200-1200 (L/sec) | 0.0429 (Ht) − 0.047 (A) + 2.010 | 0.440 | 25 |
| FEF25%-75% (L/sec) | 0.00010345 (Ht)2 − 0.04995 (A) + 2.7006 | 0.5601 | 24 |
| PEF (L/sec) | 0.00024962 (Ht)2 + 0.08272 (A) − 0.001301 (A)2 + 1.0523 | 0.7808 | 24 |
| FEF25% (L/sec) | 0.088 (Ht) − 0.035 (A) − 5.618 | 23 | |
| FEF50% (L/sec) | 0.069 (Ht) − 0.015 (A) − 5.4 | 23 | |
| FEF75% (L/sec) | 0.44 (Ht) − 0.012 (A) − 4.143 | 23 | |
| MVV (L/min) | 1.19 (Ht) − 0.816 (A) − 37.9 | 26 | |
| Women ≥18 years old | |||
| FVC (L) | 0.00014815 (Ht)2 + 0.01870 (A) − 0.000382 (A)2 − 0.3560 | 0.7344 | 24 |
| FEV6 (L) | 0.00014395 (Ht)2 + 0.01317 (A) − 0.000352 (A)2 − 0.1373 | 0.7457 | 24 |
| FEV1 (L) | 0.00011496 (Ht)2 − 0.00361 (A) − 0.000194 (A)2 + 0.4333 | 0.7494 | 24 |
| % FEV1/FVC | 90.809 − 0.2125 (A) | 0.3955 | 24 |
| FEF200-1200 (L/sec) | 0.0570 (Ht) − 0.036 (A) − 2.532 | 0.530 | 25 |
| FEV25%-75% (L/sec) | 0.00006982 (Ht)2 − 0.01904 (A) − 0.000200 (A)2 + 2.3670 | 0.5005 | 24 |
| PEF (L/sec) | 0.00018623 (Ht)2 + 0.06929 (A) − 0.001031 (A)2 + 0.9267 | 0.5559 | 24 |
| FEF25% (L/sec) | 0.043 (Ht) − 0.025 (A) − 0.132 | 23 | |
| FEF50% (L/sec) | 0.035 (Ht) − 0.013 (A) − 0.444 | 23 | |
| FEF75% (L/sec) | 3.042 − 0.014 (A) | 23 | |
| MVV (L/min) | 0.84 (Ht) − 0.685 (A) − 4.87 | 26 |
Although traditional textbooks suggest the typical normal VC is 4.80 L, the predicted normal FVC for a 20-year-old, 180-cm man approaches 5.60 L. A reduced FVC may occur with obstructive or restrictive impairments. Figure 19-7 shows FVC from volume-time spirometer tracings for normal, obstructive, and restrictive conditions. The FVC values in both the obstructed and the restricted curves are shown as reduced volumes compared with the normal curve. The primary difference between the curve in the restricted patient compared with the curve in the obstructed patient is the slope of the tracing; obstructive diseases produce flattened slopes and smaller FEV1.
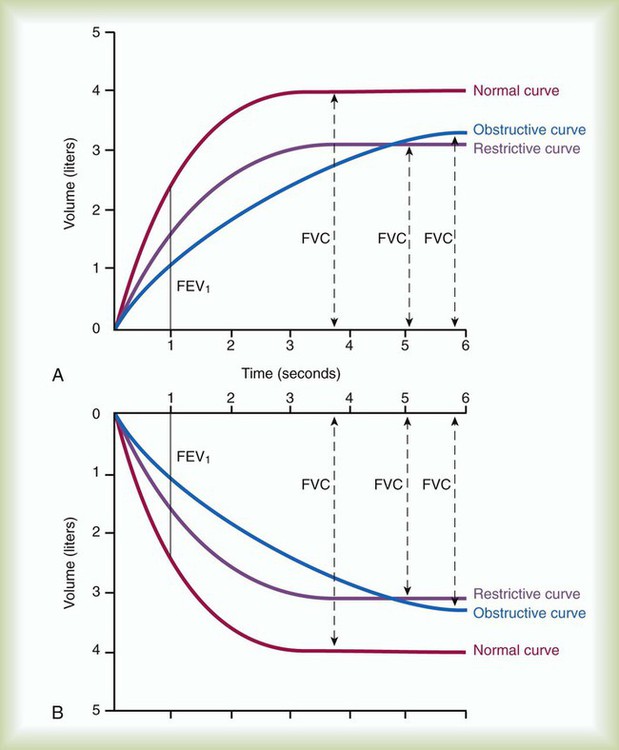
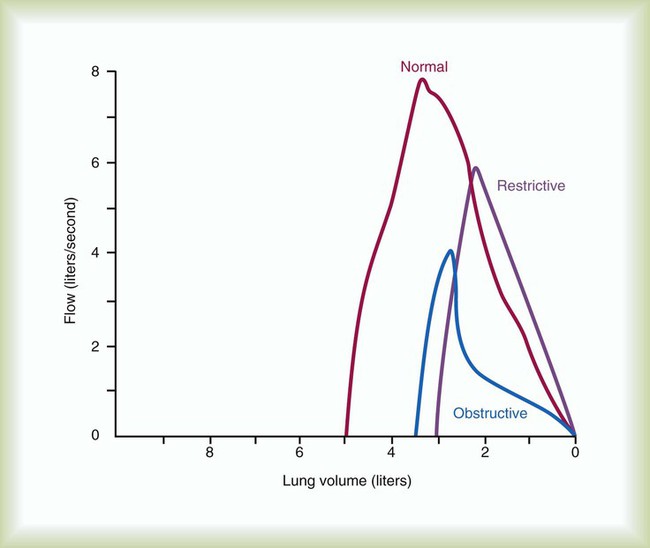
Figure 19-8 displays the FVC from flow-volume tracings for obstructive and restrictive conditions. The shapes of these tracings are different; obstructive diseases produce lower peaks and lower flow rates at all lung volumes. Forced inspiratory flow rates sometimes are useful for identifying extrathoracic airway obstructions. In moderate and severe obstructive lung diseases, the FVC is reduced if weakened bronchioles collapse and trap air in the lungs, creating an increase in RV. Some laboratories compare the volumes of slow vital capacity (SVC) and FVC to identify air trapping. VC is reduced in restrictive lung diseases because the patient’s inhaled volume is reduced.
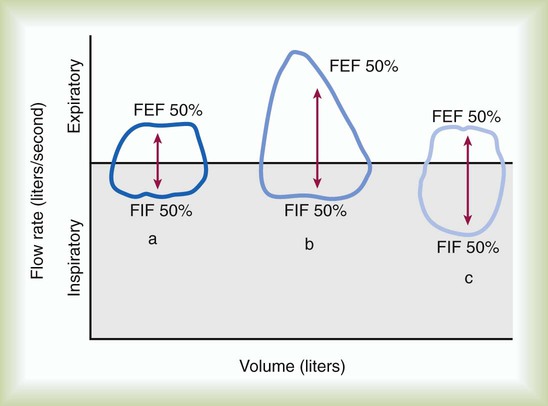
The shape of the flow-volume loop and the FEF50%/FIF50% ratio provide additional information about upper airway obstruction. Compared with the normal flow-volume loop, a fixed upper airway obstruction produces a curve that appears box-shaped. In Figure 19-9, both expiratory and inspiratory flows are decreased and limited by the solid obstruction; the FEF50%/FIF50% ratio remains normal. Variable upper airway obstructions produce two different shapes depending on the site of the obstruction. Because the intraairway pressure during a forced inspiration is less than atmospheric outside the thorax, a variable extrathoracic upper airway obstruction limits inspiratory flow, and the FEF50%/FIF50% ratio is greater than 1.0. Because the intraairway pressure during a forced inspiration is greater than atmospheric pressure inside the thorax, a variable intrathoracic upper airway obstruction limits expiratory flow, and the FEF50%/FIF50% ratio is less than 1.0.
Similar to other spirometric measurements of pulmonary mechanics, normal values of MVV are based on gender, age, and height. MVV is reduced in patients with moderate and severe airway obstruction. A measured value less than 75% of predicted is significant. The normal for men is approximately 160 to 180 L/min; it is slightly lower in women. In restrictive lung disease, MVV may be normal or only slightly reduced. Respiratory muscle strength is a primary determinant of MVV in patients with interstitial lung disease and an important determinant in patients with chronic obstructive pulmonary disease (COPD). Undernourished patients also may have a reduced MVV.26
 Rule of Thumb
 Rule of Thumb
Bronchial Challenge
When the patient’s history suggests episodic symptoms of hyperreactive airways and airway obstruction, such as seasonal or exercise-induced wheezing, and the results of baseline spirometry are normal, performing a bronchial provocation may be indicated.27 Bronchial provocation testing uses an agent to stimulate a hyperreactive airway response and to create airway obstruction. Although several types of provocations are possible, such as inhaling histamine or cold air or exercising, provoking a hyperreactive airway response by inhaling methacholine is the most popular technique with the most predictable results. The procedure usually begins with the patient inhaling a normal saline aerosol and then repeating the FVC maneuver. Some very sensitive patients exhibit hyperreactive airways with saline alone; a positive response to saline is defined as a decrease in FEV1 of 10% or greater. The methacholine provocation protocol systematically exposes the patient to increasing dosages of methacholine. Usually starting with a low dose of 0.03 mg/ml, patients inhale methacholine aerosol and then repeat the FVC maneuver. A positive response to methacholine is defined as a decrease in FEV1 of 20% or greater (another example of percent change). If a positive response does not occur, the methacholine dose is doubled to 0.06 mg/ml, and the FVC maneuver is repeated. The process of “double-dosing” and performing FVC maneuvers continues until there is a positive response or until the full dose, 16 mg/ml, is given. If a positive response occurs, treatment with a fast-acting bronchodilator is indicated, and sometimes administering O2 is helpful. The final test report should include the concentration of methacholine that caused the 20% decrease in FEV1 in the form of PD%FEV1. For example, PD22FEV1 = 4 mg/ml indicates that the provocation dose of 4 mg/ml resulted in a 22% decrease in FEV1.
 Rule of Thumb
Lung Volumes and Capacities
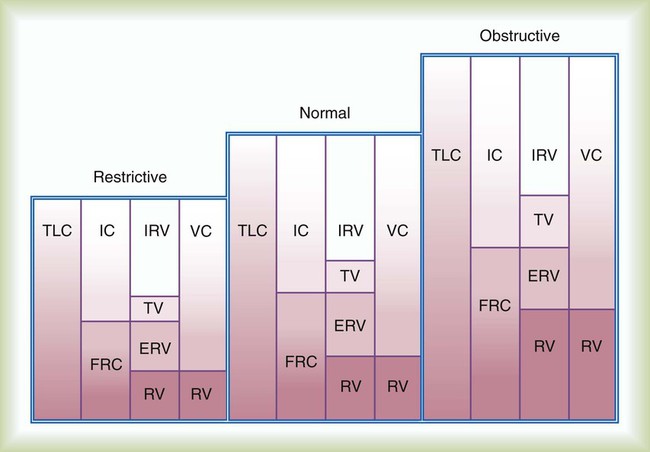
There are four lung volumes and four lung capacities. A lung capacity consists of two or more lung volumes. The lung volumes are tidal volume (VT), inspiratory reserve volume (IRV), expiratory reserve volume (ERV), and residual volume (RV). The four lung capacities are TLC, IC, FRC, and VC. These volumes and capacities are shown in Figure 19-10. The lung volumes that can be measured directly with a spirometer or pneumotachometer include VT, IC, IRV, ERV, and VC. Because the RV cannot be exhaled, the RV, FRC, and TLC must be measured using indirect methods.
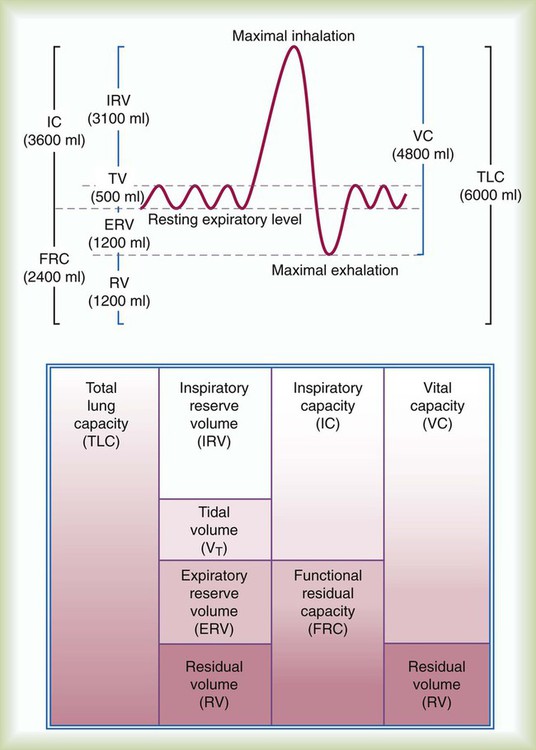
Knowing TLC is necessary to identify patients with a restrictive pattern of pulmonary impairment. Measuring FRC is necessary to quantify hyperinflation, which may be associated with obstructive impairment. Calculating RV is necessary to gauge any air trapping present. Measurements of VT, IC, ERV, IRV, and VC may be used in calculations of TLC or be useful to clinicians considering weaning parameters such as the rapid-shallow-breathing index (f/VT) or inspiration goals of hyperinflation therapy. Standards for measuring lung volumes and capacities were initially published in 2005; these standards focus primarily on the techniques to measure FRC.28 Following the measurement of FRC, measurements of ERV and VC enable calculation of TLC according to the formulas: TLC = (FRC − ERV) + VC and TLC = FRC + IC.
 Problem
The VT is measured directly from a spirogram (see Figure 19-10). For the purposes of ensuring test validity and standardization, the patient should be in a sitting or reclining position and wearing a nose clip. It sometimes takes the patient 1 to 2 minutes to be at rest and become accustomed to the nose clip and mouthpiece. The patient breathes through a tight-fitting mouthpiece until a normal, rhythmic breathing pattern is established. Because VT varies normally from breath to breath, an average VT is a more reliable measurement. In the laboratory, an average VT sometimes is measured during 3 minutes of quiet breathing while the spirometer records volumes and graphs volume and time. At the bedside, an average VT usually is measured over 1 minute; the patient breathes normally into a spirometer that stores in memory each volume exhaled for 1 minute and computes an average. An alternative approach is to measure the total volume of air exhaled for 1 minute ( ) and divide by the breathing frequency (f) counted during the same period. The following formula can be used to calculate the VT: VT =
  ÷ f.
÷ f.
The inspiratory capacity (IC) is also measured directly from a spirogram. The patient is asked to inhale maximally from the resting FRC at the end of a normal effortless exhalation. To ensure validity, a consistent resting expiratory level should be obvious on the spirogram before inhaling. To ensure reliability, the IC should be measured at least twice, and the two largest measurements should agree within 5%. Because the definition of IC is the maximal volume inhaled, the largest measurement is the patient’s IC. (See Clinical Practice Guidelines 19-2 and 19-3.)
The expiratory reserve volume (ERV) is measured directly from the spirogram (see Figure 19-10). The patient is asked to breathe normally for a few breaths and then exhale maximally. The ERV is the volume of air exhaled between the resting expiratory level and the maximal exhalation level on the spirogram. To ensure validity, a consistent resting expiratory level should be obvious on the spirogram before exhaling maximally. To ensure reliability, the ERV should be measured at least twice and the two largest measurements should agree within 5%. Because the definition of ERV is the maximal volume exhaled, the largest measurement is the patient’s ERV.
Helium Dilution
The helium dilution technique for measuring lung volumes uses a closed, rebreathing circuit (Figure 19-11).29 This technique is based on the assumptions that a known volume and concentration of helium in air begin in the closed spirometer, that the patient has no helium in his or her lungs, and that an equilibration of helium can occur between the spirometer and the lungs. For the helium dilution procedure to be performed, a measurable volume of helium is added into the spirometer circuit, and the initial concentration of helium (FiHe) is measured. Next, the valve is turned to connect the patient to the breathing circuit usually at the resting expiratory level of the FRC. Starting the test at RV requires maximal expiratory effort by the patient and is not considered a reliable starting point. Although starting the test at the TLC level requires a maximal inspiration, TLC may be a reliable alternative beginning point.
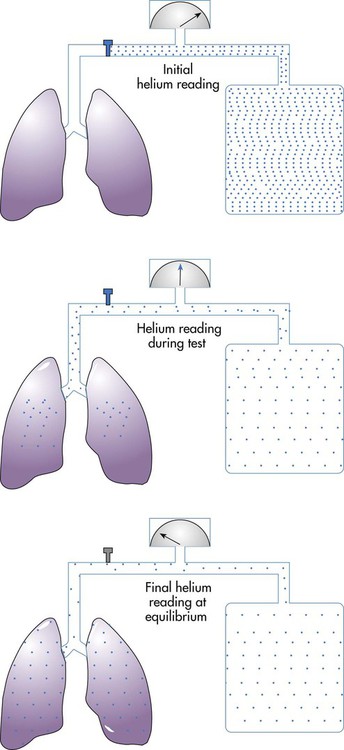

Although helium is an inert gas with a negligible solubility in plasma, another correction is sometimes applied. A small amount of helium is thought to diffuse across the alveolar-capillary membrane and is lost in the measurement of final helium concentration. To account for the loss, 30 ml of BTPS-corrected volume is subtracted for each minute of helium breathing, up to 200 ml for a 7-minute test.30 Once these corrections are made, RV can be calculated by subtracting ERV from FRC according to the equation: RV = FRC − ERV.
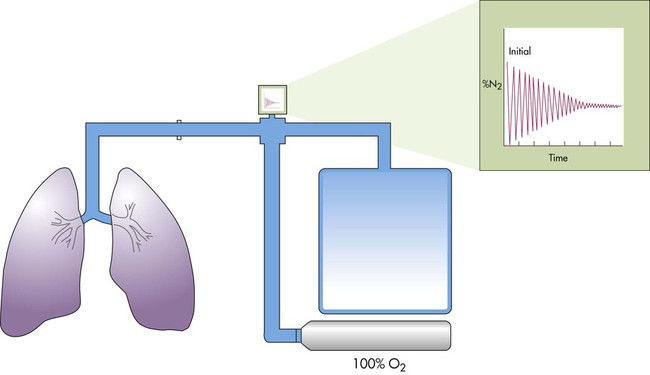
Nitrogen Washout
The nitrogen washout technique uses a nonrebreathing or open circuit (Figure 19-12).31 The technique is based on the assumptions that the nitrogen concentration in the lungs is 78% and in equilibrium with the atmosphere, that the patient inhales 100% O2, and that the O2 replaces all of the nitrogen in the lungs. Similar to the helium dilution technique, the patient is connected to the system at either the resting expiratory level or the TLC. The patient’s exhaled gas is monitored, and its volume and nitrogen percentage are measured.

 − 0.0665) × (W ÷ 70). Vtis (ml) is subtracted from the BTPS-corrected lung volume. RV is the difference between ERV and FRC.
Plethysmography
The plethysmography technique applies Boyle’s law and uses measurements of volume and pressure changes to determine lung volume, assuming temperature is constant.32 The plethysmography technique measures the volume of all compressible gas in the thorax, including gas trapped behind airway obstructions or in the pleural space. Gas in the abdomen may also be included in the measurement. The whole-body plethysmograph consists of a sealed chamber in which the patient sits (Figure 19-13). Pressure transducers (electronic manometers) measure pressure at the mouth and in the chamber. An electronically controlled shutter near the mouthpiece allows the airway to be occluded periodically, measuring airway pressure changes under conditions of no airflow. Without air flow, pressure changes measured at the mouth are pressure changes in the alveoli. According to Boyle’s law (V × P = k), when temperature is constant, volume changes in the thorax create volume changes in the chamber, which are reflected by pressure changes in the chamber. The pressure and volume changes are included in the equation:
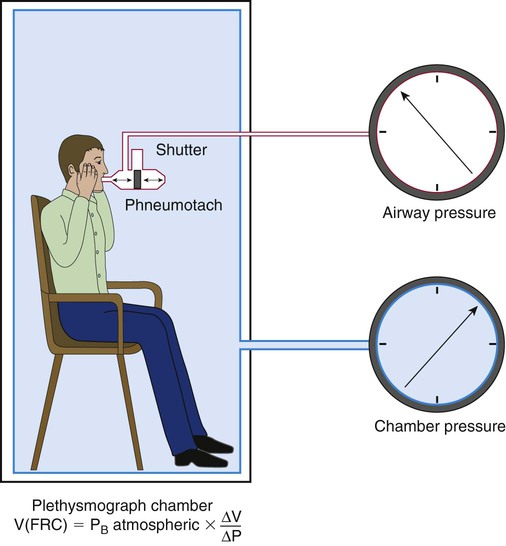

When measurement of TGV is being done, the patient sits in the chamber and initially breathes normal tidal volumes through the mouthpiece. When the patient is near FRC, the shutter is closed at end expiration for 2 to 3 seconds. The patient holds his or her cheeks and performs gentle panting at 1 Hz or one pant per second.33 During panting, changes in airway pressure (ΔP) and changes in chamber volume (ΔV) are measured. Because the panting maneuver occurs with small pressure changes around barometric pressure, the simplified equation used to calculate TGV is VTG = PB × (ΔV ÷ ΔP), where PB is the barometric pressure in cm H2O. A series of three to five panting maneuvers should be performed. After panting, the patient should exhale completely to record ERV and then inhale maximally to record the inspiratory vital capacity.
Significance
The normal IC is approximately 3600 ml, with a significant variation in the normal population. IC may be normal or reduced in restrictive and obstructive lung diseases. A reduction of IC occurs in restrictive lung diseases because the patient’s inhaled volume is reduced, and there is a reduction in TLC. In mild obstructive lung diseases, IC is usually normal. In moderate and severe obstructive diseases, IC can be reduced because the resting expiratory level of FRC has increased owing to hyperinflation of the lungs. An increase in IC may occur when the patient inhales from below the resting expiratory level when the measurement is performed; athletes and musicians who play wind instruments may also have increased inspiratory capacities. RTs use the measurement of IC in clinical protocols to decide between methods of lung expansion therapy (see Chapter 39).
RV, FRC, and TLC are the most important measurements of lung volumes. Age, height, gender, ethnicity, and sometimes weight or body surface area correlate with normal values for these lung volumes.34 Table 19-5 provides common regression equations to predict the lung volumes for individuals of specific height (in centimeters), age (in years), and gender. A positive correlation exists between lung volumes and height, and a negative correlation exists between lung volumes and age for patients older than 20 years. Male values are larger than female values when height and age are equal.
TABLE 19-5
Examples of Regression Equations for Predicting Normal Lung Volumes and Capacities in Adults
| Lung Volumes | Equations |
| Men | |
| FRC (L) | 0.0234 (Ht) + 0.01 (A) − 1.09 |
| RV (L) | 0.0131 (Ht) + 0.022 (A) − 1.23 |
| TLC (L) | 0.0799 (Ht) − 7.08 |
| FRC/TLC% | 43.8 + 0.21 (A) |
| RV/TLC% | 14.0 + 0.39 (A) |
| Women | |
| FRC (L) | 0.0224 (Ht) + 0.001 (A) − 1.00 |
| RV (L) | 0.0181 (Ht) + 0.016 (A) − 2.00 |
| TLC (L) | 0.0660 (Ht) − 5.79 |
| FRC/TLC% | 45.1 + 0.16 (A) |
| RV/TLC% | 19.0 + 0.34 (A) |
A, Years; Ht, cm; L, liters at BTPS.
Stocks J, Quanjer PH: Reference values for residual volume, functional residual capacity and total lung capacity. Eur Respir J 8:492–497, 1995.
The typical normal TLC is 6.00 L. The normal RV is approximately 1.20 L and represents approximately 20% of TLC. FRC is approximately 2.40 L, which represents approximately 40% of the TLC. RV and FRC are usually enlarged in acute and chronic obstructive lung diseases because of hyperinflation and air trapping (Figure 19-14).
Diffusing Capacity
Mini Clini
Diffusing Capacity of the Lung for Carbon Monoxide in Chronic Obstructive Pulmonary Disease
 Problem
Factors known to affect test results should be controlled or standardized; these include body position, activity, PaO2, Hb and carboxyhemoglobin (COHb) levels, and pulmonary blood volume. To focus the test on diffusion through the alveolar-capillary membrane, the patient should be tested at rest in a seated position, should not breathe supplemental O2 for 10 minutes before testing, and should not have an abnormal level of COHb before the test. Mathematical corrections can be applied for patients who cannot abstain from O2. Performing the diffusing capacity on patients who have recently smoked a cigarette or who have been exposed to environmental CO may hinder test validity.35 Patients should refrain from smoking on the day of the test. Hb of all patients undergoing diffusing capacity should be measured, and a mathematical correction should be applied if Hb level is abnormal.
Single-Breath Technique
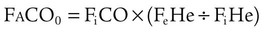
There are several techniques to measure the diffusing capacity of the lung for CO, including steady-state, intrabreath, and rebreathing techniques, but the single-breath method (DLCOSB) is the most common measurement technique because it is quick and reproducible. Standards for measuring diffusing capacity of the lung were initially published in 1995 and updated in 2005; these standards focus primarily on the DLCOSB.36,37 The entire test can be performed in just slightly longer than 10 seconds. The patient exhales completely to RV, rapidly inspires a VC of a gas mixture containing 0.3% CO and an inert tracer gas such as He in air, maintains breath holding for 10 seconds, and then exhales rapidly at least 1.0 L. Inspiring at least 85% of VC measured during spirometry is expected. After a predesignated volume of 0.75 to 1.0 L is exhaled, a sample of alveolar gas is collected and analyzed for expired CO (FeCOt) and helium (FeHe). Because the breath holding period (t) begins when inspiration of the gas mixture begins and the period ends when the alveolar sample is collected, inspiration and expiration should be rapid, and this period should not exceed 11 seconds. To regulate the breath holding period, some measuring systems close the mouthpiece with a timed shutter. The suitable breathing pattern requires some patient cooperation and coordination; some patients benefit from a timer as a visual aid.
The single-breath method (DLCOSB) is based on the diffusion decay curve described by Forster and colleagues38 (Figure 19-15). When a bolus of CO gas is inhaled, the rate of gas diffusion declines logarithmically. The diffusing capacity of the lung is a function of lung volume (VA) in STPD conditions exposed to the test gas,39 the duration (60 ÷ t) that the test gas is in contact with the lung, the initial concentration of test gas in the lung (FaCO0), and the final concentration of test gas in the lung (FaCOt), according to the following equation:
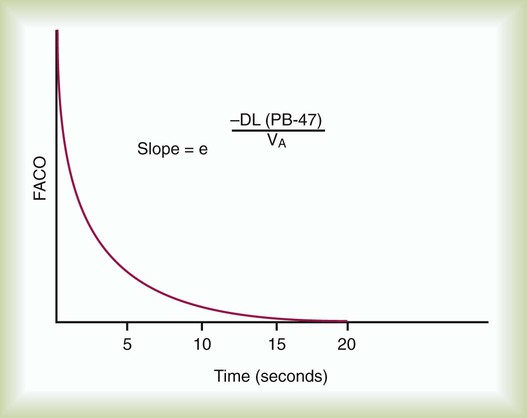

where (PB − 47) is ambient barometric pressure corrected for water vapor pressure at 37° C.
The reliability of the DLCO is based on repeatability of the test. At least 4 minutes should be allowed between tests to allow an adequate elimination of CO from the lungs. In patients with obstructive airway disease, a longer period (e.g., 10 minutes) may be necessary. The actual DLCO reported should be the mean of 2 acceptable tests. An acceptable test is defined as one that is reproducible to within 10% or 3 ml of the CO/min/mm Hg value, whichever is greater. (See Clinical Practice Guideline 19-4.)
Significance
Normal values for the DLCO using the single-breath technique are based primarily on a patient’s age, height, and gender (Table 19-6). A typical normal value for a 20-year-old healthy man is 40 ml/min/mm Hg.40 Before interpretation of the test result, corrections for abnormal Hb level, breathing supplemental O2 or testing at altitude, and elevated COHb levels may be necessary, if these conditions apply. Initially, all Hb levels were corrected to 15 g/dl.41 More recent and more specific corrections have been advocated. For men and adolescents, if the Hb level varies from 14.6 g/dl, the predicted normal value should be adjusted using the following equation:42
TABLE 19-6
Examples of Regression Equations for Predicting Normal Diffusing Capacity in Adults
| Parameter | Regression Equations |
| Men | |
| DLCOSB (ml/min/mm Hg) | 0.0416 (Ht) − 0.219 (A) − 26.34 |
| DLCOSB/VA (ml/min/mm Hg/L) | 6.61 − 0.034 (A) |
| Women | |
| DLCOSB (ml/min/mm Hg) | 0.0256 (Ht) − 0.144 (A) − 8.36 |
| DLCOSB/VA (ml/min/mm Hg/L) | 7.34 − 0.032 (A) |
A, Years; Ht, cm; L, Liters at BTPS; ml, milliliters at STPD.
Crapo RO, Morris AM: Standardized single breath normal values for carbon monoxide diffusing capacity. Am Rev Respir Dis 123:185, 1981.

For women and children, the normal Hb level is 13.4 g/dl, and the equation is42:

If the patient’s PaO2 differs from 100 mm Hg because of breathing supplemental O2 or performing the test at altitude, the DLCO would be affected by approximately 0.31% to 35% per mm Hg difference from 100 mm Hg.43,44 The predicted normal value should be adjusted using the following equations:

The DLCO may be reduced from the predicted normal in patients with obstructive or restrictive lung diseases. With destruction of alveoli in pulmonary emphysema, with small lung volumes, and with fibrosis of alveoli in asbestosis, the DLCO may be less than normal. Pulmonary embolism also may decrease the DLCO. The DLCO may be useful in identifying which patients with obstructive impairment are likely to desaturate during exercise and which may benefit from O2 therapy. The DLCO may be increased in patients with polycythemia, congestive heart failure (resulting from an increase in pulmonary vascular blood volume), and elevated cardiac output. Factors that can alter the DLCO above or below the normal value are summarized in Box 19-2.
Interpretation of the Pulmonary Function Report
Interpretive strategies for pulmonary function testing abound. Most computer-based pulmonary function testing systems have algorithms in their software programs for computer-assisted interpretations of the pulmonary function report.45 A consensus for interpreting test results is growing.46,47 Table 19-7 summarizes pulmonary function changes that may occur in advanced obstructive and restrictive patterns of lung diseases, and Figure 19-16 presents a simple algorithm to assess pulmonary function test results in clinical practice.47
TABLE 19-7
Pulmonary Function Changes in Advanced Lung Diseases
| Measurement | Normal* | Obstructive | Restrictive |
| VT | 500%smL | N or ↑ | N or ↓ |
| IRV | 3.10 L | N or ↓ | ↓ |
| ERV | 1.20 L | N or ↓ | ↓ |
| RV | 1.20 L | ↑ | ↓ |
| IC | 3.60 L | N or ↓ | ↓ |
| FRC | 2.40 L | ↑ | ↓ |
| TLC | 6.00 L | N or ↑ | ↓ |
| FVC | 4.80 L | ↓ | ↓ |
| FEV1 | 4.20 L | ↓ | N or ↓ |
| FEV1/FVC | >70% | ↓ | N or ↑ |
| FEF200-1200 | 8.5 L/sec | ↓ | N |
| FEF25%-75% | 4.5 L/sec | ↓ | N |
| PEF | 9.5 L/sec | ↓ | N |
| FEF25% | 9.0 L/sec | ↓ | N |
| FEF50% | 6.5 L/sec | ↓ | N |
| FEF75% | 3.5 L/sec | ↓ | N |
| MVV | 160 L/min | ↓ | N or ↓ |
| DLCO | 40%smL/min/mm Hg | N or ↓ | N or ↓ |
| DLCO/VA | 6.6%smL/min/mm Hg/L | N or ↓ | N or ↓ |
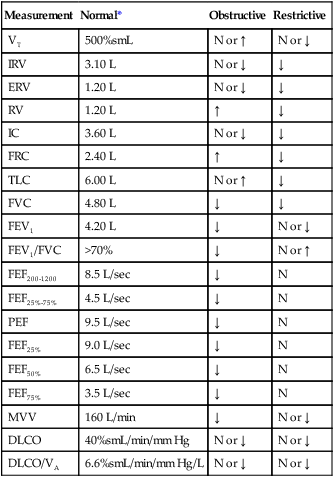
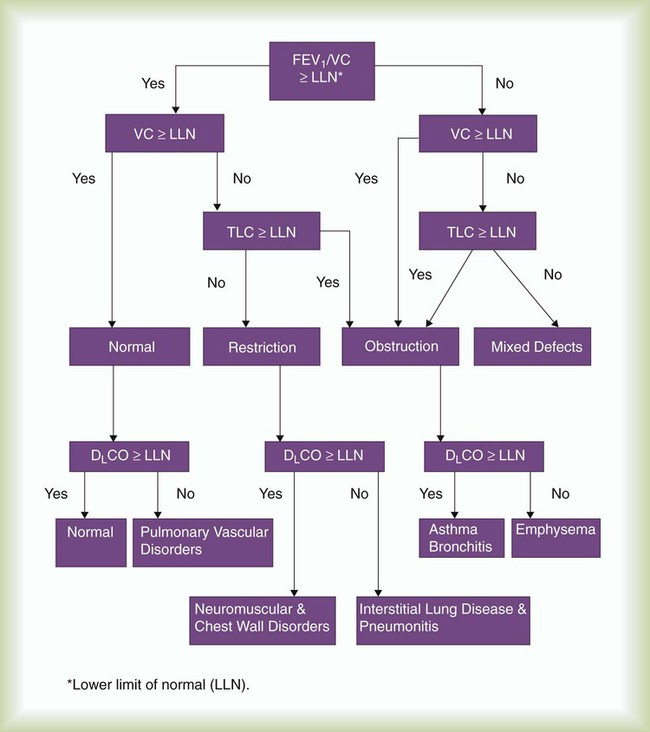
When considering a pulmonary function report, the %FEV1/VC ratio is a good place to start because it provides an initial focus as normal, restrictive, or obstructive impairment. When the %FEV1/FVC is less than the LLN, there is airway obstruction. When the %FEV1/FVC is greater than the LLN, there is no airway obstruction. The LLN %FEV1/FVC can be determined directly for various populations using regression equations in Table 19-8 or simply estimated at 70%. If the %FEV1/FVC ratio is greater than the LLN or 70% and if the TLC is less than the LLN, often defined as less than 80% predicted normal, the patient has a restrictive impairment according to this algorithm. The severity of the restriction is based on the percent predicted or on the number of standard deviations below the LLN TLC according to Table 19-2. If the %FEV1/FVC ratio is less than 70%, the patient likely has an obstructive impairment; the severity of the obstruction is based on the percent predicted normal FEV1 according to Table 19-2. If the percent predicted normal DLCO is less than 80%, the patient has a diffusion impairment. Some laboratories also report the DLCO/VA ratio, which indexes the DLCO for lung volume measured during the single-breath test. If the DLCO/VA ratio is also less than 80% of the indexed value, the cause of the diffusion impairment is considered to be within the lung, and if the DLCO/VA ratio is greater than 80% of the indexed value, the cause of the diffusion impairment is considered to be due to small lung volume.
TABLE 19-8
| Population | Equations | R2 |
| Men | ||
| White | 78.388 − 0.2066 (A) | 0.3448 |
| African-American | 78.822 − 0.1828 (A) | 0.1538 |
| Mexican-American | 80.925 − 0.2186 (A) | 0.2713 |
| Women | ||
| White | 81.015 − 0.2125 (A) | 0.3955 |
| African-American | 80.978 − 0.2039 (A) | 0.2284 |
| Mexican-American | 83.044 − 0.2248 (A) | 0.3352 |
Hankinson JL, Odencratz JR, Fedan KB: Spirometric reference values from a sample of the general U.S. population. Am J Respir Crit Care Med 159:179, 1999.
Mini Clini
Identifying Patterns of Pulmonary Impairment
 Problem
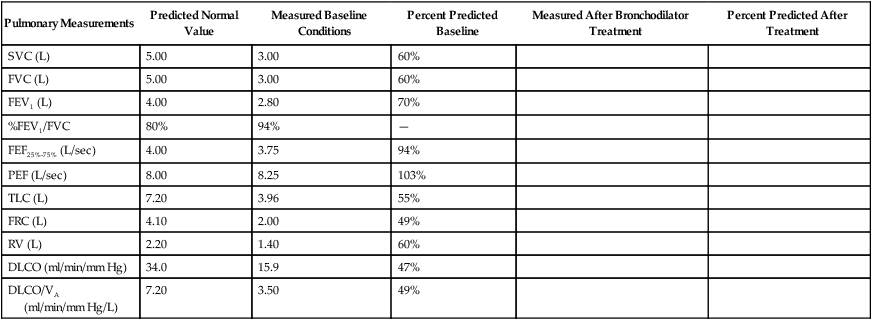
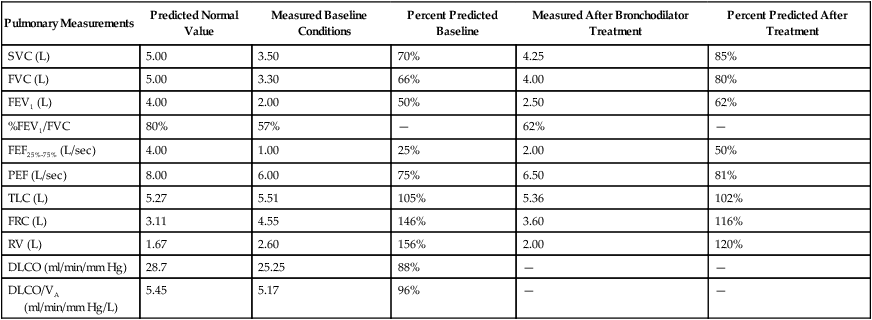
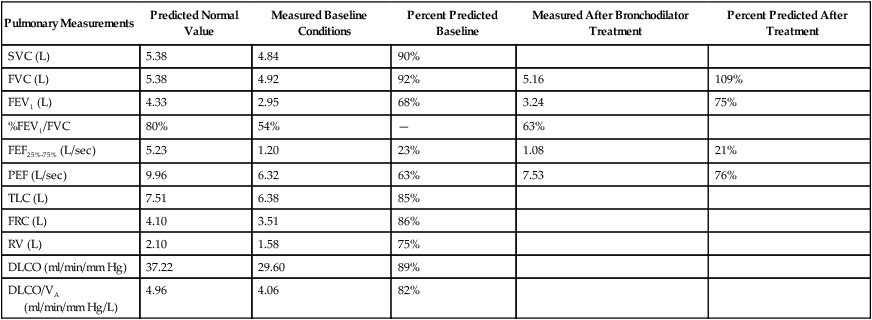
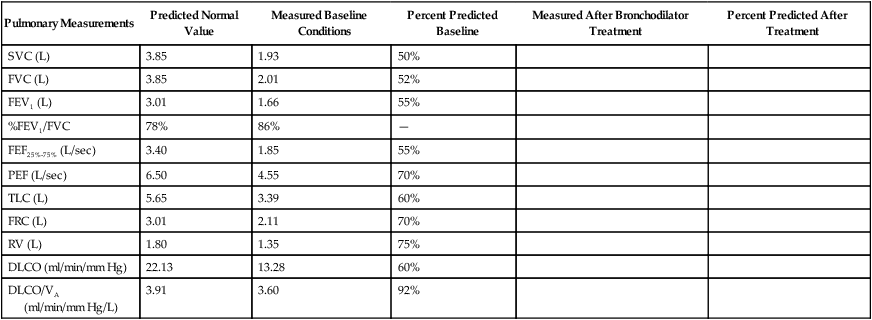
Following are three pulmonary function reports that show three distinct examples of pulmonary impairment. Using the algorithm in Figure 19-16, identify the patterns typical of asthma, pulmonary fibrosis, and COPD.

[/level-membership-for-pulmolory-and-respiratory-category][not-level-membership-for-pulmolory-and-respiratory-category]
Pulmonary Function Testing
After reading this chapter you will be able to:
List the three categories of pulmonary function tests.
State the primary purposes of pulmonary function testing.
Describe the pathophysiologic patterns associated with obstructive and restrictive lung disease.
State what is meant by the term spirometer, and list the parameters that can be measured by it.
List and describe the measurements that indicate pulmonary mechanics.
Describe the purpose and technique for the bronchial challenge test.
Describe the purpose and techniques used to measure diffusion capacity.
1. The diaphragm and thoracic muscles must be capable of expanding the thorax and lungs to produce a subatmospheric pressure.
2. The airways must be unobstructed to allow gas to flow into the lungs and reach the alveoli.
3. The cardiovascular system must circulate blood through the lungs and ventilated alveoli.
4. O2 and CO2 must be able to diffuse through the alveolar-capillary membrane.
Pulmonary function tests can provide valuable information about these important individual processes that support gas exchange. Various measurements are available to aid in the diagnosis and assessment of pulmonary diseases, to determine the need for therapy, and to evaluate the effectiveness of respiratory care. For respiratory therapists (RTs), knowledge of these tests and the ability to interpret the measurements are essential for assessing patients objectively and for planning and implementing effective patient care. The key terms used in this chapter are terms adopted and defined by the pulmonary medical community and should become the standard vocabulary of all RTs.1
Pulmonary Function Testing
Purposes
Generally, the primary purposes of pulmonary function testing are to identify pulmonary impairment and to quantify the severity of pulmonary impairment if present.2 Pulmonary function testing has diagnostic and therapeutic roles and helps clinicians answer some general questions about patients with lung disease (Box 19-1).
The indications for pulmonary function testing are as follows:
• To identify and quantify changes in pulmonary function. The most common purposes of pulmonary function testing are to detect the presence or absence of pulmonary disease, to classify the type of disease as either obstructive or restrictive, and to quantify the severity of pulmonary impairment as mild, moderate, severe, or very severe. Over time, pulmonary function tests help quantify the progression or the reversibility of the disease.3
• To evaluate need and quantify therapeutic effectiveness.4 Pulmonary function tests may aid clinicians in selecting or modifying a specific therapeutic regimen or technique (e.g., bronchodilator medication, airway clearance therapy, rehabilitation exercise protocol). Clinicians and researchers use pulmonary function tests to measure changes in lung function objectively before and after treatment.
• To perform epidemiologic surveillance for pulmonary disease. Screening programs may detect pulmonary abnormalities caused by disease or environmental factors in general populations, in people in occupational settings, in smokers, or in other high-risk groups. In addition, researchers have determined what normal pulmonary function is by measuring the pulmonary function of healthy people.5
• To assess patients for risk of postoperative pulmonary complications. Preoperative testing can identify patients who may have an increased risk of pulmonary complications after surgery.6 Sometimes the risk of complications can be reduced by preoperative respiratory care, and sometimes the risk may be significant enough to rule out surgery.
• To determine pulmonary disability.7 Pulmonary function tests can also determine the degree of disability caused by lung diseases, including occupational diseases such as pneumoconiosis of coal workers. Some federal entitlement programs and insurance policies rely on pulmonary function tests to confirm claims for financial compensation.
There are also contraindications to pulmonary function testing.4 Patients with acute, unstable cardiopulmonary problems, such as hemoptysis, pneumothorax, myocardial infarction, and pulmonary embolism, and patients with acute chest or abdominal pain should not be tested. Testing could be harmful if needed treatment would be delayed. Patients who have nausea and who are vomiting should not be tested because there is a risk of aspiration. Testing for patients who have had recent cataract removal surgery should be delayed because changes in ocular pressure may be harmful to the eye. Pulmonary function testing requires patient effort and cooperation. Patients with dementia or confusion may not achieve optimal or repeatable results. Pulmonary function testing should not be performed if valid and reliable results cannot be predicted. In patients who are acutely ill or who have recently smoked a cigarette, the test validity of measuring the forced vital capacity (FVC) may be hindered.
Pathophysiologic Patterns
Pulmonary function testing provides the basis for classifying pulmonary diseases into two major categories, obstructive pulmonary disease and restrictive pulmonary disease. These two types of lung diseases sometimes occur together as a mixed impairment. Obstructive and restrictive types of lung diseases differ in several important ways. Figure 19-1 shows normal lungs with the pathophysiologic aspects of obstructive lung diseases and restrictive lung diseases, and the differences are summarized in Table 19-1. The primary problem in obstructive pulmonary disease is an increased airway resistance (Raw). Raw is the difference in pressure between the ends of the airways divided by the flow rate of gas moving through the airway, according to the following formula: Raw = ΔP/.
TABLE 19-1
Comparison of Obstructive and Restrictive Types of Pulmonary Diseases
| Characteristic | Obstructive Disease | Restrictive Disease |
| Anatomy affected | Airways | Lung parenchyma, thoracic pump |
| Breathing phase difficulty | Expiration | Inspiration |
| Pathophysiology | Increased airway resistance | Decreased lung or thoracic compliance |
| Useful measurements | Flow rates | Volumes or capacities |
There is an inverse relationship between Raw and flow rates (). If the pressure difference is constant, a reduced flow rate indicates an increase in Raw. Because the radius of the airways normally lessens slightly during expiration, flow rates are usually measured during expiration. By rearranging the symbols in Poiseuille’s law (see Chapter 6), Raw is inversely related to the radius of the airways according to the following formula: Raw = ΔP/ = η8l/r4.
< ?xml:namespace prefix = "mml" />
Determining if the patient’s value is within 1 or 2 standard deviations of the predicted normal value is an alternative method used in some laboratories. The predicted percentage or the number of standard deviations from the predicted normal value can be used to quantify severity of impairment. Typical degrees of severity are listed in Table 19-2.
TABLE 19-2
Severity of Pulmonary Impairments Based on a Percentage of Predicted Normal Values
| Degree of Impairment | Obstruction based on FEV1 | Restriction or Obstruction Based on TLC, FRC, RV | Gas Exchange Based on DLCO |
| Normal | 80%-120% | 80%-120% | 80%-120% |
| Mild | 70%-79% | 70%-79% or 121%-130% | 61%-79% |
| Moderate | 60%-69% | 60%-69% or 131%-140% | 40%-60% |
| Moderately severe | 50%-59% | 50%-59% or 141%-150% | |
| Severe | 35%-49% | 35%-49% or 151%-165% | <40% |
| Very severe | <35% | <35% or >165% |
Infection Control
Pulmonary function testing is considered safe, but there is potential to transmit infective microorganisms to patients and technologists.8 Transmission can occur by direct or indirect contact. Standard precautions should be applied because of the potential exposure to saliva or mucus, which could possibly contain blood or other potentially hazardous microorganisms. Patients with oral lesions pose the greatest potential hazard, and patients with compromised immune systems are at the greatest risk. Practitioners should wear gloves when handling potentially contaminated mouthpieces, valves, tubing, and equipment surfaces. When performing procedures on patients with potentially infectious airborne diseases, practitioners should wear a personal respirator or a close-fitting surgical mask, especially if the testing induces coughing. Practitioners should always wash their hands between testing patients and after contact with testing equipment. Although it is unnecessary to clean the interior surfaces of the testing instruments routinely between patients,9 the mouthpiece, nose clips, tubing, and any parts of the instrument that come into direct contact with a patient should be disposed, sterilized, or disinfected between patients. Any equipment surface showing visible condensation from exhaled air should be discarded, disinfected, or sterilized before reuse. When testing instruments are disassembled for cleaning and disinfecting, manufacturer recommendations should be considered, and recalibration may be necessary before testing resumes. The routine use of low-resistance, in-line barrier filters is controversial.10–12 Filters may be appropriate when internal surfaces of manifolds and valves proximal to mouthpieces are inaccessible or difficult to disassemble for cleaning and disinfecting. Filters provide visible evidence to reassure patients that their protection has been considered.
Equipment
Flow-measuring devices are commonly called pneumotachometers, although some practitioners reserve this term for only the device originally designed by Fleisch. These devices measure flow using a variety of unique principles. The Fleisch-type pneumotachometer measures the change in pressure as gas flows through a minimal, constant resistance according to the formula: = ΔP ÷ R. Different manufacturers have used several materials to provide the resistance, including screens, capillary tubes, and fiber sheets made of silk, nylon, or filter paper. With multiple uses, condensation from exhaled air can collect in these devices and alter the resistance and accuracy of the device; some devices are heated to body temperature to prevent condensation. Known as thermistors or mass flowmeters, another type of flow-measuring device measures the temperature change created by gas flowing through it. There are also tubinometers, which use rotation of a fan or blades similar to a windmill. The number of rotations indicates volume, and the speed of the rotations indicates flow. How gas flow affects the transmission of sound waves and the force of flow stretching a spring have also been used to measure flow. Detailed descriptions and examples of each type of device are beyond the scope of this chapter and are available elsewhere.13
Regardless of the type of device or the principle of measurement used, several important characteristics are common to all volume-measuring and flow-measuring devices. Having an understanding of these common characteristics provides RTs the ability to select and use these devices properly. Every measuring instrument has capacity, accuracy, error, resolution, precision, linearity, and output.14,15 The ideal instrument would have unlimited capacity to measure every pulmonary parameter, and it would have perfect accuracy and precision over its entire measurement range; there are no ideal instruments.
The capacity of an instrument refers to the range or limits of how much it can measure. Most instruments are designed with capacities to measure volumes and flow rates of all adults. The accuracy of a measuring instrument is how well it measures a known reference value. For volume measurements, standard reference values are provided by a graduated 3.0-L calibration syringe.16 No measuring instrument is perfect, and there usually is an arithmetic difference between reference values and measured values. This difference is called the error. Accuracy and error are opposing terms; the greater the accuracy, the smaller is the error. Accuracy and error are commonly expressed as percentages, with their sum always equaling 100%. To determine percent accuracy and percent error, several reference values are measured, and the mean of the measured values is computed and compared with the reference values according to the following equations:
In 1978, the American Thoracic Society (ATS) adopted the initial standards for diagnostic spirometers. These standards have been adopted by other medical organizations and government agencies. Updated most recently in 2005 in collaboration with the European Respiratory Society (ERS), the standards are now recognized internationally as the standards for the industry.17 Some instruments have been independently evaluated against the standards or compared with instruments that meet those standards. Regardless of the measuring principle used by the instrument or the purpose of the patient testing, RTs should use only devices that meet or exceed current ATS/ERS performance standards. According to the ATS/ERS standards, when measuring a slow VC, the spirometer should be able to measure for up to 30 seconds, and for the FVC, the time capacity should be at least 15 seconds. When measuring the VC, FVC, and forced expiratory volumes, a volume-measuring spirometer should have a capacity of at least 8 L and should measure volumes with less than a 3% error or within 50 ml of a reference value, whichever is greater. These standards, including the 8-L standard for capacity, also apply to children. A diagnostic spirometer that measures flow should be at least 95% accurate (or within 0.2 L/sec, whichever is greater) over the entire 0 to 14 L/sec range of gas flow. The standards are summarized in Table 19-3.
TABLE 19-3
| Test | Volume (L) | Flow (L/sec) | Accuracy | Time (sec) | Back Pressure (cm H2O/L/sec) |
| VC | 0.5-8 L | 0-14 | ≤3% or 0.05 L* | 30 | |
| FVC | 0.5-8 L | 0-14 | ≤3% or 0.05 L* | 15 | <1.5%scm H2O/L/sec at 14 L/sec |
| FEV1 | 0.5-8 L | 0-14 | ≤3% or 0.05 L* | 1 | <1.5%scm H2O/L/sec at 14 L/sec |
| PEF | 0-14 | ≤10% or 0.3 L/sec* | <1.5%scm H2O/L/sec at 14 L/sec | ||
| FEF | ±14 | ≤5% or 0.2 L/sec* | <1.5%scm H2O/L/sec at 14 L/sec | ||
| MVV | 250 L/min at 2 L/breath | ±10% or 15 L/min* | 12-15 | <1.5%scm H2O/L/sec at 14 L/sec |
From Miller MR, Hankinson J, Brusasco V, et al: Standardisation of spirometry. Eur Respir J 26:319–338, 2005.
Principles of Measurement and Significance
In most pulmonary function laboratories, there are three components to pulmonary function testing: (1) performing spirometry for measuring airway mechanics, (2) measuring lung volumes and capacities, and (3) measuring the diffusing capacity of the lung (DL). For each component, there are various techniques and different types of equipment that make the measurements. When the purpose of the testing is to identify the presence and the degree of pulmonary impairment and the type of pulmonary disease, all three testing components are required. When the purpose of the testing is more limited, such as to assess postoperative pulmonary risk or to evaluate and quantify therapeutic effectiveness, the scope of measurement also is limited. Many pulmonary function laboratories also perform arterial blood gas analysis (see Chapter 18), and some laboratories provide more specialized and advanced tests, such as bronchial challenge tests and exercise stress tests.
Spirometry
Spirometry includes the tests of pulmonary mechanics—the measurements of FVC, FEV1, several FEF values, forced inspiratory flow rates, and MVV. Measuring pulmonary mechanics is assessing the ability of the lungs to move large volumes of air quickly through the airways to identify airway obstruction. Some measurements are aimed at large intrathoracic airways, some are aimed at small airways, and some assess obstruction throughout the lungs. Measuring flow rates is a surrogate for measuring airways resistance according to the formula: Raw = ΔP ÷ . A decrease in flow rate signifies an increase in airways resistance and the presence of airway obstruction when patient effort creating the difference between mouth pressure and lung pressure is constant (see Clinical Practice Guideline 19-1).17
Although performing tests of pulmonary mechanics is considered safe, some adverse reactions have occurred, including pneumothorax,18 syncope, chest pain, paroxysmal coughing, and bronchospasm associated with exercise-induced asthma.19 The contraindications for pulmonary function testing are primarily for testing mechanics. The ATS/ERS 2005 standards for spirometry17 specify the validity and reliability criteria of the measurements and accuracy and precision limits of the measuring equipment. These standards have been incorporated into the clinical practice guidelines of the AARC, medical societies, and government agencies.4,20–22
Forced Vital Capacity
FVC is the most commonly performed test of pulmonary mechanics, and many measurements are made while the patient is performing the FVC maneuver (Figure 19-2). Measuring FVC often occurs under baseline or untreated conditions. For baseline testing, patients should temporarily abstain from bronchodilator medications. Short-acting bronchodilators (e.g., β-agonist albuterol, anticholinergic agent ipratropium bromide) should not be used for 4 hours before baseline spirometry, whereas long-acting β-agonist bronchodilators and oral therapy with aminophylline should be stopped for 12 hours. When a patient’s baseline results show airway obstruction, performing FVC after treatment (e.g., albuterol bronchodilator aerosol or metered dose inhaler) can help determine if the treatment is effective. The FVC maneuver is also performed repeatedly during bronchial provocation testing.
FVC may be measured on a spirometer that measures volumes or flows, that presents a graph of volume and time or flow and volume, that is mechanical or electronic, and that has a calculator or computer. The forced expiratory VC sometimes is followed by a forced inspiratory VC to produce a complete image of forced breathing called a flow-volume loop.23
To ensure validity, each patient must perform a minimum of three acceptable FVC maneuvers. To ensure reliability, the largest FVC and second largest FVC from the acceptable trials should not vary by more than 0.150 L. To perform an FVC trial, the patient should inhale rapidly and completely to TLC from the resting FRC level. The forced exhalation of an acceptable FVC trial should begin abruptly and without hesitation. A satisfactory start of expiration is defined as an extrapolated volume at the zero time point less than 5% of FVC or 0.150 L, whichever is greater (Figure 19-3). The volume exhaled before the zero time point is called the extrapolated volume. To be valid, no more than 5% of the VC or 0.150 L is allowed to be exhaled before the zero time point. An acceptable FVC trial also is smooth, continuous, and complete. A cough, an inspiration, a Valsalva maneuver, a leak, or an obstructed mouthpiece while an FVC maneuver is being performed disqualifies the trial. FVC must be completely exhaled or an exhalation time of at least 6 seconds must occur for adults and children older than 10 years (longer times are commonly needed for patients with airway obstruction). A 3-second exhalation is acceptable for children younger than 10 years old. An end expiratory plateau must be obvious in the volume-time curve; the objective standard is less than 0.025 L exhaled during the final second of exhalation. Consistent with its definition, the largest acceptable FVC (BTPS) measured from the set of three acceptable trials is the patient’s FVC.
Forced Expiratory Volume in 1 Second
During FVC testing, several other measurements are also made. FEV1 is a measurement of the volume exhaled in the first second of FVC (see Figure 19-2, A). To ensure validity of FEV1, the measurement must originate from a set of three acceptable FVC trials. The first second of forced exhalation begins at the zero time point (see Figure 19-3). To ensure reliability of FEV1, the largest FEV1 and second largest FEV1 from the acceptable trials should not vary by more than 0.150 L. Consistent with its definition, the largest FEV1 (BTPS) measured is the patient’s FEV1. The largest FEV1 sometimes comes from a different trial than the largest FVC.
Forced Expiratory Flow Between 200 ml and 1200 ml of Forced Vital Capacity and Forced Expiratory Flow Between 25% and 75% of Forced Vital Capacity
FEF200-1200 and FEF25%-75% represent average flow rates that occur during specific intervals of FVC. Both measurements can be made on a volume-time spirogram as the slope of a line connecting the two points in their subscripts. For FEF200-1200, the 200-ml point and the 1200-ml point are identified. A straight line is drawn connecting these points, and the line is extended to intersect two vertical time lines 1 second apart on the graph (Figure 19-4). The volume of air measured between the two time lines is FEF200-1200 in liters per second. The volume measured must be corrected to BTPS.
FEF25%-75% is a measure of the flow during the middle portion of FVC, or the time necessary to exhale the middle 50%. For FEF25%-75%, the VC of the best curve is multiplied by 25% and 75%, and the points are identified on the tracing. A straight line is drawn connecting these points, and the line is extended to intersect two vertical time lines 1 second apart on the graph. The volume of air measured between the two time lines is FEF25%-75% in liters per second. The volume measured must be corrected to BTPS (Figure 19-5).
Peak Expiratory Flow
PEF is difficult to identify on a volume-time graph of FVC. The peak flow is the slope of the tangent to the steepest portion of the FVC curve. PEF is easy to identify on a flow-volume graph as the highest point on the graph (see Figure 19-2, B).23 PEF is sometimes measured independently of FVC with a peak flowmeter. These devices are designed to indicate only the greatest expiratory flow rate. The validity of PEF rate is based on a preceding inspiration to TLC and a maximal effort. The FVC principles of ensuring reliability should apply to measurements of PEF rate. The two largest repeated measurements should agree within 5%.
In addition to PEF rate, the other instantaneous flow rates, such as forced expiratory flow at 25% (FEF25%) of FVC, forced expiratory flow at 50% (FEF50%) of FVC, and forced expiratory flow at 75% (FEF75%) of FVC, during FVC are graphed on a flow-volume curve. When FVC is followed by a forced inspiratory VC, a flow-volume loop is produced (see Figure 19-2, B). On the flow-volume loop, the maximal forced inspiratory flow rate at 50% (FIF50%) of VC can be measured and compared with FEF50%.
Maximal Voluntary Ventilation
Another measurement of pulmonary mechanics is MVV. MVV is another effort-dependent test for which the patient is asked to breathe as deeply and as rapidly as possible for at least 12 seconds. MVV is a test that reflects patient cooperation and effort, the ability of the diaphragm and thoracic muscles to expand the thorax and lungs, and airway patency. Because of the potential for acute hyperventilation and fainting or coughing, the patient should be seated. Measuring systems that incorporate rebreathing may minimize hyperventilation. After a demonstration of the expected breathing pattern is performed, the patient should be instructed to breathe as rapidly and as deeply as possible for at least 12 seconds. The patient’s breathing is measured on a spirogram (Figure 19-6) or electronically for the specific number of seconds (t) and the volume (V) breathed when the MVV is converted to liters per minute. As with all volumes measured on a spirometer, the recorded values should be in BTPS conditions. The validity of MVV depends on the duration of the maneuver, which should be at least 12 seconds; the breathing frequency, which should be at least 90/min; and the average volume, which should be at least 50% of FVC. Patients should perform at least two MVV trials when the first trial does not exceed 80% of the subject’s FEV1 × 40, which may indicate less than maximal effort, or 80% of the predicted normal value, which may indicate disease. Reliability is shown when there is less than 20% variability between the two largest trials. The largest MVV (BTPS) should be reported.
