[level-membership-for-critical-care-medicine-category]
Pulmonary Diagnostic Procedures
Laboratory Studies
Arterial Blood Gases
Interpretation of arterial blood gas (ABG) levels can be difficult, especially if the nurse is under pressure to do it quickly and accurately. One method that can help ensure accuracy when analyzing ABG levels is to follow the same steps of interpretation each time. A specific method to be used each time that blood gas values must be interpreted is presented here (Box 19-1).
Steps for Interpretation of Blood Gas Levels
Step 1.
Look at the Pao2 level, and answer this question: Does the Pao2 show hypoxemia? The Pao2 is a measure of the partial pressure (P) of oxygen dissolved in arterial (a) blood plasma. Sometimes, Pao2 is shortened to Po2. It is reported in millimeters of mercury (mm Hg). Pao2 reflects 3% of total oxygen in the blood.1
The normal range of Pao2 values for persons breathing room air at sea level is 80 to 100 mm Hg. However, the normal range is age dependent for infants and for persons 60 years old or older. The normal level for infants breathing room air is between 50 and 70 mm Hg.2 The normal level for persons 60 years old or older decreases with age as changes occur in the ventilation/perfusion (V/Q) matching in the aging lung.1,3 The correct Pao2 for older persons can be ascertained as follows: 80 mm Hg (the lowest normal value) minus 1 mm Hg for every year of age above 60 years. Using this formula, a 65-year-old individual can have a Pao2 as low as 75 mm Hg (80 mm Hg − 5 mm Hg = 75 mm Hg) and still be within the normal range. An acceptable range for an 80-year-old person (20 years older than 60 years) is 60 mm Hg (80 mm Hg − 20 mm Hg = 60 mm Hg).
At any age, a Pao2 lower than 40 mm Hg represents a life-threatening situation that necessitates immediate action.1 A Pao2 value less than the predicted lowest value indicates hypoxemia, which means that a lower-than-normal amount of oxygen is dissolved in plasma.1
Step 2.
Look at the pH level, and answer this question: Is the pH on the acid or alkaline side of 7.40? The pH is the hydrogen ion (H+) concentration of plasma. Calculation of pH is accomplished by using the partial pressure of carbon dioxide (Paco2) and the plasma bicarbonate level (HCO3−). The formula used is the Henderson-Hasselbalch equation (see Appendix B).4
The normal pH of arterial blood is 7.35 to 7.45, and the mean is 7.40. If the pH level is less than 7.40, it is on the acid side of the mean. A pH level less than 7.35 is known as acidemia, and the overall condition is called acidosis. If the pH level is greater than 7.40, it is on the alkaline side of the mean. A pH level greater than 7.45 is known as alkalemia, and the overall condition is called alkalosis.1,4,5
Step 3.
Look at the Paco2 level, and answer this question: Does the Paco2 show respiratory acidosis, alkalosis, or normalcy? The Paco2 is a measure of the partial pressure of carbon dioxide dissolved in arterial blood plasma, and it is reported in millimeters of mercury (mm Hg). It is the acid–base component that reflects the effectiveness of ventilation in relation to the metabolic rate.4 In other words, the Paco2 value indicates whether the patient can ventilate well enough to rid the body of the carbon dioxide produced as a consequence of metabolism.
The normal range for Paco2 is 35 to 45 mm Hg. This range does not change as a person ages. A Paco2 value greater than 45 mm Hg defines respiratory acidosis, which is caused by alveolar hypoventilation. Hypoventilation can result from chronic obstructive pulmonary disease (COPD), oversedation, head trauma, anesthesia, drug overdose, neuromuscular disease, or hypoventilation with mechanical ventilation.6
Ventilatory failure results when the Paco2 level exceeds 50 mm Hg. Acute ventilatory failure occurs when the Paco2 level is greater than 50 mm Hg and the pH level is less than 7.30. It is referred to as acute because the pH is abnormal, not allowing enough time for the body to compensate by returning the pH to the normal range. Chronic ventilatory failure is defined as a Paco2 value greater than 50 mm Hg and a pH level greater than 7.30.1,7
A Paco2 value that is less than 35 mm Hg defines respiratory alkalosis, which is caused by alveolar hyperventilation. Hyperventilation can result from hypoxia, anxiety, pulmonary embolism, pregnancy, and hyperventilation with mechanical ventilation or as a compensatory mechanism for metabolic acidosis.4
Step 4.
Look at the HCO3− level, and answer this question: Does the HCO3− show metabolic acidosis, alkalosis, or normalcy? Bicarbonate (HCO3−) is the acid–base component that reflects kidney function. The bicarbonate level is reduced or increased in the plasma by renal mechanisms. The normal range is 22 to 26 mEq/L.4,5
A bicarbonate level of less than 22 mEq/L defines metabolic acidosis, which can result from ketoacidosis, lactic acidosis, renal failure, or diarrhea. The cumulative effect is a gain of acids or a loss of base. A bicarbonate level that is greater than 26 mEq/L defines metabolic alkalosis, which can result from fluid loss from the upper gastrointestinal tract (vomiting or nasogastric suction), diuretic therapy, severe hypokalemia, alkali administration, or steroid therapy.4,5,6
Step 5.
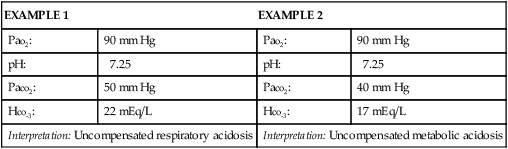
Look again at the pH level, and answer this question: Does the pH show a compensated or an uncompensated condition? If the pH level is abnormal (less than 7.35 or greater than 7.45), the Paco2 value or the HCO3− level, or both, will also be abnormal. This is an uncompensated condition because the body has not had enough time to return the pH to its normal range.4,5,6,8 Box 19-2 provides two examples of uncompensated ABGs. If the pH level is within normal limits and the Paco2 value and the HCO3− level are abnormal, the condition is compensated because the body has had enough time to restore the pH to within its normal range.4,5,6,8
Differentiating the primary disorder from the compensatory response can be difficult. The primary disorder is the abnormality that caused the pH level to shift initially. It is determined according to the pH level; the primary disorder is considered to be the one on whichever side of 7.40 the pH level occurs.4,8 Box 19-3 provides two examples of compensated ABGs. Partial compensation may be present and is evidenced by abnormal pH, Paco2, and HCO3− levels, indications that the body is attempting to return the pH to its normal range.4,8
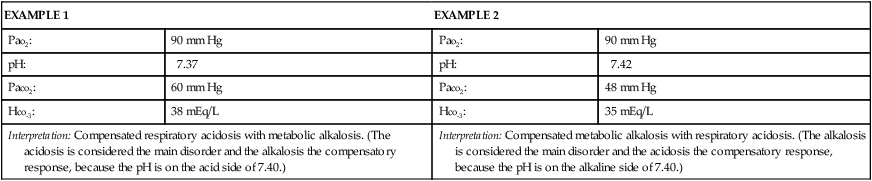
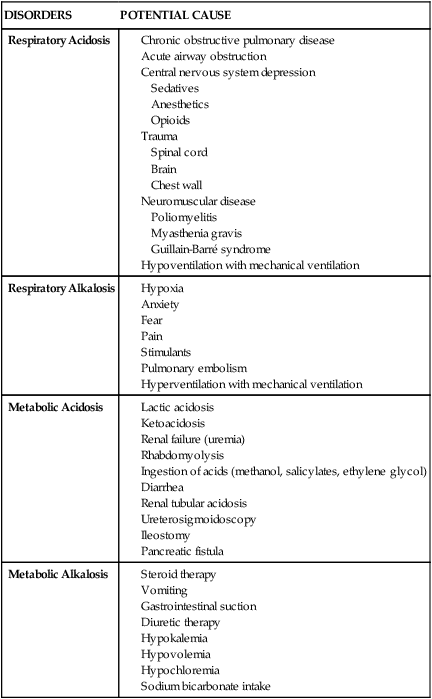
Table 19-1 summarizes the changes in the acid–base components that accompany various acid–base disorders.4,5,8 In addition to the parameters previously discussed, other factors must be considered when reviewing a patient’s ABGs, including oxygen saturation, oxygen content, base excess and deficit, and anion gap analysis. Table 19-2 summarizes conditions that may potentiate acid–base abnormalities.4,5,8
TABLE 19-1
| DISORDER | pH | Paco2 | HCO–3 |
| Respiratory Acidosis | |||
| Uncompensated | <7.35 | >45 mm Hg | 22-26 mEq/L |
| Partially compensated | <7.35 | >45 mm Hg | >26 mEq/L |
| Compensated | 7.35-7.39 | >45 mm Hg | >26 mEq/L |
| Respiratory Alkalosis | |||
| Uncompensated | >7.45 | <35 mm Hg | 22-26 mEq/L |
| Partially compensated | >7.45 | <35 mm Hg | <22 mEq/L |
| Compensated | 7.41-7.45 | <35 mm Hg | <22 mEq/L |
| Metabolic Acidosis | |||
| Uncompensated | <7.35 | 35-45 mm Hg | <22 mEq/L |
| Partially compensated | <7.35 | <35 mm Hg | <22 mEq/L |
| Compensated | 7.35-7.39 | <35 mm Hg | <22 mEq/L |
| Metabolic Alkalosis | |||
| Uncompensated | >7.45 | 35-45 mm Hg | >26 mEq/L |
| Partially compensated | >7.45 | >45 mm Hg | >26 mEq/L |
| Compensated | 7.41-7.45 | >45 mm Hg | >26 mEq/L |
| Combined (or mixed) respiratory and metabolic acidosis | <7.35 | >45 mm Hg | <22 mEq/L |
| Combined (or mixed) respiratory and metabolic alkalosis | >7.45 | <35 mm Hg | >26 mEq/L |
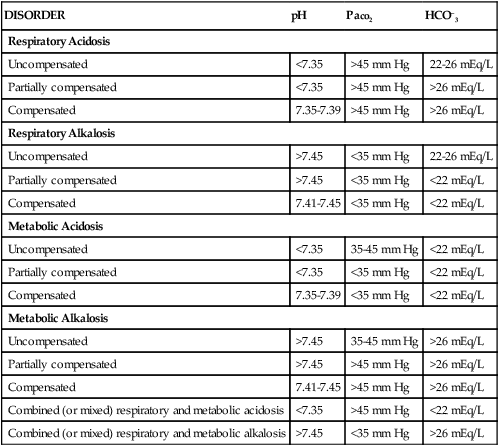
TABLE 19-2
| DISORDERS | POTENTIAL CAUSE |
| Respiratory Acidosis |
Oxygen Saturation
Oxygen saturation is a measure of the amount of oxygen bound to hemoglobin, compared with hemoglobin’s maximal capability for binding oxygen. It can be assessed as a component of the ABG (Sao2) or can be measured noninvasively using a pulse oximeter (Spo2).9,10 Oxygen saturation is reported as a percentage or as a decimal; normal values are greater than 95% when the patient is on room air. Normally, the saturation level cannot reach 100% (on room air) because of physiologic shunting.1 However, when supplemental oxygen is administered, oxygen saturation may approach 100% so closely that it is reported as 100%.
Proper evaluation of the oxygen saturation level is vital. For example, an Sao2 of 97% means that 97% of the available hemoglobin is bound with oxygen. The word available is essential to evaluating the Sao2 level, because the hemoglobin level is not always within normal limits and oxygen can bind only with what is available. A 97% saturation level associated with 10 g/dL of hemoglobin does not deliver as much oxygen to the tissues as does a 97% saturation level associated with 15 g/dL of hemoglobin. Assessing only the Sao2 level and finding it within normal limits does not ensure that the patient’s oxygenation status is normal. The hemoglobin level must also be evaluated before a decision on oxygenation status can be made.1,9,10
Oxygen Content
Oxygen content (Cao2) is a measure of the total amount of oxygen carried in the blood, including the amount dissolved in plasma (measured by the Pao2) and the amount bound to the hemoglobin molecule (measured by the Sao2). Cao2 is reported in milliliters of oxygen carried per 100 mL of blood. The normal value is 20 mL of oxygen per 100 mL of blood. To calculate the oxygen content, the Pao2, the Sao2, and the hemoglobin level are used (see Appendix B). A change in any one of these parameters will affect the Cao2.1
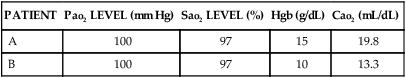
The value of assessing the Cao2 is best illustrated by the examples in Table 19-3. The ABG parameters that are used most commonly to evaluate oxygenation status (Pao2 and Sao2) are both normal. Assessing only the Pao2 and the Sao2 would lead to the invalid conclusion that Patient B’s oxygenation status is normal. However, consideration of the hemoglobin level and the Cao2 reveals that the oxygenation of Patient B’s blood is significantly abnormal.
TABLE 19-3
| PATIENT | Pao2 LEVEL (mm Hg) | Sao2 LEVEL (%) | Hgb (g/dL) | Cao2 (mL/dL) |
| A | 100 | 97 | 15 | 19.8 |
| B | 100 | 97 | 10 | 13.3 |
Base Excess and Base Deficit
Base excess and base deficit reflect the nonrespiratory contribution to acid–base balance and are reported in milliequivalents per liter (mEq/L) above or below the normal range of −2 mEq/L to +2 mEq/L. A negative base level is reported as a base deficit, which correlates with metabolic acidosis, whereas a positive base level is reported as a base excess, which correlates with metabolic alkalosis.1,4,8
Classic Shunt Equation and Oxygen Tension Indices
The efficiency of oxygenation can be assessed by measuring the degree of intrapulmonary shunting that occurs in a patient at any one time, using the classic shunt equation and oxygen tension indices. Intrapulmonary shunting (QS/QT [the portion of cardiac output not exchanging with alveolar blood divided by the total cardiac output]) refers to venous blood that flows to the lungs without being oxygenated because of nonfunctioning alveoli.1 Other names for this condition include shunt effect, low V/Q, wasted blood flow, and venous admixture.1,11,12
Direct determination of intrapulmonary shunting requires the use of the classic shunt equation (see Appendix B), which is invasive and cumbersome. A shunt greater than 10% is considered abnormal and indicative of a shunt-producing disorder. A shunt greater than 30% is a serious and potentially life-threatening condition, which requires pulmonary intervention.1,11,12
Often, intrapulmonary shunting is estimated by using the oxygen tension indices. One advantage to these methods is the ease of performance, although they have been found to be unreliable in critically ill patients.1,11 An estimate of intrapulmonary shunting can be determined by computing the difference between the alveolar and arterial oxygen concentrations. Normally, alveolar (a) and arterial (a) Po2 values are approximately equal. When they are not, it indicates that venous blood is passing malfunctioning alveoli and returning unoxygenated to the left side of the heart.1,11 The most common oxygen tension indices used to estimate intrapulmonary shunting are the Pao2/Fio2 ratio, the Pao2/Pao2 ratio, and the a-a gradient (P[a − a]o2).
PaO2/PAO2 Ratio
The Pao2/Pao2 ratio (arterial/alveolar O2 ratio) is normally greater than 60%. The disadvantage to using this formula is that it calls for the computation of the alveolar Po2 (see Appendix B), but the advantage is that it is unaffected by changes in the Fio2, as long as the underlying lung condition is stable.1,11
Alveolar-Arterial Gradient
The a-a gradient (P[a − a]o2) is normally less than 20 mm Hg on room air for patients younger than 61 years. This estimate of intrapulmonary shunting is the least reliable clinically, but it is used often in clinical decision making. One of the major disadvantages to using this formula is that it is greatly influenced by the amount of oxygen the patient is receiving.1,11–13
Serial determinations of the estimates of intrapulmonary shunting provide the practitioner with objective data on which to base clinical decisions.1,11,12 Table 19-4 shows the change in intrapulmonary shunting in the hypoxemic patient using the previously described oxygen tension indices to estimate severity of shunting.
TABLE 19-4
CALCULATION OF INTRAPULMONARY SHUNTING
| Fio2 | Pao2 LEVEL (mm Hg) | Pao2 LEVEL (mm Hg) | Pao2/Fio2 | a/A RATIO (%) | A-a GRADIENT (mm Hg) |
| 0.21 | 40 | 97 | 190 | 41 | 57 |
| 0.50 | 80 | 300 | 160 | 27 | 220 |
| 1.0 | 150 | 610 | 150 | 25 | 460 |
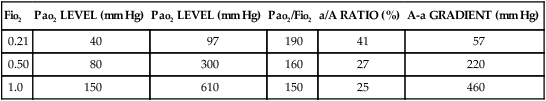
Modified from Murray JF, Nadel JA, eds. Textbook of Respiratory Medicine. Philadelphia: WB Saunders; 1988.
Dead Space Equation
The efficiency of ventilation can be measured using the clinical dead space (Vd/Vt) equation (see Appendix B). The formula measures the fraction of tidal volume not participating in gas exchange. A dead space value greater than 0.6 indicates a dead space-producing disorder and is considered abnormal. The major limitations to using this formula are that it requires the measurement of exhaled carbon dioxide to complete and that the work of breathing by patients must remain stable during the collection.12,14
Sputum Studies
Careful analysis of sputum specimens is crucial for the rapid identification and treatment of pulmonary infections. The most difficult aspect of sputum examination is proper collection of the specimen. Collection of a good sputum sample requires a conscious, cooperative, and sufficiently hydrated patient.12 When the patient has difficulty producing sputum, heated, nebulized saline may help to loosen secretions for expectoration.12 Chest physiotherapy combined with nebulization improves the success rate. Collection of a sputum specimen is best done in the morning, because a greater volume of secretions is present as a result of nighttime pooling. Brushing the teeth and rinsing the oropharyngeal airway is recommended to reduce contamination before collecting a sample.12,15
Many critically ill patients cannot cough effectively, and sputum collection by other means is required. These methods include tracheobronchial aspiration, transtracheal aspiration, and the use of a fiberoptic bronchoscopy with a protected brush catheter. Because each method has its own benefits and risks, the patient’s clinical condition determines the appropriate technique.12
Many critically ill patients have endotracheal or tracheostomy tubes already in place. Collecting sputum specimens from these patients requires special attention to technique (Box 19-4). Deep specimens are obtained to avoid collecting specimens that contain resident upper airway flora that may have migrated down the tube. Colonization of the lower airways with upper airway flora can occur within 48 hours of intubation.16
Box 19-4 Procedure for Collection of Tracheal or Endotracheal Sputum Specimen
1. Clear the endotracheal or tracheostomy tube of all local secretions, avoiding deep airway penetration.
2. Attach a sputum trap to a sterile suction catheter, and advance the catheter into the trachea while trying to avoid contact with the endotracheal tube or tracheostomy tube (Fig. 19-1).
3. After the catheter is fully advanced, apply suction until secretions return to the sputum trap. When enough secretions are collected, discontinue suctioning, and remove the catheter.
4. Do not apply suction while the catheter is being withdrawn, because this can contaminate the sample with sputum from the upper airway. Do not flush the catheter with sterile water, because this dilutes the sample.
5. If the catheter becomes plugged with secretions, place it in a sterile container, and send it to the laboratory. The specimen must be transported immediately or refrigerated if a delay is necessary.
After a sputum specimen is obtained, it is examined for volume, physical properties, mucopurulence, and color. Next, a microscopic examination is done to identify the source of the specimen. If a bacterial infection is suspected, a Gram stain is performed, followed by culture and sensitivity (C&S) assessments.12,15,16
Diagnostic Procedures
Bronchoscopy
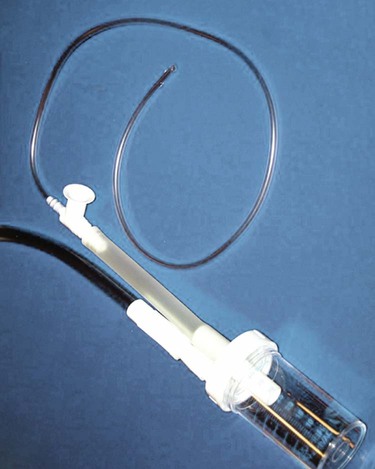
Fiberoptic bronchoscopy is a relatively safe procedure done at the bedside, and it is most often used as a diagnostic and therapeutic tool (Fig. 19-2). Diagnostic indications include hemoptysis, infectious pneumonia, difficult intubation, pulmonary injury after chest trauma, acute burn inhalation injury, aspiration lung injuries, and acute upper airway obstruction. Therapeutic indications include the aspiration of foreign bodies, removal of obstructing secretions, atelectasis, difficult intubation, and resection of small, benign growths from the airway.12,17,18
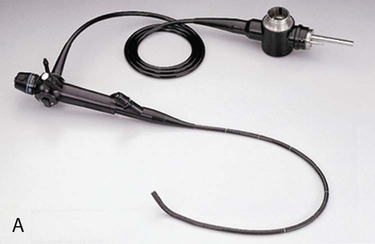
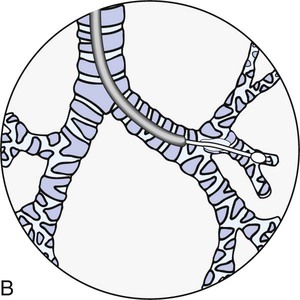
A, The transbronchoscopic balloon-tipped catheter and the flexible fiberoptic bronchoscope. B, The catheter is introduced into a small airway and the balloon is inflated with 1.5 to 2 mL of air to occlude the airway. Bronchial alveolar lavage is performed by injecting and withdrawing 30-mL aliquots of sterile saline solution, gently aspirating after each instillation. Specimens are sent to the laboratory for analysis. (From Christensen BL, Kockrow EO, eds. Adult Health Nursing. 6th ed. St. Louis: Mosby; 2011.)
Before the bronchoscopy, a complete medical history is obtained, and a thorough examination, including a chest x-ray examination, is performed.12,17 Preprocedural evaluation of the patient includes clotting studies (prothrombin time [PT], partial thromboplastin time [PTT], and platelet count) and evaluation of the ABG levels.12,17 Hypoxemic patients need supplemental oxygen during the procedure. The patient must have no oral intake for 6 to 8 hours before the bronchoscopy to reduce the risk of aspiration.12,17
Although a topical anesthetic can be used alone, it is usually supplemented by an intravenous sedative or analgesic, or both. A benzodiazepine for sedative effects and a opioid analgesic are administered intravenously during the procedure.12,17,18 Preprocedural medications for a diagnostic bronchoscopy may include atropine and intramuscular codeine. Atropine lessens the vasovagal response and reduces the secretions, whereas codeine decreases the cough reflex. When bronchoscopy is performed therapeutically to remove secretions, the patient has decreased cough and gag reflexes, which may impair secretion clearance.12,17,18 Maintenance of the airway is essential to prevent complications.
Complications of the procedure may be related to the procedure itself, the anesthetic, or an ancillary procedure. Minor complications include laryngospasm, bronchospasm, epistaxis, fever, vomiting, altered pulmonary mechanics, and hemodynamic instability. Major complications include anaphylaxis, infection, hypotension, cardiac dysrhythmias, pneumothorax, hemorrhage, respiratory failure, hypoxemia, and cardiopulmonary arrest.12,17,18
Thoracentesis
Thoracentesis is a simple, usually uncomplicated procedure done at the bedside for the removal of fluid or air from the pleural space (Fig. 19-3). It is used most often as a diagnostic measure; it may also be performed therapeutically for the drainage of a pleural effusion or empyema.19,20 No absolute contraindications to thoracentesis exist, although there are some risks that may contraindicate the procedure in all but emergency situations. These risk factors include unstable hemodynamics, coagulation defects, mechanical ventilation, the presence of an intraaortic balloon pump, and patients who are uncooperative. In most clinical situations, diagnostic thoracentesis can be delayed until these risk factors are eliminated.19
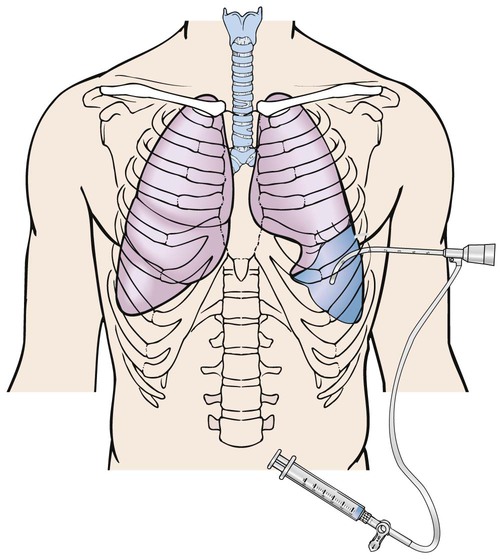
The needle has penetrated the fluid-filled pleural space to remove fluid. (From Christensen BL, Kockrow EO, eds. Adult Health Nursing. 6th ed. St. Louis: Mosby; 2011.)
The patient is placed in a sitting position with legs over the side of the bed and with hands and arms supported on a padded overbed table. If the patient’s condition precludes sitting, the side-lying position with the back flush with the edge of the bed and the affected side down can be used.19,20,21 The patient is cautioned not to move or cough during the procedure.21 During the thoracentesis, the site of the needle insertion is usually determined by previous chest x-ray examination, computed tomography (CT) scan, or chest percussion. A local anesthetic is used to minimize the patient’s discomfort during insertion of the thoracentesis needle.9
Complications associated with thoracentesis include pain, pneumothorax, and re-expansion pulmonary edema. Pneumothorax can occur as a result of introduction of air into the pleural space, puncture of the lung, or rupture of the visceral pleura.19,20,21 Re-expansion pulmonary edema can occur when a large amount of effusion fluid (approximately 1000 to 1500 mL) is removed from the pleural space. Removal of the fluid increases the negative intrapleural pressure, which can lead to edema when the lung does not reexpand to fill the space. The patient experiences severe coughing and shortness of breath. The onset of these symptoms is an indication to discontinue the thoracentesis.21
Bedside Pulmonary Function Tests
Pulmonary function tests (PFTs) are designed to quantify respiratory function and are an essential component of a thorough pulmonary evaluation. PFTs are used for a variety of purposes, including preoperative assessment, evaluating lung mechanics, diagnosing and tracking pulmonary diseases, and monitoring therapy. Results are individualized according to age, gender, and body size.22
Measurement of lung volumes and capacities (Box 19-5) provides valuable information about the origin of a disease process. Four lung volumes and four lung capacities can be measured. Measurement of volumes at the bedside is limited to tidal volume and vital capacity. A vital capacity of 10 to 15 mL/kg usually is a minimally accepted value for weaning, with a respiratory rate of less than 24 breaths/min.12,22,23
Assessment of the mechanics of breathing includes measurement of the flow of gas, lung and chest compliance, respiratory muscle strength, and tissue resistance. In the critical care area, dynamic and static compliance are measured at the bedside. Compliance is a measure of the distensibility of the lungs (how easily they are inflated). Dynamic compliance is measured during the breathing cycle. A value of 46 to 66 mL/cm H2O is normal (see Appendix B). Measurement of dynamic compliance does not differentiate among resistance forces. Conditions that increase resistance therefore alter the dynamic compliance value. Dynamic compliance decreases with any decrease in lung compliance or increase in airway resistance, as occurs with bronchospasm and retained secretions. Static compliance is measured under no-flow conditions so that resistance forces are removed. Static compliance decreases with any decrease in lung compliance, as occurs with pneumothorax, atelectasis, pneumonia, pulmonary edema, and chest wall restrictions. A normal range is 57 to 85 mL/cm H2O (see Appendix B).12,22
Assessment of inspiratory muscle strength can be evaluated through the measurement of maximal inspiratory pressure (MIP) and negative inspiratory pressure (NIP). Both should be more negative than −20 to −25 cm H2O. Other names for these tests are negative inspiratory effort (NIE), peak inspiratory pressure (PIP), and peak inspiratory force (PIF). Assessing the MIP and NIP requires a cooperative patient, and the values can provide useful information about spontaneous breathing ability. Maximal expiratory pressure (MEP) can be measured to test the ability to cough in patients with neuromuscular dysfunction. Other common methods used to assess respiratory muscle strength are maximum voluntary ventilation (MVV), minute ventilation Ve and breathing pattern.12,22
Dynamic PFTs are designed to evaluate the function of the respiratory muscles, thorax, and lungs. These tests are timed breathing studies that evaluate the degree of respiratory impairment and include forced vital capacity (FVC), peak expiratory flow rate (PEFR), forced expiratory volume in 1 second (FEV1), and forced expiratory volume divided by the forced vital capacity (FEV1/FVC). Forced expiratory flow (FEF25%–75%) is the mean rate of airflow over the middle half of the FVC, and it is a good index of airway resistance. When these studies are performed at the bedside, they require the use of spirometry for volume measurement. The tests can be performed with intubated or nonintubated patients. In the intubated patient, the spirometer is attached to the end of the endotracheal tube. In the nonintubated patient, a nose clip is placed on the patient, and the patient is instructed to breathe through a spirometer tube. The patient is seated on the side of the bed if possible.12,22,23 Table 19-5 provides a description of each of these parameters.
TABLE 19-5
BEDSIDE PULMONARY FUNCTION TESTS
| TEST | DESCRIPTION |
| Respiratory rate (f) | Number of breaths per minute |
| Tidal volume (Vt) | Volume of air exhaled after a normal resting inhalation |
| Minute ventilation Ve | Volume of air expired per minute (tidal volume respiratory rate = minute ventilation) |
| Maximal voluntary ventilation (MVV) | Maximal amount of air that can be moved into and out of the lungs in 1 minute |
| Forced vital capacity (FVC) | Maximal amount of air that can be forcefully exhaled from the lungs after maximal inhalation |
| Maximal inspiratory pressure (MIP) | Maximal negative pressure generated on inhalation |
| Maximal expiratory pressure (MEP) | Maximal positive pressure generated on exhalation |
| Peak expiratory flow rate (PEFR) | Maximal flow rate achieved during forced exhalation |
| Forced expiratory flow at midpoint of vital capacity (FEF25%–75%) | Measure of the average flow rate during the middle 50% of exhalation |
| Forced expiratory flow at 1 second (FEV1) | Volume of air exhaled during the first second of forced exhalation |
Ventilation/Perfusion Scanning
Ventilation/perfusion (V/Q) scanning is indicated when a serious alteration of the normal V/Q relationship is suspected. V/Q studies are ordered most often to diagnose and follow a suspected pulmonary embolus. V/Q scanning is approximately 90% accurate in determining this diagnosis. Comparing the perfusion scan with the results of a clinical examination may improve this percentage somewhat.24
The V/Q scan consists of a ventilation scan and a perfusion scan. The ventilation scan is performed by having the patient inhale a radiolabeled gas and air mixture through a mask. The perfusion scan is performed by intravenously injecting the patient with a radioisotope. Scintillation cameras record the gamma radiation images produced by the isotope as it is breathed or perfused into the lung. When an obstruction of the isotope’s flow into an area of the lung occurs, the diminished radioactivity is reflected in the camera image of that zone.24
Because the results are less than 100% accurate in predicting pulmonary emboli, most V/Q scans are interpreted in one of four ways. The scan is interpreted as normal when the perfusion scan is normal, and the probability of pulmonary embolism approaches zero. A low probability interpretation is given when there are small V/Q mismatches, focal V/Q matches with no corresponding radiographic abnormalities, or the perfusion defects are considerably smaller than the radiographic abnormalities. This finding is associated with a 12% chance of pulmonary embolus.24,25 An intermediate or indeterminate probability is assigned when there are severe diffuse airflow obstructions, perfusion defects corresponding in size and position to radiographic abnormalities, and a single, moderate V/Q mismatch without a corresponding radiographic abnormality. A high probability interpretation is used when the perfusion defects are substantially larger than the radiographic abnormalities or when there is one or more large or two or more moderate V/Q mismatches with no corresponding radiographic abnormalities. This finding is seen infrequently but has a highly predictive value.24,25,26
Chest Radiography
Chest radiography is an important diagnostic procedure for any critically ill patient. Chest x-ray examinations aid in the diagnosis of various disorders and complications and assist in the evaluation of treatment.27
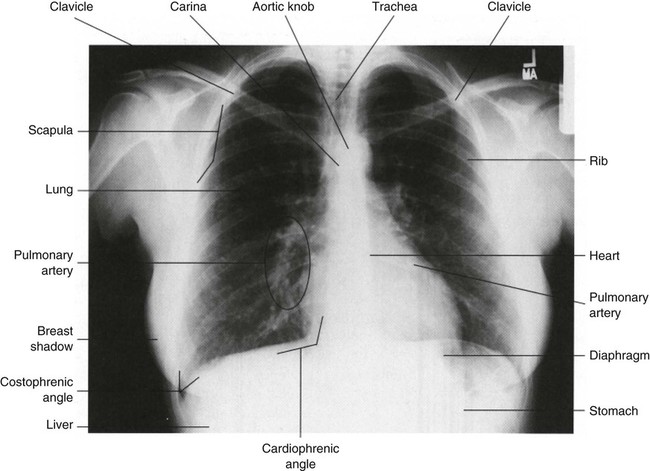
When interpreting a chest radiograph, a systematic method is used for viewing it (Box 19-6). Areas of the radiographic film that are assessed include bones, mediastinum, diaphragm, pleural space, and lung tissue. Fig. 19-4 provides an example of a normal chest radiograph.
Bones
The clavicles, ribs, thoracic and cervical spine, and scapulas are assessed. The clavicles should be symmetric, and the ribs should be an equal distance apart. Intervertebral disk spaces should be evident, indicating an adequately exposed inspiratory film.27 The thoracic and cervical spine should be straight, without signs of curvature. The scapulas usually appear as areas of added density in the upper lung fields. There should be no evidence of fractures, calcification and lesions (increased density), or demineralization (decreased density).27,28
Mediastinum
The structures assessed in the mediastinal area are the aortic knob and the trachea. The trachea should be positioned in the midline, with a slight deviation to the right as it approaches the carina.27 Shifting of the mediastinal structures can occur with atelectasis and removal of all or a portion of a lung (toward the area of involvement), pneumothorax (away from the area of involvement), pleural effusion, and tumors.27,28
Diaphragm
The diaphragm should be clearly visible, with sharp costophrenic angles seen where the chest wall and the tapered edges of the diaphragm meet.27,28 The level of the diaphragm (on deep inspiration) should appear at the 10th or 11th rib,27,28 with the right side 1 to 2 cm higher than the left side.27 A gastric air bubble may be found under the left side of the diaphragm.27,28 An elevated diaphragm may be seen in pregnancy, obesity, conditions that cause air or fluid to accumulate in the peritoneal space, and intestinal obstruction.27 An elevated hemidiaphragm is associated with several conditions, including phrenic nerve injury, previous chest surgery, subphrenic abscess, trauma, stroke, tumor, pneumonia, and radiation therapy.27 Flattening of the diaphragm can be a sign of increased air in the lungs, as occurs with chronic COPD or a pleural effusion.27,28 Obliteration or “blunting” of the costophrenic angle can occur with pleural effusion, atelectasis, or pneumothorax.27,28
Pleural Space
Identification of the pleural space on a chest radiograph is an abnormal finding. The pleural space is not visible unless air (pneumothorax) or fluid (pleural effusion) enters it. As fluid accumulates in the pleural space, it surrounds the lung and eventually compresses it. With a pleural effusion, blunting of the costophrenic angle may be evident first, with flattening of the diaphragm and obscuring of the heart borders occurring as the effusion grows.28 With a pneumothorax, the pleural edges become evident as the examiner looks through and between the images of the ribs on the film. A thin line appears just parallel to the chest wall, indicating where the lung markings have pulled away from the chest wall.27,28 The collapsed lung manifests as an area of increased density separated by an area of radiolucency (blackness).
Lung Tissue
The lung tissue is viewed for any areas of increased density or increased radiolucency that may indicate an abnormality. Increased density can be the result of accumulation of fluid in the lungs (e.g., water, pus, blood, edema fluid) or collapse of lung tissue (e.g., with atelectasis or pneumothorax). Increased radiolucency is caused by increased air in the lungs, as may occur with COPD.27,28 In some patients, a fine line may be present on the right side at about the level of the sixth rib in the midlung field. This is a normal finding and represents the horizontal fissure, which separates the right upper lobe from the right middle lobe.27,28
Tubes, Wires, and Lines
The chest radiograph is assessed for proper placement of all tubes, wires, and lines. When properly positioned, an endotracheal tube is 2 to 3 cm above the carina, and a nasogastric tube runs the length of the esophagus, with the tip in the stomach.27 The origin of a central venous catheter is observed as a thin, continuous, radiopaque line at the level of the jaw, progressing toward the superior vena cava in an internal jugular approach, whereas a subclavian approach originates in the clavicular area. A pulmonary artery catheter is viewed running through the right atrium and right ventricle into the pulmonary artery.27,28 Additional items that may be present include temporary or permanent pacing wires, a permanent pacing generator, an implantable cardioverter defibrillator (ICD), a peripherally inserted central catheter (PICC), chest tubes (pleural or mediastinal), electrocardiographic (ECG) electrodes, and surgical markers and clips.27,28
Bedside Monitoring
Capnography
Capnography is the measurement of exhaled carbon dioxide (CO2) gas; it is also known as end-tidal CO2 monitoring. Normally, alveolar and arterial CO2 concentrations are equal in the presence of normal V/Q relationships. In a patient who is hemodynamically stable, the end-tidal CO2 (Petco2) can be used to estimate the Paco2, with the Petco2 levels 1 to 5 mm Hg less than Paco2 levels. The practitioner must determine first that a normal V/Q relationship exists before correlation of the Petco2 and the Paco2 can be assumed.12–29 Causes of increased Petco2 include situations in which CO2 production is increased, such as hyperthermia, sepsis, and seizures, or in which alveolar ventilation is decreased, such as respiratory depression. Causes of decreased Petco2 include situations in which CO2 production is decreased, such as hypothermia, cardiac arrest, and pulmonary embolism, or in which alveolar ventilation is increased, such as hyperventilation.12,29
In the critical care area, continuous capnography is used for assessment and monitoring of the patient’s ventilatory status in a variety of situations, including weaning from mechanical ventilation and undergoing procedural sedation. Assessment of changes in physiologic dead space can be carried out with end-tidal CO2 monitoring, based on the degree of difference between the Paco2 and the Petco2. As the severity of pulmonary impairment increases, so does the disparity between the Paco2 and the Petco2, as indicated by an increased gradient. A gradient of greater than 5 mm Hg can be seen with underperfused alveolar-capillary units (dead space-producing situations) and nonperfused alveolar-capillary units (alveolar dead space). Increased dead space ventilation is a result of decreased pulmonary blood flow or cardiac output and lung disease. This leads to an abnormality in the transfer of CO2 from the blood to the lung. The result is a Petco2 level that is lower than the Paco2 because of the mixing of carbon dioxide between perfused and nonperfused units. The end result is an increased or widened Paco2/Petco2 gradient.12,29
The noninvasive measurement of Petco2 enables assessment of the adequacy of cardiopulmonary resuscitation and endotracheal tube placement. Decreased pulmonary blood flow is associated with lower Petco2 values, reflected clinically by decreased cardiac output, as in the case of cardiopulmonary resuscitation.12,29 During endotracheal intubation, a low Petco2 reading indicates that the tube is positioned in the stomach, because the amount of carbon dioxide in the esophagus is expected to be low.12,29
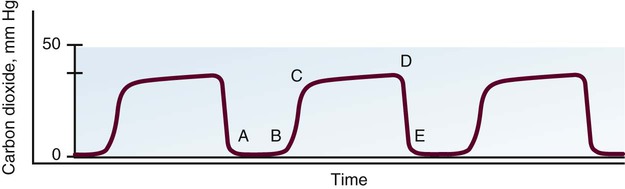
There are three forms of capnography: mainstream, side-stream, and proximal diverting. All forms can be used in intubated patients, but side-stream and microstream capnography can also be used in nonintubated patients, broadening the application of end-tidal CO2 monitoring. Mainstream capnography measures the CO2 level directly by a sensor in the exhalation port of the ventilator tubing. During exhalation, gas passes over the sensor, and the information is transferred by an electrical cable to the display unit. The display unit produces a waveform, called a capnogram (Fig. 19-5), and a numeric recording (Petco2). Disadvantages to this form of capnography include the weight of the sensor on the ventilator tubing and possible obstruction of the sensor by secretions and condensation. In side-stream capnography, the CO2 gas is continuously aspirated through a side port in the ventilator tubing or nasal cannula and is measured and analyzed by a side unit. Disadvantages to this form of capnography include obstruction of the sampling tube with secretions and slow response time. Proximal diverting capnography is a newer and improved version of side-stream capnography that transports gas a short distance from the airway to a site where the sensor is located thereby reducing the bulkiness at the airway.
Capnography and partial pressure of end-tidal carbon dioxide (Petco2) analysis have many diverse applications in the critical care area, but the practitioner must never assume the Petco2 values reflect arterial values of the partial pressure of carbon dioxide (Paco2) without waveform analysis. Any change in the waveform can indicate a change in the patient’s pulmonary status and warrants further evaluation. Loss of the waveform may signal loss of effective respirations.12,29
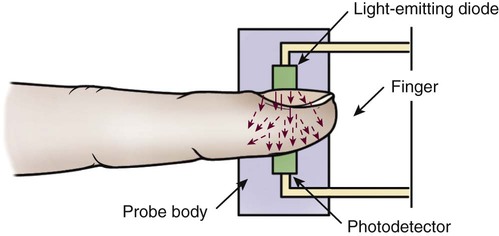
Pulse Oximetry
Pulse oximetry is a noninvasive method for monitoring oxygen saturation (Spo2). It is indicated in any situation in which the patient’s oxygenation status requires continuous observation. It consists of a microprocessor and a probe that attaches to the patient’s forehead, finger, ear, toe, or nose. The probe consists of two light-emitting diodes and a photodetector (Fig. 19-6). The diodes transmit red and infrared light wavelengths through the pulsating arterial vascular bed to the photodetector on the other side. The percentage of oxygen saturation is determined by the difference in absorbance of the red and infrared light caused by the difference in color between oxygen-bound (bright red) and oxygen-unbound (dark red) hemoglobin. The photodetector converts the light signals into an electric signal that is sent to the microprocessor, which converts it to a digital reading. The pulse oximeter is considered very accurate; readings vary less than 4% to 5% at a saturation level greater than 70%. However, several physiologic and technical factors limit the monitoring system.9,12
Physiologic Limitations
Physiologic limitations of pulse oximetry include elevated levels of abnormal hemoglobins, presence of vascular dyes, and poor tissue perfusion. The pulse oximeter cannot differentiate between normal and abnormal hemoglobin. Elevated levels of abnormal hemoglobin falsely elevate the Spo2. Vascular dyes such as methylene blue, indigo carmine, indocyanine green, and fluorescein interfere with pulse oximetry and can lead to falsely low readings. Poor tissue perfusion to the area with the probe leads to loss of pulsatile flow and signal failure.9,12 In the critically ill patient, pulse oximetry is reliable only for monitoring the patient’s oxygenation status. It is not a reliable method for monitoring the patient’s ventilatory status. The ability of a pulse oximeter to detect hypoventilation is accurate only when the patient is breathing room air.9 Because most critically ill patients require some form of oxygen therapy, pulse oximetry is not a reliable method of detecting hypercapnia and should not be used for this purpose.
Technical Limitations
Technical limitations of pulse oximetry include bright lights, excessive motion, and incorrect placement of the probe. Bright lights may interfere with the photodetector and cause inaccurate results. The probe must be covered to limit optical interference. Excessive motion can mimic arterial pulsations and can lead to false readings. Incorrect placement of the probe can lead to inaccurate results, because part of the light can reach the photodetector without having passed through blood (optical shunting).9,12 Interventions to limit these problems include using the proper probe in the appropriate spot (e.g., not using a finger probe on the ear), applying the probe according to the directions, and ensuring that the area being monitored has adequate perfusion.9,24
Summary
Laboratory Studies
• Interpretation of ABG levels involves looking at the Pao2 (normal range, 80 to 100 mm Hg), the pH (normal range, 7.35 to 7.45), the Paco2 (normal range, 35 to 45 mm Hg), and HCO3− (normal range, 22 to 26 mEq/L).
• The efficiency of oxygenation can be assessed by measuring the degree of intrapulmonary shunting using the classic shunt equation and oxygen tension indices (Pao2/Fio2 ratio, the Pao2/Pao2 ratio, and the a-a gradient).
• Sputum specimens are crucial for the rapid identification and treatment of pulmonary infections.
Diagnostic Procedures
• Fiberoptic bronchoscopy and thoracentesis are often used as diagnostic and therapeutic procedures.
• PFTs are used for preoperative assessment, evaluating lung mechanics, diagnosing and tracking pulmonary diseases, and monitoring therapy.
• V/Q scanning is indicated when a serious alteration of the normal V/Q relationship is suspected, such as with a pulmonary embolus.
• Chest x-ray examination aids in the diagnosis of various pulmonary disorders and assists in the evaluation of treatments.
[/level-membership-for-critical-care-medicine-category][not-level-membership-for-critical-care-medicine-category]
Pulmonary Diagnostic Procedures
Laboratory Studies
Arterial Blood Gases
Interpretation of arterial blood gas (ABG) levels can be difficult, especially if the nurse is under pressure to do it quickly and accurately. One method that can help ensure accuracy when analyzing ABG levels is to follow the same steps of interpretation each time. A specific method to be used each time that blood gas values must be interpreted is presented here (Box 19-1).
Steps for Interpretation of Blood Gas Levels
Step 1.
Look at the Pao2 level, and answer this question: Does the Pao2 show hypoxemia? The Pao2 is a measure of the partial pressure (P) of oxygen dissolved in arterial (a) blood plasma. Sometimes, Pao2 is shortened to Po2. It is reported in millimeters of mercury (mm Hg). Pao2 reflects 3% of total oxygen in the blood.1
The normal range of Pao2 values for persons breathing room air at sea level is 80 to 100 mm Hg. However, the normal range is age dependent for infants and for persons 60 years old or older. The normal level for infants breathing room air is between 50 and 70 mm Hg.2 The normal level for persons 60 years old or older decreases with age as changes occur in the ventilation/perfusion (V/Q) matching in the aging lung.1,3 The correct Pao2 for older persons can be ascertained as follows: 80 mm Hg (the lowest normal value) minus 1 mm Hg for every year of age above 60 years. Using this formula, a 65-year-old individual can have a Pao2 as low as 75 mm Hg (80 mm Hg − 5 mm Hg = 75 mm Hg) and still be within the normal range. An acceptable range for an 80-year-old person (20 years older than 60 years) is 60 mm Hg (80 mm Hg − 20 mm Hg = 60 mm Hg).
At any age, a Pao2 lower than 40 mm Hg represents a life-threatening situation that necessitates immediate action.1 A Pao2 value less than the predicted lowest value indicates hypoxemia, which means that a lower-than-normal amount of oxygen is dissolved in plasma.1
Step 2.
Look at the pH level, and answer this question: Is the pH on the acid or alkaline side of 7.40? The pH is the hydrogen ion (H+) concentration of plasma. Calculation of pH is accomplished by using the partial pressure of carbon dioxide (Paco2) and the plasma bicarbonate level (HCO3−). The formula used is the Henderson-Hasselbalch equation (see Appendix B).4
The normal pH of arterial blood is 7.35 to 7.45, and the mean is 7.40. If the pH level is less than 7.40, it is on the acid side of the mean. A pH level less than 7.35 is known as acidemia, and the overall condition is called acidosis. If the pH level is greater than 7.40, it is on the alkaline side of the mean. A pH level greater than 7.45 is known as alkalemia, and the overall condition is called alkalosis.1,4,5
Step 3.
Look at the Paco2 level, and answer this question: Does the Paco2 show respiratory acidosis, alkalosis, or normalcy? The Paco2 is a measure of the partial pressure of carbon dioxide dissolved in arterial blood plasma, and it is reported in millimeters of mercury (mm Hg). It is the acid–base component that reflects the effectiveness of ventilation in relation to the metabolic rate.4 In other words, the Paco2 value indicates whether the patient can ventilate well enough to rid the body of the carbon dioxide produced as a consequence of metabolism.
The normal range for Paco2 is 35 to 45 mm Hg. This range does not change as a person ages. A Paco2 value greater than 45 mm Hg defines respiratory acidosis, which is caused by alveolar hypoventilation. Hypoventilation can result from chronic obstructive pulmonary disease (COPD), oversedation, head trauma, anesthesia, drug overdose, neuromuscular disease, or hypoventilation with mechanical ventilation.6
Ventilatory failure results when the Paco2 level exceeds 50 mm Hg. Acute ventilatory failure occurs when the Paco2 level is greater than 50 mm Hg and the pH level is less than 7.30. It is referred to as acute because the pH is abnormal, not allowing enough time for the body to compensate by returning the pH to the normal range. Chronic ventilatory failure is defined as a Paco2 value greater than 50 mm Hg and a pH level greater than 7.30.1,7
A Paco2 value that is less than 35 mm Hg defines respiratory alkalosis, which is caused by alveolar hyperventilation. Hyperventilation can result from hypoxia, anxiety, pulmonary embolism, pregnancy, and hyperventilation with mechanical ventilation or as a compensatory mechanism for metabolic acidosis.4
Step 4.
Look at the HCO3− level, and answer this question: Does the HCO3− show metabolic acidosis, alkalosis, or normalcy? Bicarbonate (HCO3−) is the acid–base component that reflects kidney function. The bicarbonate level is reduced or increased in the plasma by renal mechanisms. The normal range is 22 to 26 mEq/L.4,5
A bicarbonate level of less than 22 mEq/L defines metabolic acidosis, which can result from ketoacidosis, lactic acidosis, renal failure, or diarrhea. The cumulative effect is a gain of acids or a loss of base. A bicarbonate level that is greater than 26 mEq/L defines metabolic alkalosis, which can result from fluid loss from the upper gastrointestinal tract (vomiting or nasogastric suction), diuretic therapy, severe hypokalemia, alkali administration, or steroid therapy.4,5,6
Step 5.
Look again at the pH level, and answer this question: Does the pH show a compensated or an uncompensated condition? If the pH level is abnormal (less than 7.35 or greater than 7.45), the Paco2 value or the HCO3− level, or both, will also be abnormal. This is an uncompensated condition because the body has not had enough time to return the pH to its normal range.4,5,6,8 Box 19-2 provides two examples of uncompensated ABGs. If the pH level is within normal limits and the Paco2 value and the HCO3− level are abnormal, the condition is compensated because the body has had enough time to restore the pH to within its normal range.4,5,6,8
Differentiating the primary disorder from the compensatory response can be difficult. The primary disorder is the abnormality that caused the pH level to shift initially. It is determined according to the pH level; the primary disorder is considered to be the one on whichever side of 7.40 the pH level occurs.4,8 Box 19-3 provides two examples of compensated ABGs. Partial compensation may be present and is evidenced by abnormal pH, Paco2, and HCO3− levels, indications that the body is attempting to return the pH to its normal range.4,8
Table 19-1 summarizes the changes in the acid–base components that accompany various acid–base disorders.4,5,8 In addition to the parameters previously discussed, other factors must be considered when reviewing a patient’s ABGs, including oxygen saturation, oxygen content, base excess and deficit, and anion gap analysis. Table 19-2 summarizes conditions that may potentiate acid–base abnormalities.4,5,8
TABLE 19-1
| DISORDER | pH | Paco2 | HCO–3 |
| Respiratory Acidosis | |||
| Uncompensated | <7.35 | >45 mm Hg | 22-26 mEq/L |
| Partially compensated | <7.35 | >45 mm Hg | >26 mEq/L |
| Compensated | 7.35-7.39 | >45 mm Hg | >26 mEq/L |
| Respiratory Alkalosis | |||
| Uncompensated | >7.45 | <35 mm Hg | 22-26 mEq/L |
| Partially compensated | >7.45 | <35 mm Hg | <22 mEq/L |
| Compensated | 7.41-7.45 | <35 mm Hg | <22 mEq/L |
| Metabolic Acidosis | |||
| Uncompensated | <7.35 | 35-45 mm Hg | <22 mEq/L |
| Partially compensated | <7.35 | <35 mm Hg | <22 mEq/L |
| Compensated | 7.35-7.39 | <35 mm Hg | <22 mEq/L |
| Metabolic Alkalosis | |||
| Uncompensated | >7.45 | 35-45 mm Hg | >26 mEq/L |
| Partially compensated | >7.45 | >45 mm Hg | >26 mEq/L |
| Compensated | 7.41-7.45 | >45 mm Hg | >26 mEq/L |
| Combined (or mixed) respiratory and metabolic acidosis | <7.35 | >45 mm Hg | <22 mEq/L |
| Combined (or mixed) respiratory and metabolic alkalosis | >7.45 | <35 mm Hg | >26 mEq/L |
TABLE 19-2
| DISORDERS | POTENTIAL CAUSE |
| Respiratory Acidosis |
Oxygen Saturation
Oxygen saturation is a measure of the amount of oxygen bound to hemoglobin, compared with hemoglobin’s maximal capability for binding oxygen. It can be assessed as a component of the ABG (Sao2) or can be measured noninvasively using a pulse oximeter (Spo2).9,10 Oxygen saturation is reported as a percentage or as a decimal; normal values are greater than 95% when the patient is on room air. Normally, the saturation level cannot reach 100% (on room air) because of physiologic shunting.1 However, when supplemental oxygen is administered, oxygen saturation may approach 100% so closely that it is reported as 100%.
Proper evaluation of the oxygen saturation level is vital. For example, an Sao2 of 97% means that 97% of the available hemoglobin is bound with oxygen. The word available is essential to evaluating the Sao2 level, because the hemoglobin level is not always within normal limits and oxygen can bind only with what is available. A 97% saturation level associated with 10 g/dL of hemoglobin does not deliver as much oxygen to the tissues as does a 97% saturation level associated with 15 g/dL of hemoglobin. Assessing only the Sao2 level and finding it within normal limits does not ensure that the patient’s oxygenation status is normal. The hemoglobin level must also be evaluated before a decision on oxygenation status can be made.1,9,10
Oxygen Content
Oxygen content (Cao2) is a measure of the total amount of oxygen carried in the blood, including the amount dissolved in plasma (measured by the Pao2) and the amount bound to the hemoglobin molecule (measured by the Sao2). Cao2 is reported in milliliters of oxygen carried per 100 mL of blood. The normal value is 20 mL of oxygen per 100 mL of blood. To calculate the oxygen content, the Pao2, the Sao2, and the hemoglobin level are used (see Appendix B). A change in any one of these parameters will affect the Cao2.1
The value of assessing the Cao2 is best illustrated by the examples in Table 19-3. The ABG parameters that are used most commonly to evaluate oxygenation status (Pao2 and Sao2) are both normal. Assessing only the Pao2 and the Sao2 would lead to the invalid conclusion that Patient B’s oxygenation status is normal. However, consideration of the hemoglobin level and the Cao2 reveals that the oxygenation of Patient B’s blood is significantly abnormal.
TABLE 19-3
| PATIENT | Pao2 LEVEL (mm Hg) | Sao2 LEVEL (%) | Hgb (g/dL) | Cao2 (mL/dL) |
| A | 100 | 97 | 15 | 19.8 |
| B | 100 | 97 | 10 | 13.3 |
[/not-level-membership-for-critical-care-medicine-category]
