CHAPTER 99 Proliferation Markers in the Evaluation of Gliomas
The pathologist’s daily endeavors involve direct and indirect observation of cell proliferation and related phenomena such as cell differentiation.1 Even without using special stains, these observations provide a fair assessment of cell proliferation in neoplasms. In addition, semiquantitative measurement of histologic features provides a better appreciation of a lesion’s proliferative state. This chapter presents a practical overview of pathologic evaluation of cell proliferation in specific entities within gliomas. It is not intended to be either a comprehensive review of the basic cellular processes or an exhaustive summary of countless publications on cell proliferation in glial tumors.
Methodologic Considerations
Numerous static and dynamic methods have been used for the study of cell proliferation in normal and pathologic tissue.2,3 Many of these methods require direct examination of the tissue of interest, and a distinct minority have found practical use in everyday surgical pathology.
Mitotic Cell Count
One of the cheapest, yet most straightforward, means of analyzing cell proliferation is determination of the mitotic figure count, and many studies have attempted to standardize the counting of mitoses in surgical pathology.4 Similar approaches also have been made for central nervous system (CNS) neoplasms.5 Typically, the mitotic count is performed in a given area of the tissue specimen and is reported as the number of mitoses per 10 high-power (magnification) fields (HPFs). Usually, an HPF represents the image obtained with the use of a 40× objective and a 10× ocular piece, which yields 400× magnification of the area. The mitotic count is often calculated in 10 such HPFs and frequently repeated on other sections/slides to give a more realistic estimate. This method provides a fairly reproducible index and has been used successfully as a prognostic parameter for many CNS and non-CNS neoplasms. For example, the mitotic cell count has been very helpful in distinguishing grade I from grade II meningiomas.
Immunohistochemical Markers of Cell Proliferation
Another set of markers typically restricted to mitotic cells are antibodies such as MPM-2 and PHH3, which have been helpful in determining the mitotic rate.6 Phosphorylation of tyrosine 3 of histone H3 is highly conserved among many species, and PHH3 antibodies have been used successfully in paraffin-embedded tissue to detect mitotic cells.7 Although this marker has only recently been introduced and validation data are limited, it may find better clinical use in the future. PHH3 markers are distinctly different from those such as Ki-67 in that they do not label all cells in the cell cycle and highlight only mitoses.
Markers that have been used in the past include fluorescence-labeled antibodies, special stains such as the silver stain for argyrophilic nucleolar organizer regions (AgNOR), and bromodeoxyuridine labeling.8 Although these markers have been useful for research applications in the past, they are of little practical value today.
Interpretation of Proliferation Markers
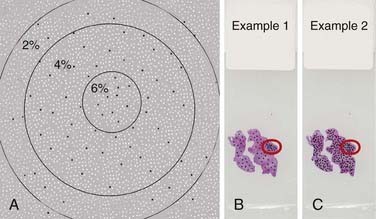
Three significant challenges that can further complicate the current methods of evaluation should be emphasized. First, immunohistochemical stains may vary from one batch to another, and unless all stains are performed on the same day with the same controls, they are likely to show variation. This is critical when the labeling indices from different laboratories are compared. Second, it is important to determine a visual threshold of staining intensity above which the cells would be scored as positive. Unless such a practice is performed with actual optical measurements of staining intensity, the results are influenced by individual observation bias. Third, because the observer often seeks the area with the highest staining intensity and almost all tumors show marked regional variation in the distribution of positive cells, delineation of the area of interest is critical for reproducibility of the measurement. Furthermore, the results could vary depending on how many cells are counted, even if the same area were selected. Figure 99-1A demonstrates a graphic example of the influence of counting a different number of cells starting from the area of highest staining. The percentages in the figure represent the labeling indices if all cells within the respective circles are to be counted. As in this example, increasing the total number of cells counted may alter the labeling index. Figure 99-1B and C also highlight the fact that by counting only the area of highest intensity, it is possible to get a similar labeling index from two slides that actually have marked variation in overall labeling.
Although such challenges appear difficult to resolve, improved digital quantification and immunohistochemical analytic methods with increased reliability and standardization are emerging.9 We should expect to see much better validity and reliability for methods that take advantage of such advances.
Proliferation Markers in Glioma Subtypes
Pilocytic and Pilomyxoid Astrocytomas
There is substantial variation among PAs in terms of proliferation indices, and this does not appear to correlate with any of the known clinical parameters. The practical value of determining the proliferation rate in PA has been questioned in a number of studies.10–12 These studies have failed to find any correlation between the proliferation rate as measured by labeling indices and the clinical outcome of patients with PA. Most studies report a mean Ki-67 labeling index of less than 2%, although a minority of tumors may have higher indices.10–12
Similar proliferation rates have been reported for PMA and PA, but data on the proliferation index for PMA are limited.13–16 Hopefully, future studies will better characterize the actual significance of cell proliferation in relation to the biologic behavior of PMA.
Pleomorphic Xanthoastrocytoma
The typical pleomorphic xanthoastrocytoma (PXA) is a low-grade neoplasm (World Health Organization [WHO] grade II) in which mitotic figures are observed only occasionally.17 Even though the WHO 2007 does not describe a grade III PXA, numerous studies highlight rare examples with the histologic characteristics of PXA and aggressive clinical behavior. Although rare mitoses are considered usual for PXA, the aggressive examples are reportedly more mitotically active and even show vascular endothelial proliferation or necrosis, or both. Rare case reports have alleged that because anaplastic transformation is often accompanied by increased mitotic activity, this finding should be considered to be a negative prognostic indicator.18 In a comprehensive review, Giannini and coauthors reported that up to 18% of cases in their study had mitotic counts greater than 5 per 10 HPF. The median Ki-67 (MIB-1) labeling index was 0.6%, and 79% of all cases had a labeling index of greater than 2%.19 Currently, it is advisable to consider an increased Ki-67 labeling index as worrisome for recurrence of PXA, especially if accompanied by additional aggressive histologic features.
Subependymal Giant Cell Astrocytoma
Subependymal giant cell astrocytoma (SEGA) is a WHO grade I neoplasm that typically occurs in the setting of the tuberous sclerosis complex. Most SEGAs harbor rare mitotic figures, frequently not reaching a quantifiable level, and the Ki-67 (MIB-1) labeling index is generally less than 3%.20 Because most studies on SEGA are either small series or case reports, the prognostic value of proliferative markers in these neoplasms is not clear.
Diffuse Astrocytoma, World Health Organization Grade II
Countless studies have analyzed cell proliferation indices in diffuse astrocytomas. A cursory PubMed keyword search for clinicopathologic studies of cell proliferation in astrocytomas yields in excess of 300 publications, and a substantial number of these studies include WHO grade II diffuse astrocytomas. Most such studies suggest that the Ki-67 (MIB-1) labeling index positively correlates with histologic grade, as well as with mitotic activity and survival.21 In WHO grade II diffuse astrocytoma, the mitotic count and cell proliferation indices are significantly lower than those in grade III astrocytomas. Some suggest that even within grade II astrocytomas, patients with a higher MIB-1 labeling index have a shorter survival time.22 Others support this suggestion by reporting a positive correlation between Ki-67 labeling indices and the probability of diffuse astrocytomas recurring.23 In addition to cell proliferation markers, the mitotic marker PHH3 was also suggested to be an independent prognostic marker for astrocytomas, and it appears that PHH3 staining correlates well with mitotic count and Ki-67 labeling.7 However, some studies have found no correlation between survival and the Ki-67 labeling index.24 The variations in methodology and the issues mentioned previously often prevent accurate comparison of these studies and their conclusions.
Most studies of WHO grade II diffuse astrocytoma report a mean labeling index of less than 2%, but the range of staining has been much greater.25 Sampling is a serious concern when determining an appropriate proliferation index for diffuse astrocytomas. Small biopsy specimens with only low-grade features of high-grade astrocytoma may yield scores that are much higher than expected. A more realistic interpretation of the labeling index requires knowledge of the radioimaging characteristics of the tumor, the site, the size of the biopsy sample, and knowledge of the staining and evaluation technique. When all of the aforementioned variables are optimal, one can realistically expect a labeling index of around 2% of tumor cells in diffuse astrocytoma. Much higher labeling indices should prompt scrutiny and raise suspicion that the sample may have been obtained from a higher grade astrocytoma.
Anaplastic Astrocytoma and Glioblastoma
Anaplastic astrocytomas (AAs) contain mitoses by virtue of their definition, but there is no clearly acceptable threshold for mitotic count in AAs. Some authors consider a single mitotic figure in a small biopsy sample sufficient for the designation of AA. Such tumors with a “solitary” mitosis have reportedly lower Ki-67 labeling indices and result in significantly longer patient survival times than do AAs with more than one mitotic figure.26 Mean values reported for the Ki-67 labeling index in AAs have been around 10% but have ranged between 1% and 30%.25,27 One caveat for Ki-67 labeling in AAs is the significant overlap of values reported for either diffuse astrocytoma or glioblastoma. It seems reasonable to consider the 5% to 10% range as being consistent with AA, and tumors with indices greater than this range should be suspected of being inadequately sampled glioblastomas.
Cell proliferation indices for glioblastomas are typically higher than those for AAs. Despite the significant overlap in values for these two tumor types, the mitotic rate and Ki-67 labeling index seem to correlate with patient outcomes in glioblastomas.28,29 Yet this finding has not been widely reproducible. Some suggest using a cutoff value of 15% for a typical glioblastoma, but the significant variations stemming from manual counting methods influence this threshold. It is prudent to expect a very aggressive clinical course in histologically confirmed glioblastoma, regardless of the labeling index.
Oligodendrogliomas
Proliferation indices and the mitotic count in oligodendroglial neoplasms depend on the tumor grade, as is seen in the case of infiltrating astrocytomas. By definition, WHO grade II oligodendrogliomas can have “occasional mitoses,” but a specific cutoff point for mitotic rate is not defined. Conversely, the finding of “abundant” mitoses is compatible with an anaplastic (WHO grade III) oligodendroglioma, but this designation also lacks a specific threshold. Proliferation markers such as Ki-67 exhibit a labeling index lower than 5% for grade II oligodendrogliomas and much higher for anaplastic tumors. In some studies, cell proliferation indices have correlated positively with disease-free survival in patients with grade II oligodendroglioma.30,31 Some reports have found a positive correlation for Ki-67 labeling index and survival, but not for mitotic count,32,33 whereas others have found no correlation for either.34,35 The challenges of variability in determining the labeling index mentioned in the first section of this chapter apply especially to oligodendrogliomas.36 These variations can partly explain the discrepancies in the literature. Furthermore, variations in classification criteria or pathologic interpretation may also play a significant role inasmuch as some studies report unusually poor 5- and 10-year survival probability for patients with oligodendrogliomas.37 Although determination of the Ki-67 labeling index is highly dependent on the method and the observer, many studies imply a more aggressive behavior for tumors with indices greater than 5%, and this threshold should be considered carefully when reporting or grading oligodendrogliomas.
Ependymomas
Ependymomas are classified as WHO grade II or III neoplasms based on a set of histologic features, and “mitotic activity” is considered one of the criteria in the grading scheme. However, a specific cutoff point for mitotic rate has not been established for grading ependymomas. Two major caveats in studies that focus on the proliferation rate in ependymomas and its prognostic value have been the limited size and the diversity of the study populations. Many studies have included wide age ranges, with both adult and pediatric patients, and they often span a long period. In addition, only a small number of studies actually control for variables such as the extent of resection; tumor grade, stage, and location; and other confounding issues.38 Nevertheless, many well-designed studies have identified histologic grade and proliferation rate (mitotic count, Ki-67 labeling) as independent prognostic indicators for patients with ependymomas.39–43
The challenge in the case of pediatric and adult ependymomas is identification of a cutoff value for the mitotic count beyond which the risk for recurrence or progression is compatible with the diagnosis of an anaplastic (WHO grade III) ependymoma. Although some of the larger studies do not report a particular value,40 many others consider 5 mitoses per 10 HPFs as a prognostically relevant cutoff point for ependymomas.42–45 Even though there are some variations in the conclusions of the latter group of studies, it is fair to assume that tumors with less than 5 mitoses per 10 HPFs are much less likely to behave in an aggressive manner.
The proliferation index as measured by Ki-67 immunohistochemistry demonstrates even wider variations in studies of ependymoma. In the study by Bennetto and associates, the range of the Ki-67 labeling index in 74 childhood posterior fossa ependymomas was found to be 0.1% to 68.8%.46 This study has reported a prognostically significant cutoff labeling index value of 25%; other studies have reported significant differences at 1%,39 4%,47 9%,45 and 20%.48
In short, although it appears that there is a significant tendency for anaplastic or clinically aggressive ependymomas to demonstrate high proliferation indices, it is prudent to consider a conclusion of Prayson that “MIB-1 (Ki-67) immunoreactivity labeling indices may be useful in concert with other histologic features, but are by no means absolutely predictive of tumor behavior by themselves.”47 I believe that with increased standardization, quantification, whole-slide imaging, and digitized analysis of histologic and immunohistochemical stains, it may be possible to reduce the wider variations observed in the literature and consider a cutoff value that may be of more practical value.
Coleman KE, Brat DJ, Cotsonis GA, et al. Proliferation (MIB-1 expression) in oligodendrogliomas: assessment of quantitative methods and prognostic significance. Appl Immunohistochem Mol Morphol. 2006;14:109-114.
Hall PA, Levison DA. Review: assessment of cell proliferation in histological material. J Clin Pathol. 1990;43:184-192.
Hilton DA, Love S, Barber R, et al. Accumulation of p53 and Ki-67 expression do not predict survival in patients with fibrillary astrocytomas or the response of these tumors to radiotherapy. Neurosurgery. 1998;42:724-729.
Kepes JJ, Rubinstein LJ, Eng LF. Pleomorphic xanthoastrocytoma: a distinctive meningocerebral glioma of young subjects with relatively favorable prognosis. A study of 12 cases. Cancer. 1979;44:1839-1852.
Perilongo G, Massimino M, Sotti G, et al. Analyses of prognostic factors in a retrospective review of 92 children with ependymoma: Italian Pediatric Neuro-oncology Group. Med Pediatr Oncol. 1997;29:79-85.
Perry A, Jenkins RB, O’Fallon JR, et al. Clinicopathologic study of 85 similarly treated patients with anaplastic astrocytic tumors. An analysis of DNA content (ploidy), cellular proliferation, and p53 expression. Cancer. 1999;86:672-683.
Tihan T, Fisher PG, Kepner JL, et al. Pediatric astrocytomas with monomorphous pilomyxoid features and a less favorable outcome. J Neuropathol Exp Neurol. 1999;58:1061-1068.
Tihan T, Zhou T, Holmes E, et al. The prognostic value of histological grading of posterior fossa ependymomas in children: a Children’s Oncology Group study and a review of prognostic factors. Mod Pathol. 2008;21:165-177.
1 Coates PJ, Hales SA, Hall PA. The association between cell proliferation and apoptosis: studies using the cell cycle–associated proteins Ki67 and DNA polymerase alpha. J Pathol. 1996;178:71-77.
2 Hall PA, Coates PJ. Assessment of cell proliferation in pathology—what next? Histopathology. 1995;26:105-112.
3 Hall PA, Levison DA. Review: assessment of cell proliferation in histological material. J Clin Pathol. 1990;43:184-192.
4 Simpson JF, Dutt PL, Page DL. Expression of mitoses per thousand cells and cell density in breast carcinomas: a proposal. Hum Pathol. 1992;23:608-611.
5 Prayson RA. Cell proliferation and tumors of the central nervous system. Part 1: evaluation of mitotic activity. J Neuropathol Exp Neurol. 2002;61:501-509.
6 Tapia C, Kutzner H, Mentzel T, et al. Two mitosis-specific antibodies, MPM-2 and phospho-histone H3 (Ser28), allow rapid and precise determination of mitotic activity. Am J Surg Pathol. 2006;30:83-89.
7 Colman H, Giannini C, Huang L, et al. Assessment and prognostic significance of mitotic index using the mitosis marker phospho-histone H3 in low and intermediate-grade infiltrating astrocytomas. Am J Surg Pathol. 2006;30:657-664.
8 Labrousse F, Daumas-Duport C, Batorski L, et al. Histological grading and bromodeoxyuridine labeling index of astrocytomas. Comparative study in a series of 60 cases. J Neurosurg. 1991;75:202-205.
9 Elie N, Plancoulaine B, Signolle JP, et al. A simple way of quantifying immunostained cell nuclei on the whole histologic section. Cytometry A. 2003;56:37-45.
10 Tihan T, Davis R, Elowitz E, et al. Practical value of Ki-67 and p53 labeling indexes in stereotactic biopsies of diffuse and pilocytic astrocytomas. Arch Pathol Lab Med. 2000;124:108-113.
11 Haapasalo H, Sallinen S, Sallinen P, et al. Clinicopathological correlation of cell proliferation, apoptosis and p53 in cerebellar pilocytic astrocytomas. Neuropathol Appl Neurobiol. 1999;25:134-142.
12 Giannini C, Scheithauer BW, Burger PC, et al. Cellular proliferation in pilocytic and diffuse astrocytomas. J Neuropathol Exp Neurol. 1999;58:46-53.
13 Komakula ST, Fenton LZ, Kleinschmidt-DeMasters BK, et al. Pilomyxoid astrocytoma: neuroimaging with clinicopathologic correlates in 4 cases followed over time. J Pediatr Hematol Oncol. 2007;29:465-470.
14 Chikai K, Ohnishi A, Kato T, et al. Clinico-pathological features of pilomyxoid astrocytoma of the optic pathway. Acta Neuropathol. 2004;108:109-114.
15 Komotar RJ, Burger PC, Carson BS, et al. Pilocytic and pilomyxoid hypothalamic/chiasmatic astrocytomas. Neurosurgery. 2004;54:72-79.
16 Tihan T, Fisher PG, Kepner JL, et al. Pediatric astrocytomas with monomorphous pilomyxoid features and a less favorable outcome. J Neuropathol Exp Neurol. 1999;58:1061-1068.
17 Kepes JJ, Rubinstein LJ, Eng LF. Pleomorphic xanthoastrocytoma: a distinctive meningocerebral glioma of young subjects with relatively favorable prognosis. A study of 12 cases. Cancer. 1979;44:1839-1852.
18 Macaulay RJ, Jay V, Hoffman HJ, et al. Increased mitotic activity as a negative prognostic indicator in pleomorphic xanthoastrocytoma. Case report. J Neurosurg. 1993;79:761-768.
19 Giannini C, Scheithauer BW, Burger PC, et al. Pleomorphic xanthoastrocytoma: what do we really know about it? Cancer. 1999;85:2033-2045.
20 Gyure KA, Prayson RA. Subependymal giant cell astrocytoma: a clinicopathologic study with HMB45 and MIB-1 immunohistochemical analysis. Mod Pathol. 1997;10:313-317.
21 Raghavan R, Steart PV, Weller RO. Cell proliferation patterns in the diagnosis of astrocytomas, anaplastic astrocytomas and glioblastoma multiforme: a Ki-67 study. Neuropathol Appl Neurobiol. 1990;16:123-133.
22 McKeever PE, Strawderman MS, Yamini B, et al. MIB-1 proliferation index predicts survival among patients with grade II astrocytoma. J Neuropathol Exp Neurol. 1998;57:931-936.
23 Hoshi M, Yoshida K, Shimazaki K, et al. Correlation between MIB-1 staining indices and recurrence in low-grade astrocytomas. Brain Tumor Pathol. 1997;14:47-51.
24 Hilton DA, Love S, Barber R, et al. Accumulation of p53 and Ki-67 expression do not predict survival in patients with fibrillary astrocytomas or the response of these tumors to radiotherapy. Neurosurgery. 1998;42:724-729.
25 Hsu DW, Louis DN, Efird JT, et al. Use of MIB-1 (Ki-67) immunoreactivity in differentiating grade II and grade III gliomas. J Neuropathol Exp Neurol. 1997;56:857-865.
26 Perry A, Jenkins RB, O’Fallon JR, et al. Clinicopathologic study of 85 similarly treated patients with anaplastic astrocytic tumors. An analysis of DNA content (ploidy), cellular proliferation, and p53 expression. Cancer. 1999;86:672-683.
27 Johannessen AL, Torp SH. The clinical value of Ki-67/MIB-1 labeling index in human astrocytomas. Pathol Oncol Res. 2006;12:143-147.
28 Scott JN, Rewcastle NB, Brasher PM, et al. Which glioblastoma multiforme patient will become a long-term survivor? A population-based study. Ann Neurol. 1999;46:183-188.
29 Bredel M, Piribauer M, Marosi C, et al. High expression of DNA topoisomerase IIalpha and Ki-67 antigen is associated with prolonged survival in glioblastoma patients. Eur J Cancer. 2002;38:1343-1347.
30 Reis-Filho JS, Faoro LN, Carrilho C, et al. Evaluation of cell proliferation, epidermal growth factor receptor, and bcl-2 immunoexpression as prognostic factors for patients with World Health Organization grade 2 oligodendroglioma. Cancer. 2000;88:862-869.
31 Coleman KE, Brat DJ, Cotsonis GA, et al. Proliferation (MIB-1 expression) in oligodendrogliomas: assessment of quantitative methods and prognostic significance. Appl Immunohistochem Mol Morphol. 2006;14:109-114.
32 Kros JM, Hop WC, Godschalk JJ, et al. Prognostic value of the proliferation-related antigen Ki-67 in oligodendrogliomas. Cancer. 1996;78:1107-1113.
33 Coons SW, Johnson PC, Pearl DK. The prognostic significance of Ki-67 labeling indices for oligodendrogliomas. Neurosurgery. 1997;41:878-884.
34 Wharton SB, Hamilton FA, Chan WK, et al. Proliferation and cell death in oligodendrogliomas. Neuropathol Appl Neurobiol. 1998;24:21-28.
35 Heesters MA, Koudstaal J, Go KG, et al. Analysis of proliferation and apoptosis in brain gliomas: prognostic and clinical value. J Neurooncol. 1999;44:255-266.
36 Prayson RA, Castilla EA, Hembury TA, et al. Interobserver variability in determining MIB-1 labeling indices in oligodendrogliomas. Ann Diagn Pathol. 2003;7:9-13.
37 Heegaard S, Sommer HM, Broholm H, et al. Proliferating cell nuclear antigen and Ki-67 immunohistochemistry of oligodendrogliomas with special reference to prognosis. Cancer. 1995;76:1809-1813.
38 Bouffet E, Perilongo G, Canete A, et al. Intracranial ependymomas in children: a critical review of prognostic factors and a plea for cooperation. Med Pediatr Oncol. 1998;30:319-329.
39 Figarella-Branger D, Civatte M, Bouvier-Labit C, et al. Prognostic factors in intracranial ependymomas in children. J Neurosurg. 2000;93:605-613.
40 Horn B, Heideman R, Geyer R, et al. A multi-institutional retrospective study of intracranial ependymoma in children: identification of risk factors. J Pediatr Hematol Oncol. 1999;21:203-211.
41 Perilongo G, Massimino M, Sotti G, et al. Analyses of prognostic factors in a retrospective review of 92 children with ependymoma: Italian Pediatric Neuro-oncology Group. Med Pediatr Oncol. 1997;29:79-85.
42 Zamecnik J, Snuderl M, Eckschlager T, et al. Pediatric intracranial ependymomas: prognostic relevance of histological, immunohistochemical, and flow cytometric factors. Mod Pathol. 2003;16:980-991.
43 Tihan T, Zhou T, Holmes E, et al. The prognostic value of histological grading of posterior fossa ependymomas in children: a Children’s Oncology Group study and a review of prognostic factors. Mod Pathol. 2008;21:165-177.
44 Schiffer D, Chio A, Giordana MT, et al. Histologic prognostic factors in ependymoma. Childs Nerv Syst. 1991;7:177-182.
45 Ho DM, Hsu CY, Wong TT, et al. A clinicopathologic study of 81 patients with ependymomas and proposal of diagnostic criteria for anaplastic ependymoma. J Neurooncol. 2001;54:77-85.
46 Bennetto L, Foreman N, Harding B, et al. Ki-67 immunolabelling index is a prognostic indicator in childhood posterior fossa ependymomas. Neuropathol Appl Neurobiol. 1998;24:434-440.
47 Prayson RA. Clinicopathologic study of 61 patients with ependymoma including MIB-1 immunohistochemistry. Ann Diagn Pathol. 1999;3:11-18.
48 Ritter AM, Hess KR, McLendon RE, et al. Ependymomas: MIB-1 proliferation index and survival. J Neurooncol. 1998;40:51-57.