Principles of Drug Dosing in Critically Ill Patients
General Pharmacokinetic Principles
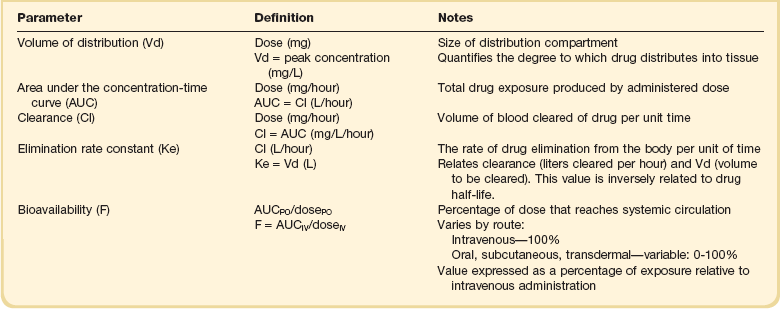
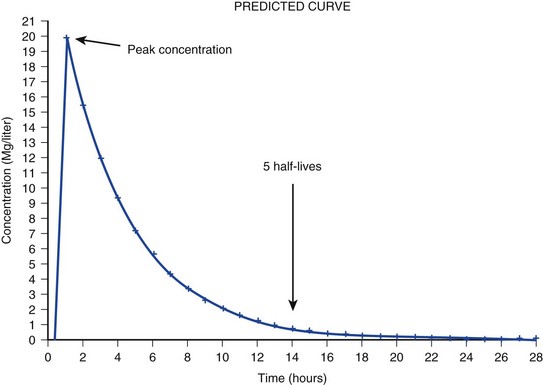
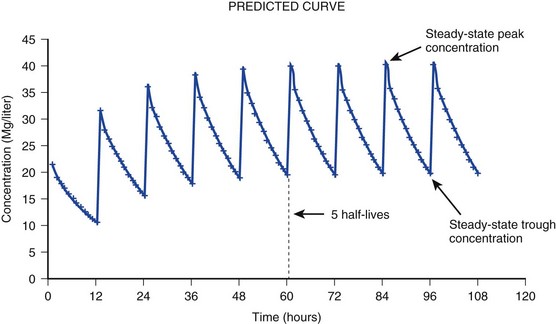
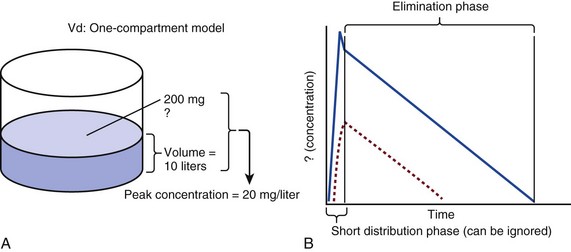
The pharmacokinetic profile of a drug is a mathematical model that describes the determinants of drug exposure. A complete model provides quantitative estimates of drug absorption, distribution, metabolism, and excretion after single doses, in addition to the extent of serum and tissue accumulation after multiple doses. Figure 20.1 depicts the concentration-time curve for a single intravenous (IV) dose of tobramycin. The curve allows for estimation of the maximum concentration achieved by the dose in addition to the time course of drug elimination. If dosing is repeated before elimination is complete, accumulation occurs and will continue until the system reaches “steady state,” at which time the rate of administration is in equilibrium with the rate of elimination (Fig. 20.2). The definition of common PK terms can be found in Table 20.1.
Absorption
Factors that determine absorption from the gastrointestinal (GI) tract include drug characteristics such as lipid solubility, ionization, and molecular size, in addition to physiologic factors such as gastric emptying rate, intestinal blood flow, motility, gastric and intestinal pH, gut wall permeability, and whether the dose is administered during the fasted or fed state.1 Most drugs are orally absorbed through passive diffusion; although carrier-mediated absorption can also be important. The most important sites of absorption are the upper and lower segments of the small intestine.2 The stomach regulates absorption through gastric emptying but is not an important site for absorption. Similarly, little drug absorption occurs in the colon with the exception of extended-release products.1 Drugs with low oral bioavailability will require larger doses administered orally to produce equivalent exposure to that obtained from IV administration. Some drugs (e.g., vancomycin) have such poor bioavailability after oral administration that they cannot be used to treat the same disease processes as the IV formulations. Bioavailability is an important consideration when converting between oral and IV routes. For example, a patient who takes furosemide 80 mg orally at home would need only 40 mg given intravenously because this drug has 50% bioavailability on average. Other routes of administration include subcutaneous (SC) and intramuscular injection, transdermal absorption, buccal absorption, and inhalation. Many drugs that are available as IV preparations are amenable to SC and intramuscular administration. However, some IV drugs have characteristics that preclude administration by routes other than large-bore catheters. These drugs include those with very basic or acidic pH, or those that act as vesicants and therefore need diluents added to maintain solubility. Drugs with adequate lipid solubility are amenable to transdermal and buccal administration.
Distribution
After reaching the systemic circulation an administered dose then distributes throughout the body to produce a peak concentration. The relationship between the dose administered and the peak concentration observed after accounting for bioavailability is termed the volume of distribution (Vd). Vd estimates the size of the compartment into which the drug distributes. Total plasma volume in the average adult is 3 to 4 L.1 However, the Vd for most drugs is much greater than this value. The discrepancy between plasma volume and a drug’s Vd is accounted for by the extent that drugs concentrate in various tissues. The main determinants of Vd are the drug’s lipid solubility, degree of protein binding, and extent of tissue binding.1 High lipid solubility increases Vd through improved passage across cell membranes. Avid tissue binding also increases Vd as this concentrates drug outside the vascular space. Conversely, because only unbound drug can cross cell membranes and bind to tissue, high protein binding decreases Vd.
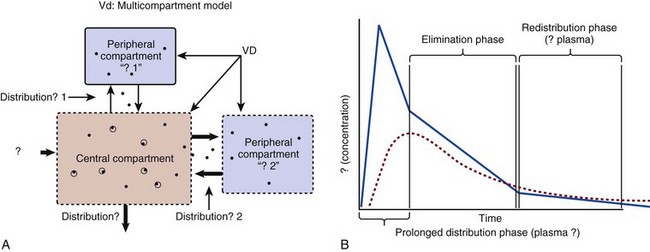
The simplest conceptualization of Vd is to view the body as a bucket—one large compartment where drug rapidly equilibrates between plasma and tissue and has uniform distribution (Fig. 20.3A). The one-compartment assumption is useful for drugs with small to intermediate Vds, such as aminoglycoside antibiotics, because these drugs have a short distribution phase owing to their limited tissue penetration. Drugs with large Vds, such as fentanyl and amiodarone, require longer periods of time to achieve equilibrium between serum and tissue and thus have a prolonged distribution phase. As a result, the one-compartment assumption fails to accurately describe large Vd drugs. An alternative is to view the body as multiple compartments: a central compartment composed of blood, extracellular fluid, and highly perfused tissues; and one or more peripheral compartments composed of tissue beds with lower perfusion and drug binding affinity (Fig. 20.4A). The number of peripheral compartments required will be determined by the differential distribution rate in each tissue. Two-compartment models adequately describe most large Vd drugs; however, a three-compartment model can be useful for agents that act in the central nervous system because of slower distribution as a result of the blood-brain barrier.
Clearance
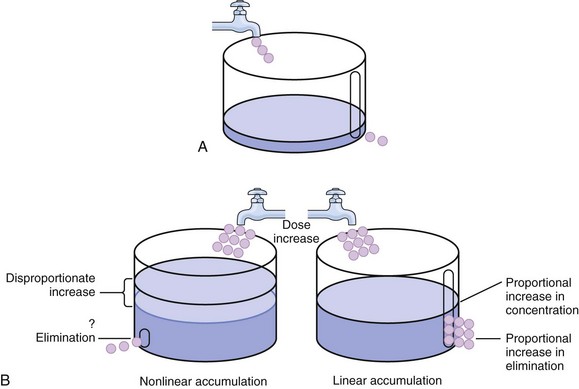
The rate of drug removal via all routes of elimination is termed clearance, which is expressed as the volume of plasma cleared per unit of time. This value is assumed to be constant for most drugs. Defining total body clearance in terms of volume has important implications. If the volume of blood cleared per unit of time is constant, it then holds that the amount of drug cleared per unit of time must change in proportion to serum concentration. An increase in the rate of drug administration will lead to an increase in serum concentration, which in turn leads to commensurate increases in the rate of drug removal. Serum and tissue concentrations will accumulate until the rate of elimination is in equilibrium with the rate of administration, at which time the system is said to be at “steady state” (Figs. 20.2 and 20.5). Accumulation follows a linear pattern for most drugs, meaning that increases in dose are always matched by proportional increases in elimination, thus producing proportional changes in serum concentration (see Fig. 20.5). Drugs that follow this pattern of accumulation are said to have first-order kinetics. However, some drugs exhibit saturable elimination. These drugs follow linear accumulation until the saturation point for elimination is reached. Once elimination is saturated, small changes in dose can produce substantial increases in concentration (see Fig. 20.5). Drugs that follow this pattern of accumulation have zero-order kinetics. Examples of drugs used in critically ill patients that have saturable elimination include phenytoin, heparin, propranolol, and verapamil.
Half-Life
ke can be further transformed into half-life:

For any system that follows exponential decay, half-life can be used to estimate the amount of elimination that has occurred: after 5 half-lives more than 90% is eliminated. Elimination approaches 100% after 7 half-lives. The time required for a dosing regimen to reach steady state is also an exponential function and thus can be estimated using half-life. This “5-7” rule of thumb is useful at the bedside. Dosing regimens approach maximal effects after 5-7 half-lives. Similarly, drug effects are usually completely dissipated after 5-7 half-lives. Using this rule, it can be predicted that drugs with long half-lives may take several days to produce target effects. This is less than ideal in the critically ill population when effective treatment is needed rapidly. As a result, loading doses are frequently used to hasten the time to steady state. Loading doses can be calculated by multiplying the target steady-state peak concentration by the patient’s Vd. Recommendations for effective loading doses of most long half-life drugs are provided in the package labeling as applicable.
Modeling the Concentration-Time Curve
When estimations of bioavailability, Vd, and clearance are available, the concentration-time curve can be modeled. As discussed earlier, the one-compartment model is useful for hydrophilic drugs with small Vd. Figure 20.3B depicts serum concentration-time curve of a one-compartment model drug after IV administration plotted on a logarithmic scale. The initial peak concentration can be estimated using Vd and the size of the dose. The peak is followed by a short distribution phase, during which time drug is removed from the plasma through distribution to tissue in addition to being eliminated. After distribution is complete, the curve is defined by a second phase when drug is removed from plasma via elimination only. The time course of this phase can be estimated using half-life. The transition from distribution to elimination phase can be seen as a change in slope of the concentration curve. This is known as a bi-exponential pattern of decay. Because the distribution phase is short (usually 15-30 minutes) it can usually be ignored when performing calculations.
Conversely, large Vd drugs are more accurately represented using a two-compartment model (Fig. 20.4B). The important difference between one-compartment and two-compartment models is the significance of the distribution phase, which is much longer for drugs following a two-compartment model. As in the one-compartment model, the transition between distribution and elimination phases can be seen. However, a third phase is also evident near the end of the curve. This redistribution phase is a result of slow release of drug from the tissues back into the serum. This slow tissue release, known as the “context-sensitive half-life,” is responsible for the increased duration of pharmacologic effect seen after continuous infusions of highly lipophilic drugs such as fentanyl, midazolam, and propofol.
Pharmacodynamics
As described in preceding sections, PK allows the clinician to estimate serum and tissue concentrations produced from dosing regimens. For example, a clinical pharmacist can use pharmacokinetic calculations to determine that 200 mg of tobramycin given as a 30-minute IV infusion will produce a peak concentration of 20 mg/L and will have an elimination half-life of 5 hours (see Fig. 20.1). Unfortunately, this information alone is not sufficient to guide dosing. From this example it is obvious that PK gives no information regarding whether these concentrations are appropriate. The clinician must still determine whether the peak concentration will be effective in treating the patient’s infection while also determining the risk of nephrotoxicity associated with this level. This is when the study of pharmacodynamics (PD), which defines the relationship between drug concentration and effect, becomes important.
Although PD concepts are important for all dosing decisions, PD parameters have been best defined for antibiotics in part because the effect of interest (bacterial killing) can be readily measured through in vitro and in vivo studies. Therefore, the PD portion of this chapter will focus on antibiotics. However, the basic concepts can be applied to all drugs. Minimum inhibitory concentration (MIC) was the first PD parameter to show utility in predicting the effectiveness of antibiotic regimens. The MIC of an antibiotic is the minimum concentration needed to inhibit bacterial growth in vitro. It is intuitive from this that effective dosing regimens in humans would produce concentrations above this value. Less intuitive is determining how much higher the MIC concentrations need to be and for how long. Decades of research into these questions have elucidated additional PD parameters that help to optimize antibiotic dosing (Fig. 20.6). Interest in PD dose optimization has resurged in recent years in response to the convergence of increasingly drug-resistant bacteria with the lack of novel compounds in the drug development pipeline to treat these dangerous pathogens.3 Consequently, it is more important now than ever to maximize the effectiveness of the agents currently in use.
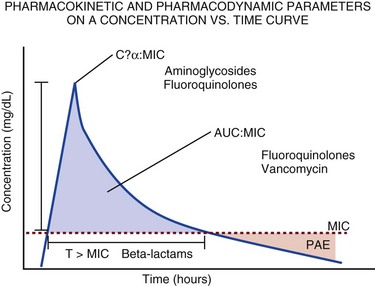
Two main factors determine the PD profile of an antibiotic: the dependence of effect on concentration and the persistence of effect after dosing. Antibiotics are first classified by the extent to which the rate of bacterial killing increases in response to increases in concentration. Some antibiotics show a robust dose response, whereas others do not. This relationship was elucidated in the neutropenic murine thigh infection model, when the effect of increasing antibiotic concentration on bacterial killing was examined.4 In repeated studies, the model showed that increasing concentration substantially increases both the magnitude (change from baseline) and the rate (change over time) of bacterial killing for aminoglycoside antibiotics such as tobramycin and the fluoroquinolone antibiotics such as ciprofloxacin. However, the same effects are not observed for the β-lactam classes of antibiotics. Although small concentration effects are observed in some models, the effect is saturated at a relatively low concentration (4-5 times the MIC). The difference in effect is related to the location of each agent’s target receptor. Both aminoglycoside and fluoroquinolone antibiotics have receptor targets that are intracellular. Penetration of these antibiotics into the cell is enhanced by high concentrations. As a result, the activity of these agents can be predicted by the ratio of the peak concentration achieved by a given dose to the MIC of the organism. Accordingly, these agents are classified as concentration-dependent antibiotics. Conversely, β-lactams inhibit the formation of bacterial cell wall via inhibition of penicillin-binding protein (PBP). This protein is located on the bacterial cell surface, allowing effective binding at lower concentrations. In fact, in vitro analyses have shown that nearly all available PBP targets become saturated at concentrations that are four to five times the bacteria’s MIC.5 Above this level, the action of β-lactams is relatively independent of concentration, making the duration of time that concentrations remain above the MIC the parameter most predictive of effect.
Another important observation from in vitro models is the persistent inhibition of bacterial growth after drug concentration falls below the MIC. This phenomenon, known as the postantibiotic effect (PAE), is common to all antibiotics, although the magnitude varies depending on the specific antibiotic and pathogen being analyzed. PAE is usually prolonged (3-6 hours) for agents that inhibit nucleic acid and protein synthesis such as the aminoglycosides.4 Most cell wall active agents such as the β-lactams have a short PAE for gram-positive bacteria and complete absence of PAE against gram-negative bacteria. As a result, bacterial regrowth occurs immediately as concentration falls below the MIC.4 Carbapenems are an exception to this as they are cell wall active agents and have a prolonged PAE.
β-Lactams
Alexander Fleming first discovered penicillin in 1928, marking the dawn of the antibiotic era. It was more than 2 decades later when Harry Eagle first noted that penicillin’s effect could be modulated by dosing regimen. Specifically, he observed that penicillin’s ability to kill bacteria was dependent on the amount of time that the drug was maintained at or above the bacteria’s MIC.6 Later experiments confirmed time above MIC (T > MIC), as the PD index that predicts bacterial killing for penicillin and other β-lactam agents.4 The T > MIC required for optimal response varies among the different β-lactams and is likely related to differences in the rate of bacterial killing and presence of PAE. Cephalosporins require the highest T > MIC (50-70%), followed by the penicillins (30-50%) and the carbapenems (20-40%). The importance of T > MIC has gained increasing attention in the last decade as a result of increasing bacterial resistance. Resistant bacteria have elevated MICs, making it more difficult to achieve adequate T > MIC (Fig. 20.7). In addition, PK studies conducted in critically ill patients have shown that standard β-lactam dosing regimens may produce unacceptably low serum concentrations, resulting in diminished T > MIC.7,8 Although failure to achieve adequate T > MIC has been shown to predict outcome in numerous animal models,9 there have been relatively few data in humans until recently. One study of patients with gram-negative bacteremia found mortality rates to double as the MIC increased from 4 mg/L to 8 mg/L in patients who were treated with cefepime.10 The importance of this finding is magnified when one considers that an MIC of 8 mg/L is considered to be within the susceptible range for cefepime. A similar increase in mortality rate was found in patients with bacteremia due to Pseudomonas aeruginosa: the relative risk of 30-day mortality was increased nearly fourfold when standard doses of piperacillin were used to treat isolates with elevated MICs to piperacillin.11 Although serum concentrations were not measured in these studies, the data provide indirect evidence that links reduced T > MIC to poor clinical outcome. In another study of gram-negative infection treated with cefepime, actual T > MIC was calculated using serum concentration data. The study showed that likelihood of achieving bacterial eradication was significantly correlated with T > MIC.12
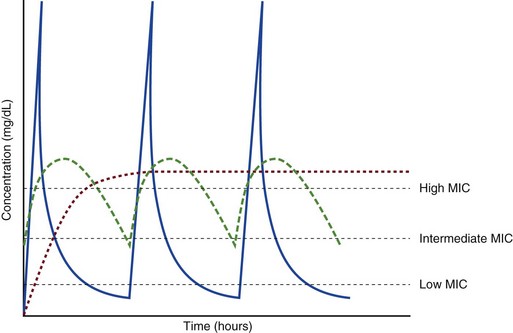
The inability to achieve adequate T > MIC has led to the investigation of alternative dosing regimens. Simple dose escalation strategies are hampered by increasing the risk for toxicity. One alternative is to change the shape of the concentration-time curve using continuous or extended infusions. As seen in Figure 20.7, extending the infusion duration changes the shape of the concentration-time curve to promote longer T > MIC. Several PK studies have confirmed that these alternative dosing strategies can increase T > MIC without increasing the size of the dose. One study found that T > MIC following a 2-g dose of meropenem was increased 15% by extending the infusion duration from 0.5 hour to 3 hours.13 Although there are no outcome data in humans comparing extended infusions to continuous infusions, PK studies suggest a similar probability of target attainment.14
An additional theoretical consideration when comparing the extended and continuous strategies is the risk of selecting resistant bacteria. Mathematical modeling of bacterial growth dynamics suggests that a constant rate of bacterial killing creates more opportunity for generating resistant mutants than does a fluctuating kill rate.15 This effect has been demonstrated in an in vitro model of ceftazidime continuous infusion, when maintenance of steady-state serum concentrations slightly above the bacteria’s MIC resulted in the emergence of resistant bacteria subpopulations.16 This has led some investigator to recommend serum concentration monitoring if continuous infusions are used, with adjustment of the infusion rate to ensure steady-state concentrations are adequate.17 Although extended infusions produce more consistent concentrations compared to standard infusions, they produce greater fluctuation compared to continuous infusion. Extended infusions also possess the logistical advantage of less infusion time and therefore greater IV access. This is of particular benefit in patients who require multiple vasoactive and nutritional infusions.
Despite having sound PK/PD rationale, the clinical benefit of extended or continuous infusion strategies has yet to be documented in randomized clinical trials.18 Most available trials have important methodologic limitations. Although extended infusions increase T > MIC compared to standard infusions, the benefit is of greatest importance for bacterial isolates with elevated MICs because standard doses already provide optimal T > MIC when MIC is low. The benefit of extended infusions is also a function of the patient’s renal function. Nicasio and associates recently found 3-hour infusions of cefepime increased T > MIC compared to standard 0.5-hour infusions but the effect was limited to patients with preserved renal function (creatinine clearance [CrCl] 50-120 mL/minute).19 This effect modification is due to the prolonged half-life of cefepime in renal dysfunction, leading to higher trough concentrations and increased T > MIC. In light of these considerations, it is likely that the benefit of extended infusion strategies is greatest in patients with preserved renal function who are infected with high MIC pathogens, such as P. aeruginosa and Acinetobacter baumannii.
Aminoglycosides
Aminoglycosides are broad-spectrum gram-negative agents that have been in clinical use since the 1960s. These agents quickly developed a reputation for having poor effectiveness and a high rate of nephrotoxicity compared to β-lactam agents. However, much of the initially dismal results observed with these agents are likely related to an inadequate knowledge of their PD profile. At the time, PD data available from β-lactam studies demonstrated T > MIC to be the important factor predicting efficacy.6 As a result, early dosing strategies used small (1-2 mg/kg) doses given every 8 to 12 hours and little attention was paid to peak concentrations. The importance of achieving an adequate peak:MIC ratio was first described in patients by Moore and colleagues, who found that the likelihood of having a positive clinical response was greater than 90% when peak concentrations were 8 to 10 times the infecting organism’s MIC.20 A later study found that time to defervescence and normalization of leukocytosis was greater than 90% when peak:MIC ratio was 10 or greater.21 These data suggest that achieving high peak aminoglycoside concentrations is fundamental to successful treatment. In recognition of this, clinicians began to monitor peak aminoglycoside levels and adjust dosing regimens to ensure optimal peak:MIC ratios.
Aminoglycosides also exhibit a prolonged PAE. The duration of PAE in neutropenic animal models varies from 1 to 8 hours and is a function of the peak:MIC ratio.22 Higher ratios produce longer PAE. In addition, data suggest that PAE may be enhanced in patients with an intact immune system.4 Based on the combination of concentration-dependent activity and a prolonged PAE the efficacy of these agents could be maximized by giving large doses less frequently. This strategy is known as extended interval dosing (EID). Because aminoglycosides have short half-lives, the drugs are completely cleared from serum near the end of a 24-hour dosing interval in patients with normal renal function. Although the absence of drug may be concerning for the regrowth of bacteria, this is prevented by the PAE. In addition, a drug-free period near the end of the dosing interval minimizes the phenomenon known as adaptive resistance. Primarily described in P. aeruginosa infection, adaptive resistance refers to the diminished rate of bacterial killing after initial exposure to aminoglycosides.23 This effect is caused by up-regulation of membrane-bound efflux pumps, which decrease the amount of drug that reaches the site of action inside the cell.23 When the bacteria are free from drug exposure for a sufficient amount of time the adaptive resistance is lost and the bacteria will become fully sensitive again. Thus, in addition to achieving high peak:MIC ratios, EID may also allow for the reversion of adaptive resistance and greater bactericidal effect.
A wide variety of doses have been utilized in EID strategies. However, the most common are 5 to 7 mg/kg for gentamicin and tobramycin and 15 to 20 mg/kg for amikacin.24 These doses were chosen based directly on PK/PD relationships. EID assumes that patients have a Vd that is within the normal range (0.25-0.3 L/kg). When given to patients who meet this assumption, the doses will produce peak concentrations that range from 16 to 24 mg/L and will achieve target peak:MIC ratios for isolates with an MIC up to 2 mg/L.25 EID is also designed to achieve a drug-free period of at least 4 hours at the end of the dosing interval.25 Because aminoglycosides are cleared renally, dosing frequency is based on renal function assessment using estimated CrCl. To achieve an adequate drug-free interval, doses are given every 24 hours for patients with CrCl greater than 60 mL/minute, every 36 hours with CrCl 40 to 59 mL/minute, and every 48 hours with CrCl less than 40 mL/minute.25 If aminoglycosides are used in renal dysfunction it is important that they still be dosed on weight owing to their peak:MIC dependent activity. EID of aminoglycosides has not been adequately studied in some patient populations (i.e., cystic fibrosis, thermal injury, pregnancy). The lack of validation data leads to the exclusion of these patients from EID nomograms, with the alternative being to use traditional dosing. However, based on our knowledge of the optimal PD parameter and the increased clearance seen in these populations, traditional dosing strategies may result in higher failure rates.
The benefit of EID has been studied in many small clinical trials and the results summarized in multiple meta-analyses. The conclusion from these studies is that EID produces similar efficacy to traditional dosing that is guided by close monitoring of peak concentrations.26 However, most trials employed combination therapy with a β-lactam agent with activity against the infecting pathogen, potentially masking the effect of aminoglycoside dosing strategy.
As mentioned earlier, the use of aminoglycosides is limited by their propensity to induce nephrotoxicity. Nephrotoxicity is the result of accumulation in the epithelial cells of the proximal renal tubule. Of great importance is the fact that the rate of accumulation is saturable at relatively low concentrations in the tubule lumen.27 This means that toxicity is not concentration dependent but rather time dependent. The implication is that high peak concentrations are just as safe as low peak concentrations. Once saturated, the rate-limiting step of tissue accumulation becomes the duration of exposure. Because EID produces a drug-free period near the end of the dosing interval, it reduces the amount of time drug can accumulate, potentially reducing toxicity. In vivo studies have confirmed that EID reduces renal accumulation.28 It has been shown that a threshold of accumulation is needed before nephrotoxicity is produced and that this threshold is typically reached after 5 to 7 days of therapy.29 Importantly, using EID prolongs the time to toxicity but the risk is not abolished. Once the duration of therapy exceeds 1 week, toxicity increases substantially regardless of dosing strategy. Duration of therapy was found to be a significant risk factor for toxicity in a cohort of elderly patients receiving once-daily aminoglycoside therapy.30 The incidence of nephrotoxicity was only 3.9% in the 51 patients who received aminoglycoside therapy for less than 7 days compared to 30% in the 37 patients who received 8 to 14 days of therapy, and 50% of 8 patients receiving more than 14 days.
Vancomycin
Methicillin-resistant Staphylococcus aureus (MRSA) remains one of the most important pathogens causing infection in critically ill patients.31 Vancomycin has been the drug of choice for treating this pathogen for nearly 50 years. It inhibits cell wall formation in gram-positive bacteria in a similar fashion to the action of β-lactams. However, vancomycin binds a different receptor and produces a slower bactericidal effect. This slow bactericidal activity likely explains the slower symptom resolution and higher failure rates with vancomycin compared to β-lactams in the treatment of MRSA infections.32 The current breakpoint for vancomycin susceptibility against Staphylococcus species is an MIC of 2 mg/L.33 In recent years, studies have identified MIC to be an important indicator of response to vancomycin therapy, which serves as a good example of how MIC can modify the ability of dosing regimens to achieve PD targets.34
It was unclear for many years which PD parameter correlated best with vancomycin activity. Because vancomycin, like the β-lactams, inhibits cell wall formation, one might presume T > MIC to be the best parameter. This assumption is supported by in vitro models showing that bacterial killing rate is concentration independent once above the MIC.35 Other models show total drug exposure, as measured by the 24-hour AUC, to be more important for clinical response. In a study of patients with lower respiratory tract infection, Moise-Broder and coworkers found the AUC:MIC ratio to predict clinical response better than T > MIC.36 They found a sevenfold increased probability of clinical cure and a decreased time to bacterial eradication when the AUC:MIC ratio was at least 400. No correlation with outcome was found for T > MIC. The discrepancy between vancomycin PD targets identified with in vitro models and human data underscores the importance of understanding the role of protein binding and tissue penetration. This is especially important for critically ill patients who can have altered tissue permeability and serum protein concentrations. Despite these limitations, total AUC:MIC ratio seems to be the best predictor of vancomycin activity and provides a parameter that can be easily monitored at the bedside.
Vancomycin dosing guidelines published in 2009 state that an AUC:MIC ratio of 400 or greater is the most appropriate PD target and that vancomycin trough concentrations should be monitored as a surrogate for AUC.37 The guidelines recommend targeting steady-state trough concentrations of 15 to 20 mg/L for infections difficult to treat such as endocarditis, osteomyelitis, bacteremia, meningitis, and pneumonia. These troughs will achieve an AUC:MIC ratio of 400 or greater for pathogens with an MIC less than 1 mg/L. It is important to note that the success of this trough target is dependent on pathogen MIC. Mathematical simulations show that trough concentrations of 15 to 20 mg/L are unable to achieve target AUC:MIC ratios when the pathogen MIC is greater than 1 mg/L.38 These simulations are supported by a recent meta-analysis that found a 64% relative increase in mortality risk when comparing high MIC (>1.5 mg/L) isolates to low MIC (<1.5 mg/L) isolates.34 Although most MRSA isolates still have an MIC of 1 mg/L or less, many institutions have documented gradual increases in the number of isolates with MIC greater than 1 mg/L over the past decade.39
MRSA isolates with a high MIC represent a currently unsolved therapeutic dilemma. An intuitive solution would be to increase target trough concentration in hopes of achieving target AUC:MIC. Steady-state troughs of 25 to 30 mg/L would reliably achieve AUC:MIC ratios greater than 400 against an MIC of 2 mg/L. This strategy would likely be unfeasible, however, as recent data have linked high troughs with increased risk of nephrotoxicity. One observational study showed the risk to increase when the initial trough concentration was greater than 20.40 This finding is in agreement with data from a recent randomized clinical trial comparing vancomycin to linezolid for treatment of pneumonia.41 The rate of nephrotoxicity was increased in patients who receive vancomycin compared to linezolid (18.2% vs. 8.4%, respectively). In addition, a dose response was observed in the vancomycin arm: toxicity was observed in 37% of patients with initial trough greater than 20 mg/L, 22% when initial trough was 15 to 20 mg/L, and 18% when initial trough was less than 15 mg/L. Although these data use trough concentration to assess the dose:response relationship, trough is closely correlated with peak concentration and total AUC. Consequently, it is unclear which parameter is most closely associated with toxicity. An observational study showed continuous IV (CIV) infusions of vancomycin to have a slower rate of onset of nephrotoxicity compared to intermittent IV (IIV) infusion despite having similar cumulative doses in the two groups.42 This study suggests that toxicity may be related to high peak concentrations, although more data are needed to verify these findings. The only randomized clinical trial to date of this strategy found no difference in safety or efficacy of continuous versus intermittent IV vancomycin.43 Consequently, until more data are available, targeting troughs above 15 to 20 mg/L or the use of high-dose CIV infusions cannot be recommended.
Another option for treating high MIC isolates is to use alternative agents with activity against MRSA (i.e., linezolid, daptomycin, telavancin, and ceftibiprole). However, to date no agent has definitively been shown to provide improved outcome compared to vancomycin in the general treatment of MRSA. Additionally, few data are available that compare agents specifically in patients with high MIC isolates, and cross-resistance between vancomycin and alternative agents has been noted.44
The Effect of Critical Illness on Pharmacokinetics and Pharmacodynamics
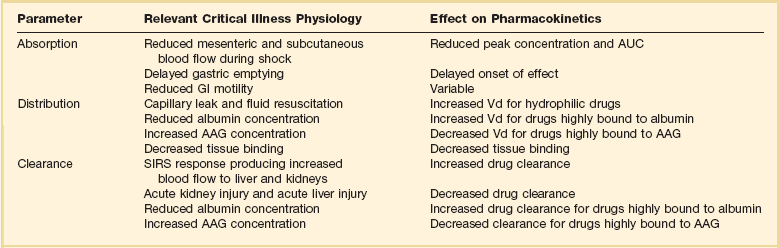
Understanding the basic concepts of PK and PD is essential to providing safe and effective drug therapy. However, the physiologic derangements found in critically ill patients can significantly alter PK/PD relationships, which can lead to both exaggerated and diminished pharmacologic response with standard dosing regimens. Consequently, the ICU clinician must integrate a thorough understanding of critical illness physiology with PK/PD principles to provide appropriate drug therapy. A summary of these changes can be found in Table 20.2.
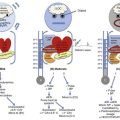
The systemic inflammatory response syndrome (SIRS) is present to some degree in nearly all critically ill patients. Common insults such as sepsis, trauma, surgery, the acute respiratory distress syndrome, and pancreatitis all produce SIRS. Salient features of SIRS are increased heart rate, decreased arterial vascular tone, and increased vascular membrane permeability.45 Without adequate fluid resuscitation the result is low intravascular volume, inadequate preload, and subsequent low cardiac output. As a result, blood flow to organs such as the liver and kidneys can be compromised, leading to decreased drug clearance and serum and tissue accumulation. This physiology is commonly seen in patients admitted with sepsis when adequate resuscitation has not yet occurred. Fluid resuscitation restores preload and increases cardiac output. Because of increased heart rate and low systemic vascular resistance, patients with resuscitated SIRS or sepsis frequently have hyperdynamic physiology in which organ blood flow can be higher than normal.46 Consequently, drug clearance will also be higher than normal. This change is of special concern in patients with sepsis as it may lead to increased antibiotic clearance, suboptimal PD achievement, and worse treatment response.47 Low serum levels of cephalosporin antibiotics have been documented in septic patients given standard doses.7 In addition, the need for increased dosing frequency has been documented for trauma patients treated with vancomycin.48 Although there are no clinical trial data examining this issue, there is a physiologic rationale to administer higher doses or extended infusions of β-lactams and other renally cleared drugs to patients with hyperdynamic physiology.47 This is likely most pertinent during the first 48 to 72 hours of treatment for patients with sepsis. Importantly, sepsis also frequently leads to organ dysfunction including acute liver and kidney injury. As a result, dosing decisions need to be reassessed daily. Careful assessment of renal and hepatic clearance is required and must be combined with prudent judgment of the risk-benefit ratio of each individual drug. Clinicians may err on the aggressive side of dosing decisions for drugs with a wide therapeutic index such as the β-lactam antibiotics. Conversely, the risk-benefit ratio may support more conservative dosing decisions for drugs that have serious dose-related toxicity such as antiarrhythmic agents and anticoagulants.
The amount of fluid resuscitation required to maintain intravascular volume in patients with SIRS can be significant. Early goal-directed therapy of sepsis frequently results in patients having a net gain of more than 10 L of fluid during treatment.49 Significant increases in fluid balance are not limited to sepsis, but are also found in postsurgical patients, trauma patients, and patients with ARDS.50,51 These changes in fluid balance combined with the capillary leaks produced by SIRS can have significant effects on the Vd of hydrophilic drugs. The aminoglycoside antibiotics serve as a prototypical example. The average Vd of aminoglycosides is 0.25 L/kg in non–critically ill patients.52 This value is compared to an average of 0.36 L/kg in general surgical and 0.75 L/kg in medical ICU populations, respectively.53,54 In addition to being significantly increased, there can be a great deal of variability in Vd among patients. In a general surgical population aminoglycoside Vd has been reported to range from 0.14 L/kg to 0.67 L/kg. These increases in Vd result in decreased peak concentrations with a given dose. Owing to the linear kinetics of aminoglycosides a doubling of Vd will decrease peak concentration by one half. Thus, in EID of tobramycin a typical 5 mg/kg dose in a patient with a Vd of 0.25 L/kg would result in a peak of 20 mg/L, although a patient with a Vd of 0.5 L/kg would have a peak of 10 mg/L. The patient with the smaller Vd (0.25 L/kg) would achieve the target peak:MIC ratio of 10 for treatment of a Pseudomonas aeruginosa isolate with an MIC of 2 mg/L. However, the patient with the Vd of 0.5 L/kg would achieve a suboptimal peak:MIC ratio of 5.
In addition to changes in organ blood flow and volume status, critically ill patients also have altered serum protein concentrations, which can have important effects on drugs that are highly protein bound. The two most important serum proteins that contribute to drug binding are albumin, which binds mostly to acidic drugs, and α1-acid glycoprotein (AAG), which binds mostly to basic drugs. A variety of factors contribute to altered serum protein concentration, including malnutrition, hemodilution, and the acute phase response.55 Interestingly, the acute phase response has a variable effect on these proteins: albumin decreases while AAG increases.56 A change in serum protein concentration alters the unbound fraction of drug in the serum. Determination of the effects of altered free drug fraction requires consideration of the following: only the free fraction produces pharmacologic effects; only the free fraction is available to distribute into tissues; and only the free fraction is available to be cleared from the body. Increased free fraction produces increased Vd and clearance. The net effect of these changes is a lower total serum concentration with relatively unchanged absolute free concentration.57 Because only free drug concentration can bind to target receptors, the change in protein binding does not alter pharmacologic response. As a result, dose adjustments are unnecessary. This is the case for most drugs that are highly protein bound. However, there is a short list of drugs for which changes in protein binding can produce clinically important changes when the drugs are given IV. Such drugs have a high extraction ratio (see discussion under “Hepatic Disease”) and a narrow therapeutic index.57 Examples relevant to ICU practice include midazolam, haloperidol, fentanyl, lidocaine, milrinone, diltiazem, and nicardipine. Decreased serum protein concentration can result in exaggerated free drug exposure, prolonged duration of effect, and increased risk of adverse events. Increased serum protein concentration would produce the opposite: reduced free drug exposure with possible inadequate response. This result would be important for drugs highly bound to AAG, such as lidocaine.56 Unfortunately, there are few data available in critically ill patients that examine the effect of altered protein binding on PK/PD relationships in critically ill patients.
It is perhaps most important to consider the effects of altered protein concentration when monitoring serum concentrations to guide dosing decisions. As described earlier, altered protein binding changes the relationship between total serum concentration and pharmacologic effect, although the relationship between free drug concentration and effect frequently remains unchanged. As a result, using total serum concentration to guide dosing in critically ill patients can lead to erroneous dose adjustments and potential toxicity or therapeutic failure. Although the use of free drug concentration monitoring has been limited mostly to the antiepileptic phenytoin, it may also be useful for other highly protein bound drugs classes, including immunosuppressants and antibiotics.57–59
Special Considerations Regarding Routes of Administration
Although oral administration is useful in critically ill patients, the route may not always be appropriate. Physiologic changes such as decreased mesenteric blood flow, altered GI motility, gastric acid suppression, and gut wall edema can alter the rate and extent of absorption from the GI tract.60 The hemodynamic response to hypotension involves shunting blood flow away from mesenteric circulation, substantially limiting a drug’s access to the systemic circulation.61 Hepatic blood flow may be preserved in the short term owing to the “hepatic buffer” response but is often decreased with prolonged states of low systemic perfusion.62 Low hepatic blood flow will limit hepatic metabolism and result in increased bioavailability of drugs with a large first-pass effect. The net effect of these derangements can be highly unpredictable but often lead to diminished bioavailability. Slow gastric emptying, which occurs in 50% to 60% of critically ill patients, delays the onset of absorption and often results in lower peak serum concentrations.63,64 Despite these changes, the overall exposure as measured by the AUC is not significantly different compared to healthy volunteers.65 Impaired small intestine motility also slows the rate of absorption. However, because residence time in the GI tract will be increased, bioavailability may actually increase for poorly absorbable drugs such as furosemide and ampicillin.2 Carrier-mediated absorption may be limited independent of changes in motility or blood flow as a result of dysfunctional membrane transporters.
There are limited data that describe the effectiveness of oral administration in critically ill patients. Some studies, conducted in patients tolerating enteral feeding, show absorption to be adequate for drugs with normally high bioavailability such as fluconazole and ciprofloxacin.66,67 However, other studies show unpredictable and sometimes inadequate absorption.68 Given this variability and the absence of a useful parameter to monitor GI function at the bedside, the IV route is preferred in patients with hemodynamic instability. The oral route should be reserved for patients who are clinically stable and tolerating enteral feeding. When transitioning medications from IV to oral, it is helpful to begin with agents that have easily measurable effects, such as cardiovascular agents.
The SC route is also used in critically ill patients, most commonly for insulin administration and pharmacologic venous thromboembolism (VTE) prophylaxis. Unfortunately, few studies examine the PK of SC administration in critically ill patients. The available data are limited to a few small studies of the low-molecular-weight heparins. Dorffler-Melly and associates compared anti–factor Xa activity produced by prophylactic doses of enoxaparin in three groups: non-ICU patients, ICU patients, and ICU patients receiving vasopressors. Peak anti–factor Xa activity was decreased by 60% in patients receiving vasopressors.69 In another study, only 28% of patients on vasopressors achieved the target anti–factor Xa level after receiving 3000 IU of certoparin daily.70 Although these data are provocative, the clinical importance of low anti–factor Xa levels is unclear. Some reports have correlated low levels with thrombosis, whereas others have not.71,72 Despite this uncertainty, recent investigations have begun to examine the effect of higher doses and use of the IV route for VTE prophylaxis.73,74 Not surprisingly, the data show that increased doses lead to increased drug exposure and higher anti–factor Xa levels. Although higher levels may decrease thrombosis risk, they may also increase bleeding risk. As such, outcome data from large clinical trials are needed before such strategies can be recommended.
Drug-Dosing Considerations in Select Critical Care Populations
Renal Disease
Acute kidney injury (AKI) is a common occurrence in the ICU. Using a consensus definition, rates of AKI range from 10% to 30% in the general ICU population, and 40% to 60% in patients with severe sepsis and septic shock In addition, approximately 5% will require some form of hemodialysis.75 This frequency is an important concern for drug dosing because renal elimination is one of the two primary routes of drug clearance. Therefore, it is important for ICU practitioners to understand the basic approach to renal drug dosing.
Assessing Renal Function
Accurate assessment of renal function is imperative to make appropriate dosing decisions. This assessment may include a measurement or estimate of the glomerular filtration rate (GFR). Inulin is the gold standard for the assessment of renal function.76 However, owing to limited availability and high cost, it is rarely used outside a research setting. In its place creatinine is frequently used as a marker for renal function as it is produced at a fairly constant rate and is largely removed by glomerular filtration. The most reliable method that employs creatinine is via a timed urine creatinine collection. A 24-hour collection is ideal to account for changes that may occur in volume status, hemodynamics, or organ function throughout the day. However, a 24-hour collection period has multiple opportunities for error and is often impractical because a practitioner must wait longer than 24 hours to assess a patient’s renal clearance. As a result, shorter durations of collection have been examined. Unfortunately, the results are varied, with some investigators demonstrating poor correlation with collections less than 8 hours and others showing good correlation with collections as short as 2 hours.77,78 Consequently, the ideal duration of collection is unclear. In addition, it is important to note that timed urine collections are not free from bias in critically ill patients. One report found both a 30-minute and 24-hour urine creatinine collection to be significantly biased compared to inulin clearance.79 Despite this limitation direct measurement of urine creatinine can still be useful to make dosing decisions in patients who are receiving narrow therapeutic index drugs or are at the extremes of age or weight.
Although direct measurement is ideal, most practitioners use equations to estimate renal clearance due to inherent limitations in the collection process. Equations exist to estimate both the GFR and also CrCl. Table 20.3 lists the two most commonly used equations and considerations for their use.80–82 There has been much clinical debate as to the optimal equation to use for drug dosing. Historically the most frequently used method has been the Cockcroft-Gault (CG) equation, which provides an estimate of CrCl. This choice is primarily due to the fact that most available dosing recommendations are based on PK studies that estimated renal function with the CG equation.83 More recently, the Modification of Diet in Renal Disease (MDRD) equation has become widely used clinically as an estimate of GFR. It has been primarily used for staging of kidney disease, and at one time recommendations were to avoid using it for drug dosing. This proscription was largely based on the fact that numerous studies have compared the CG and MDRD equations and have shown discordance between drug-dosing recommendations derived from the two equations.82 Despite these data, in 2009 the National Kidney Disease Education Program suggested that either equation could be used for drug dosing purposes.83 Many practitioners continue to use the CG equation because of its ease of use, because of its familiarity, and because many dosing recommendations were derived from this equation. Several other less frequently used equations to estimate CrCl or GFR can be found in more detailed reviews on estimating renal clearance.76
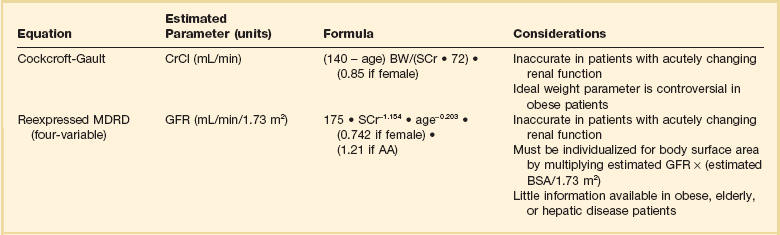
Regardless of which approach to renal function assessment is used, it is important to remember that all have limitations. Because changes in serum creatinine are delayed in comparison to changes in actual renal function, calculations based on this marker will be unreliable in rapidly changing renal function. These equations will overestimate renal function when creatinine is increasing and may underestimate renal function when creatinine is decreasing. Other patient populations that require specific considerations are patients at the extremes of weight and elderly patients. Both CG and MDRD equations have varied results in patients older than 65 years of age. The MDRD equation has been shown to overestimate kidney function in elderly patients, and the CG equation may either overestimate or underestimate renal clearance.84,85 Obese patients also present problems when determining renal clearance for the purposes of drug dosing. The MDRD equation has been shown to underestimate renal clearance in obese patients, and the CG equation overestimates renal clearance in obese patients when the total body weight (TBW) is used.86 To date no estimating equation has been validated for use in the obese patient population. If an estimating equation is to be used, some data suggest the weight selected should be based on the degree of obesity. A study by Pai and colleagues suggests using TBW in overweight patients (BMI [body mass index] < 30 kg/m2), adjusted body weight (ABW) in obese patients (BMI 30 to <40 kg/m2), and lean body weight (LBW) in morbidly obese patients (BMI ≥ 40 kg/m2).87
Dosing in Renal Replacement Therapy
Several factors contribute to drug clearance in patients receiving renal replacement therapy (RRT). They can generally be broken down into dialysis, drug, and patient factors. The two methods by which dialysis can remove drugs are diffusion and convection. Diffusion is a passive process during which substances move down a concentration gradient across a dialysis filter. It is the more effective method of drug removal during RRT and is influenced by dialysis filter surface area and composition.88 Convection is an active process during which drugs are removed through pressure gradients. Convection removes a smaller percentage of drug and is more dependent on dialysis factors including flow rates and the sieving coefficient of the drug.89 However, sieving coefficients are not readily available for most drugs, and therefore the fraction of unbound drug is often used to assess the likelihood of drug clearance.
The three main drug factors that affect clearance are molecular weight, protein binding, and Vd. Drugs with molecular weights exceeding 1000 daltons are not effectively removed by low flux dialysis membranes. However, they may be removed to a larger degree by “high flux” dialysis membranes.89 Similar to endogenous clearance mechanisms, clearance by RRT is inversely related to the degree of protein binding and Vd. Because large Vd (>1.5 L/kg) drugs distribute well into tissue, there is limited drug in the serum to be removed, whereas small Vd drugs (<0.7 L/kg) reside primarily in the serum, increasing the likelihood of removal. Other drug factors that may impact clearance are water solubility and plasma clearance. Patient factors include those that affect protein binding (i.e., pH, serum albumin, other drugs, disease states), Vd (volume status, fluid resuscitation), and concomitant organ function.89,90
A number of different methods of RRT may be used in critically ill patients including both intermittent and continuous durations. Because intermittent hemodialysis (IHD) is the most commonly used form of dialysis, drug clearance data are more readily available. As a result, most drug information references will provide dosage recommendations for IHD. Continuous renal replacement therapy (CRRT), on the other hand, provides a number of challenges as there is a lack of pharmacokinetic studies with many drugs. The data that do exist often differ from study to study and are highly dependent on a number of differences including filter composition and surface area, duration of procedure, pre- or postreplacement fluid administration, and flow rates of blood, dialysate, and ultrafiltrate.88,90 Therefore, it is important that practitioners evaluate these characteristics for similarities and differences with their patients before applying any dosing recommendation. An in-depth review of the types of RRT and degree of drug removal is beyond the scope of this chapter, but several references are available that provide this information.90,91 However, the general degree of drug removal is as follows: continuous venovenous hemodiafiltration > continuous venovenous hemodialysis > continuous venovenous hemofiltration > slow extended daily dialysis > intermittent hemodialysis.90
Once a dosing recommendation has been made in patients receiving CRRT it is important to continue monitoring patients for changes in their dialysis prescription and residual renal function. Dialysis flow rates and ultrafiltration rates often change on a daily basis and can result in alterations in drug clearance. Although CRRT implies that a patient is receiving treatment for 24 hours per day this is frequently not the case. In fact, the reported mean daily stop times for CRRT range from 3 to 8 hours per day owing to a number of reasons including filter clotting, radiologic procedures, catheter exchange, patient mobilization, and surgery.92,93 As discussed previously, because it is difficult to estimate drug clearance in patients receiving RRT, careful assessment of the risk-benefit ratio between effectiveness and toxicity is required.
Hepatic Disease
The liver serves as the primary site for drug metabolism, and therefore, drug dosing is an important consideration in any patient with hepatic disease. Hepatic drug clearance (CLH) is an extremely complex process, dependent on hepatic blood flow (QH) and the hepatic extraction ratio (EH). The hepatic extraction ratio depends on QH, intrinsic clearance of unbound drug (CLint), and the fraction of unbound drug in blood (fu).94 The following equations can be used to estimate CLH:
Low extraction ratio drugs are more sensitive to changes in drug protein binding and enzyme activity (i.e., CLint) and are affected to a lesser degree by changes in blood flow. Plasma protein binding of drugs is decreased in hepatic disease due to a number of reasons including decreased protein production (albumin, AAG) and accumulation of endogenous compounds, which inhibit protein binding. As mentioned previously, this decrease in protein binding can increase free drug exposure for certain drugs, increasing the risk of adverse effects. Intrinsic hepatic clearance is the ability of the liver to clear unbound drug from the blood. It is highly dependent on the activity of metabolic enzymes and hepatic transporters. These processes may be altered in chronic liver disease, resulting in decreased drug metabolism. The two phases of hepatic metabolism are phase 1 (i.e., hydrolysis, oxidation, reduction) and phase 2 (i.e., acetylation, glucuronidation, sulfation). The cytochrome P-450 family of enzymes is responsible for approximately 75% of drug metabolism and is classified as phase 1 reactions.95 Phase 1 metabolism is dependent on molecular oxygen and is thought to be more sensitive to changes that result in decreased oxygen delivery such as to shunting, sinusoidal capillarization, and reduced liver perfusion.94,96 Although data demonstrate that enzyme activity is decreased with increasing disease severity, the decreases are variable and nonuniform across the different CYP450 isoenzymes. Although phase 2 metabolism was historically thought to be spared in patients with liver disease, recent data suggest that it is impaired in patients with advanced cirrhosis as well.94
Assessing Hepatic Function
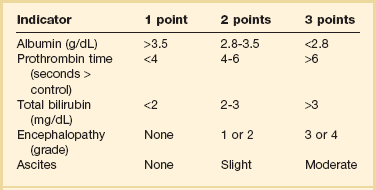
Unfortunately, owing to the complexity of hepatic elimination there are few data to guide drug dosing recommendations in these patients. One of the primary reasons is that a simple method to quantify liver function does not exist. Liver transaminases (i.e., aspartate aminotransferase [AST], alanine aminotransferase [ALT]) are markers of hepatocellular injury and do not reflect synthetic function. Although international normalized ratio (INR) and albumin reflect synthetic capacity they do not adequately capture the complex process of drug metabolism. Although scoring systems have been developed to assess severity of liver disease, no score has been developed for the sole purpose of drug dosing. Although not designed for drug dosing, the Pugh modification of the Child-Turcotte scoring system has been shown to predict changes in drug clearance that occur in hepatic disease.97 The scoring system can be found in Table 20.4.97 The utility of this score has led to the Food and Drug Administration (FDA) recommendation that it be used to categorize degree of liver impairment in patients enrolled in hepatic PK studies completed during drug development.98 There are several limitations to its use in the ICU setting. Unlike equations used in renal disease the Child-Pugh scoring system does not quantify the ability of the liver to metabolize specific drugs. Moreover, it has not been validated in patients with acute liver dysfunction. In addition, it may be influenced by factors in critically ill patients that are not related to liver dysfunction (i.e., depressed albumin from the acute phase response). Despite these limitations, it is still the most useful tool to assess hepatic function at the bedside. Another scoring system, primarily used for prioritizing liver transplantation recipients, is the Model for End-Stage Liver Disease (MELD) score. It has not been adequately studied for drug dosing, and therefore, recommendations should not be made based on the score.
Dosing in Hepatic Disease
In critically ill patients with chronic hepatic disease it is important that a Child-Pugh score be calculated to assess the degree of liver impairment. Dosing recommendations based on Child-Pugh score are included in the package labeling for many medications and should be referenced when available. When there are no recommendations based on Child-Pugh score, a decision must be made based on clinical judgment. Some general considerations include avoiding drugs metabolized by the CYP450 system in favor of drugs that undergo phase 2 metabolism (i.e., glucuronidation) or renal elimination. If all available choices undergo phase 1 metabolism, then consider the agent with the shortest duration of action. Because the first-pass effect may be reduced in the setting of hepatic dysfunction consider reduced doses of high extraction ratio drug (i.e., drugs which normally have low bioavailability) when using the oral route of administration. Reduce maintenance doses of low hepatic extraction ratio drugs (i.e., drugs with good bioavailability). Although there are few data to support a specific dose reduction with most medications, a reduction of at least 50% is probably warranted in patients with severe disease. A number of valuable references provide more detailed dosing recommendations on a number of medications, and they should be consulted prior to making dosing decisions in these patients.99–102
Obese Patients
Approximately 30% of adults in the United States are considered obese.103 Available data suggest upward of 25% of all patients admitted to ICUs can be categorized as obese, with 6% to 7% of patients being morbidly obese.104,105 These alterations in body weight present potential pharmacokinetic challenges with many drugs that have not been adequately studied in this population.
Pharmacokinetic Alterations in Obesity
The two primary pharmacokinetic parameters, Vd and clearance, may be altered in obese patients. The increase in adipose tissue seen in obesity may lead to an increase in Vd for highly lipophilic drugs. This can result in two important changes: a decrease in peak concentration and an increased half-life (see previous discussion of half-life under “General Pharmacokinetic Principles”). The result may be a reduced response to initial doses and an increase in time to reach steady state. The effects of obesity on clearance are less clear. Some studies have shown increased renal and hepatic blood flow in obese individuals, which should lead to increased clearance. In addition, there is evidence of glomerular hyperfiltration in obese patients.106 Less clear is how clearance changes with increasing degrees of obesity and how clearance correlates with different body weight parameters. Leading hypotheses related to these questions include the following: (1) Obese individuals exhibit higher absolute clearance than normal weight comparators, (2) clearance does not increase in a linear fashion with TBW, and (3) clearance and LBW are linearly correlated. Unfortunately, not all drugs are affected to the same degree by obesity, and therefore, pharmacokinetic considerations must be made on a drug-drug basis.106,107
Dosing Considerations
The first step in determining a drug dosage for an obese patient is deciding what weight to use. This presents a significant challenge as the ideal weight parameter to use for drug dosing varies among agents. Drugs may be dosed based on ideal body weight (IBW), ABW, TBW, LBW, or body surface area (BSA) (Table 20.5).108–110 TBW may be appropriate for very lipophilic drugs, as Vd increases in a nearly linear fashion with body weight.106 Drugs with moderate lipophilicity do not distribute completely into adipose tissue and as a result TBW-based recommendations may lead to overdosing of hydrophilic drugs. The ideal weight to use may also vary based on the patient’s degree of obesity, which is often assessed using BMI or percentage of ideal body weight (% IBW). Obesity is frequently defined using BMI, with the commonly accepted definition being a value greater than 30 kg/m2. However, dosing recommendations based on BMI are frequently unavailable.
Table 20.5
Equations to Determine Body Size Indicators
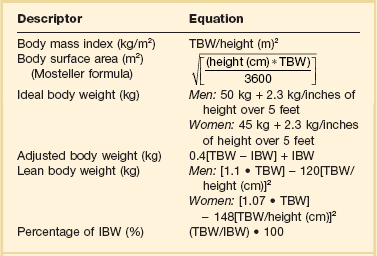
IBM, ideal body weight (in kg); TBW, total body weight (in kg).
Because hydrophilic drugs do not distribute well into adipose tissue other adjustment factors are often used. LBW can be a useful predictor of pharmacokinetic behavior of drugs that are highly water soluble as it accounts for nonfat cell mass and intercellular connective tissue. The term IBW was based on historical data that compared the relative mortality rate of people of different height-weight combinations. It has frequently been used as a surrogate for LBW in many pharmacokinetic studies due to ease of use.111 Some lipophilic drugs that have an increased Vd in obese patients are dosed based on ABW. Different correction factors have been used to calculate ABW, but the most common factor is 0.4. The equations to calculate these values are listed in Table 20.5.
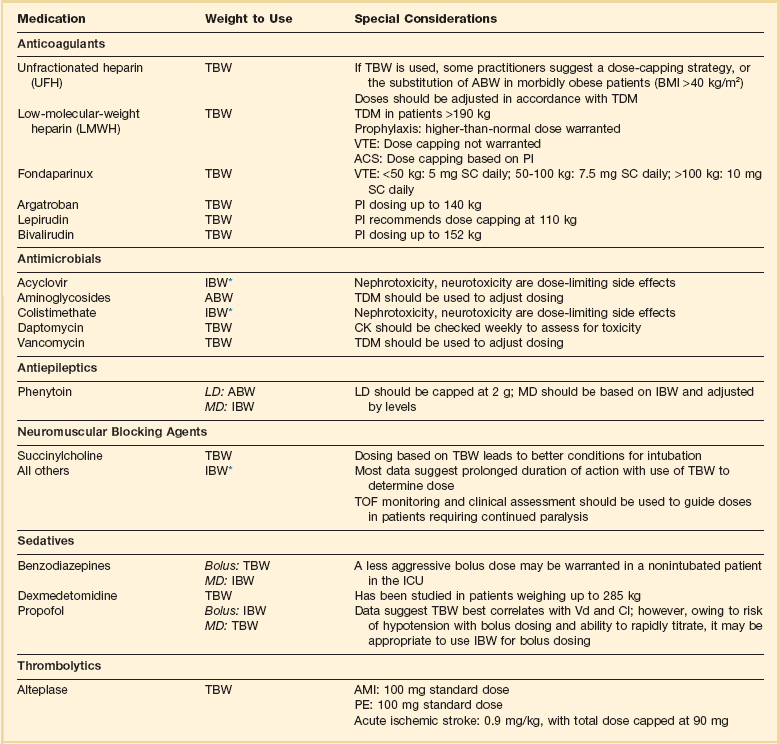
As with renal and hepatic disease it is imperative to assess the risk-benefit ratio with each drug prior to making any dosing decisions in obese patients. Some drugs have been studied using different weight parameters and it is always beneficial to know this information prior to deciding on a drug dose. A list of commonly used ICU medications and weight parameters that should be used is provided in Table 20.6.107,112–125 Perhaps more concerning is the uncertainty regarding the effect of obesity on the PK/PD of drugs that use fixed doses.
Dosing Considerations with Specific Agents in Obesity
Antimicrobials
Using the appropriate weight to dose antimicrobial drugs is extremely important, as underdosing may lead to therapeutic failures and overdosing may lead to toxicity (i.e., nephrotoxicity with aminoglycosides or acyclovir). Unfortunately, data are limited for many commonly used antimicrobials. Aminoglycosides are one of the most widely studied antibacterial drugs in obese patients owing to their narrow therapeutic index and widespread availability of serum concentrations. Studies suggest increased aminoglycoside Vd (9-58%) and renal clearance (15-91%) in obese patients.122 Their hydrophilic structure and small Vd suggest incomplete adipose distribution, and in fact studies have identified ABW as the optimal weight parameter.122 Because both clearance and Vd exhibit substantial variability in obese patients it is extremely important that therapeutic drug monitoring be used to optimize aminoglycoside dosing in this cohort.
As with aminoglycosides, numerous studies in the literature evaluate vancomycin kinetics in obesity. These studies demonstrate variable changes in Vd and increased clearance in obesity.122 Current vancomycin guidelines recommend that patients should be dosed on TBW with adjustments in dosing regimen based on therapeutic drug monitoring.37 However, this is somewhat controversial as patients weighing more than 100 kg would receive loading doses exceeding 2 g. These are substantially larger than what has been used in the past, and in light of the uncertainty regarding nephrotoxicity with increasing trough level, some clinicians may not be comfortable with this aggressive approach to loading doses. However, with the AUC:MIC ratio being the pharmacodynamic parameter that best correlates with clinical efficacy, weight-based dosing with TDM should be used to optimize therapy.
Other available antimicrobials that are dosed based on weight include acyclovir, colistimethate sodium, daptomycin, and sulfamethoxazole/trimethoprim (SMX/TMP). Acyclovir is a relatively hydrophilic drug, and therefore IBW should be used for dosing in obese patients.112,126 Nephrotoxicity has been reported in obese patients who receive acyclovir dosed on TBW.127 Data regarding the optimal dosing weight for colistimethate sodium are limited. However, one recent study suggests using IBW unless the patient’s TBW is less than IBW.128 Currently available data with daptomycin suggest dosing based on TBW.129 However, patients must be monitored for elevations in creatine kinase (CK) on a weekly basis as rhabdomyolysis would be the primary adverse effect of concern. There are insufficient data to make a recommendation on dosing of the lipophilic antibiotic SMX/TMP in obese patients. If available and high-dose SMX/TMP therapy is necessary, therapeutic drug monitoring should be used to guide dosing.
Sedatives
Benzodiazepines, dexmedetomidine, and propofol are the most commonly used sedatives in the ICU. The benzodiazepines are highly lipophilic compounds that have significantly increased Vd and clearance in obese patients.130 Because they demonstrate an increased Vd the use of TBW has been suggested for bolus doses of benzodiazepines. However, the risk of respiratory depression in patients without an advanced airway is an important consideration. Because the parenteral benzodiazepines all have relatively rapid onset the use of smaller doses based on IBW repeated every 5 to 15 minutes is a reasonable approach in patients without an advanced airway. In one study midazolam half-life was increased nearly threefold in obese patients.119 This effect increases the risk of accumulation, oversedation, and delirium in obese patients, especially with continuous infusions. When benzodiazepines must be used, intermittent doses based on IBW are preferred.
Although propofol is a highly lipophilic compound, available data do not demonstrate changes in Vd or clearance in obese patients. This information would suggest that TBW should be used for maintenance doses in this patient population.124,131 However, propofol is associated with several significant adverse effects including hypotension with bolus dosing and the life-threatening propofol-related infusion syndrome (PRIS) with high doses or extended durations of infusion. Owing to the hemodynamic complications associated with propofol an initial bolus based on IBW followed by additional small doses might be reasonable. Because it is a short half-life drug it can be rapidly titrated to effect. High doses and the risk of PRIS represent a more complicated therapeutic dilemma. One of the recognized risk factors is a dose of propofol exceeding 83 µg/kg/minute.132 It is not known how dosing based on TBW vs. IBW would affect the development of PRIS. Therefore, these patients should be closely monitored for symptoms of PRIS including metabolic acidosis, lactate, hyperkalemia, rhabdomyolysis, an elevated CK, or cardiac failure. If these symptoms develop, they should have propofol stopped immediately.132 Pharmacokinetic data for dexmedetomidine in critically ill patients is not readily available. However, dexmedetomidine has been studied in patients up to 285 kg using TBW and the manufacturer provides dosing recommendations based on TBW for patients weighing up to 185 kg.125 If TBW is used, then it is important that the dose be titrated to effect with monitoring for hypotension and bradycardia.
Anticoagulants
Anticoagulant dosing in obesity presents challenges because overdosing may result in bleeding complications and underdosing can result in worsening of thrombosis. Weight has been reported to be the single best predictor of unfractionated heparin (UFH) requirements with numerous weight-based nomograms being published.133 TBW is frequently used for UFH dosing in nonobese and non–morbidly obese patients. However, the exact weight parameter that should be used in morbid obesity (BMI > 40 kg/m2) is unclear. When TBW is used in morbid obesity there is a higher rate of supratherapeutic activated partial thromboplastin time (aPTT).134,135 Despite the potential for higher than anticipated aPTTs several studies reported no difference in major bleeding events or rates of primary event recurrence when UFH was dosed on TBW.136,137 Owing to the lack of prospective data in this patient population some practitioners recommend dosing on an ABW or a dose-capping strategy if TBW is used.134,138 This decision may be influenced by the indication and risk for bleeding with practitioners using a more aggressive approach in the treatment of VTE and a less aggressive dosing approach for atrial fibrillation or acute coronary syndrome (ACS). Regardless of what weight is used for the bolus dose, the subsequent infusion should be adjusted based on therapeutic drug monitoring.
Unlike UFH there has been significantly more research on the ideal weight parameter for low-molecular-weight heparins (LMWHs) with TBW being identified as the best predictor of LMWH requirements.121 Pharmacodynamic data for LMWHs are available in patients weighing up to 190 kg.139 Because of the limited data in patients more than 190 kg some practitioners recommend a dose-capping strategy at this weight. Although a dose-capping strategy may seem prudent, there are no data to suggest this will limit bleeding risk while still achieving the therapeutic goal. With this in mind a more prudent approach is to use TBW for VTE treatment doses in patients weighing more than 190 kg combined with TDM to avoid excessive exposure. If TDM is used, an anti–factor Xa level should be checked 4 hours after the third dose of a LMWH. Because VTE doses are not weight based, current guidelines recommend using an increased fixed dose of LMWH in obese patients.118 However, specific recommendations are not made regarding dose adjustments largely because of variability in the available data. Several available reviews provide a more detailed discussion of the available anticoagulants for prophylaxis, VTE, and ACS in the obese patient population.121,123,140
Elderly Patients
Current estimates from the administration on aging predict that by 2050 approximately 20% of the U.S. population will be older than 65.141 As a result elderly patients will make up a larger percentage of ICU admissions. These patients frequently have multiple chronic diseases and are at increased risk for polypharmacy. Unfortunately, prior to 1990 drug companies were not required to study drugs in elderly patients. This leads to a lack of dosing recommendations that are specific to the elderly patient population.
As individuals age a number of physiologic changes occur that lead to significant pharmacokinetic alterations. Drug absorption may be decreased as a result of changes in gastric pH, gastric emptying, splanchnic blood flow, and GI motility. Half-life and Vd may be increased for lipophilic drugs as a result of increases in body fat and decreases in lean body mass. Hydrophilic drugs will have increased serum concentrations because of decreases in total body water. The free fraction of highly protein bound drugs is increased as a result of decreases in serum protein production. Decreases in hepatic blood flow and hepatic mass may result in decreased hepatic first-pass effect and potentially decreased phase 1 metabolism. Age-related decreases in renal blood flow and GFR may result in impaired renal drug elimination.142 Unfortunately, these changes vary among patients, making drug dosing especially challenging.
In an effort to minimize polypharmacy and adverse drug effects several criteria have been developed to screen medication therapy in elderly patients. The most commonly cited are the Beers’ criteria, originally developed in 1991 and updated in 2012.143 The most recent version includes 53 medications or medication classes divided into 3 categories. A newer set of recommendations that are gaining popularity are the STOPP (Screening Tool of Older Persons’ potentially inappropriate Prescriptions) criteria. They consist of 64 medications or medication classes divided into 10 categories. Both criteria have been validated and at least one should be used in the evaluation of the appropriateness of medications in elderly patients. In addition to the use of screening criteria drug therapy should be started at a low dose and carefully titrated until the lowest effective dose is achieved.
Pregnancy
Pregnancy is a dynamic state with physiologic changes occurring throughout gestation. These changes include alterations in cardiovascular, pulmonary, GI, renal, and hepatic function that may result in clinically significant changes in drug PK.144 Pregnant patients are frequently excluded from PK trials, limiting data that describe PK/PD and fetal adverse effect profiles for many drugs commonly used in critically ill pregnant patients. An in-depth discussion of all drug classes in pregnancy is beyond the scope of this chapter. There are several good review articles in the literature for specific drugs or disease states that should be reviewed prior to using the agents in pregnancy.145,146
Pregnancy Pharmacokinetic Changes
Pregnancy results in multiple physiologic changes that affect absorption, distribution, metabolism, and elimination of various drugs. Absorption may be decreased due to a reduction in GI motility and an increased gastric pH. However, these changes are minimal and therefore are unlikely to significantly alter outcomes. Distribution is potentially increased due to changes in volume (up to 50% increase in blood volume) and decreases in protein binding (up to 30% decreases in albumin). These changes may lead to either lower or higher concentrations of free drug in the serum depending on the properties of the agent administered. Pregnancy increases hepatic blood flow and has variable effects on CYP enzymes. Available data suggest an increased activity of CYP26, CYP2C9, CYP2A6, and CYP3A3 and a decrease in the activity of CYP1A2 and CYP2C19. Renal elimination increases throughout gestation with an 80% increase in renal plasma flow during the second trimester, leading to a 50% increase in GFR. Consequently, pregnant women will often require higher doses of drugs with renal elimination; however, this requirement will change throughout pregnancy.147
In a best-case scenario we would use only category A drugs in critically ill pregnant women. However, because pregnant women are a protected research population they are frequently excluded from clinical trials; therefore, few drugs are listed as category A for pregnancy. Many agents that are category B or C can often be used safely in pregnancy. If available, category A, B, or C drugs should be used. However, if the indicated drug is category D and there are no alternatives, a careful risk-benefit assessment must be undertaken. Many antiepileptic drugs (AEDs) are pregnancy category D, making acute seizure management challenging in pregnancy. Levetiracetam is a pregnancy category C drug and is preferred over other agents. Out of the many AEDs that are category D drugs, valproic acid is believed to have the highest fetal risk and therefore should be avoided.148 Category X drugs are contraindicated in pregnancy. Table 20.7 lists some commonly used ICU drugs and their pregnancy categories.149–153
Table 20.7
Medications Commonly Used in the Intensive Care Unit (ICU)* and Associated Pregnancy Risk
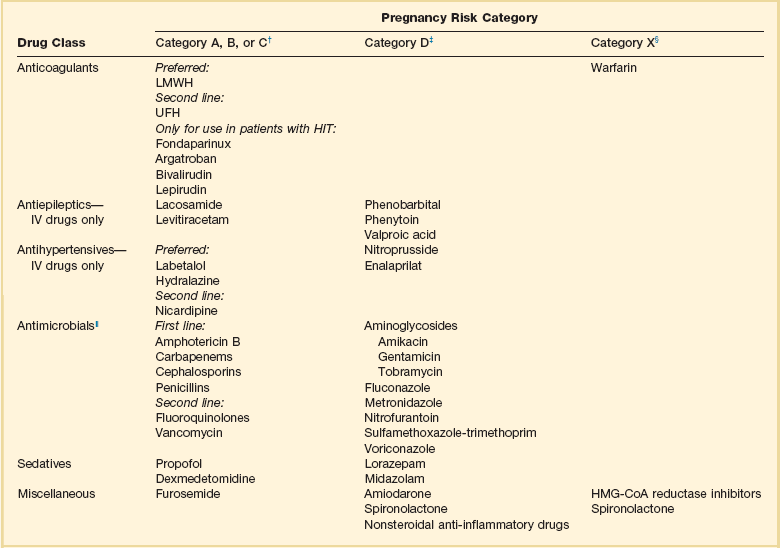
*This list is not all-inclusive. The risk-benefit ratio must be weighed before any drug is used in pregnant patients.
†Human data show no risk or low risk or are lacking.
‡Human data show risk, but risk may outweigh benefit.
||Antimicrobials should not be withheld because of pregnancy, especially if alternatives are associated with worse infection-related outcomes.
Burn Injury
Two phases of burn injury have significant effects on PK and PD. The first 48 hours following injury are characterized by hypovolemia, edema, hypoalbuminemia, and decreases in GFR. The second phase occurs beyond 48 hours and is a hyperdynamic state. During this hyperdynamic phase patients will have increased renal and hepatic blood flow, altered serum protein production, and insensible drug losses through exudate leakage resulting in altered binding, distribution, and clearance.154
The pharmacokinetic changes seen with burn injury vary from patient to patient, making drug dosing recommendations difficult. A 2008 review article discusses the available pharmacokinetic data.154 As with other disease states, therapeutic drug monitoring should be used if available to determine drug doses. Because significant changes in serum proteins are common, the use of levels that detect free drug concentrations are preferred. If free levels are not available, clinicians must be aware that a total level in the therapeutic range does not necessarily reflect an appropriate drug dose. In these situations physical and laboratory assessment to evaluate therapeutic efficacy and adverse effects is warranted. If TDM is not available and the agent is a wide therapeutic index drug, then using maximal drug dosing is acceptable to ensure therapeutic effect.
Hypothermia
The process of cooling patients to mild hypothermia (32-34° C) has been studied for a number of different conditions including traumatic brain injury, spinal cord injury, stroke, cardiac surgery, and cardiac arrest.155 It is most frequently used after cardiac arrest and is currently a recommended treatment in comatose adult patients following out-of-hospital ventricular fibrillation cardiac arrest. In addition, the guidelines from the American Heart Association suggest it may be beneficial for other cardiac arrest patients including in-patients and those with nonshockable rhythms.156 With the increasing prevalence of hypothermia for cardiac arrest and the potential for use in other indications it is important to understand the impact hypothermia has on drug PK.
Hypothermia results in multiple physiologic changes that may impact the kinetics and dynamics of certain agents. Available literature report varied effects of hypothermia on drug absorption, distribution, drug target affinity, and time to onset.157 However, hypothermia has been repeatedly shown to decrease drug clearance. This is especially true for drugs that undergo hepatic metabolism via the CYP450 system. Midazolam is one of the most studied drugs in hypothermia because of its frequent use as a sedative and metabolism by CYP3A4 and CYP3A5. One study in traumatic brain-injured patients cooled to less than 35° C demonstrated a fivefold increase in midazolam serum concentrations and a 100-fold decrease in clearance compared to a group of normothermic patients.158 Data from healthy volunteers predicted an 11% decrease in midazolam clearance for every 1° C decrease in temperature below 36.5° C.159 This is an important consideration, as it may result in a prolonged duration of pharmacologic effect, even after rewarming. Similar results have been reported for other drugs metabolized by the CYP450 family of enzymes.160
Pharmacogenetics
Pharmacogenetics is the study of genetic polymorphisms between patients, and pharmacogenomics takes a genome-wide approach in the study of drug response polymorphisms. The first reports of genetic polymorphisms affecting drug response were published in the 1950s. One of these early reports involved prolonged apnea after succinylcholine administration in patients with a variant of the enzyme responsible for succinylcholine metabolism.161 It has become an area of increasing interest with variants identified that cause alterations in metabolism, transport, and drug interactions.162 Unfortunately, to date few studies have assessed the impact of polymorphisms on agents commonly used in the ICU. A 2010 review discusses some of the genetic polymorphisms that are most likely to impact drug therapy in the ICU.163 As this area of research continues to grow and more data become available it is likely that pharmacogenetics will have a significant impact on care of the critically ill patient.
Genetic variations in metabolism are some of the best understood genetic polymorphisms. Variations have been described for both phase 1 and phase 2 reactions. These variations may result in patients becoming extensive or poor metabolizers and may result in increased toxicity or decreased efficacy. The majority of research has focused on the cytochrome P-450 family because it is responsible for approximately 75% of all drug metabolism. Within the CYP family most research has focused on 2D6, 2C19, and 2C9. The most studied of these enzymes is 2D6, with variants being associated with increased serum concentrations of carvedilol, metoprolol, and flecainide although decreased response is observed with codeine and tramadol. Variants in CYP2C9 are associated with increased dose response to warfarin and variants in CYP2C19 are associated with decreased efficacy of clopidogrel and the proton pump inhibitors.163 Other metabolizing enzymes that have variant alleles include N-acetyltransferase 2 and thiopurine S-methyltransferase. Slow acetylators of hydralazine, procainamide, and sulfamethoxazole are at an increased risk of immune-related toxic conditions such as systemic lupus erythematosus. On the other hand, slow acetylators of isoniazid are at increased risk of neurotoxicity, and rapid acetylators have an increased risk of hepatitis.
Even though a number of commonly used ICU drugs are metabolized by these enzymes, prescribing based on pharmacogenetics and phenotyping is still uncommon. The reasons are multifactorial and are in part due to the lack of data showing improved outcomes and the expenses associated with the tests. In fact, guideline statements recommended against routine pharmacogenetic screening prior to the use of clopidogrel or warfarin.164,165 Until further data are available these recommendations are unlikely to change. Based on current studies there isn’t much of a role for routine pharmacogenetic testing in critically ill patients. However, as more data become available it may become a standard of care in the ICU.
Principles of Therapeutic Drug Monitoring
Several factors make a medication appropriate for TDM: (1) An assay is available that is accurate, specific, and can be conducted in a timely manner, (2) adequate pharmacokinetic data exist for the drug and they show significant interindividual variability, (3) there is a narrow range between therapeutic and toxic effects and these effects are proportional to the serum concentrations, (4) the therapeutic and toxic ranges are clearly defined, and (5) a constant pharmacologic effect is seen over time.166
In general we reserve TDM for drugs that are associated with an increased risk for toxicity due to a narrow therapeutic index. The optimal time to monitor serum drug concentrations is highly dependent upon the drug being used and the patient’s clinical presentation. However, after any dosage change a drug should reach steady state (5-7 drug half-lives) before a serum concentration is checked. There are some exceptions to this rule, for example, after a loading dose of phenytoin or valproic acid in a patient who does not appear to respond or after the first dose of an aminoglycoside if a high-dose extended-dosing nomogram is being used. The other situation when serum concentrations may be checked at different intervals is in a patient who has changing organ function. Table 20.8 lists some drugs that have clearly defined therapeutic concentrations and for which TDM is commonly utilized.52 Several medications are not included in this table because serum drug concentrations are not routinely monitored but markers of their efficacy are monitored (i.e., heparin, LMWHs, direct thrombin inhibitors). In addition, there are a number of other medications for which TDM may become more prevalent in the future but TDM is not currently the standard of care. Some potential examples include β-lactam antibiotics, levetiracetam, and mycophenolate mofetil.
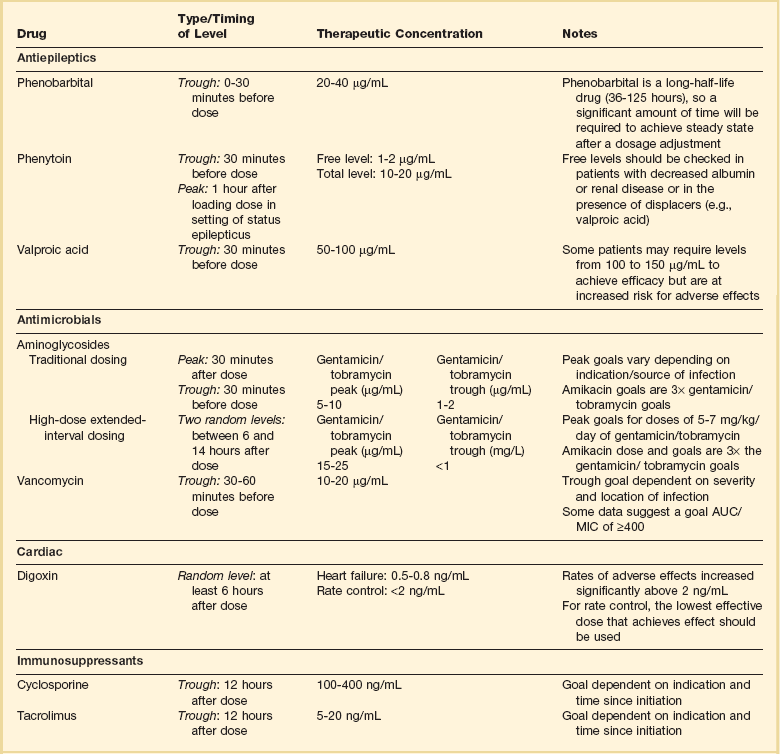
References
1. Shargel, L, Yu, A. Applied Biopharmaceutics and Pharmacokinetics, 4th ed. New York: McGraw-Hill; 1999.
2. Kimura, T, Higaki, K. Gastrointestinal transit and drug absorption. Biol Pharm Bull. 2002; 25:149–164.
3. Boucher, HW, Talbot, GH, Bradley, JS, et al. Bad bugs, no drugs: No ESKAPE! An update from the Infectious Diseases Society of America. Clin Infect Dis. 2009; 48:1–12.
4. Craig, WA. Pharmacokinetic/pharmacodynamic parameters: Rationale for antibacterial dosing of mice and men. Clin Infect Dis. 1998; 26:1–10.
5. Drusano, GL. Antimicrobial pharmacodynamics: Critical interactions of “bug and drug. ”. Nat Rev Microbiol. 2004; 2:289–300.
6. Eagle, H, Fleischman, R, Musselman, AD. Effect of schedule of administration on the therapeutic efficacy of penicillin; importance of the aggregate time penicillin remains at effectively bactericidal levels. Am J Med. 1950; 9:280–299.
7. Lipman, J, Wallis, SC, Rickard, C. Low plasma cefepime levels in critically ill septic patients: Pharmacokinetic modeling indicates improved troughs with revised dosing. Antimicrob Agents Chemother. 1999; 43:2559–2561.
8. Taccone, FS, Laterre, PF, Dugernier, T, et al. Insufficient beta-lactam concentrations in the early phase of severe sepsis and septic shock. Crit Care. 2010; 14:R126.
9. Vogelman, B, Gudmundsson, S, Leggett, J, et al. Correlation of antimicrobial pharmacokinetic parameters with therapeutic efficacy in an animal model. J Infect Dis. 1988; 158:831–847.
10. Bhat, SV, Peleg, AY, Lodise, TP, Jr., et al. Failure of current cefepime breakpoints to predict clinical outcomes of bacteremia caused by gram-negative organisms. Antimicrob Agents Chemother. 2007; 51:4390–4395.
11. Tam, VH, McKinnon, PS, Akins, RL, et al. Pharmacodynamics of cefepime in patients with gram-negative infections. J Antimicrob Chemother. 2002; 50:425–428.
12. Tam, VH, Gamez, EA, Weston, JS, et al. Outcomes of bacteremia due to Pseudomonas aeruginosa with reduced susceptibility to piperacillin-tazobactam: Implications on the appropriateness of the resistance breakpoint. Clin Infect Dis. 2008; 46:862–867.
13. Dandekar, PK, Maglio, D, Sutherland, CA, et al. Pharmacokinetics of meropenem 0. 5 and 2 g every 8 hours as a 3-hour infusion. Pharmacotherapy. 2003; 23:988–991.
14. Kim, A, Sutherland, CA, Kuti, JL, Nicolau, DP. Optimal dosing of piperacillin-tazobactam for the treatment of Pseudomonas aeruginosa infections: Prolonged or continuous infusion? Pharmacotherapy. 2007; 27:1490–1497.
15. Lipsitch, M, Levin, BR. The population dynamics of antimicrobial chemotherapy. Antimicrob Agents Chemother. 1997; 41:363–373.
16. Mouton, JW, den Hollander, JG. Killing of Pseudomonas aeruginosa during continuous and intermittent infusion of ceftazidime in an in vitro pharmacokinetic model. Antimicrob Agents Chemother. 1994; 38:931–936.
17. Boselli, E, Breilh, D, Rimmele, T, et al. Alveolar concentrations of piperacillin/tazobactam administered in continuous infusion to patients with ventilator-associated pneumonia. Crit Care Med. 2008; 36:1500–1506.
18. Tamma, PD, Putcha, N, Suh, YD, et al. Does prolonged beta-lactam infusion improve clinical outcomes compared to intermittent infusions? A meta-analysis and systematic review of randomized, controlled trials. BMC Infect Dis. 2011; 11:181.
19. Nicasio, AM, Ariano, RE, Zelenitsky, SA, et al. Population pharmacokinetics of high-dose, prolonged-infusion cefepime in adult critically ill patients with ventilator-associated pneumonia. Antimicrob Agents Chemother. 2009; 53:1476–1481.
20. Moore, RD, Lietman, PS, Smith, CR. Clinical response to aminoglycoside therapy: Importance of the ratio of peak concentration to minimal inhibitory concentration. J Infect Dis. 1987; 155:93–99.
21. Kashuba, AD, Nafziger, AN, Drusano, GL, Bertino, JS, Jr. Optimizing aminoglycoside therapy for nosocomial pneumonia caused by gram-negative bacteria. Antimicrob Agents Chemother. 1999; 43:623–629.
22. Vogelman, B, Gudmundsson, S, Turnidge, J, et al. In vivo postantibiotic effect in a thigh infection in neutropenic mice. J Infect Dis. 1988; 157:287–298.
23. Skiada, A, Markogiannakis, A, Plachouras, D, Daikos, GL. Adaptive resistance to cationic compounds in Pseudomonas aeruginosa. Int J Antimicrob Agents. 2011; 37:187–193.
24. Chuck, SK, Raber, SR, Rodvold, KA, Areff, D. National survey of extended-interval aminoglycoside dosing. Clin Infect Dis. 2000; 30:433–439.
25. Nicolau, DP, Freeman, CD, Belliveau, PP, et al. Experience with a once-daily aminoglycoside program administered to 2,184 adult patients. Antimicrob Agents Chemother. 1995; 39:650–655.
26. Hatala, R, Dinh, T, Cook, DJ. Once-daily aminoglycoside dosing in immunocompetent adults: A meta-analysis. Ann Intern Med. 1996; 124:717–725.
27. Giuliano, RA, Verpooten, GA, Verbist, L, et al. In vivo uptake kinetics of aminoglycosides in the kidney cortex of rats. J Pharmacol Exp Ther. 1986; 236:470–475.
28. De Broe, ME, Verbist, L, Verpooten, GA. Influence of dosage schedule on renal cortical accumulation of amikacin and tobramycin in man. J Antimicrob Chemother. 1991; 27(Suppl C):41–47.
29. Drusano, GL, Ambrose, PG, Bhavnani, SM, et al. Back to the future: Using aminoglycosides again and how to dose them optimally. Clin Infect Dis. 2007; 45:753–760.
30. Paterson, DL, Robson, JM, Wagener, MM. Risk factors for toxicity in elderly patients given aminoglycosides once daily. J Gen Intern Med. 1998; 13:735–739.
31. Vincent, JL, Rello, J, Marshall, J, et al. International study of the prevalence and outcomes of infection in intensive care units. JAMA. 2009; 302:2323–2329.
32. Kim, SH, Kim, KH, Kim, HB, et al. Outcome of vancomycin treatment in patients with methicillin-susceptible Staphylococcus aureus bacteremia. Antimicrob Agents Chemother. 2008; 52:192–197.
33. Clinical and Laboratory Standards Institute. Performance standards for antimicrobial susceptibility testing, Sixteenth International Supplement. Standard M100-MS16. Wayne, PA: Clinical and Laboratory Standards Institute; 2006.
34. van Hal, SJ, Lodise, TP, Paterson, DL. The clinical significance of vancomycin minimum inhibitory concentration in Staphylococcus aureus infections: A systematic review and meta-analysis. Clin Infect Dis. 2012; 54:755–771.
35. Larsson, AJ, Walker, KJ, Raddatz, JK, Rotschafer, JC. The concentration-independent effect of monoexponential and biexponential decay in vancomycin concentrations on the killing of Staphylococcus aureus under aerobic and anaerobic conditions. J Antimicrob Chemother. 1996; 38:589–597.
36. Moise-Broder, PA, Forrest, A, Birmingham, MC, Schentag, JJ. Pharmacodynamics of vancomycin and other antimicrobials in patients with Staphylococcus aureus lower respiratory tract infections. Clin Pharmacokinet. 2004; 43:925–942.
37. Rybak, M, Lomaestro, B, Rotschafer, JC, et al. Therapeutic monitoring of vancomycin in adult patients: A consensus review of the American Society of Health-System Pharmacists, the Infectious Diseases Society of America, and the Society of Infectious Diseases Pharmacists. Am J Health Syst Pharm. 2009; 66:82–98.
38. Mohr, JF, Murray, BE. Point: Vancomycin is not obsolete for the treatment of infection caused by methicillin-resistant Staphylococcus aureus. Clin Infect Dis. 2007; 44:1536–1542.
39. Steinkraus, G, White, R, Friedrich, L. Vancomycin MIC creep in non-vancomycin-intermediate Staphylococcus aureus (VISA), vancomycin-susceptible clinical methicillin-resistant S. aureus (MRSA) blood isolates from 2001-2005. J Antimicrob Chemother. 2007; 60:788–794.
40. Lodise, TP, Patel, N, Lomaestro, BM, et al. Relationship between initial vancomycin concentration-time profile and nephrotoxicity among hospitalized patients. Clin Infect Dis. 2009; 49:507–514.
41. Wunderink, RG, Niederman, MS, Kollef, MH, et al. Linezolid in methicillin-resistant Staphylococcus aureus nosocomial pneumonia: A randomized, controlled study. Clin Infect Dis. 2012; 54:621–629.
42. Ingram, PR, Lye, DC, Fisher, DA, et al. Nephrotoxicity of continuous versus intermittent infusion of vancomycin in outpatient parenteral antimicrobial therapy. Int J Antimicrob Agents. 2009; 34:570–574.
43. Wysocki, M, Delatour, F, Faurisson, F, et al. Continuous versus intermittent infusion of vancomycin in severe Staphylococcal infections: Prospective multicenter randomized study. Antimicrob Agents Chemother. 2001; 45:2460–2467.
44. Keel, RA, Sutherland, CA, Aslanzadeh, J, et al. Correlation between vancomycin and daptomycin MIC values for methicillin-susceptible and methicillin-resistant Staphylococcus aureus by 3 testing methodologies. Diagn Microbiol Infect Dis. 2010; 68:326–329.
45. Kohl, BA, Deutschman, CS. The inflammatory response to surgery and trauma. Curr Opin Crit Care. 2006; 12:325–332.
46. Di Giantomasso, D, May, CN, Bellomo, R. Vital organ blood flow during hyperdynamic sepsis. Chest. 2003; 124:1053–1059.
47. Udy, AA, Roberts, JA, Boots, RJ, et al. Augmented renal clearance: Implications for antibacterial dosing in the critically ill. Clin Pharmacokinet. 2010; 49:1–16.
48. Patanwala, AE, Norris, CJ, Nix, DE, et al. Vancomycin dosing for pneumonia in critically ill trauma patients. J Trauma. 2009; 67:802–804.
49. Rivers, E, Nguyen, B, Havstad, S, et al. Early goal-directed therapy in the treatment of severe sepsis and septic shock. N Engl J Med. 2001; 345:1368–1377.
50. Brandstrup, B, Tonnesen, H, Beier-Holgersen, R, et al. Effects of intravenous fluid restriction on postoperative complications: Comparison of two perioperative fluid regimens: A randomized assessor-blinded multicenter trial. Ann Surg. 2003; 238:641–648.
51. Wiedemann, HP, Wheeler, AP, Bernard, GR, et al. Comparison of two fluid-management strategies in acute lung injury. N Engl J Med. 2006; 354:2564–2575.
52. Burton, ME, Shaw, LM, Schentag, JJ, Evans, WE. Applied Pharmacokinetics and Pharmacodynamics, 4th ed. Philadelphia: Lippincott Williams & Wilkins; 2006.
53. Dasta, JF, Armstrong, DK. Variability in aminoglycoside pharmacokinetics in critically ill surgical patients. Crit Care Med. 1988; 16:327–330.
54. Rea, RS, Capitano, B, Bies, R, et al. Suboptimal aminoglycoside dosing in critically ill patients. Ther Drug Monit. 2008; 30:674–681.
55. Tillement, JP, Lhoste, F, Giudicelli, JF. Diseases and drug protein binding. Clin Pharmacokinet. 1978; 3:144–154.
56. Israili, ZH, Dayton, PG. Human alpha-1-glycoprotein and its interactions with drugs. Drug Metab Rev. 2001; 33:161–235.
57. Benet, LZ, Hoener, BA. Changes in plasma protein binding have little clinical relevance. Clin Pharmacol Ther. 2002; 71:115–121.
58. de Winter, BC, van Gelder, T, Sombogaard, F, et al. Pharmacokinetic role of protein binding of mycophenolic acid and its glucuronide metabolite in renal transplant recipients. J Pharmacokinet Pharmacodynamics. 2009; 36:541–564.
59. Ulldemolins, M, Roberts, JA, Rello, J, et al. The effects of hypoalbuminaemia on optimizing antibacterial dosing in critically ill patients. Clin Pharmacokinet. 2011; 50:99–110.
60. Mutlu, GM, Mutlu, EA, Factor, P. GI complications in patients receiving mechanical ventilation. Chest. 2001; 119:1222–1241.
61. Ceppa, EP, Fuh, KC, Bulkley, GB. Mesenteric hemodynamic response to circulatory shock. Curr Opin Crit Care. 2003; 9:127–132.
62. Lautt, WW. Mechanism and role of intrinsic regulation of hepatic arterial blood flow: Hepatic arterial buffer response. Am J Physiol. 1985; 249:G549–G556.
63. Nguyen, NQ, Ng, MP, Chapman, M, et al. The impact of admission diagnosis on gastric emptying in critically ill patients. Crit Care. 2007; 11:R16.
64. Ritz, MA, Fraser, R, Edwards, N, et al. Delayed gastric emptying in ventilated critically ill patients: Measurement by 13 C-octanoic acid breath test. Crit Care Med. 2001; 29:1744–1749.
65. Heyland, DK, Tougas, G, King, D, Cook, DJ. Impaired gastric emptying in mechanically ventilated, critically ill patients. Intensive Care Med. 1996; 22:1339–1344.
66. Buijk, SL, Gyssens, IC, Mouton, JW, et al. Pharmacokinetics of sequential intravenous and enteral fluconazole in critically ill surgical patients with invasive mycoses and compromised gastrointestinal function. Intensive Care Med. 2001; 27:115–121.
67. de Marie, S, VandenBergh, MF, Buijk, SL, et al. Bioavailability of ciprofloxacin after multiple enteral and intravenous doses in ICU patients with severe gram-negative intra-abdominal infections. Intensive Care Med. 1998; 24:343–346.
68. Kanji, S, McKinnon, PS, Barletta, JF, et al. Bioavailability of gatifloxacin by gastric tube administration with and without concomitant enteral feeding in critically ill patients. Crit Care Med. 2003; 31:1347–1352.
69. Dorffler-Melly, J, de Jonge, E, Pont, AC, et al. Bioavailability of subcutaneous low-molecular-weight heparin to patients on vasopressors. Lancet. 2002; 359:849–850.
70. Jochberger, S, Mayr, V, Luckner, G, et al. Antifactor Xa activity in critically ill patients receiving antithrombotic prophylaxis with standard dosages of certoparin: A prospective, clinical study. Crit Care. 2005; 9:R541–548.
71. Bara, L, Planes, A, Samama, MM. Occurrence of thrombosis and haemorrhage, relationship with anti-Xa, anti-IIa activities, and D-dimer plasma levels in patients receiving a low molecular weight heparin, enoxaparin or tinzaparin, to prevent deep vein thrombosis after hip surgery. Br J Haematol. 1999; 104:230–240.
72. Levine, MN, Planes, A, Hirsh, J, et al. The relationship between anti-factor Xa level and clinical outcome in patients receiving enoxaparine low molecular weight heparin to prevent deep vein thrombosis after hip replacement. Thromb Haemost. 1989; 62:940–944.
73. Cheng, SS, Nordenholz, K, Matero, D, et al. Standard subcutaneous dosing of unfractionated heparin for venous thromboembolism prophylaxis in surgical ICU patients leads to subtherapeutic factor Xa inhibition. Intensive Care Med. 2012; 38:642–648.
74. Robinson, S, Zincuk, A, Strom, T, et al. Enoxaparin, effective dosage for intensive care patients: Double-blinded, randomised clinical trial. Crit Care. 2010; 14:R41.
75. Hoste, EA, Schurgers, M. Epidemiology of acute kidney injury: How big is the problem? Crit Care Med. 2008; 36:S146–S151.
76. Dowling, TC. Quantification of renal function. In Dipiro J, Talbert R, Yee G, et al, eds. : Pharmacotherapy: A Pathophysiologic Approach, 8th ed, New York: McGraw-Hill, 2011.
77. Cherry, RA, Eachempati, SR, Hydo, L, Barie, PS. Accuracy of short-duration creatinine clearance determinations in predicting 24-hour creatinine clearance in critically ill and injured patients. J Trauma. 2002; 53:267–271.
78. Herrera-Gutierrez, ME, Seller-Perez, G, Banderas-Bravo, E, et al. Replacement of 24-hour creatinine clearance by 2-hour creatinine clearance in intensive care unit patients: A single-center study. Intensive Care Med. 2007; 33:1900–1906.
79. Robert, S, Zarowitz, BJ, Peterson, EL, Dumler, F. Predictability of creatinine clearance estimates in critically ill patients. Crit Care Med. 1993; 21:1487–1495.
80. Cockcroft, DW, Gault, MH. Prediction of creatinine clearance from serum creatinine. Nephron. 1976; 16:31–41.
81. Levey, AS, Coresh, J, Greene, T, et al. Expressing the Modification of Diet in Renal Disease Study equation for estimating glomerular filtration rate with standardized serum creatinine values. Clin Chem. 2007; 53:766–772.
82. Nyman, HA, Dowling, TC, Hudson, JQ, et al. Comparative evaluation of the Cockcroft-Gault equation and the Modification of Diet in Renal Disease (MDRD) study equation for drug dosing: An opinion of the Nephrology Practice and Research Network of the American College of Clinical Pharmacy. Pharmacotherapy. 2011; 31:1130–1144.
83. National Kidney Disease Education Program (NKDEP), Chronic Kidney Disease and Drug Dosing: Information for Providers. National Institute of Diabetes and Digestive and Kidney Diseases, Washington, DC, 2010. http://www.nkdep.nih.gov/professionals/drug-dosing-information.htm
84. Stevens, LA, Coresh, J, Feldman, HI, et al. Evaluation of the modification of diet in renal disease study equation in a large diverse population. J Am Soc Nephrol. 2007; 18:2749–2757.
85. Cirillo, M, Anastasio, P, De Santo, NG. Relationship of gender, age, and body mass index to errors in predicted kidney function. Nephrol Dial Transplant. 2005; 20:1791–1798.
86. Verhave, JC, Fesler, P, Ribstein, J, et al. Estimation of renal function in subjects with normal serum creatinine levels: Influence of age and body mass index. Am J Kidney Dis. 2005; 46:233–241.
87. Pai, MP, Park, EJ, Dong, T, et al. The influence of body size descriptors on the estimation of kidney function in normal weight, overweight, obese, and morbidly obese adults. Ann Pharmacother. 2012; 46:317–328.
88. Joy, MS, Matzke, GR, Armstrong, DK, et al. A primer on continuous renal replacement therapy for critically ill patients. Ann Pharmacother. 1998; 32:362–375.
89. Awdishu, L, Bouchard, J. How to optimize drug delivery in renal replacement therapy. Semin Dial. 2011; 24:176–182.
90. Heintz, BH, Matzke, GR, Dager, WE. Antimicrobial dosing concepts and recommendations for critically ill adult patients receiving continuous renal replacement therapy or intermittent hemodialysis. Pharmacotherapy. 2009; 29:562–577.
91. Trotman, RL, Williamson, JC, Shoemaker, DM, Salzer, WL. Antibiotic dosing in critically ill adult patients receiving continuous renal replacement therapy. Clin Infect Dis. 2005; 41:1159–1166.
92. Uchino, S, Fealy, N, Baldwin, I, et al. Continuous is not continuous: The incidence and impact of circuit “down-time” on uraemic control during continuous veno-venous haemofiltration. Intensive Care Med. 2003; 29:575–578.
93. Mehta, RL, McDonald, B, Gabbai, FB, et al. A randomized clinical trial of continuous versus intermittent dialysis for acute renal failure. Kidney Int. 2001; 60:1154–1163.
94. Verbeeck, RK. Pharmacokinetics and dosage adjustment in patients with hepatic dysfunction. Eur J Clin Pharmacol. 2008; 64:1147–1161.
95. Guengerich, FP. Cytochrome P450 and chemical toxicology. Chem Res Toxicol. 2008; 21:70–83.
96. Morgan, DJ, McLean, AJ. Therapeutic implications of impaired hepatic oxygen diffusion in chronic liver disease. Hepatology. 1991; 14:1280–1282.
97. Pugh, RN, Murray-Lyon, IM, Dawson, JL, et al. Transection of the oesophagus for bleeding oesophageal varices. Br J Surg. 1973; 60:646–649.
98. Food and Drug Administration. Guidance for industry: Pharmacokinetics in patients with impaired hepatic function: Study design, data analysis, and impact on dosing and labeling. Rockville, MD: Food and Drug Administration; 2003.
99. Sokol, SI, Cheng, A, Frishman, WH, Kaza, CS. Cardiovascular drug therapy in patients with hepatic diseases and patients with congestive heart failure. J Clin Pharmacol. 2000; 40:11–30.
100. Klotz, U. Antiarrhythmics: Elimination and dosage considerations in hepatic impairment. Clin Pharmacokinet. 2007; 46:985–996.
101. Davis, M. Cholestasis and endogenous opioids: Liver disease and exogenous opioid pharmacokinetics. Clin Pharmacokinet. 2007; 46:825–850.
102. McCabe, SM, Ma, Q, Slish, JC, et al. Antiretroviral therapy: Pharmacokinetic considerations in patients with renal or hepatic impairment. Clin Pharmacokinet. 2008; 47:153–172.
103. Ogden, CL, Yanovski, SZ, Carroll, MD, Flegal, KM. The epidemiology of obesity. Gastroenterology. 2007; 132:2087–2102.
104. Martino, JL, Stapleton, RD, Wang, M, et al. Extreme obesity and outcomes in critically ill patients. Chest. 2011; 140:1198–1206.
105. Pieracci, FM, Barie, PS, Pomp, A. Critical care of the bariatric patient. Crit Care Med. 2006; 34:1796–1804.
106. Han, PY, Duffull, SB, Kirkpatrick, CM, Green, B. Dosing in obesity: A simple solution to a big problem. Clin Pharmacol Ther. 2007; 82:505–508.
107. Hanley, MJ, Abernethy, DR, Greenblatt, DJ. Effect of obesity on the pharmacokinetics of drugs in humans. Clin Pharmacokinet. 2010; 49:71–87.
108. Devine, BJ. Case number 25: Gentamicin therapy. Drug Intell Clin Pharm. 1974; 8:650–655.
109. James, WP. Research on Obesity. London: Her Majesty’s Stationery Office; 1976.
110. Mosteller, RD. Simplified calculation of body-surface area. N Engl J Med. 1987; 317:1098.
111. Pai, MP, Paloucek, FP. The origin of the “ideal” body weight equations. Ann Pharmacother. 2000; 34:1066–1069.
112. Zovirax IV injection, acyclovir sodium IV injections [package insert]. Research Triangle Park, NC: GlaxoSmithKline, 2003.
113. Refludan [package insert]. Montville, NJ: Berlex, 2004.
114. Argatroban IV [package insert]. Research Triangle Park, NC: GlaxoSmithKline, 2009.
115. Angiomax [package insert]. Parsippany, NJ: The Medicines Company, 2010.
116. Alteplase [package insert]. South San Francisco, CA: Genetech, Inc., 2011.
117. Abernethy, DR, Greenblatt, DJ. Phenytoin disposition in obesity. Determination of loading dose. Arch Neurol. 1985; 42:468–471.
118. Gould, MK, Garcia, DA, Wren, SM, et al. Prevention of VTE in nonorthopedic surgical patients: Antithrombotic Therapy and Prevention of Thrombosis, 9th ed. American College of Chest Physicians Evidence-Based Clinical Practice Guidelines. Chest. 2012; 141:e227S–277S.
119. Greenblatt, DJ, Abernethy, DR, Locniskar, A, et al. Effect of age, gender, and obesity on midazolam kinetics. Anesthesiology. 1984; 61:27–35.
120. Lemmens, HJ, Brodsky, JB. The dose of succinylcholine in morbid obesity. Anesth Analg. 2006; 102:438–442.
121. Nutescu, EA, Spinler, SA, Wittkowsky, A, Dager, WE. Low-molecular-weight heparins in renal impairment and obesity: Available evidence and clinical practice recommendations across medical and surgical settings. Ann Pharmacother. 2009; 43:1064–1083.
122. Pai, MP, Bearden, DT. Antimicrobial dosing considerations in obese adult patients. Pharmacotherapy. 2007; 27:1081–1091.
123. Patel, JP, Roberts, LN, Arya, R. Anticoagulating obese patients in the modern era. Br J Haematol. 2011; 155:137–149.
124. Servin, F, Farinotti, R, Haberer, JP, Desmonts, JM. Propofol infusion for maintenance of anesthesia in morbidly obese patients receiving nitrous oxide. A clinical and pharmacokinetic study. Anesthesiology. 1993; 78:657–665.
125. Precedex Dosing Guidelines. Available at http://www.precedex.com/wp-content/uploads/2011/06/dosing_card.pdf. [Accessed April 5, 2012].
126. Wurtz, R, Itokazu, G, Rodvold, K. Antimicrobial dosing in obese patients. Clin Infect Dis. 1997; 25:112–118.
127. Hernandez, JO, Norstrom, J, Wysock, G. Acyclovir-induced renal failure in an obese patient. Am J Health Syst Pharm. 2009; 66:1288–1291.
128. Garonzik, SM, Li, J, Thamlikitkul, V, et al. Population pharmacokinetics of colistin methanesulfonate and formed colistin in critically ill patients from a multicenter study provide dosing suggestions for various categories of patients. Antimicrob Agents Chemother. 2011; 55:3284–3294.
129. Pai, MP, Norenberg, JP, Anderson, T, et al. Influence of morbid obesity on the single-dose pharmacokinetics of daptomycin. Antimicrob Agents Chemother. 2007; 51:2741–2747.
130. Cheymol, G. Effects of obesity on pharmacokinetics implications for drug therapy. Clin Pharmacokinet. 2000; 39:215–231.
131. Cortinez, LI, Anderson, BJ, Penna, A, et al. Influence of obesity on propofol pharmacokinetics: Derivation of a pharmacokinetic model. Br J Anaesth. 2010; 105:448–456.
132. Corbett, SM, Montoya, ID, Moore, FA. Propofol-related infusion syndrome in intensive care patients. Pharmacotherapy. 2008; 28:250–258.
133. Raschke, RA, Reilly, BM, Guidry, JR, et al. The weight-based heparin dosing nomogram compared with a “standard care” nomogram. A randomized controlled trial. Ann Intern Med. 1993; 119:874–881.
134. Barletta, JF, DeYoung, JL, McAllen, K, et al. Limitations of a standardized weight-based nomogram for heparin dosing in patients with morbid obesity. Surgery for obesity and related diseases. Off J Am Soc Bariatr Surg. 2008; 4:748–753.
135. Yee, WP, Norton, LL. Optimal weight base for a weight-based heparin dosing protocol. Am J Health Syst Pharm. 1998; 55:159–162.
136. Spinler, SA, Inverso, SM, Cohen, M, et al. Safety and efficacy of unfractionated heparin versus enoxaparin in patients who are obese and patients with severe renal impairment: Analysis from the ESSENCE and TIMI 11B studies. Am Heart J. 2003; 146:33–41.
137. Barba, R, Marco, J, Martin-Alvarez, H, et al. The influence of extreme body weight on clinical outcome of patients with venous thromboembolism: Findings from a prospective registry (RIETE). J Thromb Haemost. 2005; 3:856–862.
138. Myzienski, AE, Lutz, MF, Smythe, MA. Unfractionated heparin dosing for venous thromboembolism in morbidly obese patients: Case report and review of the literature. Pharmacotherapy. 2010; 30:324.
139. Wilson, SJ, Wilbur, K, Burton, E, Anderson, DR. Effect of patient weight on the anticoagulant response to adjusted therapeutic dosage of low-molecular-weight heparin for the treatment of venous thromboembolism. Haemostasis. 2001; 31:42–48.
140. Medico, CJ, Walsh, P. Pharmacotherapy in the critically ill obese patient. Crit Care Clin. 2010; 26:679–688.
141. Administration on Aging. Aging into the 21st century. Available at http://www.aoa.gov/AoARoot/Aging_Statistics/future_growth/aging21/health.aspx. [Accessed 3/30/2012].
142. Klotz, U. Pharmacokinetics and drug metabolism in the elderly. Drug Metab Rev. 2009; 41:67–76.
143. American Geriatrics Society 2012 Beers Criteria Update Expert Panel. American Geriatrics Society Updated Beers Criteria for potentially inappropriate medication use in older adults. J Am Geriatr Soc. 2012; 60(4):616–631.
144. Hill, CC, Pickinpaugh, J. Physiologic changes in pregnancy. Surg Clin North Am. 2008; 88:391–401.
145. Joglar, JA, Page, RL. Treatment of cardiac arrhythmias during pregnancy: Safety considerations. Drug Saf. 1999; 20:85–94.
146. Ko, R, Mazur, JE, Pastis, NJ, et al. Common problems in critically ill obstetric patients, with an emphasis on pharmacotherapy. Am J Med Sci. 2008; 335:65–70.
147. Anderson, GD. Pregnancy-induced changes in pharmacokinetics: A mechanistic-based approach. Clin Pharmacokinet. 2005; 44:989–1008.
148. Jentink, J, Loane, MA, Dolk, H, et al. Valproic acid monotherapy in pregnancy and major congenital malformations. N Engl J Med. 2010; 362:2185–2193.
149. ACOG Committee Opinion No. 514. Emergent therapy for acute-onset, severe hypertension with preeclampsia or eclampsia. Obstet Gynecol. 2011; 118:1465–1468.
150. ACOG Committee Opinion No. 494. Sulfonamides, nitrofurantoin, and risk of birth defects. Obstet Gynecol. 2011; 117:1484–1485.
151. Bates, SM, Greer, IA, Middeldorp, S, et al. VTE, thrombophilia, antithrombotic therapy, and pregnancy: Antithrombotic Therapy and Prevention of Thrombosis, 9th ed. American College of Chest Physicians Evidence-Based Clinical Practice Guidelines. Chest. 2012; 141:e691S–736S.
152. Crider, KS, Cleves, MA, Reefhuis, J, et al. Antibacterial medication use during pregnancy and risk of birth defects: National Birth Defects Prevention Study. Arch Pediatr Adolesc Med. 2009; 163:978–985.
153. Briggs, GG, Freeman, RK, Yaffe, SJ. Drugs in Pregnancy and Lactation, 9th ed. Philadelphia: Lippincott Williams & Wilkins; 2011.
154. Blanchet, B, Jullien, V, Vinsonneau, C, Tod, M. Influence of burns on pharmacokinetics and pharmacodynamics of drugs used in the care of burn patients. Clin Pharmacokinet. 2008; 47:635–654.
155. Marion, D, Bullock, MR. Current and future role of therapeutic hypothermia. J Neurotrauma. 2009; 26:455–467.
156. Morrison, LJ, Deakin, CD, Morley, PT, et al. Part 8: Advanced life support: 2010 International Consensus on Cardiopulmonary Resuscitation and Emergency Cardiovascular Care Science with Treatment Recommendations. Circulation. 2010; 122:S345–S421.
157. van den Broek, MP, Groenendaal, F, Egberts, AC, Rademaker, CM. Effects of hypothermia on pharmacokinetics and pharmacodynamics: A systematic review of preclinical and clinical studies. Clin Pharmacokinet. 2010; 49:277–294.
158. Fukuoka, N, Aibiki, M, Tsukamoto, T, et al. Biphasic concentration change during continuous midazolam administration in brain-injured patients undergoing therapeutic moderate hypothermia. Resuscitation. 2004; 60:225–230.
159. Hostler, D, Zhou, J, Tortorici, MA, et al. Mild hypothermia alters midazolam pharmacokinetics in normal healthy volunteers. Drug metabolism and disposition: The biological fate of chemicals. Drug Metab Dispos. 2010; 38:781–788.
160. Tortorici, MA, Kochanek, PM, Poloyac, SM. Effects of hypothermia on drug disposition, metabolism, and response: A focus of hypothermia-mediated alterations on the cytochrome P450 enzyme system. Crit Care Med. 2007; 35:2196–2204.
161. Kalow, W, Gunn, DR. The relation between dose of succinylcholine and duration of apnea in man. J Pharmacol Exp Ther. 1957; 120:203–214.
162. Meyer, UA. Pharmacogenetics—Five decades of therapeutic lessons from genetic diversity. Nat Rev Genet. 2004; 5:669–676.
163. Empey, PE. Genetic predisposition to adverse drug reactions in the intensive care unit. Crit Care Med. 2010; 38:S106–S116.
164. Levine, GN, Bates, ER, Blankenship, JC, et al. 2011 ACCF/AHA/SCAI Guideline for Percutaneous Coronary Intervention. A report of the American College of Cardiology Foundation/American Heart Association Task Force on Practice Guidelines and the Society for Cardiovascular Angiography and Interventions. J Am Coll Cardiol. 2011; 58:e44–122.
165. Holbrook, A, Schulman, S, Witt, DM, et al. Evidence-based management of anticoagulant therapy: Antithrombotic Therapy and Prevention of Thrombosis, 9th ed. American College of Chest Physicians Evidence-Based Clinical Practice Guidelines. Chest. 2012; 141:e152S–184S.
166. Spector, R, Park, GD, Johnson, GF, Vesell, ES. Therapeutic drug monitoring. Clin Pharmacol Ther. 1988; 43:345–353.