INTRODUCTION
Functional neuroimaging has contributed to the surgical management of epilepsy in two ways. First, functional imaging methods have facilitated decision making regarding the optimal placement of subdural grids, strips, and depth electrodes, which are necessary for accurately identifying the ictal onset zone (IOZ). This has been achieved through localization of interictal activity sources using magnetoencephalography (MEG); interictal and ictal activity sources using metabolic functional imaging approaches, namely single photon emission computed tomography (SPECT); and positron emission tomography (PET). Second, functional neuroimaging has emerged as an important tool for localizing the somatosensory, motor, and language-specific cortex, and determining hemispheric dominance for language and memory, prior to brain surgery. In particular, the advent of MEG, functional magnetic resonance imaging (fMRI), and transcranial magnetic stimulation (TMS) have optimized noninvasive localization of the somatosensory, motor, and language cortex, as well as determining their spatial relation to epileptogenic tissue. The latter is of considerable importance, given that focal lesions, particularly those that develop over extended periods of time, result in functional reorganization of the cortex, such that the location and extent of the neuronal networks underlying the aforementioned functions cannot be safely deduced from knowledge of the functional organization of normal brains.
LOCALIZATION OF ICTAL/INTERICTAL ACTIVITY
The success of epilepsy surgery depends on several factors, chief among which is the soundness of the decision as to whether or not to perform a corpus callosotomy or ablative surgery and, in the latter case, on the accurate identification of the IOZ to be resected. These presurgical planning decisions are based on a series of standard procedures, in addition to neurologic and neuropsychologic evaluation, which include ictal and interictal surface video EEG (V-EEG); MRI, often invasive electrophysiologic monitoring involving subdural grids, strips, and depth electrodes (iEEG); and, occasionally, metabolic functional imaging (PET or SPECT). Clearly, the accuracy of the surgical decision depends on the accuracy of each of the individual procedures on which it is based. Although the precise degree of accuracy of V-EEG and of iEEG has not been quantified, it is considered to be higher than that of PET, SPECT, and magnetoencephalography (MEG) and it carries greater weight in the consensus decisions made by the epileptologists (1,2). Consequently, the relative accuracy of any newer diagnostic procedures is assessed through comparisons of their predictions to those of V-EEG and, especially, of iEEG when the latter is available. Of the noninvasive methods, MEG is believed to have considerable localization accuracy; better, in fact, than that of PET and SPECT (3). It compares favorably with that of iEEG (4,5) and has been found useful in facilitating decisions regarding the optimal placement of invasive electrodes (6,7). How much predictive power it has, as compared to that of V-EEG and iEEG, is one of the main questions that the programmatic research in which we have been engaged over the past 15 years was designed to address (eg, 8,9). Early studies that systematically compared MEG and scalp EEG source localizations of the interictal spike zone yielded mixed results (10–17). Whereas in some studies good agreement between MEG and EEG localizations has been obtained, in some others considerable differences have been reported. Additional studies indicated that combined EEG-MEG is superior to either technique alone (14,18–20). Because invasive electrical recordings are considered the gold standard during presurgical epilepsy evaluation, MEG source localizations ultimately have to be compared to the results of these invasive techniques. Indeed, MEG dipole localization has shown good agreement with invasive recordings (3,5,10,11,17,18,21–28).
Whereas consistent regional interictal epileptiform discharges may add confirmatory evidence in identifying the area of seizure onset, focal ictal epileptiform discharges preceding the patient’s seizures or simultaneous with them are considered the most reliable localizing sign in presurgical evaluation (29). So far, there have been only a few reports of ictal MEG recordings (11,22,23,30). MEG localizations of the IOZ showed good agreement with subsequent invasive recordings (22,23,30) and seemed to be more accurate than surface EEG localizations (11). MEG has also helped to resolve some ambiguities concerning the functional organization of the IOZ and to differentiate between distributed and focal seizure onset zones (22). However, despite the advent of whole-head MEG systems, ictal recordings are difficult to obtain on a routine basis for several reasons. First, the patient must have frequent seizures in order to capture an event during the short time MEG is recorded. Second, if the patients are required to stay in a fixed position in relation to the neuromagnetometer over a prolonged time period, they experience stress and discomfort that few can tolerate. Finally, seizures are usually accompanied by movement and associated artifacts, which can make MEG data difficult to interpret. Over the course of a long series of MEG studies, involving more than 1,000 cases of epilepsy (both adult and pediatric), it has been indicated that interictal MEG may be more accurate than interictal and ictal scalp EEG and, on a group basis, as accurate statistically as iEEG in identifying IOZs when accuracy is defined by seizure outcome measures (9,31). However, neither of these studies, nor the others reviewed previously, have settled the issue of how well MEG recordings match iEEG recordings in localizing the sources of epileptiform activity. Moreover, given that MEG recordings are almost exclusively of interictal activity with which one may identify the irritative but not necessarily the ictal onset zone, the practical issue of how well interictal MEG can match iVEEG recordings in identifying that zone remains unresolved.
Identification of the epileptogenic foci in epilepsy can be aided by nuclear medicine techniques. Two such techniques are that of single photon emission computed tomography (SPECT, Figure 75.1), and positron emission tomography (PET, Figure 75.2). These techniques do have some differences, in that SPECT is weighted toward cerebral blood flow and PET evaluates glucose metabolism. The general theory is that an epileptogenic area has lower metabolic demand during the interictal period that can be documented by PET, and a corresponding decrease in regional cerebral perfusion documented by SPECT. When injection of radiopharmaceuticals takes place shortly after seizure onset, the increased metabolic activity from the electrical activity results in increased perfusion detected by SPECT (ictal-SPECT). For practical reasons related to expensive radiopharmaceuticals that have a short half-life, ictal-PET imaging is performed less frequently in epilepsy centers. Ictal studies have a greater sensitivity and specificity than interictal studies. The results of these studies can all be coregistered with CT or MRI scans to aid in localization. When both an ictal and interictal SPECT study is performed, they can be coregistered to visualize, through subtraction, the differences between subtle ictal hyperperfusion and subtle interictal hypoperfusion. The improved spatial resolution and signal-to-noise ratio of PET makes this superior to interictal SPECT (32); however, the impracticality of ictal-PET limits its use.
Clinical implementation of these techniques is guiding surgical management in many epilepsy patients. SPECT and PET can improve confidence in the localization of seizure foci beyond that of EEG alone (32,33). This is especially helpful in confirming the location of seizure origin in patients without structural abnormality identified on CT or MRI (34). Additionally, this can aid confidence in finding the seizure origin in patients with more than one structural lesion, such as patients with tuberous sclerosis complex (TSC) (35).
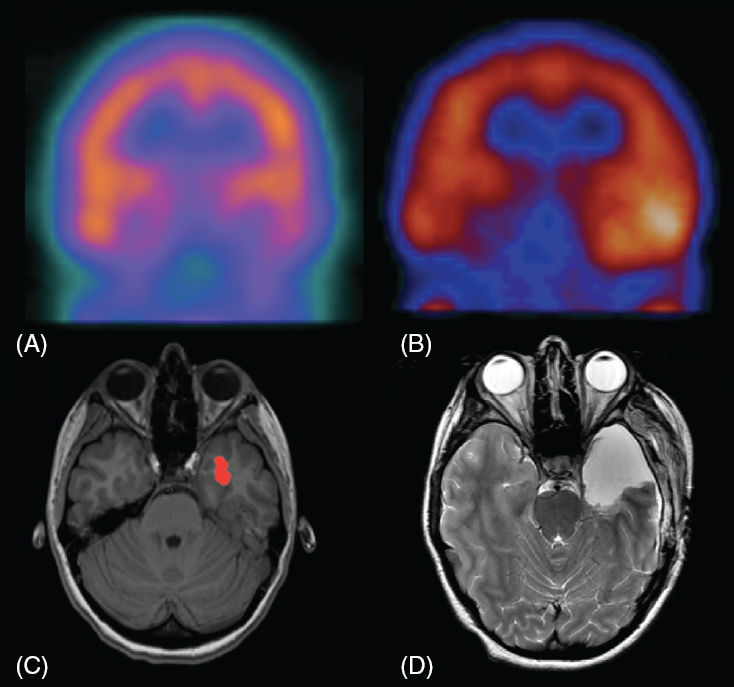
FIGURE 75.1 (A) Coronal interictal HMPAO-SPECT image showing subtle hypoperfusion of the left temporal lobe. (B) Coronal ictal SPECT perfusion image showing hyperperfusion of the left temporal lobe. This patient had a normal MRI scan; however, based on noninvasive evaluation the left temporal lobectomy was performed, resulting in excellent seizure control. (C) T1W image with overlay of data from subtraction of the ictal SPECT from the interictal SPECT, demonstrating the area of greatest difference in the number of counts, showing areas with a statistically significant (P < .01) increase in perfusion of greater than 3 standard deviations. Although there was no structural abnormality identified on several MRI scans, based upon EEG, SPECT and other studies, a left temporal lobectomy was performed. (D) Axial T2W image after a left temporal lobectomy that successfully controlled seizures in this patient.
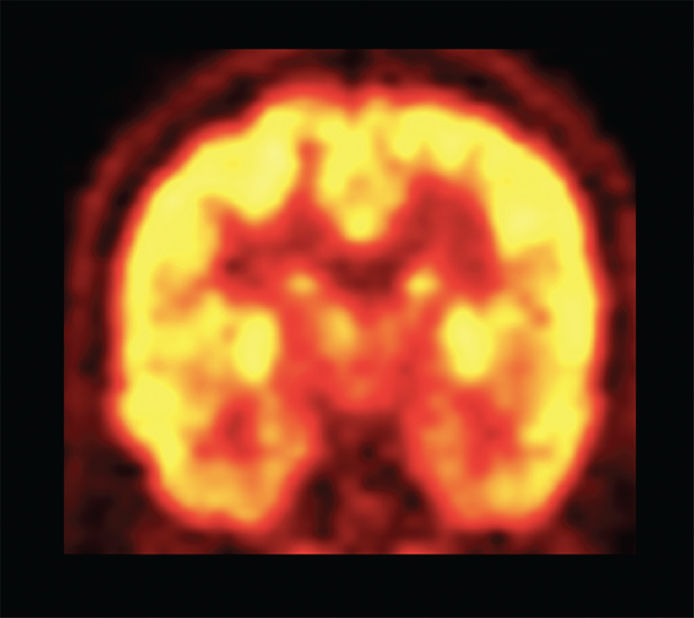
FIGURE 75.2 Coronal image from an 18F-FDG–PET scan showing a homogeneous metabolic pattern throughout the brain in a separate patient without focal deficit. Note the improved spatial and contrast resolution as compared to an interictal HMPAO–SPECT study.
INVASIVE PRESURGICAL MAPPING OF THE ELOQUENT CORTEX
Determination of the language-specific as well as the somatosensory and motor cortex, and their relation to the brain regions to be resected, is typically with the following two invasive procedures: the intracarotid sodium amytal procedure, also known as the Wada test, and the cortical stimulation mapping (CSM) procedure performed either intraoperatively or extraoperatively through subdural grids or strips, which is primarily used for estimating the location of the epileptiform activity sources. CSM requires craniotomy and the cooperation of the conscious, lightly sedated patient. The Wada test addresses the question of hemispheric dominance for language and memory, and the CSM procedure addresses the issue of localization of the expressive and receptive language cortex and that of the primary somatosensory and motor cortex. Both tests are used to produce “reversible lesions” that interrupt selectively in each of the previously named functions such that the location and extent of the brain circuitry mediating them is identified. In the case of the Wada, the reversible lesion involves extensive regions of each hemisphere, mainly those irrigated by the anterior and middle cerebral arteries. In the case of CSM, the lesions involve patches of the exposed cortex, approximately 1 to 2 cm in diameter. Provided that a reversible lesion degrades a particular function reliably, one may conclude that the tissue “lesioned” is a necessary component of the brain network of the disrupted function. For that reason, both of these methods are often thought of as providing the “gold standard” for brain mapping.
The most conspicuous shortcoming of these two invasive procedures is their appreciable morbidity. For the Wada procedure, the morbidity levels vary between 3% to 5% (36–38). The rates of infection associated with subdural grid electrodes range from 1.5% to 12.1% (39–41). Although this side effect of the invasive brain mapping procedures may possibly be reduced, it cannot be eliminated. Needless to say, no morbidity is associated with the noninvasive alternatives, which will be discussed later in this chapter. A second limitation is patient discomfort, while a third limitation is the inability of CSM to identify memory-specific circuitry since the limbic cortex is typically beyond its reach and the questionable efficiency of the Wada procedure in identifying the memory-dominant hemisphere is impacted for the following reasons: first, the fact that delivery of the sodium amytal or amobarbital to the hippocampal formation is not always possible (42–44) and, second, the fact that the way the Wada protocol is typically structured does not allow for separate estimation of hemispheric dominance for verbal and for nonverbal encoding. Such separate estimation, however, may be important in view of evidence for stimulus-modality specific encoding in the left and the right hippocampus (eg, 45–47). Moreover, although it is true that separate evaluation for verbal and nonverbal memory is conceivable with a modification of the commonly used Wada protocol described previously, it would increase the examination time, which is another problem common to the invasive procedures.
The fourth and fifth limitations of CSM and of the Wada are intimately related to the narrow time window in which they have to be performed: Repetition of the procedures for the purpose of establishing test–retest reliability is nearly impossible in the case of Wada and very restricted in the case of CSM. Moreover, neither CSM nor the Wada probe for the neuronal networks of a host of different cognitive operations that are subsumed under “language” and “memory” since they both involve very simple and coarse tasks. For example, object naming, sentence comprehension, and various other tasks that involve language and memory may share a number of local networks that can be disrupted by CSM; however, they also require others, specific to each, that cannot be identified through CSM precisely because of time limitations.
A sixth limitation is the inability to precisely control the spread of the injected current in CSM and the inability to control for cross flow in the Wada procedure, rendering uncertain the degree of functional suppression of the hemisphere injected (42). A seventh problem, in part reducible to the time constraints as occurs in the previous two, is the inability to control for situational variables that may compromise the integrity of the data. Variation in attention on the part of the patient in the crowded Wada suite where a number of tasks have to be done under time constraints may produce data, the integrity of which is impossible to ascertain since the procedure is done only once. In the case of CSM, situational variability is mostly contributed by the following factors: (a) sedation level, which is not always optimal for keeping the patient comfortable and at the same time sufficiently alert to complete the procedure; (b) current leakage along the cortical surface, the extent of which depends on the degree of tissue hydration; and (c) the timing of the delivery of CSM with respect to the task, which usually varies from trial to trial given that in most cases task-specific stimuli and the stimulating current are delivered manually and not through a computer. None of the previously noted limitations characterize the noninvasive methods of functional brain imaging—that is, functional MRI (fMRI) PET, magnetoencephalography (MEG), and transcranial magnetic stimulation (TMS)—that are now used in several centers in conjunction with the invasive ones, and that may be used in the future as substitutes for the Wada and CSM procedures.
Clearly, identifying the shortcomings of the invasive procedures that are not shared by the noninvasive ones by no means implies that the latter are limitation-free. In fact, fMRI, PET, and MEG have two very serious limitations: First, not all the brain regions that appear activated, especially in tasks evaluating higher order functions like language and memory, are necessary for these functions. For example, whereas in nearly all speech production tasks there is substantial bilateral activation, the activation of the minor hemisphere may not be necessary, since the patient can still perform the task during anesthetization of the minor hemisphere during the Wada and since expressive aphasia typically results from lesions of the dominant hemisphere. Therefore, the fact that language production correlates with activation of both hemispheres does not imply that activation of both hemispheres is causally related to the production of speech. Similarly, the presence of many activated regions within the dominant hemisphere does not imply that all of them are necessary for the task. Therefore, the noninvasive methods may provide data of low specificity. A second basic limitation shared by the noninvasive methods (MEG, PET, and fMRI) is related to the phenomenon of bilateral activation and consists in the determination of the appropriate ratio of the amount of activation that indicates actual lateralization of language or memory. This problem, however, has been addressed in the context of prospective studies where the so-called laterality index (LI) has been established for both MEG (eg, 48–52) and for fMRI (eg, 46–47,53,54).
There is no question that neither set of methods is perfectly suited for the purpose of functional mapping and the question really is whether it is possible to trust the noninvasive methods that are correlational in structure to provide statements about what brain areas are necessary for the mediation of particular functions. And, since the nature of these methods cannot be modified, the only way to attain the requisite level of trust is by first establishing the concordance of the results of the two sets of methods. But, before reviewing the evidence of the compatibility of the invasive and noninvasive methods, a brief description of the latter is in order.
NONINVASIVE FUNCTIONAL IMAGING METHODS
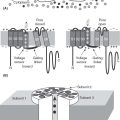
TMS is based on the fact that a current passing through a coil results in a magnetic field that passes through the scalp and skull and induces current in the underlying brain tissue (see Figure 75.3 for the technique summary). The neurons in the path of this current depolarize and fire synchronously. This has either an excitatory or an inhibitory effect, depending on the location and parameters of stimulation. The former is used in mapping the motor cortex using single stimulation pulses and the latter for localizing the language-specific cortex using trains of stimulating pulses. When TMS is applied to the scalp over the primary motor cortex (M1), a motor evoked potential (MEP) is generated in the contralateral muscles and is recorded using surface electromyography (EMG). The precise targeting of TMS is facilitated by the use of anatomical MRI, termed navigated or image-guided TMS. EMG in the hand and leg muscles is monitored using surface electrodes. Single pulses of TMS are applied along the precentral gyrus (near the hand knob area for the hand, and along the medial frontal gyrus for the leg) and the cortical location where TMS results in the highest MEP amplitude. Then TMS is applied at this location with varying intensities to identify the resting motor threshold. The resting motor threshold is traditionally defined as the minimum stimulation intensity capable of generating an MEP in 50% of cases (55).
The most common paradigms used in language mapping with TMS are reading, object naming, and counting. First, baseline performance during the task of choice is recorded. Next, repetitive TMS is delivered to the putative language area in the left hemisphere, as well as to homotopic areas of the right hemisphere. The onset of TMS is time locked to either the time of stimulus onset or 200 to 300 ms following the stimulus onset. TMS is applied at a rate of 10 or 5 Hz for 500 to 1,000 ms duration (5 pulses total). The patient’s responses during TMS are video recorded and analyzed after the session for errors and speech disruption. The brain areas where TMS stimulation results in speech arrest, performance errors, and sematic errors are identified on the patient’s MRI.
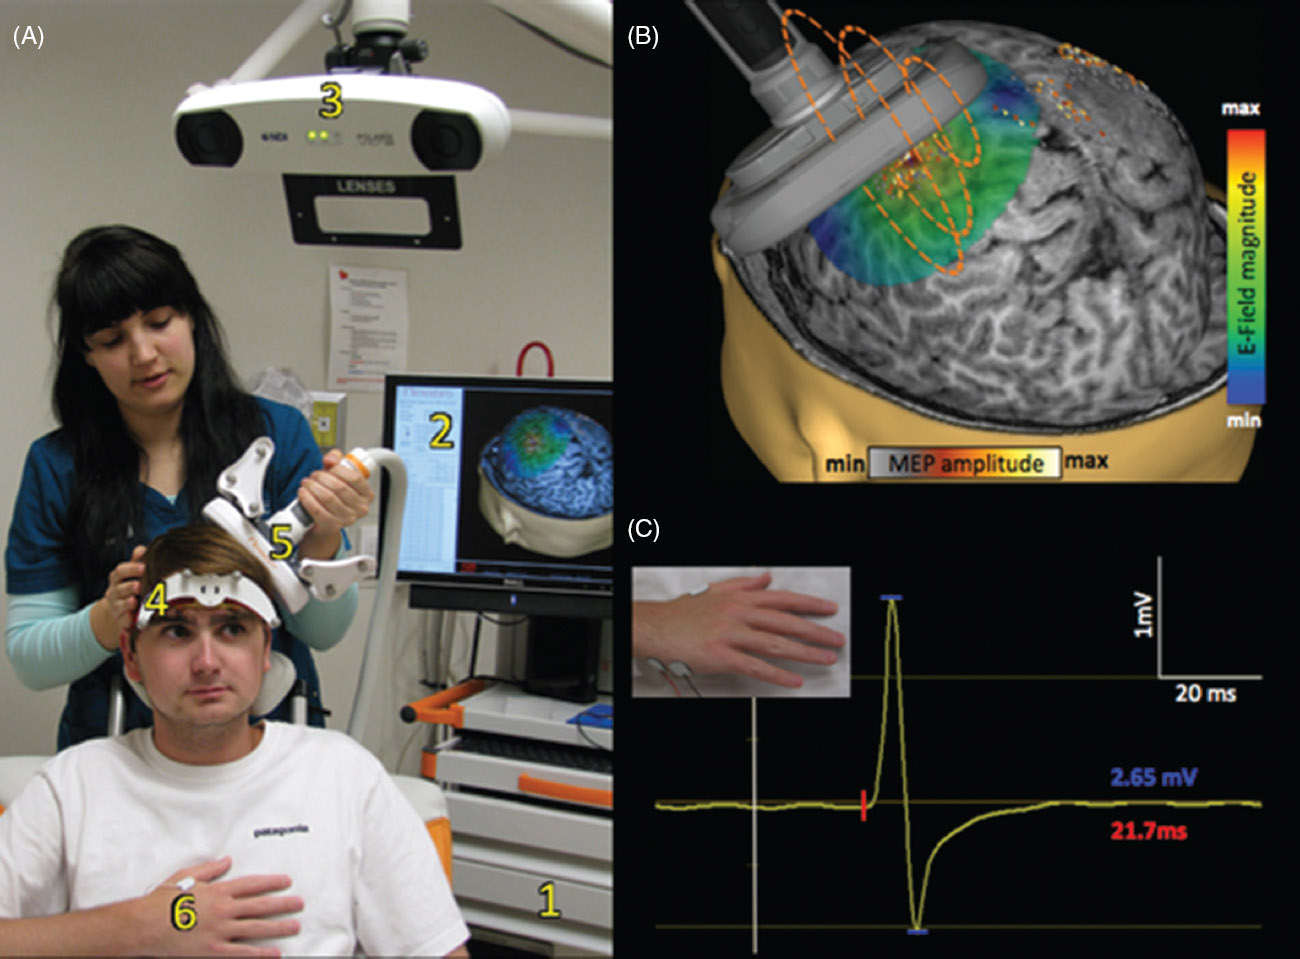
FIGURE 75.3 Panel A: Navigated TMS system and typical setup: In a typical clinical TMS study, the patient is seated comfortably in a chair and can move freely. The navigated TMS system consists of the power supply and the computer (1), software for real-time display of MRI (2), and a camera (3). The camera monitors the reflecting beads on the head tracker worn by the patient (4) and the TMS coil (5). The patient and the TMS coils are registered to the patient’s MRI, which allows for real-time monitoring of the TMS coil. The system also supports monitoring electromyograms and recording motor-evoked responses from target muscles (6). Panel B. Discharging the TMS power supply sends an electric current in the TMS coil that, in turn, results in a magnetic field in the orthogonal direction (dashed orange lines) which passes through the scalp and skull without any attenuation. The magnetic field then induces a secondary E-field in the brain tissue, and its magnitude can be represented as a color map. MRI-guided TMS provides the location of stimulation, and the navigated TMS system also supports overlaying the TMS findings on the magnetic resonance image (MRI). In this example, the extent of the hand motor area of a patient is displayed as a heat map projected onto the MRI. Panel C. TMS applied to the primary motor cortex results in an involuntary contraction in muscles or a motor-evoked potential that can be measured by surface electrodes (see inset). The corticomotor latency is measured as the time from TMS stimulation (white line) to the onset of the motor-evoked potential (red line). The amplitude of the motor-evoked potential is measured as its peak-to-peak voltage (shown in blue).
A second noninvasive method for somatosensory motor and language mapping is MEG (Figure 75.4). For somatosensory and motor mapping, variations of the following procedure (56) may be used: A series of pneumatically driven mechanical taps (25 lb/in.2) is typically applied to the fingertip of the patient’s index finger with an interstimulus interval randomly varied from 1.9 to 2.5 s. Patients may be scanned under two conditions: an active condition (stimulation with motor response) and a passive condition (stimulation without response). During the active condition, patients are instructed to respond with a full hand extension, followed by a passive return to the original resting position, immediately after they feel a brief pressure pulse delivered by a pneumatic drum placed on the right index finger. They are told that rather than a fast reaction time, the goal is to perform a rhythmic and uniform movement after each tactile cue. During the passive condition, participants are told to relax their hands and monitor the presentation of the stimuli, avoiding any movement. The passive condition serves as a baseline for characterizing the morphology and underlying source distribution of somatosensory evoked responses under identical stimulation conditions as in the active condition. It should be noted here that somatosensory mapping can be accomplished with the patient under sedation (eg, 57).
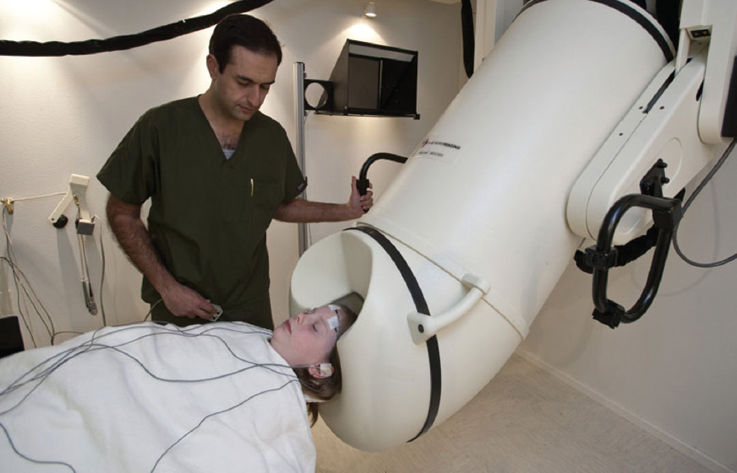
FIGURE 75.4 Typical MEG recording environment inside a magnetically shielded room, with patient situated in the supine position inside the sensor.
For receptive language mapping with MEG, variations of the following task (50) may be used: Patients are given a recognition memory task for spoken words, and event-related fields (ERFs) are recorded for each word stimulus. The stimuli (target words that are repeated and foils that are presented once) are delivered binaurally at a comfortable intensity level through two 5-m-long plastic tubes terminating in ear inserts, with a variable inter-stimulus interval of 2.5 to 3.5 s. Patients are asked to lift their index finger whenever they detect a repeated word. The responding hand is counterbalanced across sessions. On occasion, a variation of this protocol has been adopted in the visual modality, whereby target and distractor stimuli are presented to the patient visually, with identical task demands (eg, 58). As well as eliciting reliable receptive language cortex activation, the visual variant of the recognition memory task for words has been shown to engage the inferior frontal region, most likely reflecting the dynamics of single word reading posed by the task (eg, 59). While MEG receptive language mapping has most readily been achieved using the aforementioned protocol, other paradigms (eg, 60–61) have been shown to be useful in identifying the receptive language cortex. Expressive language mapping using MEG is typically performed in the context of a picture naming task (eg, 51,62) or a covert verb generation task (eg, 61,63), but is not as reliable.
Of the two imaging methods involving local blood flow measurements, namely PET and fMRI, the latter is used with much higher frequency for presurgical brain mapping. Mapping of the motor cortex using fMRI is achieved by means of several protocols, which is generally accepted as commonplace in clinical practice. One approach for localizing the hand area is a self-paced finger tapping task (eg, 64–67) during which the patient is visually cued to tap all four fingers against the thumb, beginning with the thumb–index finger contact, and progressing to the other fingers for a duration of 15 s, followed by a passive rest period of equal length. In addition, representation of the foot area can also be achieved through a visually cued protocol, consisting of self-paced wiggling of the toes. Furthermore, cortical representation of the mouth area is achievable via a similar visually cued tongue movement protocol (eg, 68), consisting of alternating tongue movements along the teeth by the patient, or by lip puckering.
Expressive language mapping with fMRI is readily achieved by means of covert object naming and sentence completion tasks. A typical object-naming task consists of a standard block design alternating between stimulus and rest, during which the patient is presented with line drawings of living and inanimate objects (eg, 69), with the instruction to covertly name the object upon presentation. The sentence completion task (eg, 70) involves the presentation of a display of simple sentences with a blank space at the end, and the requirement that the patient completes the sentence in a meaningful way.
Receptive language mapping with fMRI generally follows the protocol described by Binder and colleagues (53) involving a semantic and a tone decision task (see also (71)) where the patients are presented with names of animals and cued to make a button-press response regarding a particular attribute of the animal. This condition is alternated with a tone decision task where patients are presented with sequences of high and low frequency tones, and are instructed to make a button-pressing response when they hear a sequence of two high tones.
CONCORDANCE OF NONINVASIVE AND INVASIVE METHODS
The compatibility of the language lateralization results of the Wada and the fMRI procedure has been attested to in a number of studies with varying patient sample sizes. The results of these studies vary from perfect concordance (54,72,73) to nearly perfect concordance (74–78) or considerably high (71,79–85).
Equally high is the reported concordance between the results of the Wada and MEG procedures with respect to language lateralization ranging from 87% in the study with the largest sample (50) to 100% agreement in the first sub-sample of patients of the same series (48), with the rest of the studies reporting uniformly high concordance (49,58,61,86–92). Far fewer studies report comparisons of laterality estimates for memory between fMRI and Wada. These involve small samples yet high concordance (92,93) but also low (94) and none between MEG and Wada. Furthermore, the degree of concordance between CSM and MEG localization of language-specific cortical patches is quite high. In a study involving a small patient sample, Simos and colleagues (95) showed compatibility of CSM and MEG for localizing receptive language-specific cortical sites, as did a second study involving 47 patients (96).
The same is the case with TMS: In a recent study (97), language mapping with navigated TMS showed an overall sensitivity of 90.2%, specificity of 23.8%, positive predictive value (PPV) of 35.6%, and negative predictive value (NPV) of 83.9% as compared to CSM. For Broca’s area, the corresponding values were: sensitivity of 100%, specificity of 13.0%, PPV of 56.5%, and NPV of 100%, respectively. A good overall concordance between repetitive TMS and CSM was observed, particularly with regard to negatively mapped regions (97). Thus, noninvasive language mapping with TMS is emerging as a valuable adjunct for preoperative mapping of language. Moreover, Tarapore and colleagues (98) demonstrated that the maps of the motor system generated with TMS correlate well with those generated by both MEG and CSM and that negative TMS mapping results also correlate with negative CSM mapping results. Further, the motor maps generated by TMS have been shown to be spatially consistent across multiple sessions (99).
Moreover, equally high is the concordance of localization estimates of the motor and somatosensory cortex between intraoperative CSM and preoperative MEG estimates (56,98,100–101) as is that between invasive electrophysiology and TMS (102–104).
There are, however, remaining questions regarding the proper interpretation of discordant localization and lateralization results between the invasive and the noninvasive methods. Given the assumption that CSM and the Wada test are the gold standards, the tendency is to consider discordant estimates as failures of the noninvasive methods. However, when that assumption is empirically tested, it becomes obvious that neither CSM results nor those of the Wada should be considered as the gold standard any more than the results of the noninvasive methods should. For example, using CSM, Ojemann (105,106) reported extensive temporal lobe involvement in receptive language tasks such as naming, yet Sanai and colleagues (107), also using CSM, found a paucity of naming sites there. Besides limited reliability, CSM has also limited predictive value with respect to postsurgical language and memory performance when the latter is also operationally defined as performance in naming tasks. For example, Ojemann and Dodrill reported 80% predictive accuracy of CSM (108). In another study (109) Cervenka et al reported that in a series of seven patients, language deficits were not anticipated by CSM data, because four had amygdalohippocampectomies, and more importantly because three had deficits, although CSM-determined language loci were not resected. Cervenka et al (110) reported that three of four patients presented language deficits that were not predicted by CSM; Hamberger et al (111) reported that, in their experience, sparing cortical loci that are CSM positive (ie, their stimulation interrupts naming) does not prevent postoperative word finding difficulties; Hermann et al (112), in their review of the results of eight centers involving 217 patients, concluded that CSM-guided surgeries are not any more effective in reducing postoperative naming deficits than non-CSM-guided surgeries.
The efficacy of the Wada procedure for predicting the likelihood of postoperative language and memory deficits is also lower than would be expected for a gold standard, since comparing its efficacy against that of fMRI shows that the latter has better predictive efficacy (113). Also limited is the efficacy of the Wada procedure in predicting memory outcome. Prediction of postoperative verbal memory performance varies from good (114–118) to very low (46,119–123). Meanwhile, dozens of studies are conducted every year for the purpose of fine tuning the noninvasive methods in revealing with increasing reliability brain regions involved in different aspects of memory and language performance using fMRI (ie, 124–127), MEG (ie, 45,52,59,128–130), and lately TMS (97,98,131) and verifying the validity of the findings, mainly against prior knowledge gained by the long experience of lesion studies.
THE FUTURE OF THE NONINVASIVE PROCEDURES
For at least one to two decades, MEG, fMRI, and TMS data have been used as adjunct means of assessing language and memory laterality, language localization, and localization of the somatosensory and motor cortex. In some cases, MEG especially has been used as a means of informing the placement of subdural grid electrodes (132–134) for localizing the cortical sources of epileptiform discharges. However, the question remains: Can the noninvasive methods replace CSM and the Wada procedure? From the review of the relevant literature, it appears that lateralization estimates for language and memory based on fMRI and MEG are by no means objectively inferior to those of Wada if the criterion of postoperative language and memory performance is used to decide the issue. Although the relevant studies are yet to be done, it appears that concordance of fMRI and MEG for estimating language, reinforced by TMS, may provide a more solid estimate of hemispheric specialization. In some centers, the combined use of these methods for presurgical mapping is providing an example as to how they can replace the invasive methods for planning the surgical approach and how it facilitates resection in ways that the invasive procedures cannot. The following examples illustrate these points: Often, it is very difficult to perform CSM, yet it is important to identify the central sulcus. In these cases, any or a combination of MEG, TMS, and fMRI (or PET) may supply that information, as illustrated by the following cases.
Case H.C., a 21-year-old male, had undergone a right frontal topectomy and multiple subpial transections for alleviation of intractable seizures. Case C.F., a 24-year-old female, had surgery for resection of a low-grade oligodendroglioma. In both cases, the procedures reduced, but did not eliminate, the symptoms, and both patients were considered for a second procedure. However, fusion of the dura to the cortical surface eliminated the prospect of CSM for identifying the central sulcus and determining the topography of the motor cortex. However, both were accomplished using MEG, fMRI, and TMS, as shown in Figure 75.5.
It is also impossible to determine the relation of eloquent tissue on the medial aspect of a lesion to be resected using CSM. In such cases a combination of noninvasive methods does provide the relevant information, as illustrated by Case M.B., a 14-year-old male with a left opercular glioma adjacent to Broca’s area (Figure 75.6).
The concordance of the noninvasive methods with the results of the Wada procedure are illustrated in the following two cases, presented in Figure 75.7. Case T.S., a 21-year-old male epilepsy patient with typical left hemisphere dominance for expressive and receptive language, and Case M.N., an 11-year-old female epilepsy patient with atypical right hemisphere language dominance, possibly resulting from extensive resection of a left hemisphere cyst when she was 12 months old.
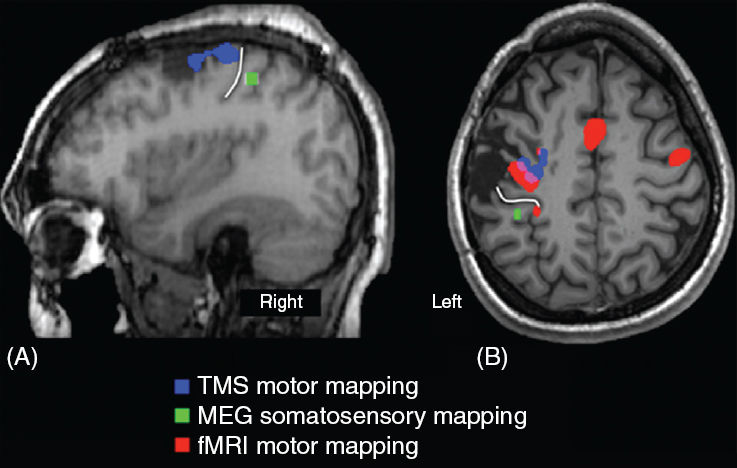
FIGURE 75.5 Determination of motor cortex using noninvasive functional mapping methods. Panel A: A sagittal MR image of patient H.C where the postcentral gyrus was identified as the source of MEG responses to tactile stimulation of contralateral index finger (green). The motor cortex was identified along the precentral gyrus by TMS (blue). The white line indicates the central sulcus in this patient. Panel B: Axial MR image of patient C.F. showing postcentral localization of the MEG-derived source of somatosensory responses (green), and the precentral localization of motor cortex by fMRI (red) and TMS (blue). Overlap between the fMRI- and TMS-identified motor cortex is shown in magenta. The central sulcus is along the white line. In both patients, the motor cortex was along the posterior and medial margins of the resection cavity.
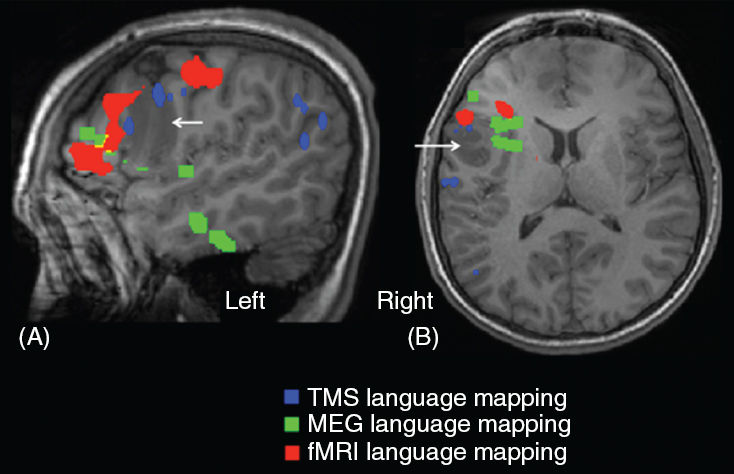
FIGURE 75.6 A sagittal (Panel A) and a transaxial (Panel B) MR image showing the relation of the lesion (white arrow) to the language-specific cortex as determined by fMRI (red), MEG (green), and TMS (blue). Object-naming task was used in MEG and TMS and a sentence completion task was used in the fMRI. Note that the relation at the mesial border of the lesion to expressive language cortex, revealed by MEG and fMRI, could not be determined by CSM.
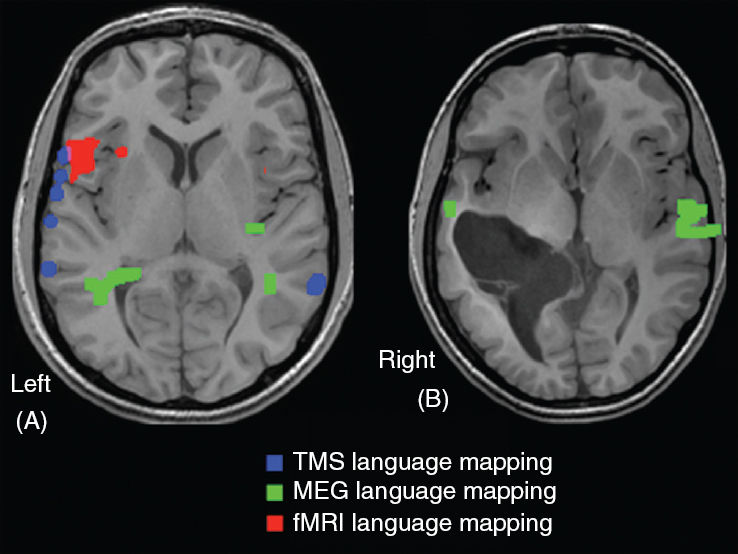
FIGURE 75.7 Panel A: A transaxial MR image of patient T.S. showing concordance of fMRI (red) and TMS (blue) in identifying Broca’s area. A word generation task was used in fMRI while an object-naming task was used in TMS. A part of the receptive language cortex in the same hemisphere was identified by MEG (green) using a verbal stimulation task. Overlap between the fMRI-based and TMS-based identification of Broca’s area is shown in magenta. Panel B: A transaxial MR image of patient M.N. showing the preponderance of right hemisphere activation during a MEG receptive language task, concordant with the Wada procedure.
CONCLUSION
Given that the noninvasive methods can demonstrably assess laterality of language and memory with at least a comparable degree of prediction of postsurgical performance of these functions than that achieved by the Wada procedure, fMRI alone, or MEG alone, but certainly in combination, may suffice to replace the Wada procedure. Moreover, given that MEG and fMRI can provide concordant localization estimates for receptive language to those of CSM and that fMRI can localize the expressive language cortex, the need for awake craniotomies is drastically reduced. This is especially true for localizing the central sulcus and specifying the extent of the motor and somatosensory cortex with MEG (but also with fMRI) and especially with TMS. Therefore, at this point in time, there are no compelling reasons to continue the routine use of the Wada procedure and of CSM in those centers that have fMRI, MEG and TMS facilities.
Additional Resources
University of Tennessee Health Science Center, Department of Pediatrics, Division of Clinical Neurosciences: www.uthsc.edu/pediatrics/neurosciences/
Neuroscience Institute- Le Bonheur Children’s Hospital: www.lebonheur.org/our-services/neuroscience-institute/
REFERENCES
1. Engel JJ, Ojemann GA, Step TN. The next step. In: Engel JJ, ed. Surgical Treatment of the Epilepsies. New York, NY: Raven Press; 1993:319–330.
2. Spencer SS, Nguyen DK, Duckrow RB. Invasive EEG in presurgical evaluation of epilepsy. In: Shorvon S, Perruca E, Engel JJ, eds. The Treatment of Epilepsy: Wiley-Blackwell. 2009:767–798.
3. Knowlton RC, Elgavish RA, Limdi N, et al. Functional imaging: i. relative predictive value of intracranial electroencephalography. Ann Neurol. 2008;64(1):25–34.
4. Knowlton RC, Elgavish RA, Bartolucci A, et al. Functional imaging: ii. prediction of epilepsy surgery outcome. Ann Neurol. 2008;64(1):35–41.
5. Knowlton RC, Elgavish R, Howell J, et al. Magnetic source imaging versus intracranial electroencephalogram in epilepsy surgery: a prospective study. Ann Neurol. 2006;59(5):835–842.
6. Knowlton RC, Razdan SN, Limdi N, et al. Effect of epilepsy magnetic source imaging on intracranial electrode placement. Ann Neurol. 2009;65(6):716–723.
7. Sutherling WW, Mamelak AN, Thyerlei D, et al. Influence of magnetic source imaging for planning intracranial EEG in epilepsy. Neurology. 2008;71(13):990–996.
8. Wheless JW, Willmore LJ, Breier JI, et al. A comparison of magnetoencephalography, MRI, and V-EEG in patients evaluated for epilepsy surgery. Epilepsia. 1999;40(7):931–941.
9. Papanicolaou AC, Pataraia E, Billingsley-Marshall R, et al. Toward the substitution of invasive electroencephalography in epilepsy surgery. J Clin Neurophysiol. 2005;22(4):231–237.
10. Sutherling WW, Crandall PH, Cahan LD, et al. The magnetic field of epileptic spikes agrees with intracranial localizations in complex partial epilepsy. Neurology. 1988;38(5):778–786.
11. Ko DY, Kufta C, Scaffidi D, et al. Source localization determined by magnetoencephalography and electroencephalography in temporal lobe epilepsy: comparison with electrocorticography: technical case report. Neurosurgery. 1998;42(2):414–421.
12. Diekmann V, Becker W, Grözinger B, et al. Localization of focal epileptic activity with a simultaneous EEG and MEG model. In: Baumgartner C, Deecke L, Stroink G, et al, eds. Biomagnetism: Fundamental Research and Clinical Applications. Amsterdam: IOS Press; 1995:23–27.
13. Ebersole JS, Squires KC, Gamelin J, et al. Simultaneous MEG and EEG provide complementary dipole models of temporal lobe spikes. Epilepsia. 1993;34(Suppl 6):143.
14. Ebersole JS. Magnetoencephalography/magnetic source imaging in the assessment of patients with epilepsy. Epilepsia. 1997;38(Suppl 4):S1–S5.
15. Merlet I, Paetau R, Garcia-Larrea L, et al. Apparent asynchrony between interictal electric and magnetic spikes. Neuroreport. 1997;8(5):1071–1076.
16. Nakasato N, Muresan L, Vinet L, et al. Localization and quantification of the human epileptic spike zone using MEG, EEG, MRI and evoked responses with validation by ECoG. In: Hoke M, Erne SN, Okada YC, et al, eds. Biomagnetism: Clinical Aspects. Amsterdam: Elsevier; 1992:79–82.
17. Nakasato N, Levesque MF, Barth DS, et al. Comparisons of MEG, EEG, and ECoG source localization in neocortical partial epilepsy in humans. Electroen Clin Neuro. 1994;91(3):171–178.
18. Knowlton RC, Laxer KD, Aminoff MJ, et al. Magnetoencephalography in partial epilepsy: clinical yield and localization accuracy. Ann Neurol. 1997;42(4):622–631.
19. Ebersole JS, Squires KC, Eliashiv SD, et al. Applications of magnetic source imaging in evaluation of candidates for epilepsy surgery. Neuroimaging Clin N Am. 1995;5(2):267–288.
20. Fuchs M, Wagner M, Wischmann HA, et al. Improving source reconstructions by combining bioelectric and biomagnetic data. Electroen Clin Neuro. 1998;107(2):93–111.
21. Morioka T, Nishio S, Hisada K, et al. Neuromagnetic assessment of epileptogenicity in cerebral arteriovenous malformation. Neurosurg Rev. December 2000;23(4):206–212.
22. Sutherling WW, Crandall PH, Engel J, Jr, et al. The magnetic field of complex partial seizures agrees with intracranial localizations. Ann Neurol. 1987;21(6):548–558.
23. Stefan H, Schneider S, Feistel H, et al. Ictal and interictal activity in partial epilepsy recorded with multichannel magnetoelectroencephalography: correlation of electroencephalography/electrocorticography, magnetic resonance imaging, single photon emission computed tomography, and positron emission tomography findings. Epilepsia. 1992;33(5):874–887.
24. Paetau R, Hamalainen M, Hari R, et al. Magnetoencephalographic evaluation of children and adolescents with intractable epilepsy. Epilepsia. 1994;35(2):275–284.
25. Smith JR, Gallen C, Orrison W, et al. Role of multichannel magnetoencephalography in the evaluation of ablative seizure surgery candidates. Stereot Funct Neuros. 1994;62(1-4):238–244
26. Ebersole JS. Classification of MEG spikes in temporal lobe epilepsy. In: Yoshimoto T, Kotani M, Kuriki S, et al, eds. Recent Advances in Biomagnetism. Sendai: Tohoku University Press; 1999:758–761.
27. Minassian BA, Otsubo H, Weiss S, et al. Magnetoencephalographic localization in pediatric epilepsy surgery: comparison with invasive intracranial electroencephalography. Ann Neurol. 1999;46(4):627–633.
28. Otsubo H, Sharma R, Elliott I, et al. Confirmation of two magnetoencephalographic epileptic foci by invasive monitoring from subdural electrodes in an adolescent with right frontocentral epilepsy. Epilepsia. 1999;40(5):608–613.
29. Luders H, Awad I, Burgess R, et al. Subdural electrodes in the presurgical evaluation for surgery of epilepsy. Epilep Res Supp. 1992;5:147–156.
30. Ishibashi H, Morioka T, Shigeto H, et al. Three-dimensional localization of subclinical ictal activity by magnetoencephalography: correlation with invasive monitoring. Surg Neurol. 1998;50(2):157–163.
31. Pataraia E, Simos PG, Castillo EM, et al. Does magnetoencephalography add to scalp video-EEG as a diagnostic tool in epilepsy surgery? Neurology. 2004;62(6):943–948.
32. La Fougere C, Rominger A, Forster S, et al. PET and SPECT in epilepsy: a critical review. Epilepsy Behav. 2009;15(1):50–55.
33. Catafau AM. Brain SPECT in clinical practice. part I: perfusion. J Nucl Med. 2001;42(2):259–271.
34. Camargo EE. Brain SPECT in neurology and psychiatry. J Nucl Med. 2001;42(4):611–623.
35. Koh S, Jayakar P, Dunoyer C, et al. Epilepsy surgery in children with tuberous sclerosis complex: presurgical evaluation and outcome. Epilepsia. 2000;41(9):1206–1213.
36. Dion JE, Gates PC, Fox AJ, et al. Clinical events following neuroangiography: a prospective study. Stroke. 1987;18(6):997–1004.
37. Rausch R, Silfvenius H, Wieser HG, et al. Intraarterial amobarbital procedures. In: Engel JJ, ed. Surgical Treatment of the Epilepsies. 2nd ed. New York, NY: Raven Press; 1993:341–357.
38. Young N, Chi KK, Ajaka J, et al. Complications with outpatient angiography and interventional procedures. Cardiovasc Intervent Radiol. 2002;25(2):123–126.
39. Wiggins GC, Elisevich K, Smith BJ. Morbidity and infection in combined subdural grid and strip electrode investigation for intractable epilepsy. Epilepsy Res. 1999;37(1):73–80.
40. van Gompel JJ, Worrell GA, Bell ML, et al. Intracranial electroencephalography with subdural grid electrodes: techniques, complications, and outcomes. Neurosurgery. 2008;63(3):498–505.
41. Hamer HM, Morris HH, Mascha EJ, et al. Complications of invasive video-EEG monitoring with subdural grid electrodes. Neurology. 2002;58(1):97–103.
42. Mcmackin D, Dubeau F, Jones-Gotman M, et al. Assessment of the functional effect of the intracarotid sodium amobarbital procedure using co-registered MRI/HMPAO-SPECT and SEEG. Brain and Cognition. 1997;33(1):50–70.
43. Jeffery PJ, Monsein LH, Szabo Z, et al. Mapping the distribution of amobarbital sodium in the intracarotid Wada test by use of tc-99m HMPAO with SPECT. Radiology. 1991;178(3):847–850.
44. de Silva R, Duncan R, Patterson J, et al. Regional cerebral perfusion and amytal distribution during the Wada test. J Nucl Med. 1999;40(5):747–752.
45. Papanicolaou AC, Simos PG, Castillo EM, et al. The hippocampus and memory of verbal and pictorial material. Learn Mem. 2002;9(3):99–104.
46. Binder JR, Sabsevitz DS, Swanson SJ, et al. Use of preoperative functional MRI to predict verbal memory decline after temporal lobe epilepsy surgery. Epilepsia. 2008;49(8):1377–1394.
47. Binder JR, Swanson SJ, Sabsevitz DS, et al. A comparison of two fMRI methods for predicting verbal memory decline after left temporal lobectomy: language lateralization versus hippocampal activation asymmetry. Epilepsia. 2010;51(4):618–626.
48. Breier JI, Simos PG, Zouridakis G, et al. Language dominance determined by magnetic source imaging: a comparison with the Wada procedure. Neurology. 1999;53(5):938–945.
49. Maestu F, Ortiz T, Fernandez A, et al. Spanish language mapping using MEG: a validation study. Neuroimage. 2002;17(3):1579–1586.
50. Papanicolaou AC, Simos PG, Castillo EM, et al. Magnetocephalography: a noninvasive alternative to the Wada procedure. J Neurosurg Pediatr. 2004;100(5):867–876.
51. Bowyer SM, Moran JE, Mason KM, et al. MEG localization of language-specific cortex utilizing MR-FOCUSS. Neurology. 2004;62(12):2247–2255.
52. Passaro AD, Rezaie R, Moser DC, et al. Optimizing estimation of hemispheric dominance for language using magnetic source imaging. Brain Res. 2011;1416:44–50.
53. Binder JR, Rao SM, Hammeke TA, et al. Lateralized human brain language systems demonstrated by task subtraction functional magnetic resonance imaging. Arch Neurol. 1995;52(6):593–601.
54. Desmond JE, Sum JM, Wagner AD, et al. Functional MRI measurement of language lateralization in Wada-tested patients. J Neurol. 1995;118(Pt 6):1411–1419.
55. Rossini PM, Barker AT, Berardelli A, et al. Non-invasive electrical and magnetic stimulation of the brain, spinal cord and roots: basic principles and procedures for routine clinical application. Report of an IFCN committee. Electroen Clin Neuro. 1994;91(2):79–92.
56. Castillo EM, Simos PG, Wheless JW, et al. Integrating sensory and motor mapping in a comprehensive MEG protocol: clinical validity and replicability. Neuroimage. 2004;21(3):973–983.
57. Birg L, Narayana S, Rezaie R, et al. Technical tips: MEG and EEG with sedation. Neurodiagn J. 2013;53(3):229–240.
58. Breier JI, Simos PG, Wheless JW, et al. Language dominance in children as determined by magnetic source imaging and the intracarotid amobarbital procedure: a comparison. J Child Neurol. 2001;16(2):124–130.
59. Papanicolaou AC, Pazo-Alvarez P, Castillo EM, et al. Functional neuroimaging with MEG: normative language profiles. Neuroimage. 2006;33(1):326–342.
60. Kamada K, Sawamura Y, Takeuchi F, et al. Expressive and receptive language areas determined by a non-invasive reliable method using functional magnetic resonance imaging and magnetoencephalography. Neurosurgery. 2007;60(2):296–305.
61. Bowyer SM, Moran JE, Weiland BJ, et al. Language laterality determined by MEG mapping with MR-FOCUSS. Epilepsy Behav. 2005;6(2):235–241.
62. Castillo EM, Simos PG, Venkataraman V, et al. Mapping of expressive language cortex using magnetic source imaging. Neurocase. 2001;7(5):419–422.
63. Findlay AM, Ambrose JB, Cahn-Weiner DA, et al. Dynamics of hemispheric dominance for language assessed by magnetoencephalographic imaging. Ann Neurol. 2012;71(5):668–686.
64. Rao SM, Bandettini PA, Binder JR, et al. Relationship between finger movement rate and functional magnetic resonance signal change in human primary motor cortex. J Cereb Blood Flow Metab. 1996;16(6):1250–1254.
65. Witt ST, Laird AR, Meyerand ME. Functional neuroimaging correlates of finger-tapping task variations: an ALE meta-analysis. Neuroimage. 2008;42(1):343–356.
66. Shurtleff H, Warner M, Poliakov A, et al. Functional magnetic resonance imaging for presurgical evaluation of very young pediatric patients with epilepsy. J Neurosurg Pediatr. 2010;5(5):500–506.
67. Shriver S, Knierim KE, O’Shea JP, et al. Pneumatically driven finger movement: a novel passive functional MR imaging technique for presurgical motor and sensory mapping. AJNR Am J Neuroradiol. 2013;34(1):E5–7.
68. Krishnan R, Raabe A, Hattingen E, et al. Functional magnetic resonance imaging-integrated neuronavigation: correlation between lesion-to-motor cortex distance and outcome. Neurosurgery. 2004;55(4):904–914.
69. Szekely A, D’Amico S, Devescovi A, et al. Timed action and object naming. Cortex. 2005;41(1):7–25.
70. Ashtari M, Perrine K, Elbaz R, et al. Mapping the functional anatomy of sentence comprehension and application to presurgical evaluation of patients with brain tumor. AJNR Am J Neuroradiol. 2005;26(6):1461–1468.
71. Janecek JK, Swanson SJ, Sabsevitz DS, et al. Language lateralization by fMRI and Wada testing in 229 patients with epilepsy: rates and predictors of discordance. Epilepsia. 2013;54(2):314–322.
72. Benson RR, Fitzgerald DB, Lesueur LL, et al. Language dominance determined by whole brain functional MRI in patients with brain lesions. Neurology. 1999;52(4):798–809.
73. Deblaere K, Boon PA, Vandemaele P, et al. MRI language dominance assessment in epilepsy patients at 1.0 T: region of interest analysis and comparison with intracarotid amytal testing. Neuroradiology. 2004;46(6):413–420.
74. Binder JR, Swanson SJ, Hammeke TA, et al. Determination of language dominance using functional MRI: a comparison with the Wada test. Neurology. 1996;46(4):978–984.
75. Hertz-Pannier L, Gaillard WD, Mott SH, et al. Noninvasive assessment of language dominance in children and adolescents with functional MRI: a preliminary study. Neurology. 1997;48(4):1003–1012.
76. Carpentier A, Pugh KR, Westerveld M, et al. Functional MRI of language processing: dependence on input modality and temporal lobe epilepsy. Epilepsia. 2001;42(10):1241–1254.
77. Sabbah P, Chassoux F, Leveque C, et al. Functional MR imaging in assessment of language dominance in epileptic patients. Neuroimage. 2003;18(2):460–467.
78. Woermann FG, Jokeit H, Luerding R, et al. Language lateralization by Wada test and fMRI in 100 patients with epilepsy. Neurology. 2003;61(5):699–701.
79. Szaflarski JP, Holland SK, Jacola LM, et al. Comprehensive presurgical functional MRI language evaluation in adult patients with epilepsy. Epilepsy Behav. 2008;12(1):74–83.
80. Lehericy S, Cohen L, Bazin B, et al. Functional MR evaluation of temporal and frontal language dominance compared with the Wada test. Neurology. 2000;54(8):1625–1633.
81. Benke T, Koylu B, Visani P, et al. Language lateralization in temporal lobe epilepsy: a comparison between fMRI and the Wada test. Epilepsia. 2006;47(8):1308–1319.
82. Arora J, Pugh K, Westerveld M, et al. Language lateralization in epilepsy patients: fMRI validated with the Wada procedure. Epilepsia. 2009;50(10):2225–2241.
83. Suarez RO, Whalen S, Nelson AP, et al. Threshold-independent functional MRI determination of language dominance: a validation study against clinical gold standards. Epilepsy Behav. 2009;16(2):288–297.
84. Jones SE, Mahmoud SY, Phillips MD. A practical clinical method to quantify language lateralization in fMRI using whole-brain analysis. Neuroimage. 2011;54(4):2937–2949.
85. Zaca D, Nickerson JP, Deib G, et al. Effectiveness of four different clinical fMRI paradigms for preoperative regional determination of language lateralization in patients with brain tumors. Neuroradiology. 2012;54(9):1015–1025.
86. Hirata M, Kato A, Taniguchi M, et al. Determination of language dominance with synthetic aperture magnetometry: comparison with the Wada test. Neuroimage. 2004;23(1):46–53.
87. Hirata M, Goto T, Barnes G, et al. Language dominance and mapping based on neuromagnetic oscillatory changes: comparison with invasive procedures. J Neurosurg. 112(3):528–538.
88. Merrifield WS, Simos PG, Papanicolaou AC, et al. Hemispheric language dominance in magnetoencephalography: sensitivity, specificity, and data reduction techniques. Epilepsy Behav. 2007;10(1):120–128.
89. Doss RC, Zhang W, Risse GL, et al. Lateralizing language with magnetic source imaging: validation based on the Wada test. Epilepsia. 2009;50(10):2242–2248.
90. McDonald CR, Thesen T, Hagler DJ, Jr, et al. Distributed source modeling of language with magnetoencephalography: application to patients with intractable epilepsy. Epilepsia. 2009;50(10):2256–2266.
91. Tanaka N, Liu H, Reinsberger C, et al. Language lateralization represented by spatiotemporal mapping of magnetoencephalography. AJNR Am J Neuroradiol. 2013;34(3):558–563.
92. Detre JA, Maccotta L, King D, et al. Functional MRI lateralization of memory in temporal lobe epilepsy. Neurology. 1998;50(4):926–932.
93. Golby AJ, Poldrack RA, Illes J, et al. Memory lateralization in medial temporal lobe epilepsy assessed by functional MRI. Epilepsia. 2002;43(8):855–863.
94. Deblaere K, Backes WH, Tieleman A, et al. Lateralized anterior mesiotemporal lobe activation: semirandom functional MR imaging encoding paradigm in patients with temporal lobe epilepsy—initial experience. Radiology. 2005;236(3):996–1003.
95. Simos PG, Papanicolaou AC, Breier JI, et al. Localization of language-specific cortex by using magnetic source imaging and electrical stimulation mapping. J Neurosurg. November 1999;91(5):787–796.
96. Castillo EM, Breier JI, Wheless JW, et al. Contributions of direct cortical stimulation and MEG recordings to identify “essential” language cortex. Epilepsia. 2005;46(Suppl 8):324.
97. Picht T, Krieg SM, Sollmann N, et al. A comparison of language mapping by preoperative navigated transcranial magnetic stimulation and direct cortical stimulation during awake surgery. Neurosurgery. 2013;72(5):808–819.
98. Tarapore PE, Tate MC, Findlay AM, et al. Preoperative multimodal motor mapping: a comparison of magnetoencephalography imaging, navigated transcranial magnetic stimulation, and direct cortical stimulation. J Neurosurg. 2012;117(2):354–362.
99. McGregor KM, Carpenter H, Kleim E, et al. Motor map reliability and aging: a TMS/fMRI study. Exp Brain Res. 2012;219(1):97–106.
100. Ganslandt O, Fahlbusch R, Nimsky C, et al. Functional neuronavigation with magnetoencephalography: outcome in 50 patients with lesions around the motor cortex. J Neurosurg. July 1999;91(1):73–79.
101. Makela JP, Kirveskari E, Seppa M, et al. Three-dimensional integration of brain anatomy and function to facilitate intraoperative navigation around the sensorimotor strip. Hum Brain Mapp. 2001;12(3):180–192.
102. Pascual-Leone A and Walsh V. Transcranial magnetic stimulation. In: Mazziotta J, Toga A, ed. Brain Mapping: The Methods. San Diego, CA: Academic Press; 2003.
103. Rossi S, Hallett M, Rossini PM, et al. Safety, ethical considerations, and application guidelines for the use of transcranial magnetic stimulation in clinical practice and research. Clin Neurophysiol. 2009;120(12):2008–2039.
104. Wassermann EM, Zimmermann T. Transcranial magnetic brain stimulation: therapeutic promises and scientific gaps. Pharmacol Therapeut. 2012;133(1):98–107.
105. Ojemann GA. Organization of language cortex derived from investigations during neurosurgery. Semin Neurosci. 1990;2:297–306.
106. Ojemann GA. Cortical organization of language. J Cogn Neurosc. 1991;11(8):2281–2287.
107. Sanai N, Mirzadeh Z, Berger MS. Functional outcome after language mapping for glioma resection. N Engl J Med. 2008;358(1):18–27.
108. Ojemann GA, Dodrill CB. Verbal memory deficits after left temporal lobectomy for epilepsy. mechanism and intraoperative prediction. J Neurosurg. 1985;62(1):101–107.
109. Cervenka MC, Corines J, Boatman-Reich DF, et al. Electrocorticographic functional mapping identifies human cortex critical for auditory and visual naming. Neuroimage. 2013;69:267–276.
110. Cervenka MC, Boatman-Reich DF, Ward J, et al. Language mapping in multilingual patients: electrocorticography and cortical stimulation during naming. Front Hum Neurosci. 2011;5:13.
111. Hamberger MJ, Seidel WT, Mckhann Gm 2nd, et al. Brain stimulation reveals critical auditory naming cortex. J Neurol. 2005;128(Pt 11):2742–2749.
112. Hermann B, Davies K, Foley K, et al. Visual confrontation naming outcome after standard left anterior temporal lobectomy with sparing versus resection of the superior temporal gyrus: a randomized prospective clinical trial. Epilepsia. 1999;40(8):1070–1076.
113. Sabsevitz DS, Swanson SJ, Hammeke TA, et al. Use of preoperative functional neuroimaging to predict language deficits from epilepsy surgery. Neurology. 2003;60(11):1788–1792.
114. Kneebone AC, Chelune GJ, Dinner DS, et al. Intracarotid amobarbital procedure as a predictor of material-specific memory change after anterior temporal lobectomy. Epilepsia. 1995;36(9):857–865.
115. Loring DW, Meador KJ, Lee GP, et al. Wada memory asymmetries predict verbal memory decline after anterior temporal lobectomy. Neurology. 1995;45(7):1329–1333.
116. Bell BD, Davies KG, Hermann BP, et al. Confrontation naming after anterior temporal lobectomy is related to age of acquisition of the object names. Neuropsychologia. 2000;38(1):83–92.
117. Chiaravalloti ND, Glosser G. Material-specific memory changes after anterior temporal lobectomy as predicted by the intracarotid amobarbital test. Epilepsia. 2001;42(7):902–911.
118. Sabsevitz DS, Swanson SJ, Morris GL, et al. Memory outcome after left anterior temporal lobectomy in patients with expected and reversed Wada memory asymmetry scores. Epilepsia. 2001;42(11):1408–1415.
119. Chelune GJ, Naugle RI, Luders H, et al. Prediction of cognitive change as a function of preoperative ability status among temporal lobectomy patients seen at 6-month follow-up. Neurology. 1991;41(3):399–404.
120. Stroup E, Langfitt J, Berg M, et al. Predicting verbal memory decline following anterior temporal lobectomy (ATL). Neurology. 2003;60(8):1266–1273.
121. Lacruz ME, Alarcon G, Akanuma N, et al. Neuropsychological effects associated with temporal lobectomy and amygdalohippocampectomy depending on Wada test failure. J Neurol Neurosurg Psychiatry. 2004;75(4):600–607.
122. Kirsch HE, Walker JA, Winstanley FS, et al. Limitations of Wada memory asymmetry as a predictor of outcomes after temporal lobectomy. Neurology. 2005;65(5):676–680.
123. Lineweaver TT, Morris HH, Naugle RI, et al. Evaluating the contributions of state-of-the-art assessment techniques to predicting memory outcome after unilateral anterior temporal lobectomy. Epilepsia. 2006;47(11):1895–1903.
124. Strandberg M, Elfgren C, Mannfolk P, et al. fMRI memory assessment in healthy subjects: a new approach to view lateralization data at an individual level. Brain Imaging Behav. 2011;5(1):1–11.
125. Jansen A, Sehlmeyer C, Pfleiderer B, et al. Assessment of verbal memory by fMRI: lateralization and functional neuroanatomy. Clin Neurol Neurosurg. 2009;111(1):57–62.
126. Seghier ML, Kherif F, Josse G, et al. Regional and hemispheric determinants of language laterality: implications for preoperative fMRI. Hum Brain Mapp. 2011;32(10):1602–1614.
127. Niskanen E, Kononen M, Villberg V, et al. The effect of fMRI task combinations on determining the hemispheric dominance of language functions. Neuroradiology. 2012;54(4):393–405.
128. Mohamed IS, Cheyne D, Gaetz WC, et al. Spatiotemporal patterns of oscillatory brain activity during auditory word recognition in children: a synthetic aperture magnetometry study. Int J Psychophysiol. May 8, 2008;68(2):141–148.
129. Kim JS, Chung CK. Language lateralization using MEG beta frequency desynchronization during auditory oddball stimulation with one-syllable words. Neuroimage. 2008;42(4):1499–1507.
130. Riggs L, Moses SN, Bardouille T, et al. A complementary analytic approach to examining medial temporal lobe sources using magnetoencephalography. Neuroimage. 2009;45(2):627–642.
131. Coburger J, Karhu J, Bittl M, et al. First preoperative functional mapping via navigated transcranial magnetic stimulation in a 3-year-old boy. J Neurosurg Pediatr. 2012;9(6):660–664.
132. Ochi A, Otsubo H. Magnetoencephalography-guided epilepsy surgery for children with intractable focal epilepsy: sickkids experience. Int J Psychophysiol. 2008;68(2):104–110.
133. Blount JP, Cormier J, Kim H, et al. Advances in intracranial monitoring. Neurosurg Focus. 2008;25(3):E18.
134. Vitikainen AM, Lioumis P, Paetau R, et al. Combined use of non-invasive techniques for improved functional localization for a selected group of epilepsy surgery candidates. Neuroimage. 2009;45(2):342–348.
Related posts:
 Epilepsy Febrile Seizure Plus (GEFS+)Douglas R. Nordli, Jr. and John M. Pellock
 Dominant Focal EpilepsiesSarah Weckhuysen, Mary Kurian, Fabienne Picard, and Stephanie Baulac
and PrimidoneStephen Fulton and Amy McGregor
Dominant Focal EpilepsiesSarah Weckhuysen, Mary Kurian, Fabienne Picard, and Stephanie Baulac
and PrimidoneStephen Fulton and Amy McGregor
 in Epilepsy: A Network and Neurodevelopmental PerspectiveRaman Sankar and Edward C. Cooper
 Self-Limited EpilepsiesDouglas R. Nordli, Jr., Colin D. Ferrie, and Chrysostomos P. Panayiotopoulos
 the Child With SeizureDon K. Mathew and Lawrence D. Morton
