[level-membership-for-cardiovascular-category]
Chapter 22 Post-Infarction Sustained Monomorphic Ventricular Tachycardia
Pathophysiology
Classification of Ventricular Tachycardia
Ventricular tachycardia (VT) is defined as a tachycardia (rate >100 beats/min) with three or more consecutive beats that originates below the bifurcation of the His bundle (HB), in the specialized conduction system, the ventricular muscle, or in a combination of both tissues, independent of atrial or atrioventricular nodal (AVN) conduction.1,2
Classification According to Tachycardia Morphology
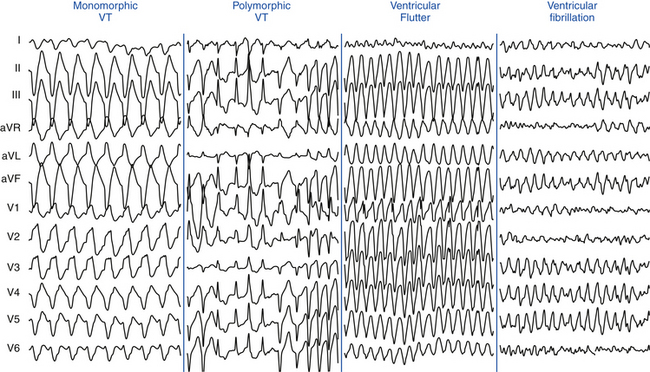
Monomorphic VT has a single stable QRS morphology from beat to beat, indicating repetitive ventricular depolarization in the same sequence (Fig. 22-1). Multiple monomorphic VTs refers to more than one morphologically distinct monomorphic VT, occurring as different episodes or induced at different times. Polymorphic VT has a continuously changing or multiform QRS morphology (i.e., no constant morphology for more than five complexes, no clear isoelectric baseline between QRS complexes, or QRS complexes that have different morphologies in multiple simultaneously recorded leads), indicating a variable sequence of ventricular activation and no single site of origin (see Fig. 22-1).3 Torsades de pointes is a polymorphic VT associated with a long QT interval, and is electrocardiographically characterized by twisting of the peaks of the QRS complexes around the isoelectric line during the arrhythmia. Pleomorphic VT has more than one morphologically distinct QRS complex occurring during the same episode of VT, but the QRS morphology is not continuously changing. Bidirectional VT is associated with a beat-to-beat alternans in the QRS frontal plane axis, often associated with digitalis toxicity or catecholaminergic VT. Ventricular flutter is a term that has been applied to a rapid (250 to 350 beats/min) VT that has a sinusoidal QRS configuration that prevents identification of the QRS morphology (see Fig. 22-1). Ventricular fibrillation (VF) is a rapid (usually >350 beats/min), grossly irregular ventricular rhythm with marked variability in QRS amplitude and cycle length (CL), and a changing morphology (see Fig. 22-1).1,2
Classification According to Tachycardia Duration
Sustained VT lasts for more than 30 seconds or requires termination (e.g., cardioversion) in less than 30 seconds because of hemodynamic compromise, whereas nonsustained VT is a tachycardia at more than 100 beats/min lasting for three or more complexes but for less than 30 seconds.3 However, during electrophysiological (EP) testing, nonsustained VT is defined as more than five or six complexes of non–bundle branch reentrant (BBR) VT, regardless of morphology. BBR complexes are frequent (50%) in normal individuals in response to a ventricular extrastimulation (VES) and have no relevance to clinical nonsustained VT. Repetitive polymorphic responses are also common (up to 50%), especially in response to multiple (three or more) VESs with very short coupling intervals (less than 180 milliseconds). The clinical significance of induced polymorphic nonsustained VT is questionable.3 Incessant VT is a continuous sustained VT that recurs promptly over several hours despite repeated interventions (e.g., electrical cardioversion) for termination.4 Less commonly, incessant VT manifests as repeated bursts of VT that spontaneously terminate for a few intervening sinus beats, followed by the next tachycardia burst. The latter form is more common with the idiopathic VTs (see Fig. 23-1).1,2
Classification According to QRS Morphology in V1
VT with a left bundle branch block (LBBB)-like pattern has a predominantly negative QRS polarity in lead V1 (QS, rS, qrS), whereas VT with a right bundle branch block (RBBB)-like pattern has a predominantly positive QRS polarity in lead V1 (rsR′, qR, RR, R, RS). However, the VT may not show features characteristic of the same bundle branch block (BBB)-like morphology in other leads.1,3
Classification According to Tachycardia Mechanism
Focal VT has a point source of earliest ventricular activation with a centrifugal spread of activation from that site. The mechanism can be automaticity, triggered activity, or microreentry. Scar-related reentrant VT describes arrhythmias that have characteristics of reentry and originate from an area of myocardial scar identified from electrogram characteristics or myocardial imaging. Large reentry circuits that can be defined over several centimeters are commonly referred to as “macroreentry” circuits.1,2
Mechanism of Post-Infarction Ventricular Tachycardia
The majority of sustained monomorphic VTs (SMVTs) are caused by reentry involving a region of ventricular scar. The scar is most commonly caused by an old myocardial infarction (MI), but right ventricular (RV) dysplasia, sarcoidosis, Chagas disease, other nonischemic cardiomyopathies, surgical ventricular incisions for repair of tetralogy of Fallot, other congenital heart diseases, or ventricular volume reduction surgery (Batista procedure) can also cause scar-related reentry. Dense fibrotic scar creates areas of anatomical conduction block, and fibrosis between surviving myocyte bundles decreases cell-cell coupling and distorts the path of propagation, causing areas of slow conduction and block, which promotes reentry. In post-MI VT, a variety of different circuit configurations are possible. Generally, the reentrant circuit arises in areas of fibrosis interspersed with bundles of viable myocytes, producing a zigzag course of activation of and transverse conduction along a pathway lengthened by branching and merging bundles of surviving myocytes, leading to inhomogeneous anisotropy (see Fig. 3-18). Heterogeneity in tissue composition and autonomic innervations in these regions may create areas of aberrant conduction that generate the substrate for reentrant arrhythmias. Buried in the arrhythmogenic area is the common central pathway, the critical isthmus, causing slowing of impulse conduction, allowing reentry to occur. The isthmus itself can be surrounded by dead ends or branches that do not participate in the common pathway of the main reentrant circuit (bystander).4,5
Although previous data suggested that most isthmuses are anatomically determined by heterogeneous scar geometry, a recent study found that the diastolic pathway critical to post-MI VT reentrant circuits is typically protected by a boundary of fixed and functional block. In the majority of cases, development of functional unidirectional block was a prerequisite for initiation of VT, by protecting a region of myocardium that subsequently forms at least one border of the diastolic pathway. Evidence indicates that formation of functional block leading to reentry is associated with large dispersion in refractory periods over short anatomical distances.6
The critical isthmus contained in these reentry circuits often is a narrow path of tissue with abnormal conduction properties. Depolarization of the small mass of tissue in the isthmus is usually not detectable on the surface electrocardiogram (ECG) and constitutes the electrical diastole between QRS complexes during VT. The wavefront leaves the isthmus at the exit site and propagates out to depolarize the remainder of the ventricles, producing the QRS complex. After leaving the exit of the isthmus, the reentrant wavefront can return back to the entrance of the isthmus through an outer loop or an inner loop (see Fig. 5-14).4 An outer loop is a broad sheet of myocardium along the border of the infarct. Depolarization of the outer loop can be detectable on the surface ECG. Reentrant circuits can have one or more outer loops. An inner loop is contained within the scar. Inner loop pathways can serve as potential components of a new reentrant circuit should the central common pathway be ablated. If multiple loops exist, the loop with the shortest conduction time generally determines the VT CL and is therefore the dominant loop. Any loop with a longer conduction time behaves as a bystander. Those bystander loops can serve as a potential component of a new reentrant circuit if the dominant loop is ablated.
The critical isthmus in post-MI VT is typically bounded by two approximately parallel conduction barriers that consist of a line of double potentials, a scar area, or the mitral annulus. The endocardial reentrant VT rotates around the isthmus boundaries and propagates slowly through the critical isthmus, which harbors diastolic potentials and measures, on average, approximately 30 mm long by 16 mm wide. The axis of a critical isthmus is typically oriented parallel to the mitral annulus plane in perimitral circuits and perpendicular to the mitral annulus plane in other circuits.4 Ablation lesions produced with standard radiofrequency (RF) ablation catheters are usually less than 8 mm in diameter, relatively small in relation to the entire reentry circuit, and can be smaller than the width of the reentry path at different points in the circuit. Successful ablation of a large circuit is achieved by targeting an isthmus where the circuit can be interrupted with one or a small number of RF lesions, or by creating a line of RF lesions through a region containing the reentry circuit.
A recent study using electroanatomical substrate mapping found that patients without clinical SMVT had markedly smaller endocardial low-voltage areas, fewer scar-related electrograms (i.e., fractionated, isolated, and very late potentials, which represent electrically viable sites within the scar), and fewer putative conducting channels compared with similar ischemic cardiomyopathy patients with spontaneous SMVT, despite equally severe left ventricular (LV) dysfunction as well as similar infarct age and distribution. These differences in the endocardial EP substrate can play an important role in VT arrhythmogenesis in the chronic post-MI context. Both the extent of the scar areas (electrogram voltage <0.5 mV) and the presence of numerous channels within this zone seem to be critical to the development of VT. Although the border zone region of the scar (electrogram voltage, 0.5 to 1.5 mV) did not differ in area between the two groups, this zone also had a significantly higher prevalence of putative conducting channels in the SMVT patients. This suggests a fundamentally different scar composition (more “arrhythmogenic”) in the SMVT patients. As noted, inhomogeneous scarring with varying degrees of subendocardial myocardial fiber preservation within dense zones of fibrosis leads to slowed conduction, nonuniform anisotropy, and the potential for channels within the scar zone—conditions necessary for the development of reentry.7
A focal mechanism of VT (abnormal automaticity or triggered activity) has been implicated in the settings of acute ischemia. Focal VT may also occur in the absence of an acute ischemic event in patients with chronic ischemic heart disease. A recent study found that a focal mechanism was present in up to 9% of VTs that were induced in patients with ischemic heart disease during EP study for RF ablation.8
Clinical Considerations
Epidemiology
Coronary heart disease is the most frequent cause of clinically documented VT and VF (76% to 82% of patients). The incidence of SMVT in patients with an acute MI varies with the type of MI. Among almost 41,000 patients with an ST elevation (Q wave) MI treated with thrombolysis in the GUSTO-1 trial, 3.5% developed VT alone and 2.7% developed both VT and VF. A pooled analysis of four major trials of almost 25,000 patients with a non–ST elevation acute coronary syndrome (non–ST elevation MI and unstable angina) noted a lower incidence of VT—0.8% developed VT alone and 0.3% developed both VT and VF.1,9
SMVT within the first 2 days of acute MI is uncommon, occurring in up to 3% of patients as a primary arrhythmia and with VF in up to 2%, and is associated with an increase in in-hospital mortality compared with those without this arrhythmia. However, among 21- to 30-day survivors, mortality at 1 year is not increased, suggesting that the arrhythmogenic mechanisms can be transient in early post-MI SMVT. On the other hand, the typical patient with SMVT occurring during the subacute and healing phases, beginning more than 48 hours after an acute MI, has had a large, often complicated infarct with a reduced LV ejection fraction (LVEF), and such VT is a predictor of a worse prognosis.9 SMVT within 3 months of an MI is associated with a 2-year mortality rate of 40% to 50%, with most deaths being sudden. Predictors of increased mortality in these patients are anterior wall MI; frequent episodes of sustained VT, nonsustained VT, or both; heart failure; and multivessel coronary disease, particularly in individuals with residual ischemia.
Early reperfusion of infarct-related arteries results in less aneurysm formation, smaller scars, and less extensive EP abnormalities, although a significant risk of late VT (often with rapid CLs) persists.2,10 In patients with ST elevation MI treated with primary percutaneous coronary intervention, delayed reperfusion (>5 hours after MI) was associated with a sixfold increase in the odds of inducible SMVT by programmed electrical stimulation (performed 6 to 10 days post-MI) as well as an increased risk of spontaneous ventricular arrhythmias and SCD (after a mean follow-up of 28 ± 13 months) compared with early reperfusion (≤3 hours) independent of LVEF. It was estimated that each 1-hour delay in reperfusion conferred a 10.4% increase in the odds of inducible VT.11
Recent evidence suggests that coronary revascularization before or shortly after implantable cardioverter-defibrillator (ICD) placement in high-risk post-MI patients with LV dysfunction and wide QRS duration can potentially reduce the risk for life-threatening ventricular arrhythmias and appropriate ICD shocks, and, hence, improve quality of life and reduce mortality.12
SCD accounts for up to 15% of total mortality in industrialized countries and claims the lives of more than 300,000 people per year in the United States. Approximately 50% of deaths in patients with prior MI occur suddenly and unexpectedly. Ventricular arrhythmias are responsible for most of these deaths in stable ambulatory populations. Most SCD victims have known heart disease—most frequently coronary artery disease or prior MI. Cardiac arrest is the initial manifestation of heart disease in approximately 50% of cases. Such patients are more likely to have single-vessel coronary disease and normal or mildly abnormal LV systolic function than cardiac arrest victims with prior MI. Although heart failure increases risk for both sudden and nonsudden death, a history of heart failure is present in only approximately 10% of arrest victims.13
The risk for total and arrhythmic mortality is highest in the first month after an acute MI and stays high during the first 6 months after acute MI. After the first year post-MI, there appears to be a relatively quiescent period of relatively low rates of SCD, followed by a second peak 4 to 10 years after acute MI. The later occurrence of SCD may result from delayed ventricular remodeling resulting in the creation or activation of reentrant VT circuits on the infarct border as well as from heart failure developing late after MI.14
Several studies in patients with cardiac arrest have shown that VF as the causative rhythm appears to be decreasing, being replaced by pulseless electrical activity and asystole. Although the cause of this change is unknown, it may reflect patients with sicker hearts who are living longer due to better therapy. Hearts with advanced disease may be more likely to develop pulseless electrical activity and asystole than VF.15
Initial Evaluation
Evaluation of Type and Burden of Ventricular Arrhythmias
Identifying and quantifying the types and burden of sustained and nonsustained VT are necessary. Ideally, a 12-lead ECG should be obtained. In patients with ICDs, stored device data such as electrogram morphology and CL can be used to identify the clinical VT.2
Evaluation of Myocardial Ischemia
Although recurrent SMVT is rarely due to acute myocardial ischemia in patients with known coronary artery disease, diagnostic evaluation for acute or persistent ischemia is warranted to improve patient outcome, especially if the severity of coronary artery disease has not been previously established or prior episodes of VT caused hemodynamic compromise. This may include echocardiographic examination, exercise testing, and cardiac catheterization. In patients with reversible myocardial ischemia, coronary revascularization may be warranted, and can potentially reduce the risk of life-threatening ventricular arrhythmias.12 However, if the severity of coronary disease has been recently defined and symptoms and hemodynamic tolerance of VT do not suggest significant ischemia, further evaluation may not be required.1,2
PreAblation Evaluation
Patients with post-MI VT should be evaluated for comorbidities that can alter the approach to mapping and ablation. Treatment of congestive heart failure and myocardial ischemia should be optimized. Coronary revascularization should be considered in patients with reversible ischemia, because substantial ischemic burden can often be aggravated by the potential induction of prolonged periods of tachycardia or hemodynamically unstable arrhythmias during the ablation procedure. In patients with frequent or incessant VT, however, catheter ablation may be required on an urgent basis before the assessment for coronary artery disease in order to gain prompt control of the ventricular arrhythmia.1,2
In patients with suspected peripheral vascular disease, evaluation of the presence of severe arterial disease is warranted, as it can affect the approach to LV access (atrial transseptal versus retrograde transaortic versus epicardial).16 Similarly, an atrial transseptal approach allowing access to the LV through the mitral valve can be considered in the presence of a mechanical aortic valve or severe aortic valve disease.2
Assessment of the risks for sedation and anesthesia must be performed prior to the procedure, because these patients are likely to require deep sedation or general anesthesia.2
Arrhythmogenic Substrate Imaging
Echocardiography
Transthoracic echocardiography is routinely performed to evaluate LV systolic function, LVEF, and wall motion abnormalities that may contain the potential VT substrate. Transthoracic echocardiography also serves as a reliable tool to rule out ventricular thrombi before LV procedures. Additionally, it helps to identify relatively infrequent cardiomyopathies associated with VT, for example, arrhythmogenic right ventricular dysplasia-cardiomyopathy and hypertrophic cardiomyopathy. Although echocardiography can provide anatomical and contractile parameters, it cannot provide relevant clinical information about transmural extent and intramyocardial location of the scar.17
Delayed Contrast-Enhanced Cardiac Magnetic Resonance
Cardiac MR is extremely valuable for assessing viable and nonviable myocardium in infarcted and poorly contracting myocardial areas, and enables the depiction of transmural and nontransmural infarctions with high spatial resolution and better accuracy than scintigraphic techniques. Assessing the characteristics and distribution of myocardial scar by cardiac MR can potentially help identify patients at high risk of VT. In patients with ischemic CMP, the nontransmural hyperenhanced areas, but not the transmural hyperenhanced areas, were found to predict higher risk of sustained VT.18
Cardiac Contrast-Enhanced Computed Tomography
Cardiac contrast-enhanced CT scanning enables a detailed and comprehensive evaluation of LV myocardium using multimodality imaging based on anatomical, dynamic, and perfusion parameters to identify abnormal substrate (myocardial scar and border zone) with high spatial (≤1 mm) and temporal resolution, which can be derived from a single CT scan. Areas of CT hypoperfusion correlate best with areas of abnormal voltage (<1.5 mV) rather than scar alone (<0.5 mV). Perfusion imaging from CT can indicate scar transmurality and intramyocardial scar location.17
The ability of contrast-enhanced CT to characterize the transmural extent and intramyocardial location of scar tissue and to visualize surviving mid- and epicardial myocardium at sites of endocardial scar can potentially help identify areas involved in myocardial reentry representing appropriate ablation targets and help to overcome one of the significant limitations of endocardial voltage mapping. Additionally, the presence of an epicardial VT substrate can facilitate planning of VT ablations, such as for a combined endocardial and epicardial approach.17 When compared with contrast-enhanced MR, absolute sizes of early hypoperfused and late hyperenhanced regions were similar on contrast-enhanced CT and contrast-enhanced MR.17
The three-dimensional (3-D) CT-defined image of abnormal myocardium can be accurately extracted and embedded in clinical mapping systems displaying areas of abnormal anatomical, dynamic, and perfusion parameters for substrate-guided VT ablations.17
Role of Electrophysiological Testing
In patients with sustained monomorphic VT, EP testing is not recommended unless catheter ablation is planned. However, EP testing is useful in patients with coronary heart disease for the diagnostic evaluation of wide QRS complex tachycardias of unclear mechanism and in those with unexplained syncope. Additionally, EP testing can be used for risk stratification late after MI in patients with ischemic CMP and nonsustained VT (see below).19
Programmed stimulation induces VT in over 90% of patients with a history of VT. Although the rate and QRS morphology of induced VT may differ from that observed during spontaneous tachycardia, the induction of VT signifies the presence of a fixed anatomical substrate associated with an increased likelihood of future spontaneous events.2
Risk Stratification
There are more than 50 million North American adults with coronary artery disease and more than 7 million have had an MI. However, only a fraction of these patients will suffer a cardiac arrest. Therefore, noninvasive risk assessment after MI is required to identify patients at risk of SCD. Various tests assessing the extent of myocardial damage and scarring, myocardial conduction disorders, dispersion of repolarization, and autonomic imbalance have been proposed to identify patients at high risk of SCD who are likely to benefit from prophylactic ICD therapy. Some of these techniques potentially identify the underlying substrate (e.g., myocardial scar, intramyocardial conduction abnormalities) or triggers (e.g., autonomic imbalance, nonsustained VT) of malignant ventricular arrhythmias. However, most of these techniques have not been validated in independent populations and, although they can predict higher risk of total mortality, their ability to predict arrhythmic death is uncertain. Additionally, the majority of conventional risk stratifiers of SCD have a relatively low positive predictive value that would preclude their wide application as guidelines for ICD implantation in patients known to be at risk for SCD.14,20
To date, only two approaches have been proven useful in guiding prophylactic ICD therapy in post-MI patients: the presence of significant LV dysfunction alone or in combination with the inducibility of sustained VT/VF during programmed electrical stimulation beyond the early phase after MI. It should be recognized, however, that the development of SCD in post-MI patients is multifactorial, and multiple events need to coincide for a cardiac arrest to ensue; therefore, no one risk stratification test alone will be sufficient for all patients. Rather, combining multiple tests screening for the different potential mechanisms of SCD may be necessary. Furthermore, because progression of ischemic heart disease can result in the evolution of new mechanisms of SCD in individual patients, repetition of risk stratification tests at certain intervals may be required. It would seem reasonable (in the absence of data) to retest every 2 years in apparently stable patients to detect potential changes in substrate, regardless of which tests appear to have the highest yield.14,20
LEFT VENTRICULAR Ejection Fraction
Multiple studies evaluating survival of patients with prior MI established a clear relationship between reduced LVEF and increased mortality. LVEF behaves as a continuous variable, with gradually increasing mortality risk until the LVEF declines to 40% and then markedly increasing risk for values less than 40%. Nevertheless, the exact mechanisms involved in the strong correlation between decreased LV systolic function and increased incidence of SCD are not clearly defined.14
Although low LVEF identifies one patient population at relatively increased risk for SCD, there are clear limitations to LVEF as the ideal risk-stratification test for deciding whether to implant an ICD for primary prevention of SCD. LV systolic dysfunction lacks specificity. There is no evidence of any direct mechanistic link between low LVEF and mechanisms responsible for ventricular tachyarrhythmias and no study has demonstrated that reduced LVEF is specifically related to SCD. In fact, in studies that enrolled all patients after MI, patients with LVEF less than 30% to 35% account for no more than 50% of sudden cardiac arrest victims. Thus, although LVEF is a good marker of risk for total mortality, it does not provide insight into how patients are likely to die (sudden versus nonsudden).
Invasive Electrophysiological Testing
Inducibility of VT/VF during invasive EP testing can enhance the predictive accuracy of reduced LVEF for post-MI patients with high mortality risk. The first Multicenter Automatic Defibrillator Implantation Trial (MADIT I) study demonstrated that those patients with inducible VT/VF and LVEF values less than or equal to 35% late after MI are likely to benefit from prophylactic ICD therapy. Moreover, the absolute mortality reduction in MADIT I (26.2% over 27 months) was substantially greater than what was found in either the second MADIT (MADIT II) or SCD Heart Failure Trial (SCD-HeFT). Similar results were found in the Multicenter UnSustained Tachycardia Trial (MUSTT).19,21
However, secondary analysis from MUSTT revealed that despite the significant difference in outcome between inducible patients enrolled in the trial and noninducible patients enrolled in a registry, EP inducibility was of limited value because the 5-year mortality rate in inducible patients was 48% compared with 44% in noninducible patients. Later, data from MADIT II showed that there is no need for additional risk stratifiers (including EP testing) when LVEF is so low. In more than 80% of patients randomized to the ICD arm of MADIT II, invasive EP testing with an attempt to induce tachyarrhythmias was performed at the time of ICD placement. VT inducibility, observed in 40% of studied patients, was not effective in identifying patients with cardiac events defined as VT, VF, or death. These observations from both MUSTT and MADIT II subanalyses suggest that in patients with substantially depressed LV function, EP inducibility should not be considered a useful predictor of outcome. It is possible, however, that inducibility might have much better predictive value in post-MI patients with LVEF greater than 30% or greater than 35%.19,21
Furthermore, using inducible VT/VF to guide prophylactic ICD therapy is limited by low sensitivity. Patients with LVEF values not exceeding 35% after MI and no inducible VT/VF still appear to have a substantial (>25%) risk of serious events over the near term.21
There are also no data to support the use of invasive EP testing in post-MI patients with LVEF values more than 40% or in the early post-MI period. In fact, the Beta-blocker Strategy plus Implantable Cardioverter-Defibrillator (BEST-ICD) trial found that inducible VT/VF early after MI does not predict benefit from ICD therapy. In contrast, the Cardiac Arrhythmias and Risk Stratification after Acute Myocardial Infarction (CARISMA) study found that inducible VT identified 6 weeks following an acute MI was a strong predictor of future life-threatening arrhythmias.19,21
Additionally, EP testing is invasive and not practical for broad application as a screening tool. Nonetheless, it can be valuable when used in patients in whom the risk of sustained arrhythmias and SCD is intermediate, and the potential benefit of ICD therapy uncertain. Current guidelines recommend prophylactic ICD therapy in post-MI patients with nonsustained VT and LVEF less than 40% if sustained VT/VF is inducible at EP study.14
Measures of Autonomic Imbalance
Methods to assess the autonomic nervous system, which has been thought to be a modulator between triggers of ventricular tachyarrhythmias and the underlying substrate, including heart rate variability, baroreflex sensitivity, heart rate turbulence, and deceleration capacity, have been evaluated for risk stratification of SCD. Multiple studies have correlated relative excess of sympathetic tone (or deficient parasympathetic tone) with increased mortality in post-MI patients as well as increased propensity for VF during acute ischemia. However, the majority of studies showed no significant difference in relative risk for SCD versus total mortality. Thus, these measures do not appear to provide a reliable measure of SCD risk and there is no evidence to support their use in guiding prophylactic ICD therapy.22
Measures of Myocardial Conduction Disorders
Increased QRS duration on a surface ECG has been associated with a higher risk of death after MI and appears to reflect greater LV dysfunction, but association with SCD has not been proven. Similarly, the presence of late potentials on signal-averaged ECG failed to identify patients likely to benefit from ICD therapy.22 Recently, fragmentation of the QRS complex on the 12-lead surface ECG (filter range, 0.15 to 100 Hz; AC filter, 60 Hz, 25 mm/sec, 10 mm/mV), which likely signifies inhomogeneous ventricular activation due to myocardial scar, ischemia, or both in patients with coronary artery disease, has been found to potentially predict increased risk of appropriate ICD therapies in patients who received an ICD for primary and secondary prevention. The usefulness of this parameter needs further evaluation.23,24
Genetic Testing
There is compelling evidence that a genetic mechanism may increase patient susceptibility to SCD following MI, and genetic assessment may play a role in the future. However, there is presently no evidence for using genetic testing to identify post-MI patients at risk.14,20
Cardiac Magnetic Resonance Imaging
Characteristics of myocardial scar architecture and tissue heterogeneity in the periinfarct zone, as defined by contrast-enhanced cardiac MR, can potentially identify a proarrhythmic substrate and appears to be a strong predictor of ventricular arrhythmias and appropriate ICD therapies. In patients with ischemic CMP, the nontransmural, but not the transmural, hyperenhanced areas were found to predict higher risk of sustained VT.18 However, large prospective trials are still required to evaluate the reliability of these techniques for risk stratification.25
Risk Stratification Early Post-Infarction
The risk of SCD is greatest in the first month after MI and appears to decline in the first year after MI. Nevertheless, both prospective and retrospective studies of prophylactic ICD therapy have failed to show a reduction in all-cause mortality in early post-MI patients. The reduction in the rate of death due to arrhythmia associated with ICD therapy was offset by an increase in the rate of death from nonarrhythmic cardiac causes in the ICD groups. This discrepancy not only highlights the limitations of current risk stratification techniques, but also reflects relative differences in the risk factors for SCD at different time points after MI and the fact that nonarrhythmic death accounts for an appreciable percentage of deaths during that time. Heart rate and creatinine clearance measured at baseline are strongly associated with SCD during the in-hospital period, whereas recurrent cardiovascular events (including heart failure, MI, and rehospitalization) and a baseline LVEF of 40% or less are more strongly associated with the occurrence of SCD after discharge.21,26
Whereas the cumulative incidence of SCD is greatest in post-MI patients with an LVEF of 30% or less, the incidence of SCD is greater in patients with an LVEF greater than 40% in the first 30 days after MI when compared with patients with an LVEF of 30% or less after 90 days. The strength of the association between LVEF and survival free from SCD appears to be greatest in long-term follow-up (>6 months). Currently, there is no strategy (invasive or noninvasive) that can reliably predict the risk for SCD or guide empiric ICD implantation soon after an MI. Data suggest it is best to wait 2 to 3 months after acute MI before performing risk stratification.14,21,26
Recent data suggest a potential benefit of EP testing in risk stratification in patients with ST elevation MI and LVEF less than 40% treated with primary percutaneous coronary intervention. Inducible SMVT by programmed electrical stimulation performed 6 to 10 days post-MI was associated with an increased risk of spontaneous VT/VF and SCD (after a mean follow-up of 28 ± 13 months). However, further evaluation in randomized clinical trials is required before adoption of this approach.11
Principles of Management
Pharmacological Therapy
Acute Therapy
The degree of hemodynamic tolerance should dictate the initial therapeutic strategy. VTs causing severe symptoms of angina or hemodynamic collapse almost always respond to synchronized electrical cardioversion. Treatment of pulseless VT is the same as that for VF and should follow the ACLS protocol. In patients with difficult-to-control or recurrent VT, intravenous amiodarone is the drug of choice. Intravenous procainamide and sotalol are alternatives. Lidocaine is less effective in the absence of acute ischemia; however, it can be considered in combination with either procainamide or amiodarone if the latter drugs are ineffective alone. Beta blockers offer additional benefit in patients with ischemic heart disease. Treatment of underlying conditions (e.g., acute ischemia, decompensated heart failure, electrolyte abnormalities) is also necessary.19 For refractory VT storm, general anesthesia, sympathetic neural blockade, catheter ablation, and intraaortic balloon counterpulsation have been used.
Chronic Therapy
Antiarrhythmic drugs can be considered in two main settings: as adjunctive therapy in patients with an ICD and as preventive therapy in patients who do not want or are not candidates for an ICD (e.g., because of marked comorbidities). Because an ICD does not prevent arrhythmias, patients who have frequent symptoms or device discharges triggered by VT/VF may benefit from adjunctive drug therapy. There are three main indications for antiarrhythmic drug therapy along with an ICD: to reduce the frequency of ventricular arrhythmias in patients with unacceptably frequent ICD therapies, to reduce the rate of VT so that it is better tolerated hemodynamically and more amenable to pace termination or low-energy cardioversion, and to suppress other arrhythmias (e.g., sinus tachycardia, AF, nonsustained VT) that cause symptoms or interfere with ICD function or cause inappropriate discharges.19,27
When ICD patients need drugs because of frequent shocks, the weight of evidence supports optimizing beta blocker therapy. When long-term antiarrhythmic therapy is required, amiodarone is the drug of choice. Sotalol is less effective than amiodarone and can cause torsades de pointes. Azimilide may be effective with fewer side effects (except torsades de pointes), but is not approved by the U.S. Food and Drug Administration or European authorities, and experience is limited. No comparative data for amiodarone and azimilide are available. For patients who cannot tolerate amiodarone or sotalol, dofetilide has been suggested as an alternative.27
Although some reports suggested the early use of antiarrhythmic drugs (prophylactically or after a single ICD shock), early prophylactic use may overtreat a large group of patients who will never have an ICD intervention but are exposed to drug side effects; or the drug may elicit an ICD intervention due to proarrhythmia. At this point, the decision as to when to start adjuvant antiarrhythmic drug therapy in patients who receive an ICD for secondary prevention should be individualized, with the expectation that well-designed therapy can reduce ICD shocks and improve quality of life. Until more data are available, routine use of prophylactic antiarrhythmic drugs in device patients does not appear to be warranted.27
Implantable Cardioverter-Defibrillator
Secondary Prevention
ICD therapy has a proven mortality benefit among patients with structural heart disease and a history of VT or VF, with an absolute reduction in all-cause mortality of 7% and a significant 25% relative reduction in mortality compared with amiodarone therapy, due entirely to a 50% reduction in SCD. Implantation of an ICD is recommended for secondary prevention in patients with prior cardiac arrest or sustained VT, even in patients undergoing successful catheter ablation of the VT or responding to antiarrhythmic therapy, because the latter two approaches do not sufficiently reduce residual risk of SCD.28
Although one report has questioned the benefit from an ICD compared with pharmacological therapy in patients with VT and LVEF exceeding 40%, the guidelines did not stratify recommendations based on the LVEF.29 This seems appropriate for two reasons: the prognostic importance of the LVEF was based on subset analysis and, given the current ease of ICD implantation, the potential adverse consequences of choosing a possibly less effective therapy are too great.19
Primary Prevention
Current guidelines recommend prophylactic ICD implantation in patients with prior MI and reduced LVEF (<35%) who are on optimal medical management. These recommendations are based on the fundamental relationship that exists between reduced LVEF and cardiovascular mortality and the findings of MADIT II and SCD-HeFT. Both MADIT II and SCD-HeFT clearly demonstrated a mortality benefit from prophylactic ICD therapy in patients with a history of MI and severely reduced LVEF (≤ 30% and ≤ 35%, respectively). However, the absolute mortality reduction in these trials was modest: 5.6% over 27 months in MADIT II and 7.3% over 60 months in SCD-HeFT. Fewer than one in five ICD recipients in MADIT II and SCD-HeFT received appropriate ICD therapies over average follow-up periods of 20 and 60 months, respectively. Therefore, because appropriate ICD therapies overestimate the mortality benefit of ICD therapy by at least twofold, fewer than 1 in 10 patients who receive a prophylactic ICD for an LVEF of 35% or less post-MI are likely to receive a survival benefit in the near term.19
EP testing appears most useful as an adjunct test in patients having equivocal results after noninvasive testing and in whom the potential benefit of ICD therapy is uncertain. Examples include patients with remote MI, nonsustained VT, and an LVEF between 30% and 40%, as suggested by the recent American College of Cardiology/American Heart Association/European Society of Cardiology (ACC/AHA/ESC) guidelines, or in combination with other clinical risk factors or symptoms suggestive of ventricular tachyarrhythmias including palpitations, presyncope, and syncope. Patients with coronary artery disease who are found to have inducible monomorphic VT during programmed stimulation should be treated for the prevention of SCD. The mode of stimulation (burst pacing, single, or double VESs versus triple VESs) of sustained VT does not influence prognosis and should not influence treatment decisions.19,21
Although the risk of SCD is highest in the first month after MI, there is currently no reliable risk stratification strategy that can guide prophylactic ICD implantation, and primary prevention trials with ICD have failed to show a reduction in all-cause mortality in early post-MI patients identified on the basis of the current risk stratifiers. Therefore, in the early post-MI period, medical therapy and coronary revascularization, when feasible, should be optimized. The LVEF should then be measured at least 40 days post-MI and, if the LVEF is not more than 35%, the patient should be considered for ICD implantation.21,26
Catheter Ablation
Catheter ablation of post-MI VT is generally indicated as a palliative and adjunctive therapy in post-MI patients with ICD who experience frequent recurrences of VT or ICD therapies. Recurrences of VT/VF causing frequent ICD therapies (including ICD shocks) are relatively common. Approximately 20% to 35% of ICD recipients for primary SCD prevention and up to 45% of those who receive an ICD for secondary SCD prevention will receive an appropriate shock within 3 years of implantation. ICD therapy acting via such appropriate ICD shocks reduces the risk of SCD by approximately 60%, but the occurrence of shocks is associated with progressive heart failure symptoms, a significant decline in psychosocial quality of life, and a two- to fivefold increase in mortality. The incidence of appropriate shocks can be reduced by using antitachycardia pacing in the VT or VF detection zones, or with up-titration of medical therapies. If optimization of pharmacological therapies and device programming fails to suppress appropriate ICD shocks for VT, patients are eligible for catheter ablation. Catheter ablation reduces VT/VF recurrences and thereby ICD interventions by more than 75% in patients after multiple ICD shocks. In this patient population, the incidence of procedure-related death ranges from 0% to 3%, and the incidence of major complications from 3.6% to 10%.19,30,31 Nonetheless, most patients with post-MI VT have multiple types of monomorphic VTs, and elimination of all VTs is often not feasible, and because the recurrence of an ablated VT or the onset of a new VT can be fatal, RF ablation is rarely used as the sole therapy for VT. Instead, it is typically used for patients with coronary artery disease as an adjunct to an implantable ICD or, less commonly, to antiarrhythmic drug therapy.2
Catheter ablation also should be considered for patients with frequent premature ventricular complexes (PVCs), nonsustained VTs, or VT that is presumed to cause ventricular dysfunction.2
The optimal time of catheter ablation in ICD patients (after multiple ICD interventions or before any ICD intervention) remains unclear. In clinical practice, VT ablation is often not considered until pharmacological options have been exhausted, often after the patient has suffered substantial morbidity from recurrent episodes of VT and ICD shocks. However, recent studies suggest that catheter ablation for VT should generally be considered early in the treatment of patients with recurrent VT, even before initiating antiarrhythmic drug therapy. In fact, catheter ablation was found to reduce VT/VF recurrences and thereby ICD shocks by 43% to 73% when applied prophylactically, that is, before any ICD shock has been delivered. Interestingly, in this patient population the ablation-related mortality rate was 0%, and major complications occurred in 3.8% to 4.7%. Catheter ablation also significantly reduced the rate of hospitalizations for cardiac reasons, and was associated with a trend to fewer deaths in the ablation group during follow-up. The benefit was more pronounced in patients with LVEF of 30% or less.2,19,30,31
Table 22-1 lists the indications of ablation for ischemic VT, in accordance with the ACC/AHA/ESC 2006 guidelines for management of patients with ventricular arrhythmias and the prevention of sudden death.19
TABLE 22-1 Indications for Ablation of Ischemic Ventricular Tachycardia*
| Class I | Patients after MI with an ICD who present with repetitive monomorphic VT that leads to multiple shocks or who present with drug-refractory incessant VT or “electrical storms” that cannot be prevented despite adequate reprogramming of the antitachycardia pacing mode, beta blocker and/or antiarrhythmic drug therapy, or when patients are intolerant of these drugs or do not wish to take them (level C) |
| Patients after MI with an ICD who present with repetitive sustained VT, which made mandatory therapy with antiarrhythmic drugs that decreased the rate of VT below an acceptable intervention rate into the range of exercise-induced sinus rhythm despite concomitant beta blocker therapy (level C) | |
| Patients with bundle branch reentry after MI (level C) | |
| Class IIa | Patients after MI with an ICD who present with infrequent monomorphic VT that has been terminated successfully by more than one electrical shock and that most probably cannot be avoided in the future despite adequate reprogramming of the antitachycardia pacing mode, and where it is difficult to predict whether future events can be avoided by beta blocker and/or antiarrhythmic drug therapy or when patients are not willing to take long-term drugs (level C) |
| Class IIb | As the sole procedure, that is, without an ICD, in patients after MI who have relatively well-preserved LV function (above 35% to 40%) and in whom VT is monomorphic, relatively slow, and well tolerated; who are considered to have a good long-term prognosis; and who are drug resistant, do not tolerate an antiarrhythmic drug, or do not accept long-term therapy (level C) |
| Patients after MI who present with frequent self-terminating monomorphic VT that may cause ICD shock intervention that potentially cannot be avoided by changing the intervention rate of the ICD (level C) | |
| Patients with markedly reduced longevity and comorbidities (e.g., heart failure, reduced renal function) where VT can either not be prevented by antiarrhythmic drug therapy or drugs have not been tolerated and for whom an ICD would not be indicated because of the overall condition of the patient | |
| Patients with more than one ICD shock that is causing severe anxiety and psychological distress |
ICD = implantable cardioverter-defibrillator; LV = left ventricular; MI = myocardial infarction; VT = ventricular tachycardia.
* In accordance with the ACC/AHA/ESC 2006 guidelines for management of patients with ventricular arrhythmias and the prevention of sudden death.
From Zipes DP, Camm AJ, Borggrefe M, et al: ACC/AHA/ESC 2006 guidelines for management of patients with ventricular arrhythmias and the prevention of sudden cardiac death: a report of the American College of Cardiology/American Heart Association Task Force and the European Society of Cardiology Committee for Practice Guidelines (Writing Committee to Develop Guidelines for Management of Patients with Ventricular Arrhythmias and the Prevention of Sudden Cardiac Death), J Am Coll Cardiol 48:e247-e346, 2006.
Electrocardiographic Features
In general, QRS patterns are less accurate in localizing the site of origin of reentrant VTs in patients with prior MI and wall motion abnormalities than they are for focal VTs in patients with normal hearts.3,32 Nonetheless, the ECG is capable of regionalizing the VT to areas smaller than 15 to 20 cm2, even in the most abnormal hearts.
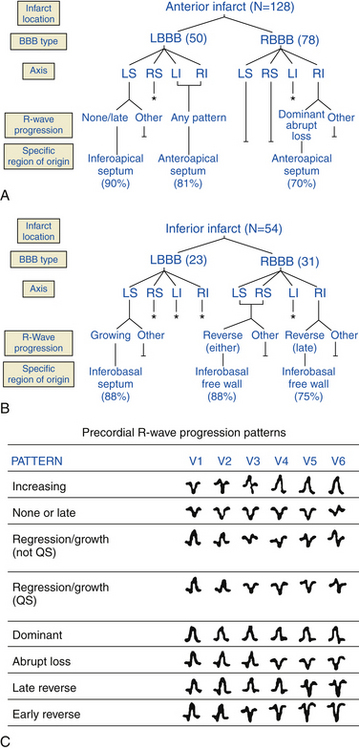
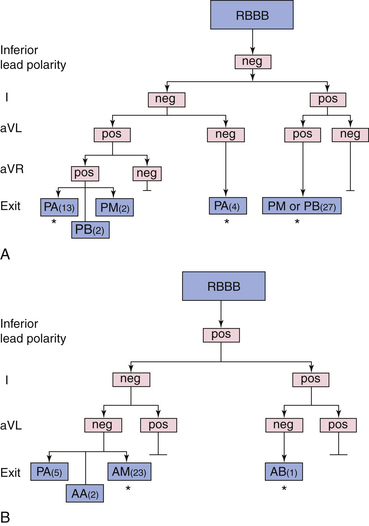
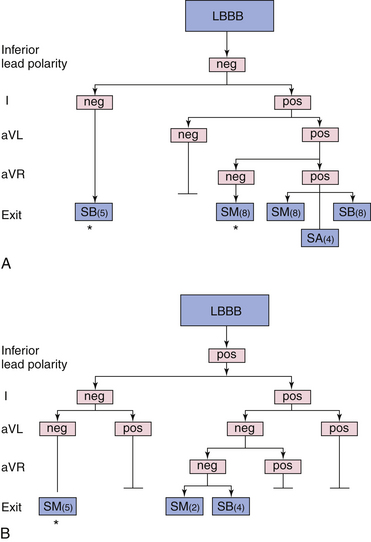
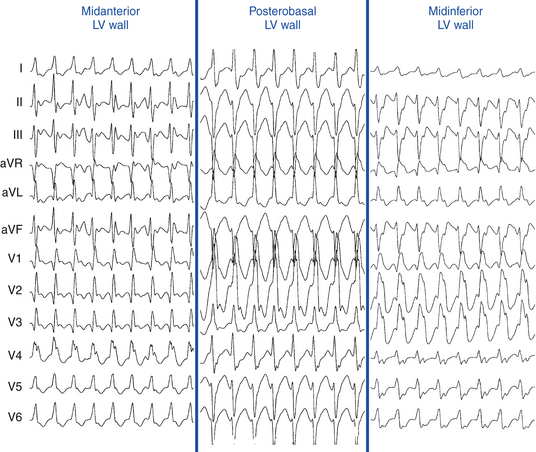
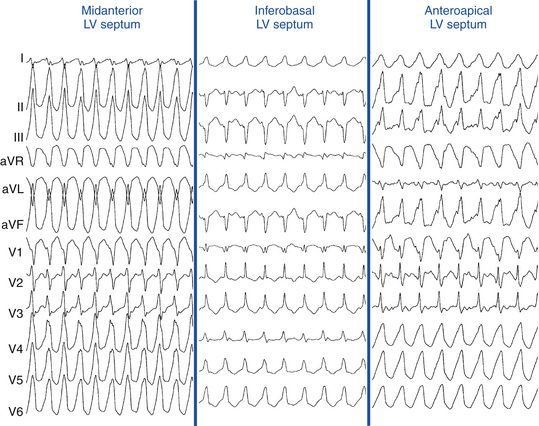
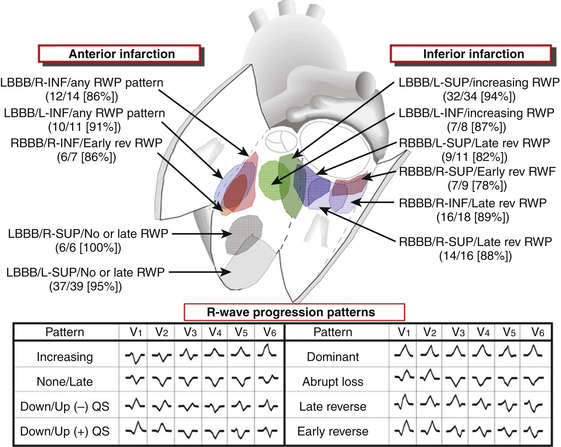
A sophisticated algorithm has been developed using eight different patterns of R wave progression in the precordium in addition to the relationship with prior anterior or inferior MI, axis deviation, and BBB morphology. This algorithm has a predictive accuracy of more than 70% for a specific QRS morphology to identify for a particular endocardial region of 10 cm2 or less (Fig. 22-2). A recent report indicated that the 12-lead surface ECG characteristics could reliably predict the LV VT exit site region in 71% of clinical VTs without prior knowledge of infarct location. That report described a new algorithm that was used independently of the sustainability of VT and could be applied over a wide range of tachycardia CLs and to patients with posterior or multiple sites of infarction (Figs. 22-3 and 22-4).33
ECG Clues to the Underlying Substrate
VTs arising from normal myocardium typically have rapid initial forces, whereas slurring of the initial forces is frequently seen when the VT arises from an area of scar or from the epicardium. Additionally, VTs originating from very diseased hearts usually have lower amplitude complexes than those arising in normal hearts, and the presence of notching of the QRS can be a sign of scar tissue.3,32
General Principles in Localizing the Origin of Post-Infarction Ventricular Tachycardias
QRS Duration
QRS duration is affected by the proximity of the VT origin to the septum. Post-MI VTs almost always arise in the LV or interventricular septum.1,3,12 Septal VTs generally have QRS durations that are narrower than free wall VTs. Additionally, QRS width during VT is affected by the amount of myocardial disease, being wider with poor overall ventricular conduction.1
QRS Axis
A right superior QRS axis suggests apical septal or apical lateral sites of origin, often demonstrating QS in leads I, II, and III and QS or rS in leads V5 and V6. A right inferior axis suggests a high basal origin (high LV septum, or high lateral LV). A left inferior axis is occasionally associated with VTs arising from the top of the LV septum. Sometimes, the QRS axis is inappropriate for the exit site. This almost always occurs with large apical infarcts. Typically, discrepancies occur in VTs with LBBB or RBBB with a right or left superior axis. Such discrepancies can be related to abnormalities of conduction out of the area of the reentrant circuit toward the rest of the myocardium.32
Bundle Branch Block Pattern
VTs with RBBB patterns always arise in the LV, and VTs with LBBB patterns almost always arise in or adjacent to the LV septum. Therefore, LBBB patterns, which all cluster on or adjacent to the septum, have a higher predictive accuracy (regardless of the presence of anterior versus inferior MI) than RBBB patterns, which could be septal or located on the free wall. Most VTs with RBBB patterns associated with inferior MI are clustered in a small region, but are more widely disparate with anterior MI (Figs. 22-5 and 22-6).3,32
Concordance
VTs with positive concordance in all precordial leads arise only at the base of the heart (LV outflow region [LVOT], along the mitral or aortic valves, or in the basal septum), whereas negative concordance is seen only in VTs originating near the apical septum, most commonly seen with anteroseptal MI.3
Presence of Qs Complexes
The presence of a QS complex in any lead suggests that the wavefront is propagating away from that site. Therefore, QS complexes in the inferior leads suggest that the activation is originating in the inferior wall, whereas QS complexes in the precordial leads suggest activation moving away from the anterior wall. QS complexes in leads V2 to V4 suggest anterior wall origin, QS complexes in leads V3 to V5 suggest apical location, and QS complexes in leads V5 and V6 suggest lateral wall. The presence of Q waves in leads I, V1, V2, and V6 is seen in VTs with an RBBB pattern originating near the apex, but not those originating in the inferobasal parts of the LV. R waves in leads I, V1, V2, and V6 are specific for VTs with an RBBB or LBBB pattern of posterior origin. Additionally, the presence of Q waves in leads I and V6 in VTs with an LBBB pattern is seen with apical septal locations, whereas the presence of R waves in leads I and V6 is associated with inferobasal septal locations.3,32
Inferior Myocardial Infarction Ventricular Tachycardias
With inferior MI, most VTs have basal exit sites and thus have relatively preserved precordial R waves (that usually are present in leads V2 to V4 with the persistence of an r or R wave through lead V6), although apical exit sites also occur (Fig. 22-7).16 In VTs with RBBB, the R waves can persist across the precordium (positive concordance). When the VT originates near the posterior basal septum and when it arises more laterally (or posteriorly), there can be a decrease in the R wave amplitude across the precordium because the infarct can extend to the posterolateral areas (see Fig. 22-5).34
Left axis deviation is seen in inferior MI VTs when the exit site is near the septum. The more the VT moves from the midline toward the lateral (i.e., posterior) wall, the more right or superior the axis will become. VTs with LBBB (especially when left axis deviation is present) have a characteristic location at the inferobasal septum (see Fig. 22-6). As the VT axis shifts to a more normal axis, the exit site moves higher up along the septum. Rarely, inferior MI VTs can have exit sites as high as the aortic valve along the septum. Very rarely, the VT can only be ablated from the RV.
The mitral isthmus (between the mitral annulus and inferior infarct scar) contains a critical region of slow conduction in some patients with VT following inferior MI, providing a vulnerable and anatomically localized target for catheter ablation. This critical zone of slow conduction is activated parallel to the mitral annulus in either direction, resulting in two distinct QRS configurations not seen in VTs arising from other sites: LBBB pattern (rS in lead V1, R in lead V6) with left superior axis, and RBBB pattern (R in lead V1, QS in lead V6) and right superior axis.3,32
Anterior Myocardial Infarction Ventricular Tachycardias
Anterior MIs are usually associated with more extensive myocardial damage. Therefore, the accuracy of the ECG in localizing the origin of VTs associated with anterior MI is less than in those with inferior MI.34
VTs with LBBB and left axis deviation usually originate from the inferoapical septum, but occasionally there is a discrepancy, with the exit site being more superior than expected for the QRS axis. LBBB VTs associated with anteroseptal MI can present with QS complexes across the precordium (i.e., negative concordance), and they are always associated with a Q wave in leads I and aVL. If an R wave is seen in lead V1 along with the Q wave in lead aVL, the location of the exit site is more posterior on the septum, closer to the middle third (see Fig. 22-6). VTs with LBBB and right inferior axis arise on the upper half of the mid- or apical septum but occasionally can be off the septum (see Fig. 22-7).16,32
RBBB VTs originating from the apex usually have a right and superior axis. Lead V1 usually has a qR or, occasionally, a monophasic R wave, but there is almost always a QS or QR complex in leads V2, V3, and/or V4. More commonly, when there are QS complexes in leads I, II, and III, there are also QS complexes across the precordium from lead V2 through V6. VTs with RBBB and right inferior axis arise on the septum but also can be seen across the apex superiorly on the free wall. In both cases, there is a negative deflection in leads aVR and aVL. VTs with LBBB or RBBB patterns and a marked inferior right axis arise superiorly on what usually is the edge of an anterior aneurysm.32
The most difficult VTs to localize are VTs with RBBB and right superior axis associated with anterior MI. QS complexes in the lateral leads (V4 to V6) reflect an origin near the apex, regardless of whether it is septal or lateral. It is almost impossible to distinguish VTs arising from the apical septum and the apical free wall based on the ECG alone. It is only when the VT location moves more posterolaterally that a difference can be appreciated as the R wave in lead aVR becomes dominant over the R wave in lead aVF. This is usually associated with a large apical aneurysm, but occasionally can also be seen with a posterolateral MI.32
Epicardial Ventricular Tachycardias
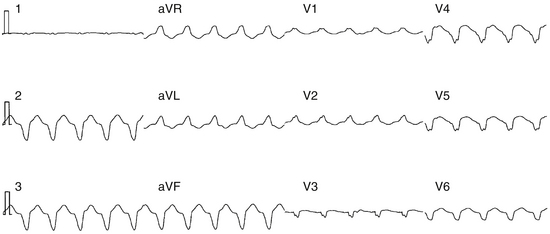
Several ECG findings suggest an epicardial origin of the LV VT with an RBBB pattern, and all generally rely on the late engagement of rapidly conducting His-Purkinje fibers by exits on the epicardium: (1) a pseudo-delta wave (measured from the earliest ventricular activation to the earliest fast deflection in any precordial lead) of 34 milliseconds or more has a sensitivity of 83% and a specificity of 95%; (2) a long R-wave peak time in lead V2 (i.e., an interval from the beginning of the QRS complex to the time of initial downstroke of the R wave after it has peaked [previously known as the intrinsicoid deflection]) of at least 85 milliseconds has a sensitivity of 87% and a specificity of 90%; (3) a shortest RS complex duration (measured from the earliest ventricular activation to the nadir of the first S wave in any precordial lead) of 121 milliseconds or more has a sensitivity of 76% and a specificity of 85%; and (4) a QRS duration of more than 200 milliseconds (Fig. 22-8). These parameters were assessed in patients without MI, however.34
Electrophysiological Testing
Induction of Tachycardia
Recommended Stimulation Protocols
For evaluation of ventricular arrhythmias, multipolar catheters are typically positioned in the high RA, the HB position, and the RV apex. Recording the His potential during VT is important to differential BBR VT from myocardial VT. The most commonly used stimulation protocol applies pacing output at twice the diastolic threshold current and a pulse width of 1 to 2 milliseconds. Single VESs during NSR and at pacing drive CLs of 600 and 400 milliseconds are delivered, first from the RV apex and then from the RV outflow tract (RVOT). The prematurity of extrastimuli is increased until refractoriness or induction of sustained VT is achieved. Long-short cycle sequences may be tested. If these measures fail to induce VT, double and then triple VESs are used in the same manner. Because a VES with a very short coupling interval is more likely to induce VF as opposed to monomorphic VT, it may be reasonable to limit the prematurity of the VESs to a minimum of 180 milliseconds when studying patients for whom only inducible SMVT would be considered a positive endpoint. If VT still cannot be induced, rapid ventricular pacing is started at a CL of 400 milliseconds, gradually decreasing the pacing CL until 1:1 ventricular capture is lost or a pacing CL of 220 milliseconds is reached. Repeating the protocol at other pacing drive CLs, at other RV or LV stimulation sites, and/or after administration of isoproterenol or procainamide is then attempted.3,19
Number of Ventricular Extrastimuli
In the majority of patients with coronary artery disease undergoing EP testing for risk stratification for SCD, triple VESs are typically required for VT induction. Sustained VT induced with triple VESs is usually faster and more likely to result in hemodynamic compromise. Despite these differences, long-term prognosis does not appear to be affected by the mode of induction. In a recent report, there was no difference in the incidence of arrhythmic death or all-cause mortality at 2 years between patients induced with burst pacing, one or two VESs, and those induced with three VESs.21
When SMVT is studied, the use of four VESs may be considered. However, when a patient resuscitated from cardiac arrest is studied, four VESs should not be used because the likelihood of inducing a nonspecific response (polymorphic VT/VF) is far higher than that of inducing SMVT (10:1). Triple VESs are required to induce SMVT in 20% to 40% of patients presenting with SMVT and in 40% to 60% of patients presenting with cardiac arrest.3
Pacing Drive Cycle Length
The use of at least two pacing drive CLs (typically 600 and 400 milliseconds) is required to enhance the sensitivity of induction of SMVT in patients presenting with sustained VT of any morphology or those with cardiac arrest. VES at shorter or longer CLs or even in NSR may be necessary to initiate VT in some patients. Abrupt changes in CL can also facilitate VT induction. The CL used can also influence the number and prematurity of VESs required to initiate VT. Rapid ventricular pacing has a low yield in VT initiation.3
Site of Ventricular Stimulation
In contrast to automatic or triggered activity VT, in which the stimulation site has no effect on VT inducibility, reentrant VT can demonstrate absolute or relative site specificity for initiation. In the majority of cases, development of functional unidirectional block is a prerequisite for initiation of macroreentrant VT; however, during VES, functional block may not always develop despite short coupling intervals, suggesting that formation of functional block is dependent on direction of activation following stimulation.6 Therefore, the use of at least two sites of stimulation enhances the ability to induce VT.
If triple VESs are delivered only from the RV apex, 10% to 20% of patients will require the use of a second RV or LV pacing site for initiation of SMVT (less than 5% require an LV site). If double VESs are used, 20% to 30% will require a second pacing site (10% require an LV site). Because the number of VESs required for initiation can differ depending on the site of stimulation, which occurs in approximately 20% of patients with SMVT, the site that allows the use of the fewest number of VESs is preferred to avoid nonspecific responses. Thus, it is preferable to stimulate from both the RV apex and the RVOT at each drive CL and with the number of VESs before proceeding to more aggressive stimulation.3
Pacing Current Output
Increasing the current (more than twice the diastolic threshold current or pulse width more than 2 milliseconds) produces only a small increase in sensitivity of initiating SMVT (more than 5%), but this is outweighed by a significant decrease in specificity and increase in the incidence of VF. The use of currents more than 5 mA is not recommended.3
Reproducibility of Ventricular Tachycardia Initiation
SMVT can be reproducibly initiated from day to day and year to year, especially in patients with coronary artery disease. However, the exact mode of initiation is not necessarily reproducible. Once SMVT is initiated, it is easier to reinitiate by repeating the same stimulation protocol that was initially successful, either longitudinally (by repeating the entire protocol) or horizontally (by repeating each coupling interval).3
While reproducibility of sustained VT can be variable when comparing induction during the initial month post-MI with subsequent months, induction of any sustained VT in the more chronic phase of MI is highly reproducible over both short-term and extended time intervals. However, a change in the number of extrastimuli required for VT reinduction is reported in 30% to 70% of patients, and is more common as the time interval between studies increases. Similar inconsistencies are reported in the exact QRS morphology and CL of induced VTs during repeated testing. These data confirm that the substrate for chronic post-MI inducible VT per se can be highly stable for up to several years in the absence of major changes in clinical status. However, the mode of induction and VT characteristics demonstrate substantial variability; therefore, it is improbable that such features would predict long-term outcome.35
Relationship of Ventricular Extrastimulus Coupling Interval and Pacing Cycle Length to the Onset of Ventricular Tachycardia
Conduction delay is required for the initiation of reentrant rhythms; thus, an inverse relationship between the coupling interval of the VES initiating the VT or the pacing train CL and the interval from the VES to the first VT complex favors reentry. In contrast, a linear relationship of the pacing CL or VES coupling interval to the interval to the first VT complex and initial CL of the VT favors triggered activity. In reentrant VT, the initial CL reflects conduction through the VT circuit, which in the absence of exit block should demonstrate the same or longer CL as the remaining VT cycles, depending on whether any conduction delay is produced in the circuit on initiation.3
Endpoints of Programmed Electrical Stimulation
Induction of Clinical Sustained Monomorphic Ventricular Tachycardia
Induction of SMVT is very specific, especially with a VES coupling interval of more than 240 milliseconds, and only occurs in patients with spontaneous VT, cardiac arrest, or an arrhythmogenic substrate. In patients who had spontaneous VT prior to the EP study, the endpoint of programmed electrical stimulation should be induction of the clinical arrhythmia or the assumed arrhythmia. Clinical VT is defined as an inducible SMVT that matches the 12-lead ECG QRS morphology and approximate CL of the patient’s documented, spontaneously occurring SMVT. Nonclinical VTs are defined as inducible SMVTs that were not previously known to have occurred spontaneously.2
Induction of Multiple Sustained Monomorphic Ventricular Tachycardias
The majority (85%) of patients with post-MI VT have more than one VT morphology. Even in patients presenting with a single SMVT, multiple distinct uniform VTs may be induced in the EP laboratory, especially during antiarrhythmic therapy. Multiple VT morphologies are defined as two or more inducible VTs having at least one of the following: (1) contralateral BBB patterns; (2) a frontal plane axis of 30 degrees or more divergent; (3) marked differences in individual ECG leads recorded from the same electrode locations; (4) a precordial transition zone in one or more leads or a different dominant deflection in more than one precordial lead; and/or (5) a different tachycardia CL (more than 100 milliseconds for VTs with a similar morphology). A change in VT morphology need not reflect a change in a reentrant circuit or site of impulse formation but may merely reflect a change in the overall pattern of ventricular activation. In some cases, pacing can reverse the direction of wavefront propagation within the same reentrant loop. Approximately 85% of multiple morphologically distinct SMVTs arise from the same region of the heart (i.e., have closely located exit sites or shared components of an isthmus or diastolic pathway).3
Therefore, the term clinical VT should be reserved for induced VTs that are known to have the same 12-lead ECG QRS morphology and approximate CL as a spontaneous VT. Other VTs should be designated as presumptive clinical or previously undocumented VT morphology.2
Induction of Polymorphic Ventricular Tachycardia or Ventricular Fibrillation
When EP testing is performed in patients presenting with SMVT, polymorphic VT and VF must be considered as nonspecific responses. Both sustained and nonsustained polymorphic VT and VF can be induced, even in normal subjects. In general, induction of VF requires multiple VESs delivered at shorter coupling intervals (usually less than 180 milliseconds) than induction of SMVT. On the other hand, induction of polymorphic VT or VF in a patient who presents with cardiac arrest can have a different implication. Because cardiac arrest can be initiated by a polymorphic VT, the induction of polymorphic VT in this patient population can be significant. Therefore, although doubt will always exist, reproducible polymorphic VT induction is treated as a possible indicator of the clinical arrhythmia. Features that suggest that a polymorphic VT can be mechanistically meaningful are reproducible initiation of the same polymorphic VT template, especially from different stimulation sites; inducibility with relatively mild stimulation (single or double VESs); and transformation of the polymorphic VT to SMVT by procainamide. The induction of any arrhythmia (SMVT, polymorphic VT, or VF) in the setting of a recent MI (less than 1 month) may not have clinical significance.3
Induction of Very Fast Ventricular Tachycardia
The induction of VT with a CL longer than 230 milliseconds is predictive of recurrent ventricular arrhythmia in high-risk patients, such as those with prior MI and reduced LVEF (≤40%), ischemic cardiomyopathy presenting with syncope, resuscitated cardiac arrest, or asymptomatic nonsustained VT. In up to 20% of patients undergoing EP testing, VT with a CL ranging from 200 to 250 milliseconds may be inducible. Although a limited number of studies have closely and specifically examined long-term outcomes of this group of patients, and although previous large ICD trials, such as MADIT and MUSTT, excluded such patients if this arrhythmia was induced by more than two VESs, there is a growing body of evidence that this induced arrhythmia is of sufficient clinical importance that it should no longer be considered a nonspecific finding of EP testing, as it poses a significant risk of spontaneous ventricular arrhythmia or SCD over long-term follow-up. This risk appears equivalent to that of patients with inducible VT with a CL of 251 to 320 milliseconds, and markedly worse than that of patients who are noninducible, have inducible VF, or ventricular flutter (CL <200 milliseconds). These findings seem to be consistent regardless of the mode of induction of VT (with two or fewer, three or fewer, or four extrastimuli), or measured LVEF (≤30% or between 31% and 40%).35
Tachycardia Features
His Bundle Activation
No Visible His Potential During Ventricular Tachycardia
The His potential cannot be observed during VT in many patients, likely because the retrograde His potential is masked by ventricular activation or because of suboptimal catheter position. A proper HB catheter position can be verified by observation of the immediate appearance of the His potential on termination of the VT, the disappearance of the His potential on initiation of VT, or the sudden appearance of the His potential when spontaneous or induced supraventricular beats capture the HB (with or without ventricular capture) during VT. Additionally, when complete ventricular–His bundle (VH) block is present, dissociated His potentials will be observed.3
Visible His Potential During Ventricular Tachycardia
His potentials can be recorded during VT in approximately 80% of patients. When the His potential is visible during VT, it is often difficult to determine whether the recorded His potential is anterograde or retrograde, and whether an apparent His potential is actually a right bundle branch (RB) potential. Recording the RB or left bundle branch (LB) potentials to demonstrate that their activation precedes HB activation during VT, and HB pacing producing a longer HV interval than the one noted during VT, usually helps clarify the situation.3
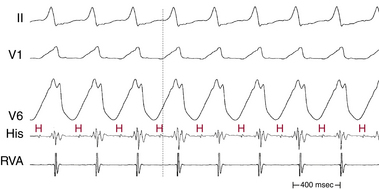
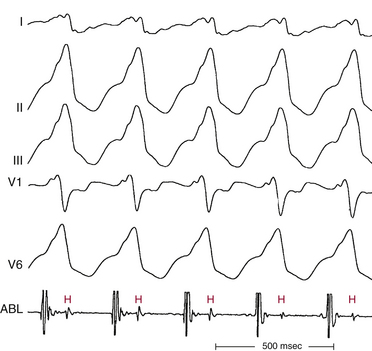
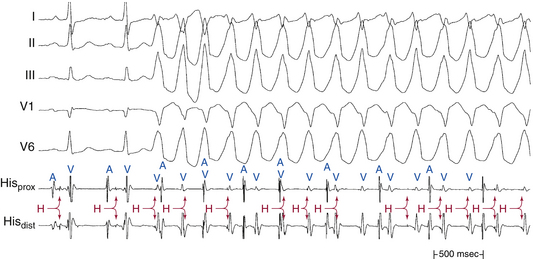
In patients with coronary artery disease, the relative timing of the retrograde His potential in the QRS depends on how quickly the His-Purkinje system (HPS) is engaged and how slowly the impulse reaches the ventricle to produce the QRS. Thus, depending on the relative conduction time up the HPS versus through the slowly conducting muscle to give rise to the QRS, the His potential can occur before, during, or after the QRS. The His potential can occasionally occur before ventricular activation (with a His bundle–ventricular [HV] interval during VT shorter than that during NSR; Fig. 22-9) and can also occur just after the onset of ventricular activation (with a VH interval; Fig. 22-10). The occurrence of an HV interval (i.e., with the His potential preceding the QRS onset) shorter than that during NSR (in the absence of preexcitation) or a VH interval (i.e., with the His potential following the QRS onset) implies the presence of retrograde HB activation; it further implies that retrograde conduction from the exit of VT (defined by the onset of the QRS) to the HB is less than the anterograde conduction time over the HPS to activate the ventricle.1 Engagement of the HPS, when present, can allow for more rapid activation of the myocardium, which in turn results in a narrower QRS. Some have suggested that the site of origin of such VTs is within the HPS (i.e., fascicular VTs), although proof that such VTs originate from the fascicles and differ from other forms of VT is often lacking. The retrograde His potential appears to reflect passive activation of the HPS, rather than involvement of the HPS in the reentrant circuit. This concept is supported by several observations. HB deflections can appear intermittently (typically in a 2:1 or 3:2 fashion, and occasionally in a Wenckebach periodicity), and changes in the VH interval can occur without changes in the tachycardia CL (Fig. 22-11). In fact, marked changes in the tachycardia CL can be present with no changes in the VH interval. Furthermore, AES or atrial pacing can result in anterograde capture of the HB in the presence or absence of ventricular capture or fusion beats. Such an event, linking atrial activation to the HB deflection, proves that HB deflections are caused by anterograde activation and are unrelated to maintenance of the VT in the vast majority of cases.3
For wide complex tachycardias with the His potential preceding the QRS, an HV interval that is shorter during tachycardia than during NSR suggests VT or preexcited SVT (see Fig. 18-3), whereas an HV interval during tachycardia that is equal to or longer than that during NSR suggests SVT with aberrancy (see Fig. 18-24), BBR VT (see Fig. 26-3), or, rarely, other VTs. A changing AH interval, failure to observe anterograde His potential during VT with AV dissociation, or both suggests the presence of retrograde conduction with concealment in the AVN.
Diagnostic Maneuvers during Tachycardia
Ventricular Extrastimulation During Ventricular Tachycardia
Initially, a single VES is delivered at a coupling interval 10 to 20 milliseconds shorter than the tachycardia CL. The coupling interval is then gradually decreased by 5- to 10-millisecond decrements, until the local effective refractory period (ERP) is reached. The RV apex is used as the initial site of stimulation. Stimulation from other sites (RVOT and LV) also can be used to gain information regarding the site specificity of a given response. The return CL is analyzed to evaluate whether the VES has influenced the VT in terms of resetting, ability and pattern of termination, and site specificity for stimulation affecting the VT.3
If resetting or termination of VT is not observed with single VESs, stimulation is repeated using double VESs. The first VES is delivered at a coupling interval 20 milliseconds greater than the longest coupling interval at which a single VES resets the VT, or 20 milliseconds above the local ERP if a single VES fails to interact with the VT. The second VES is delivered at a coupling interval equal to the tachycardia CL, and then this coupling interval is progressively decreased in 5- to 10-millisecond decrements until the local ERP is reached. The use of double VESs allows comparable coupling intervals to reach the circuit at a greater relative degree of prematurity and ability to influence the VT than if the same coupling interval were used for a single VES. By this methodology, only a single VES interacts with the circuit; if the two VESs are delivered such that each VES interacts with the site of impulse formation, interpretation of the response would then be difficult. Thus, the first VES is delivered so that it would not interact with the circuit but would help the second VES to do so.3
Manifest Perpetuation
Manifest perpetuation is said to be present when the VES fails to influence the VT, resulting in a full compensatory pause surrounding the VES. Factors influencing the ability of the VES to interact with the VT include tachycardia CL, local ventricular ERP at the stimulation site, and distance between the stimulation site and VT circuit. The tachycardia CL and duration of the excitable gap are the most important factors; the faster the VT (especially with CLs less than 300 milliseconds) and the shorter the duration of the reentrant circuit excitable gap, the more difficult it is for the VES to enter the VT circuit. Local ERP at the stimulation site and at the site of impulse formation also can limit the prematurity with which the VES can be introduced. Also, the farther the stimulation site is from the VT circuit, the more difficult it is for the VES to reach the circuit with adequate prematurity.
Failure of a VES to affect the VT circuit helps demonstrate the extent of the ventricular myocardium that is not required for the VT. Thus, the ability to capture significant portions of the ventricle by the VES without affecting the VT suggests that those captured areas are not required for the VT circuit. Similarly, intermittent capture of the HPS during VT suggests that it also is not necessary to maintain the VT, regardless of where the His potential is located relative to the QRS during the VT. In an analogous fashion, sinus captures (occurring spontaneously or in response to atrial stimulation) may occur without influencing the VT. The demonstration that neither the proximal HPS nor the majority of the ventricles are required to sustain the VT suggests that the VT circuit must occupy a relatively small and electrocardiographically silent area of the heart.3
Concealed Perpetuation
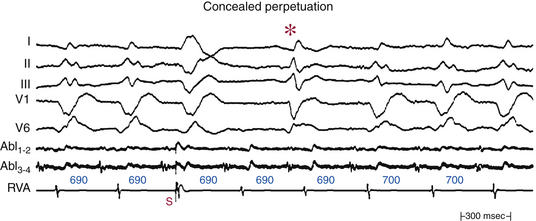
Concealed perpetuation implies that the VES not only fails to influence the VT circuit, but also is followed by a pause that exceeds the tachycardia CL or that is occasionally interrupted by a sinus capture before the next VT beat. Such pauses are a form of functional exit block, because the VT impulse is unable to exit the circuit and depolarize the ventricles that have just been activated by the VES (Fig. 22-12).3
Resetting
Resetting is the advancement (acceleration) of VT by a timed VES with a pause that is less than fully compensatory before resumption of the VT (Fig. 22-13). The first return VT complexes should have the same morphology and CL as the VT before the VES, regardless of whether a single or multiple extrastimuli are used.
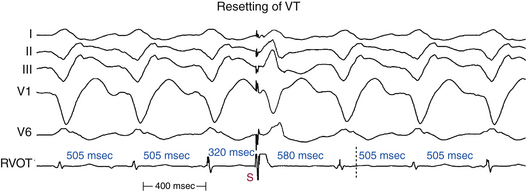
The introduction of a single VES (S2) during VT yields a return cycle (S2-V3) if the VT is not terminated. If S2 does not affect the VT circuit, the coupling interval (V1-S2) plus the return cycle (S2-V3) will be equal to twice the VT cycle (2 × V1V1)—that is, a fully compensatory pause will occur (see Fig. 3-14). Resetting of VT occurs when a less than fully compensatory pause occurs (by at least 20 milliseconds). In this situation, V1-S2 + S2-V3 will be less than 2 × V1V1, as measured from the surface ECG. Tachycardia CL oscillation should be taken into account when the return cycle is evaluated. To account for any tachycardia CL oscillation, at least a 20-millisecond shortening of the return cycle is required to demonstrate resetting. When more than a single VES is used, the relative prematurity should be corrected by subtracting the coupling interval(s) from the spontaneous tachycardia cycles when the VESs are delivered.3
To reset a reentrant VT, the stimulated wavefront must reach the reentrant circuit, encounter excitable tissue within the circuit (i.e., enter the excitable gap of the reentrant circuit), collide in the antidromic (retrograde) direction with the previous tachycardia beat, and continue in the orthodromic (anterograde) direction to exit at an earlier than expected time and perpetuate the tachycardia (see Fig. 3-15). If the VES encounters a fully excitable tissue, which commonly occurs in reentrant tachycardias with large excitable gaps, the tachycardia is advanced (i.e., made to occur earlier) by the extent to which the stimulated wavefront arrives at the entrance site prematurely. If the tissue is partially excitable, which can occur in reentrant tachycardias with small or partially excitable gaps, or even in circuits with large excitable gaps when the VES is very premature, the stimulated wavefront will encounter some conduction delay in the orthodromic direction within the circuit. As a consequence, the degree of advancement of the next tachycardia beat will depend on both the degree of prematurity of the VES and the degree of slowing of its conduction within the circuit. Therefore, the reset tachycardia beat can be early, on time, or later than expected.
Effect of Number of Ventricular Extrastimuli
Approximately 60% of VTs can be reset with a single VES and 85% with double VESs using RV pacing. All VTs reset by a single VES can also be reset by double VESs. Double VESs produce resetting over a longer range of coupling intervals and should therefore be used to characterize the excitable gap of the VT more fully. The resetting zone is approximately 70 milliseconds for most VTs, but is usually longer in those VTs reset by both single and double VESs than those requiring double VESs. Resetting zones in response to single VESs usually occupy 10% to 20% of the VT cycle. This is increased to approximately 25% in response to double VESs, but occasionally can exceed 30%, even in response to a single VES. VTs with LBBB morphology are less likely to require double VESs for resetting than VTs with RBBB morphology, regardless of the frontal plane axis, because VTs with LBBB arise in or adjacent to the septum, closer to the RV stimulation site.3
Resetting does not require that the pacing site be located in the reentrant circuit. The closer the pacing site to the circuit, however, the less premature a single VES can be and reach the circuit without being extinguished by collision with the tachycardia wavefront emerging from the VT circuit. The longest coupling interval for a VES to be able to reset a reentrant tachycardia will depend on the tachycardia CL, the duration of the excitable gap of the tachycardia, local refractoriness at the pacing site, and conduction time from the stimulation site to the reentrant circuit. Neither local ventricular ERP nor local activation time influences the number of VESs required for resetting. Approximately 10% to 20% of VTs demonstrate site specificity in response to VES. Using double VESs reduces this site specificity. Approximately 70% of VTs can be reset with a single VES delivered to the RV apex or RVOT. Resetting of VT by a single VES can always be achieved from some site in the LV, even when resetting cannot be achieved from RV sites.3
The return cycle is the time interval from the resetting VES to the next excitation of the pacing site by the new orthodromic VT wavefront. This corresponds to the time required for the stimulated impulse to reach the circuit, conduct through the circuit, and exit. The noncompensatory pause following the VES and the return cycle are typically measured at the pacing site; however, they can also be measured to the onset of the surface ECG complex. Conduction time between the pacing site and the VT circuit may or may not be equal to that from the VT circuit to the pacing site. Differences in the VT circuit entrance and exit can result in differences in conduction time to and from the pacing site. These differences depend on the site of stimulation and VT site of origin. In VTs reset by both single and double VESs, the shortest return cycle seen by both methods is usually the same. If the return cycle is measured from the VES producing resetting to the onset of the first return VT QRS complex on the surface ECG, the shortest return cycle will be less than the tachycardia CL in more than 40% of VTs. Because stimulation is usually performed from the RV, conduction time into the VT circuit is incorporated into that measurement. If one considers conduction time between the pacing site and the circuit to be equal to that from the circuit to the pacing site (i.e., local activation time) and subtracts this value from the return cycle as measured to the surface ECG QRS, the resultant value for the return cycle is less than the tachycardia CL in 80% of VTs.3
Flat or mixed (flat, and then increasing) response curves characterize reentrant VTs. A flat curve is noted in approximately two-thirds of VTs, suggesting that a fully excitable gap is present. It also signifies anatomically separate entrance and exit sites of the circuit (see Fig. 3-16). In approximately 40% of VTs, the types of resetting curves can vary, depending on the site of ventricular stimulation. VESs from different pacing sites likely engage different sites in the VT circuit that are in different states of excitability or refractoriness and, therefore, result in different conduction velocities and resetting patterns.3
The ability to reset a tachycardia after it has begun activating the myocardium (i.e., resetting with fusion) excludes automatic and triggered mechanisms and is diagnostic of reentry. Resetting with ECG fusion requires wide separation (in time, distance, or both) of entry and exit sites of the VT circuit, with the stimulus wavefront preferentially engaging the entrance. For resetting with fusion to occur, the premature paced wavefront has to reach the entrance of the reentrant circuit before it reaches the exit, and, at the same time, allow for the VT wavefront to exit the reentrant circuit, while the VT wavefront is unable to reach the entrance of the circuit before the paced wavefront (Fig. 22-14). Fusion of the stimulated impulse can be observed on the surface ECG and/or intracardiac recordings if the stimulated impulse is intermediate in morphology between a fully paced complex and the tachycardia complex. The ability to recognize surface ECG fusion requires a significant mass of myocardium to be depolarized by both the VES and VT. If presystolic activity in the reentrant circuit is present before delivery of the VES that resets the VT, this must be considered to represent local fusion. Thus, a VES delivered after the onset of the tachycardia QRS on the surface ECG that enters and resets the VT circuit will always demonstrate local fusion. Resetting with local fusion and a totally paced surface QRS complex suggests that the reentrant circuit is physically small. The farther the stimulation site is from the reentrant circuit, the less likely resetting with ECG fusion will occur. In this setting, the VES should be delivered at a shorter coupling interval to enable the paced wavefront to reach the VT circuit with sufficient prematurity; hence, the stimulated impulse will reflect a purely paced QRS without ECG fusion.
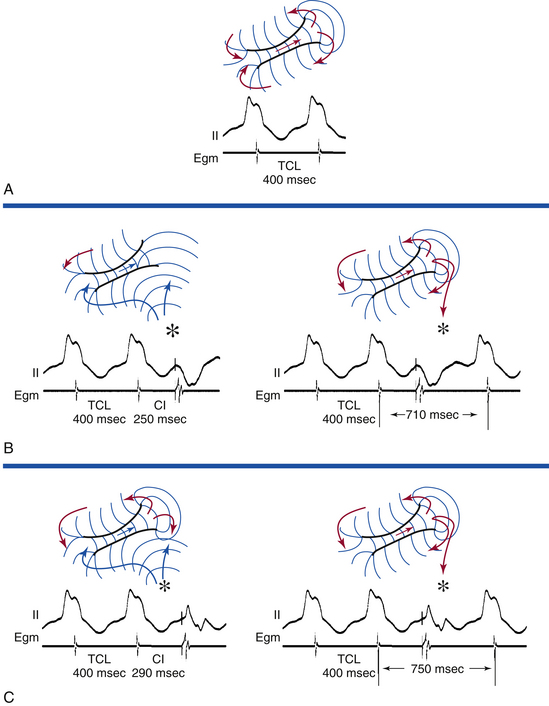
Resetting with surface ECG fusion of the QRS during RV stimulation is observed in 60% of VTs, 40% of which are usually reset with a VES delivered after the onset of the VT QRS. VTs reset with fusion have a higher incidence of flat resetting curves, longer resetting zones, and significantly shorter return cycle, measured from the stimulus to the onset of the VT QRS, than VTs not reset with fusion. The return cycle corrected to the tachycardia CL is shorter with VTs reset with fusion (0.89 versus 1.12). In 80% of VTs reset with fusion, the return cycle is shorter than the tachycardia CL measured at the onset of the QRS (versus only 4% of VTs reset without fusion). The return cycle minus local activation time is equal to the time for the wavefront to traverse the distance from the entrance to the exit of the circuit. This interval is less than the tachycardia CL in 100% of VTs reset with fusion. These findings are consistent with widely separate entrance and exit sites of the VT circuit.3
Termination
Termination of VT by a VES occurs when the VES collides with the preceding tachycardia impulse antidromically and blocks in the reentrant circuit orthodromically (see Fig. 3-15). This occurs when the VES enters the reentrant circuit early enough in the relative refractory period, because it fails to propagate in the anterograde direction and encounters absolutely refractory tissue. In the retrograde direction, it confronts increasingly recovered tissue and is able to propagate until it collides with the circulating wavefront and terminates the arrhythmia.
Termination of VT by a single VES is uncommon, occurring in 10% to 46% of VTs. The closer the stimulation site to the circuit, the more prematurely a VES can engage the VT circuit, because the refractoriness and conduction delay in intervening myocardial tissue are avoided. The success of termination, however, is directly related to the number of VESs used. Occasionally, when stimulation is performed at the critical isthmus of the VT circuit, termination can occur with a nonpropagated VES that fails to depolarize the bulk of the myocardium but is adequate to depolarize the isthmus and make it refractory to the incoming VT wavefront, resulting in termination of the VT (Fig. 22-15).3
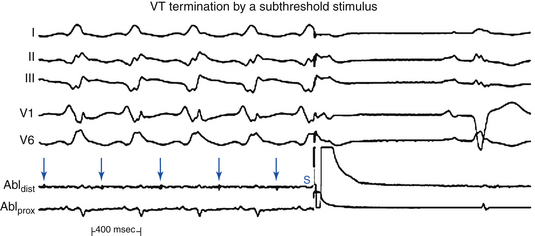
Ventricular Pacing During Ventricular Tachycardia
It is critical to synchronize the initiation of pacing to the electrogram at the pacing site, because absence of synchronization will lead to a variable coupling interval of the first paced impulse to the VT. It is also important to perform overdrive ventricular pacing at each pacing CL for sufficiently long duration to allow the pacing drive to penetrate and affect the VT circuit. Pacing for a short period is a common mistake; it results in erroneous evaluation of the VT response. For VTs that are not stable enough to allow completion of an entire stimulation protocol, synchronized bursts of pacing at variable pacing CLs for a specified but variable number of beats, can usually be performed and can provide information about resetting or entrainment, overdrive suppression, and termination.
Acceleration
Acceleration is classified according to the morphology of the accelerated tachycardia: VT morphology identical to or different from the original VT, or polymorphic VT. An accelerated VT with a QRS morphology identical to the original VT suggests that the accelerated VT is using the same exit of the original VT circuit. The most likely mechanism underlying this form of VT acceleration is an area of block that determines the size of the reentrant circuit, which is determined to some extent by refractoriness. Rapid pacing can shorten the refractoriness in a proximal region of the arc of block, which would in turn shorten the length of the reentrant pathway. If the distal component of the arc of block remains unchanged, acceleration of the VT will occur with the same exit site and hence the same QRS morphology. Alternatively, rapid pacing can remove block in a shorter potential pathway, creating a smaller circuit.3
Transformation
Transformation of the index VT into multiple distinct uniform VT morphologies can occur in response to overdrive pacing. It is not infrequent for stimulation during one VT to induce another VT of different morphology and CL, only to be changed to a third or fourth one by continued stimulation. The significance of all these multiple morphologically distinct VTs induced during overdrive pacing of the spontaneous VT is uncertain if they were never seen before spontaneously or induced by programmed stimulation. Usually, however, these VTs can also be induced by programmed electrical stimulation. Nevertheless, any VT (even if not seen before) that is uniform and has a CL longer than 250 milliseconds is clinically important. Those VTs may not have been observed previously because the original VT dominates because it is more readily inducible. Induction of rapid unstable VTs (CL <250 milliseconds) in patients who presented with only stable VT does not have prognostic value.3
Entrainment
Classic criteria for recognition of entrainment are the following: (1) fixed fusion of the paced complexes at any single pacing CL; (2) progressive fusion as the pacing CL decreases (i.e., the surface ECG progressively looks more like the purely paced QRS complex than a pure tachycardia QRS complex); and (3) resumption of the same VT morphology following pacing with a nonfused tachycardia QRS complex at a return cycle equal to the pacing CL (see Figs. 5-15 and 5-16). The return cycle is defined as the interval from the last paced beat to the first VT beat, and is measured from the surface QRS or RV electrograms.36,37
As noted, fusion of the stimulated impulse can be observed on the surface ECG, intracardiac recordings, or both. The stimulated impulse will have hybrid morphology between the fully paced QRS and the tachycardia QRS (Fig. 22-16; and see Figs. 5-15 and 5-16). The ability to demonstrate surface ECG fusion requires a significant mass of myocardium to be depolarized by both the extrastimulus and the tachycardia. The farther the stimulation site from the reentrant circuit, the less likely entrainment with ECG fusion will occur. Overdrive pacing of a tachycardia of any mechanism can result in a certain degree of fusion, especially when the pacing CL is only slightly shorter than the tachycardia CL. Such fusion, however, is unstable during the same pacing drive at the same pacing CL, because pacing stimuli fall on a progressively earlier portion of the tachycardia cycle, producing progressively less fusion and more fully paced morphology. Such phenomena should be distinguished from entrainment, and sometimes this requires pacing for long intervals to demonstrate variable degrees of fusion. Focal tachycardias (automatic, triggered activity, or microreentrant) cannot manifest fixed or progressive fusion during overdrive pacing (Fig. 22-17). Moreover, overdrive pacing frequently results in suppression (automatic) or acceleration (triggered activity) of focal VTs rather than resumption of the original tachycardia with an unchanged tachycardia CL.36,37
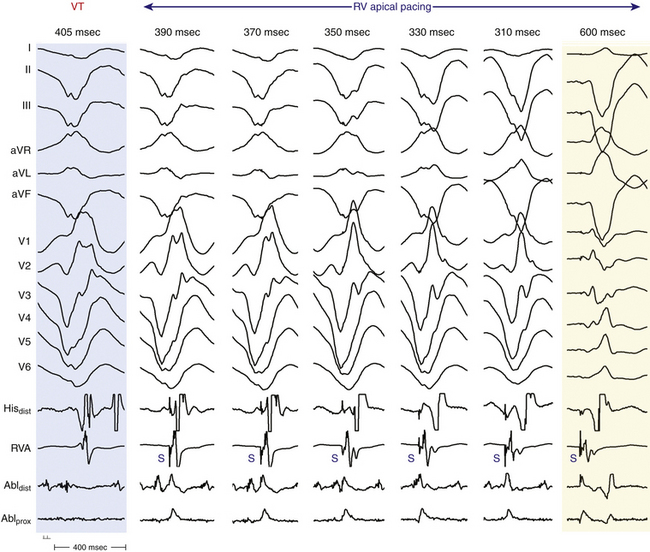
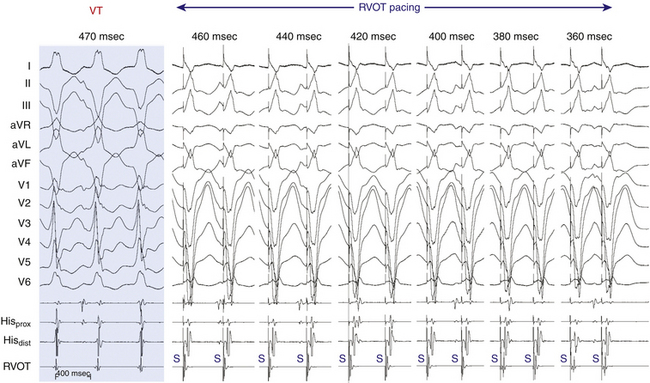
Entrainment with Manifest Fusion
Entrainment of reentrant tachycardias commonly produces manifest fusion that is stable (fixed) during the pacing drive at a given pacing CL; repeated entrainment at pacing CLs progressively shorter than the tachycardia CL results in different degrees of QRS fusion, with the resultant QRS configuration looking more like a fully paced configuration (see Figs. 5-15 and 5-16).
Entrainment with Inapparent Fusion
Entrainment with inapparent fusion (also referred to as local or intracardiac fusion) is said to be present when a fully paced QRS morphology (with no ECG fusion) is observed during entrainment, even when the tachycardia impulse exits the reentrant circuit (orthodromic activation of the presystolic electrogram is present). In this setting, fusion is limited to a small area and does not produce surface ECG fusion, and only intracardiac (local) fusion can be recognized (see Fig. 5-18). Local fusion can only occur when the presystolic electrogram is activated orthodromically. Collision with the last paced impulse must occur distal to the presystolic electrogram, either at the exit from the circuit or outside the circuit. In such cases, the return cycle measured at this local electrogram will equal the pacing CL. Therefore, a stimulus delivered after the onset of the surface ECG QRS during entrainment will always demonstrate local fusion. This is to be distinguished from entrainment with antidromic capture. When pacing is performed at a CL significantly shorter than the tachycardia CL, the paced impulse can penetrate the circuit antidromically and retrogradely (antidromically) capture the presystolic electrogram so that no exit from the tachycardia circuit is possible. Consequently, the surface QRS appears fully paced. When pacing is stopped, the impulse that conducts antidromically also conducts orthodromically to reset the reentrant circuit with orthodromic activation of the presystolic electrogram. When antidromic (retrograde) capture of the local presystolic electrogram occurs, the return cycle, even when measured at the site of the presystolic electrogram, will exceed the pacing CL by the difference in time between when the electrogram is activated retrogradely (i.e., preexcited antidromically) and when it would have been activated orthodromically (see Fig. 5-15).36
Entrainment with Concealed Fusion
Entrainment with concealed fusion (sometimes also referred to as “concealed entrainment”) is defined as entrainment with orthodromic capture and a surface ECG complex identical to that of the tachycardia (Fig. 22-18). Entrainment with concealed fusion suggests that the pacing site is within a protected isthmus inside or outside the reentrant circuit, but attached to the circuit (i.e., the pacing site can be in, attached to, or at the entrance to a protected isthmus that forms the diastolic pathway of the circuit). In this setting, transient entrainment is achieved when the orthodromically directed stimulated wavefront resets the tachycardia, but an antidromically stimulated wavefront collides with the tachycardia wavefront in or near the reentry circuit and fails to exit the slow conduction zone. Only tissue near the pacing site within the critical isthmus is antidromically activated; hence, there is no evidence of fusion. Compared with the intrinsic tachycardia, this antidromic capture may result in earlier intracardiac recordings from bipole sites located adjacent to the pacing region. The morphological appearance of the ECG, however, is the same during entrainment as during the tachycardia. Entrainment with concealed fusion can occur by pacing from bystander pathways, such as a blind alley, alternate pathway, or inner loop, that are not critical to the maintenance of reentry. In this situation, activation propagates from the main circuit loop but is constrained by block lines having the shape of a cul-de-sac; ablation at these sites does not terminate reentry.36
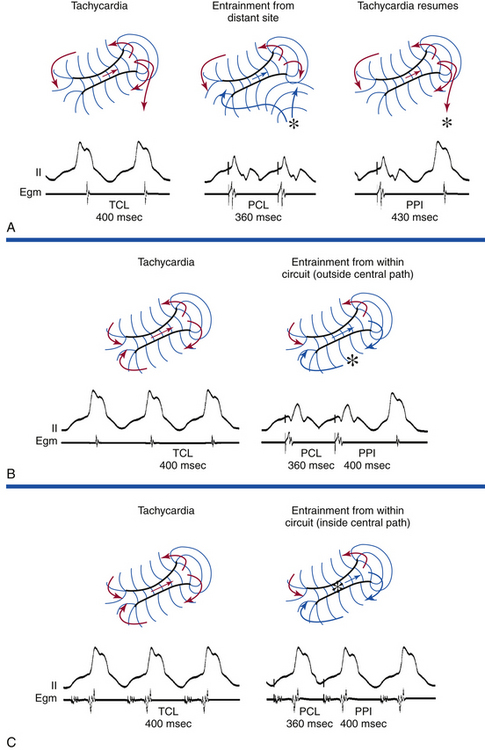
Occasionally, one of the first few stimuli of a drive train intended to entrain VT terminates VT without propagation. Subsequent stimuli often result in QRS complexes that do not resemble VT, leading the operator to conclude that the site is far from the isthmus. Review of the first few stimuli of pacing may show that the site actually was very attractive for ablation (Fig. 22-19).
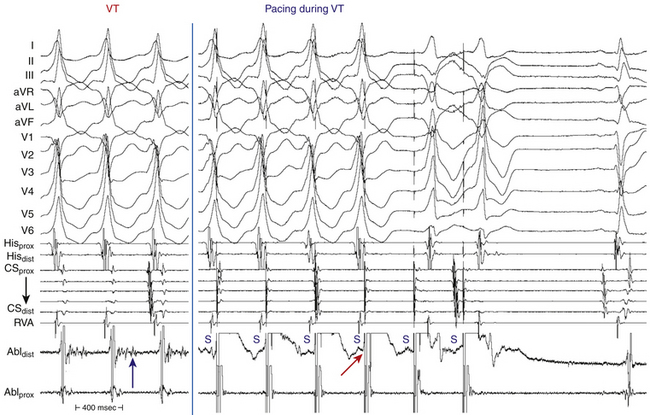
The post-pacing interval (PPI) is the interval from the last pacing stimulus that entrained the tachycardia to the next recorded electrogram at the pacing site (see Fig. 22-18). The PPI should be measured to the near-field potential that indicates depolarization of tissue at the pacing site. The PPI remains relatively stable when entrainment of VT is performed at the same site, regardless of the length of the pacing drive. This is in contrast to overdrive suppression seen in automatic arrhythmias, which would be associated with progressive delay of the first tachycardia beat return cycle with progressively longer overdrive pacing drives.36–38
Termination
Factors influencing termination of VT can be modified. Refractoriness at the site of stimulation can be modified by the use of multiple VESs or a higher pacing current. The distance, conduction time, or both from the site of stimulation to the VT site can be modified by changing the site of stimulation. The tachycardia CL can be increased by antiarrhythmic agents, but the response is unpredictable. However, two problems are frequently encountered in attempts to terminate VT—acceleration of the VT by overdrive pacing and the appearance of multiple distinct uniform VT morphologies.3
Regardless of the mode of stimulation used, termination is usually abrupt, which distinguishes reentrant VTs from triggered VTs. In reentrant VTs, termination must occur when an impulse penetrates the circuit and blocks in both directions. Rapid ventricular pacing is the most efficacious way of VT termination, regardless of the tachycardia CL. Approximately 80% of VTs terminated by a single VES have a tachycardia CL longer than 400 milliseconds. All VTs terminated by single or double VESs can also be terminated by ventricular pacing. Termination is less likely to occur when the VT cannot be reset with very premature VES (i.e., the VES coupling interval is more than 75% of the tachycardia CL).3
A single VES delivered during entrainment of VT can facilitate termination of VT by allowing easier access to the excitable gap. Even when a single VES or overdrive pacing alone fails to terminate the VT, the combination of both may be successful. Overdrive pacing ensures stable resetting of the VT circuit, allowing a single VES to interact with the circuit much more prematurely than it could in the absence of entrainment. Overdrive pacing also shortens the excitable gap of tissue in the reset circuit, making it possible for a single VES to terminate the VT. This technique avoids the need for multiple VESs, which can increase the heterogeneity of conduction and refractoriness in the intervening tissue and produce polymorphic VT, and the need for rapid pacing, which might induce acceleration of the VT. This method is especially helpful in VTs that were accelerated by rapid pacing and especially in those VTs for which antiarrhythmic agents have made the tachycardia more difficult to terminate.3
Effects of Drugs on Ventricular Tachycardia
Class I agents are the most uniformly successful drugs for slowing the rate of or terminating SMVT. These drugs can also facilitate the induction of SMVT in patients in whom SMVT cannot be induced by the standard programmed electrical stimulation protocol and in patients with coronary artery disease and nonsustained VT. These drugs can also occasionally produce incessant SMVT in patients who, before therapy, only had paroxysmal events. This phenomenon, almost always associated with a slower VT and prolongation of conduction by the agent, would not be expected if the mechanism were triggered activity or abnormal automaticity. Adenosine, beta blockers, and calcium channel blockers are ineffective for termination of post-MI VT.3
Exclusion of Other Arrhythmia Mechanisms
Exclusion of Triggered Activity Ventricular Tachycardia
Stimulation Site Specificity
The site of ventricular stimulation should have no effect on the initiation of triggered activity VT as long as the impulse reaches the focus of the VT. Reentrant VT, on the other hand, can demonstrate absolute or relative site specificity for initiation.
Inducibility with Programmed Electrical Stimulation
Ventricular stimulation can initiate triggered activity VT in less than 65% of cases. Rapid ventricular pacing to initiate triggered VT should be more effective than VES, whereas it has a low yield in initiating reentrant VT. Multiple VESs during NSR or following a drive train of fewer than 8 to 10 beats usually fail to initiate triggered activity VT. Most episodes of triggered activity VT induced by ventricular stimulation are usually nonsustained. Induction of triggered activity VT with atrial pacing is not uncommon.3
Reproducibility of Initiation
Reproducibility of triggered activity VT induction using all methods is less than 50%. Reproducibility of induction with single or double VESs is approximately 25%. Reproducibility is markedly affected by quiescence. Once a triggered rhythm is initiated, a period of quiescence is necessary to reinitiate the rhythm. Thus, the ability to initiate, terminate, and reinitiate sequence is uncommon, in contrast to reentrant VT.3
Relationship of Pacing Cycle Length and Ventricular Extrastimulus Coupling Interval to Ventricular Tachycardia
Typically, both the initial cycle of the triggered activity VT (the return cycle) and the tachycardia CL following cessation of pacing bear a direct relationship to the pacing CL, and a direct relationship to the coupling interval of the VES, when used. Thus, the shorter the initiating ventricular pacing CL, or the shorter the initiating VES coupling interval, the shorter the interval to the first VT beat and the shorter the initial VT CL. Occasionally, with early VESs, a jump in the interval to the onset of the VT complex occurs, so that it is approximately twice the interval to the onset of the VT initiated by later coupled VESs. This is secondary to failure of the initial delayed afterdepolarization (DAD) to reach threshold while the second DAD reaches threshold. Thus, in triggered activity VTs caused by DADs, the coupling interval of the initial VT complex shortens or suddenly increases in response to progressively premature VES. It would not be expected to demonstrate an inverse or gradually increasing relationship, in contrast to reentrant VT. Only with the addition of very early VESs or, occasionally, very rapid ventricular pacing (CL <300 milliseconds) can a sudden jump in the interval to the first VT complex be observed. Furthermore, ventricular pacing CLs longer or shorter than the critical CL window fail to induce triggered activity VT. This critical window may shift with changing autonomic tone.3
Diastolic Electrical Activity
In reentrant VT, electrical activity occurs throughout the VT cycle. Thus, during diastole, conduction is extremely slow and in a small enough area that it is not recorded on the surface ECG. Demonstration that the VT initiation is dependent on a critical degree of slow conduction, manifested by fragmented electrograms spanning diastole, and that maintenance of the VT is associated with repetitive continuous activity is consistent with a reentrant mechanism.
Exclusion of Bundle Branch Reentrant Ventricular Tachycardia
Exclusion of Supraventricular Tachycardia
Supraventricular Tachycardia with Aberrancy
If VT exhibits 1:1 VA conduction, it can mimic SVT with aberrancy. Surface QRS morphology usually helps distinguish SVT with typical RBBB or LBBB from VT. In VT, the atrium is not part of the tachycardia circuit and can be dissociated by atrial pacing. The HV interval in aberrantly conducted SVT is always equal to or longer than that during NSR, which is in contrast to intramyocardial VTs. Additionally, tachycardia response to VES and atrial pacing can be useful for distinguishing SVT from VT, as discussed in detail in Chapter 21.39,40
Preexcited Supraventricular Tachycardia
As noted, because the atrium is not part of the VT circuit, the ability to dissociate the atrium with rapid atrial pacing without influencing the tachycardia CL (V-V interval) or QRS morphology suggests VT and excludes preexcited SVTs. Other pacing maneuvers used for differential diagnosis are discussed in Chapter 21.39,40
[/level-membership-for-cardiovascular-category][not-level-membership-for-cardiovascular-category]
Chapter 22 Post-Infarction Sustained Monomorphic Ventricular Tachycardia
Pathophysiology
Classification of Ventricular Tachycardia
Ventricular tachycardia (VT) is defined as a tachycardia (rate >100 beats/min) with three or more consecutive beats that originates below the bifurcation of the His bundle (HB), in the specialized conduction system, the ventricular muscle, or in a combination of both tissues, independent of atrial or atrioventricular nodal (AVN) conduction.1,2
Classification According to Tachycardia Morphology
Monomorphic VT has a single stable QRS morphology from beat to beat, indicating repetitive ventricular depolarization in the same sequence (Fig. 22-1). Multiple monomorphic VTs refers to more than one morphologically distinct monomorphic VT, occurring as different episodes or induced at different times. Polymorphic VT has a continuously changing or multiform QRS morphology (i.e., no constant morphology for more than five complexes, no clear isoelectric baseline between QRS complexes, or QRS complexes that have different morphologies in multiple simultaneously recorded leads), indicating a variable sequence of ventricular activation and no single site of origin (see Fig. 22-1).3 Torsades de pointes is a polymorphic VT associated with a long QT interval, and is electrocardiographically characterized by twisting of the peaks of the QRS complexes around the isoelectric line during the arrhythmia. Pleomorphic VT has more than one morphologically distinct QRS complex occurring during the same episode of VT, but the QRS morphology is not continuously changing. Bidirectional VT is associated with a beat-to-beat alternans in the QRS frontal plane axis, often associated with digitalis toxicity or catecholaminergic VT. Ventricular flutter is a term that has been applied to a rapid (250 to 350 beats/min) VT that has a sinusoidal QRS configuration that prevents identification of the QRS morphology (see Fig. 22-1). Ventricular fibrillation (VF) is a rapid (usually >350 beats/min), grossly irregular ventricular rhythm with marked variability in QRS amplitude and cycle length (CL), and a changing morphology (see Fig. 22-1).1,2
Classification According to Tachycardia Duration
Sustained VT lasts for more than 30 seconds or requires termination (e.g., cardioversion) in less than 30 seconds because of hemodynamic compromise, whereas nonsustained VT is a tachycardia at more than 100 beats/min lasting for three or more complexes but for less than 30 seconds.3 However, during electrophysiological (EP) testing, nonsustained VT is defined as more than five or six complexes of non–bundle branch reentrant (BBR) VT, regardless of morphology. BBR complexes are frequent (50%) in normal individuals in response to a ventricular extrastimulation (VES) and have no relevance to clinical nonsustained VT. Repetitive polymorphic responses are also common (up to 50%), especially in response to multiple (three or more) VESs with very short coupling intervals (less than 180 milliseconds). The clinical significance of induced polymorphic nonsustained VT is questionable.3 Incessant VT is a continuous sustained VT that recurs promptly over several hours despite repeated interventions (e.g., electrical cardioversion) for termination.4 Less commonly, incessant VT manifests as repeated bursts of VT that spontaneously terminate for a few intervening sinus beats, followed by the next tachycardia burst. The latter form is more common with the idiopathic VTs (see Fig. 23-1).1,2
Classification According to QRS Morphology in V1
VT with a left bundle branch block (LBBB)-like pattern has a predominantly negative QRS polarity in lead V1 (QS, rS, qrS), whereas VT with a right bundle branch block (RBBB)-like pattern has a predominantly positive QRS polarity in lead V1 (rsR′, qR, RR, R, RS). However, the VT may not show features characteristic of the same bundle branch block (BBB)-like morphology in other leads.1,3
Classification According to Tachycardia Mechanism
Focal VT has a point source of earliest ventricular activation with a centrifugal spread of activation from that site. The mechanism can be automaticity, triggered activity, or microreentry. Scar-related reentrant VT describes arrhythmias that have characteristics of reentry and originate from an area of myocardial scar identified from electrogram characteristics or myocardial imaging. Large reentry circuits that can be defined over several centimeters are commonly referred to as “macroreentry” circuits.1,2
Mechanism of Post-Infarction Ventricular Tachycardia
The majority of sustained monomorphic VTs (SMVTs) are caused by reentry involving a region of ventricular scar. The scar is most commonly caused by an old myocardial infarction (MI), but right ventricular (RV) dysplasia, sarcoidosis, Chagas disease, other nonischemic cardiomyopathies, surgical ventricular incisions for repair of tetralogy of Fallot, other congenital heart diseases, or ventricular volume reduction surgery (Batista procedure) can also cause scar-related reentry. Dense fibrotic scar creates areas of anatomical conduction block, and fibrosis between surviving myocyte bundles decreases cell-cell coupling and distorts the path of propagation, causing areas of slow conduction and block, which promotes reentry. In post-MI VT, a variety of different circuit configurations are possible. Generally, the reentrant circuit arises in areas of fibrosis interspersed with bundles of viable myocytes, producing a zigzag course of activation of and transverse conduction along a pathway lengthened by branching and merging bundles of surviving myocytes, leading to inhomogeneous anisotropy (see Fig. 3-18). Heterogeneity in tissue composition and autonomic innervations in these regions may create areas of aberrant conduction that generate the substrate for reentrant arrhythmias. Buried in the arrhythmogenic area is the common central pathway, the critical isthmus, causing slowing of impulse conduction, allowing reentry to occur. The isthmus itself can be surrounded by dead ends or branches that do not participate in the common pathway of the main reentrant circuit (bystander).4,5
Although previous data suggested that most isthmuses are anatomically determined by heterogeneous scar geometry, a recent study found that the diastolic pathway critical to post-MI VT reentrant circuits is typically protected by a boundary of fixed and functional block. In the majority of cases, development of functional unidirectional block was a prerequisite for initiation of VT, by protecting a region of myocardium that subsequently forms at least one border of the diastolic pathway. Evidence indicates that formation of functional block leading to reentry is associated with large dispersion in refractory periods over short anatomical distances.6
The critical isthmus contained in these reentry circuits often is a narrow path of tissue with abnormal conduction properties. Depolarization of the small mass of tissue in the isthmus is usually not detectable on the surface electrocardiogram (ECG) and constitutes the electrical diastole between QRS complexes during VT. The wavefront leaves the isthmus at the exit site and propagates out to depolarize the remainder of the ventricles, producing the QRS complex. After leaving the exit of the isthmus, the reentrant wavefront can return back to the entrance of the isthmus through an outer loop or an inner loop (see Fig. 5-14).4 An outer loop is a broad sheet of myocardium along the border of the infarct. Depolarization of the outer loop can be detectable on the surface ECG. Reentrant circuits can have one or more outer loops. An inner loop is contained within the scar. Inner loop pathways can serve as potential components of a new reentrant circuit should the central common pathway be ablated. If multiple loops exist, the loop with the shortest conduction time generally determines the VT CL and is therefore the dominant loop. Any loop with a longer conduction time behaves as a bystander. Those bystander loops can serve as a potential component of a new reentrant circuit if the dominant loop is ablated.
The critical isthmus in post-MI VT is typically bounded by two approximately parallel conduction barriers that consist of a line of double potentials, a scar area, or the mitral annulus. The endocardial reentrant VT rotates around the isthmus boundaries and propagates slowly through the critical isthmus, which harbors diastolic potentials and measures, on average, approximately 30 mm long by 16 mm wide. The axis of a critical isthmus is typically oriented parallel to the mitral annulus plane in perimitral circuits and perpendicular to the mitral annulus plane in other circuits.4 Ablation lesions produced with standard radiofrequency (RF) ablation catheters are usually less than 8 mm in diameter, relatively small in relation to the entire reentry circuit, and can be smaller than the width of the reentry path at different points in the circuit. Successful ablation of a large circuit is achieved by targeting an isthmus where the circuit can be interrupted with one or a small number of RF lesions, or by creating a line of RF lesions through a region containing the reentry circuit.
A recent study using electroanatomical substrate mapping found that patients without clinical SMVT had markedly smaller endocardial low-voltage areas, fewer scar-related electrograms (i.e., fractionated, isolated, and very late potentials, which represent electrically viable sites within the scar), and fewer putative conducting channels compared with similar ischemic cardiomyopathy patients with spontaneous SMVT, despite equally severe left ventricular (LV) dysfunction as well as similar infarct age and distribution. These differences in the endocardial EP substrate can play an important role in VT arrhythmogenesis in the chronic post-MI context. Both the extent of the scar areas (electrogram voltage <0.5 mV) and the presence of numerous channels within this zone seem to be critical to the development of VT. Although the border zone region of the scar (electrogram voltage, 0.5 to 1.5 mV) did not differ in area between the two groups, this zone also had a significantly higher prevalence of putative conducting channels in the SMVT patients. This suggests a fundamentally different scar composition (more “arrhythmogenic”) in the SMVT patients. As noted, inhomogeneous scarring with varying degrees of subendocardial myocardial fiber preservation within dense zones of fibrosis leads to slowed conduction, nonuniform anisotropy, and the potential for channels within the scar zone—conditions necessary for the development of reentry.7
A focal mechanism of VT (abnormal automaticity or triggered activity) has been implicated in the settings of acute ischemia. Focal VT may also occur in the absence of an acute ischemic event in patients with chronic ischemic heart disease. A recent study found that a focal mechanism was present in up to 9% of VTs that were induced in patients with ischemic heart disease during EP study for RF ablation.8
Clinical Considerations
Epidemiology
Coronary heart disease is the most frequent cause of clinically documented VT and VF (76% to 82% of patients). The incidence of SMVT in patients with an acute MI varies with the type of MI. Among almost 41,000 patients with an ST elevation (Q wave) MI treated with thrombolysis in the GUSTO-1 trial, 3.5% developed VT alone and 2.7% developed both VT and VF. A pooled analysis of four major trials of almost 25,000 patients with a non–ST elevation acute coronary syndrome (non–ST elevation MI and unstable angina) noted a lower incidence of VT—0.8% developed VT alone and 0.3% developed both VT and VF.1,9
SMVT within the first 2 days of acute MI is uncommon, occurring in up to 3% of patients as a primary arrhythmia and with VF in up to 2%, and is associated with an increase in in-hospital mortality compared with those without this arrhythmia. However, among 21- to 30-day survivors, mortality at 1 year is not increased, suggesting that the arrhythmogenic mechanisms can be transient in early post-MI SMVT. On the other hand, the typical patient with SMVT occurring during the subacute and healing phases, beginning more than 48 hours after an acute MI, has had a large, often complicated infarct with a reduced LV ejection fraction (LVEF), and such VT is a predictor of a worse prognosis.9 SMVT within 3 months of an MI is associated with a 2-year mortality rate of 40% to 50%, with most deaths being sudden. Predictors of increased mortality in these patients are anterior wall MI; frequent episodes of sustained VT, nonsustained VT, or both; heart failure; and multivessel coronary disease, particularly in individuals with residual ischemia.
Early reperfusion of infarct-related arteries results in less aneurysm formation, smaller scars, and less extensive EP abnormalities, although a significant risk of late VT (often with rapid CLs) persists.2,10 In patients with ST elevation MI treated with primary percutaneous coronary intervention, delayed reperfusion (>5 hours after MI) was associated with a sixfold increase in the odds of inducible SMVT by programmed electrical stimulation (performed 6 to 10 days post-MI) as well as an increased risk of spontaneous ventricular arrhythmias and SCD (after a mean follow-up of 28 ± 13 months) compared with early reperfusion (≤3 hours) independent of LVEF. It was estimated that each 1-hour delay in reperfusion conferred a 10.4% increase in the odds of inducible VT.11
Recent evidence suggests that coronary revascularization before or shortly after implantable cardioverter-defibrillator (ICD) placement in high-risk post-MI patients with LV dysfunction and wide QRS duration can potentially reduce the risk for life-threatening ventricular arrhythmias and appropriate ICD shocks, and, hence, improve quality of life and reduce mortality.12
SCD accounts for up to 15% of total mortality in industrialized countries and claims the lives of more than 300,000 people per year in the United States. Approximately 50% of deaths in patients with prior MI occur suddenly and unexpectedly. Ventricular arrhythmias are responsible for most of these deaths in stable ambulatory populations. Most SCD victims have known heart disease—most frequently coronary artery disease or prior MI. Cardiac arrest is the initial manifestation of heart disease in approximately 50% of cases. Such patients are more likely to have single-vessel coronary disease and normal or mildly abnormal LV systolic function than cardiac arrest victims with prior MI. Although heart failure increases risk for both sudden and nonsudden death, a history of heart failure is present in only approximately 10% of arrest victims.13
The risk for total and arrhythmic mortality is highest in the first month after an acute MI and stays high during the first 6 months after acute MI. After the first year post-MI, there appears to be a relatively quiescent period of relatively low rates of SCD, followed by a second peak 4 to 10 years after acute MI. The later occurrence of SCD may result from delayed ventricular remodeling resulting in the creation or activation of reentrant VT circuits on the infarct border as well as from heart failure developing late after MI.14
Several studies in patients with cardiac arrest have shown that VF as the causative rhythm appears to be decreasing, being replaced by pulseless electrical activity and asystole. Although the cause of this change is unknown, it may reflect patients with sicker hearts who are living longer due to better therapy. Hearts with advanced disease may be more likely to develop pulseless electrical activity and asystole than VF.15
Initial Evaluation
Evaluation of Type and Burden of Ventricular Arrhythmias
Identifying and quantifying the types and burden of sustained and nonsustained VT are necessary. Ideally, a 12-lead ECG should be obtained. In patients with ICDs, stored device data such as electrogram morphology and CL can be used to identify the clinical VT.2
Evaluation of Myocardial Ischemia
Although recurrent SMVT is rarely due to acute myocardial ischemia in patients with known coronary artery disease, diagnostic evaluation for acute or persistent ischemia is warranted to improve patient outcome, especially if the severity of coronary artery disease has not been previously established or prior episodes of VT caused hemodynamic compromise. This may include echocardiographic examination, exercise testing, and cardiac catheterization. In patients with reversible myocardial ischemia, coronary revascularization may be warranted, and can potentially reduce the risk of life-threatening ventricular arrhythmias.12 However, if the severity of coronary disease has been recently defined and symptoms and hemodynamic tolerance of VT do not suggest significant ischemia, further evaluation may not be required.1,2
PreAblation Evaluation
Patients with post-MI VT should be evaluated for comorbidities that can alter the approach to mapping and ablation. Treatment of congestive heart failure and myocardial ischemia should be optimized. Coronary revascularization should be considered in patients with reversible ischemia, because substantial ischemic burden can often be aggravated by the potential induction of prolonged periods of tachycardia or hemodynamically unstable arrhythmias during the ablation procedure. In patients with frequent or incessant VT, however, catheter ablation may be required on an urgent basis before the assessment for coronary artery disease in order to gain prompt control of the ventricular arrhythmia.1,2
In patients with suspected peripheral vascular disease, evaluation of the presence of severe arterial disease is warranted, as it can affect the approach to LV access (atrial transseptal versus retrograde transaortic versus epicardial).16 Similarly, an atrial transseptal approach allowing access to the LV through the mitral valve can be considered in the presence of a mechanical aortic valve or severe aortic valve disease.2
Assessment of the risks for sedation and anesthesia must be performed prior to the procedure, because these patients are likely to require deep sedation or general anesthesia.2
Arrhythmogenic Substrate Imaging
Echocardiography
Transthoracic echocardiography is routinely performed to evaluate LV systolic function, LVEF, and wall motion abnormalities that may contain the potential VT substrate. Transthoracic echocardiography also serves as a reliable tool to rule out ventricular thrombi before LV procedures. Additionally, it helps to identify relatively infrequent cardiomyopathies associated with VT, for example, arrhythmogenic right ventricular dysplasia-cardiomyopathy and hypertrophic cardiomyopathy. Although echocardiography can provide anatomical and contractile parameters, it cannot provide relevant clinical information about transmural extent and intramyocardial location of the scar.17
Delayed Contrast-Enhanced Cardiac Magnetic Resonance
Cardiac MR is extremely valuable for assessing viable and nonviable myocardium in infarcted and poorly contracting myocardial areas, and enables the depiction of transmural and nontransmural infarctions with high spatial resolution and better accuracy than scintigraphic techniques. Assessing the characteristics and distribution of myocardial scar by cardiac MR can potentially help identify patients at high risk of VT. In patients with ischemic CMP, the nontransmural hyperenhanced areas, but not the transmural hyperenhanced areas, were found to predict higher risk of sustained VT.18
Cardiac Contrast-Enhanced Computed Tomography
Cardiac contrast-enhanced CT scanning enables a detailed and comprehensive evaluation of LV myocardium using multimodality imaging based on anatomical, dynamic, and perfusion parameters to identify abnormal substrate (myocardial scar and border zone) with high spatial (≤1 mm) and temporal resolution, which can be derived from a single CT scan. Areas of CT hypoperfusion correlate best with areas of abnormal voltage (<1.5 mV) rather than scar alone (<0.5 mV). Perfusion imaging from CT can indicate scar transmurality and intramyocardial scar location.17
The ability of contrast-enhanced CT to characterize the transmural extent and intramyocardial location of scar tissue and to visualize surviving mid- and epicardial myocardium at sites of endocardial scar can potentially help identify areas involved in myocardial reentry representing appropriate ablation targets and help to overcome one of the significant limitations of endocardial voltage mapping. Additionally, the presence of an epicardial VT substrate can facilitate planning of VT ablations, such as for a combined endocardial and epicardial approach.17 When compared with contrast-enhanced MR, absolute sizes of early hypoperfused and late hyperenhanced regions were similar on contrast-enhanced CT and contrast-enhanced MR.17
The three-dimensional (3-D) CT-defined image of abnormal myocardium can be accurately extracted and embedded in clinical mapping systems displaying areas of abnormal anatomical, dynamic, and perfusion parameters for substrate-guided VT ablations.17
Role of Electrophysiological Testing
In patients with sustained monomorphic VT, EP testing is not recommended unless catheter ablation is planned. However, EP testing is useful in patients with coronary heart disease for the diagnostic evaluation of wide QRS complex tachycardias of unclear mechanism and in those with unexplained syncope. Additionally, EP testing can be used for risk stratification late after MI in patients with ischemic CMP and nonsustained VT (see below).19
Programmed stimulation induces VT in over 90% of patients with a history of VT. Although the rate and QRS morphology of induced VT may differ from that observed during spontaneous tachycardia, the induction of VT signifies the presence of a fixed anatomical substrate associated with an increased likelihood of future spontaneous events.2
Risk Stratification
There are more than 50 million North American adults with coronary artery disease and more than 7 million have had an MI. However, only a fraction of these patients will suffer a cardiac arrest. Therefore, noninvasive risk assessment after MI is required to identify patients at risk of SCD. Various tests assessing the extent of myocardial damage and scarring, myocardial conduction disorders, dispersion of repolarization, and autonomic imbalance have been proposed to identify patients at high risk of SCD who are likely to benefit from prophylactic ICD therapy. Some of these techniques potentially identify the underlying substrate (e.g., myocardial scar, intramyocardial conduction abnormalities) or triggers (e.g., autonomic imbalance, nonsustained VT) of malignant ventricular arrhythmias. However, most of these techniques have not been validated in independent populations and, although they can predict higher risk of total mortality, their ability to predict arrhythmic death is uncertain. Additionally, the majority of conventional risk stratifiers of SCD have a relatively low positive predictive value that would preclude their wide application as guidelines for ICD implantation in patients known to be at risk for SCD.14,20
To date, only two approaches have been proven useful in guiding prophylactic ICD therapy in post-MI patients: the presence of significant LV dysfunction alone or in combination with the inducibility of sustained VT/VF during programmed electrical stimulation beyond the early phase after MI. It should be recognized, however, that the development of SCD in post-MI patients is multifactorial, and multiple events need to coincide for a cardiac arrest to ensue; therefore, no one risk stratification test alone will be sufficient for all patients. Rather, combining multiple tests screening for the different potential mechanisms of SCD may be necessary. Furthermore, because progression of ischemic heart disease can result in the evolution of new mechanisms of SCD in individual patients, repetition of risk stratification tests at certain intervals may be required. It would seem reasonable (in the absence of data) to retest every 2 years in apparently stable patients to detect potential changes in substrate, regardless of which tests appear to have the highest yield.14,20
LEFT VENTRICULAR Ejection Fraction
Multiple studies evaluating survival of patients with prior MI established a clear relationship between reduced LVEF and increased mortality. LVEF behaves as a continuous variable, with gradually increasing mortality risk until the LVEF declines to 40% and then markedly increasing risk for values less than 40%. Nevertheless, the exact mechanisms involved in the strong correlation between decreased LV systolic function and increased incidence of SCD are not clearly defined.14
Although low LVEF identifies one patient population at relatively increased risk for SCD, there are clear limitations to LVEF as the ideal risk-stratification test for deciding whether to implant an ICD for primary prevention of SCD. LV systolic dysfunction lacks specificity. There is no evidence of any direct mechanistic link between low LVEF and mechanisms responsible for ventricular tachyarrhythmias and no study has demonstrated that reduced LVEF is specifically related to SCD. In fact, in studies that enrolled all patients after MI, patients with LVEF less than 30% to 35% account for no more than 50% of sudden cardiac arrest victims. Thus, although LVEF is a good marker of risk for total mortality, it does not provide insight into how patients are likely to die (sudden versus nonsudden).
Invasive Electrophysiological Testing
Inducibility of VT/VF during invasive EP testing can enhance the predictive accuracy of reduced LVEF for post-MI patients with high mortality risk. The first Multicenter Automatic Defibrillator Implantation Trial (MADIT I) study demonstrated that those patients with inducible VT/VF and LVEF values less than or equal to 35% late after MI are likely to benefit from prophylactic ICD therapy. Moreover, the absolute mortality reduction in MADIT I (26.2% over 27 months) was substantially greater than what was found in either the second MADIT (MADIT II) or SCD Heart Failure Trial (SCD-HeFT). Similar results were found in the Multicenter UnSustained Tachycardia Trial (MUSTT).19,21
However, secondary analysis from MUSTT revealed that despite the significant difference in outcome between inducible patients enrolled in the trial and noninducible patients enrolled in a registry, EP inducibility was of limited value because the 5-year mortality rate in inducible patients was 48% compared with 44% in noninducible patients. Later, data from MADIT II showed that there is no need for additional risk stratifiers (including EP testing) when LVEF is so low. In more than 80% of patients randomized to the ICD arm of MADIT II, invasive EP testing with an attempt to induce tachyarrhythmias was performed at the time of ICD placement. VT inducibility, observed in 40% of studied patients, was not effective in identifying patients with cardiac events defined as VT, VF, or death. These observations from both MUSTT and MADIT II subanalyses suggest that in patients with substantially depressed LV function, EP inducibility should not be considered a useful predictor of outcome. It is possible, however, that inducibility might have much better predictive value in post-MI patients with LVEF greater than 30% or greater than 35%.19,21
Furthermore, using inducible VT/VF to guide prophylactic ICD therapy is limited by low sensitivity. Patients with LVEF values not exceeding 35% after MI and no inducible VT/VF still appear to have a substantial (>25%) risk of serious events over the near term.21
There are also no data to support the use of invasive EP testing in post-MI patients with LVEF values more than 40% or in the early post-MI period. In fact, the Beta-blocker Strategy plus Implantable Cardioverter-Defibrillator (BEST-ICD) trial found that inducible VT/VF early after MI does not predict benefit from ICD therapy. In contrast, the Cardiac Arrhythmias and Risk Stratification after Acute Myocardial Infarction (CARISMA) study found that inducible VT identified 6 weeks following an acute MI was a strong predictor of future life-threatening arrhythmias.19,21
Additionally, EP testing is invasive and not practical for broad application as a screening tool. Nonetheless, it can be valuable when used in patients in whom the risk of sustained arrhythmias and SCD is intermediate, and the potential benefit of ICD therapy uncertain. Current guidelines recommend prophylactic ICD therapy in post-MI patients with nonsustained VT and LVEF less than 40% if sustained VT/VF is inducible at EP study.14
Measures of Autonomic Imbalance
Methods to assess the autonomic nervous system, which has been thought to be a modulator between triggers of ventricular tachyarrhythmias and the underlying substrate, including heart rate variability, baroreflex sensitivity, heart rate turbulence, and deceleration capacity, have been evaluated for risk stratification of SCD. Multiple studies have correlated relative excess of sympathetic tone (or deficient parasympathetic tone) with increased mortality in post-MI patients as well as increased propensity for VF during acute ischemia. However, the majority of studies showed no significant difference in relative risk for SCD versus total mortality. Thus, these measures do not appear to provide a reliable measure of SCD risk and there is no evidence to support their use in guiding prophylactic ICD therapy.22
Measures of Myocardial Conduction Disorders
Increased QRS duration on a surface ECG has been associated with a higher risk of death after MI and appears to reflect greater LV dysfunction, but association with SCD has not been proven. Similarly, the presence of late potentials on signal-averaged ECG failed to identify patients likely to benefit from ICD therapy.22 Recently, fragmentation of the QRS complex on the 12-lead surface ECG (filter range, 0.15 to 100 Hz; AC filter, 60 Hz, 25 mm/sec, 10 mm/mV), which likely signifies inhomogeneous ventricular activation due to myocardial scar, ischemia, or both in patients with coronary artery disease, has been found to potentially predict increased risk of appropriate ICD therapies in patients who received an ICD for primary and secondary prevention. The usefulness of this parameter needs further evaluation.23,24
Genetic Testing
There is compelling evidence that a genetic mechanism may increase patient susceptibility to SCD following MI, and genetic assessment may play a role in the future. However, there is presently no evidence for using genetic testing to identify post-MI patients at risk.14,20
Cardiac Magnetic Resonance Imaging
Characteristics of myocardial scar architecture and tissue heterogeneity in the periinfarct zone, as defined by contrast-enhanced cardiac MR, can potentially identify a proarrhythmic substrate and appears to be a strong predictor of ventricular arrhythmias and appropriate ICD therapies. In patients with ischemic CMP, the nontransmural, but not the transmural, hyperenhanced areas were found to predict higher risk of sustained VT.18 However, large prospective trials are still required to evaluate the reliability of these techniques for risk stratification.25
Risk Stratification Early Post-Infarction
The risk of SCD is greatest in the first month after MI and appears to decline in the first year after MI. Nevertheless, both prospective and retrospective studies of prophylactic ICD therapy have failed to show a reduction in all-cause mortality in early post-MI patients. The reduction in the rate of death due to arrhythmia associated with ICD therapy was offset by an increase in the rate of death from nonarrhythmic cardiac causes in the ICD groups. This discrepancy not only highlights the limitations of current risk stratification techniques, but also reflects relative differences in the risk factors for SCD at different time points after MI and the fact that nonarrhythmic death accounts for an appreciable percentage of deaths during that time. Heart rate and creatinine clearance measured at baseline are strongly associated with SCD during the in-hospital period, whereas recurrent cardiovascular events (including heart failure, MI, and rehospitalization) and a baseline LVEF of 40% or less are more strongly associated with the occurrence of SCD after discharge.21,26
Whereas the cumulative incidence of SCD is greatest in post-MI patients with an LVEF of 30% or less, the incidence of SCD is greater in patients with an LVEF greater than 40% in the first 30 days after MI when compared with patients with an LVEF of 30% or less after 90 days. The strength of the association between LVEF and survival free from SCD appears to be greatest in long-term follow-up (>6 months). Currently, there is no strategy (invasive or noninvasive) that can reliably predict the risk for SCD or guide empiric ICD implantation soon after an MI. Data suggest it is best to wait 2 to 3 months after acute MI before performing risk stratification.14,21,26
Recent data suggest a potential benefit of EP testing in risk stratification in patients with ST elevation MI and LVEF less than 40% treated with primary percutaneous coronary intervention. Inducible SMVT by programmed electrical stimulation performed 6 to 10 days post-MI was associated with an increased risk of spontaneous VT/VF and SCD (after a mean follow-up of 28 ± 13 months). However, further evaluation in randomized clinical trials is required before adoption of this approach.11
Principles of Management
Pharmacological Therapy
Acute Therapy
The degree of hemodynamic tolerance should dictate the initial therapeutic strategy. VTs causing severe symptoms of angina or hemodynamic collapse almost always respond to synchronized electrical cardioversion. Treatment of pulseless VT is the same as that for VF and should follow the ACLS protocol. In patients with difficult-to-control or recurrent VT, intravenous amiodarone is the drug of choice. Intravenous procainamide and sotalol are alternatives. Lidocaine is less effective in the absence of acute ischemia; however, it can be considered in combination with either procainamide or amiodarone if the latter drugs are ineffective alone. Beta blockers offer additional benefit in patients with ischemic heart disease. Treatment of underlying conditions (e.g., acute ischemia, decompensated heart failure, electrolyte abnormalities) is also necessary.19 For refractory VT storm, general anesthesia, sympathetic neural blockade, catheter ablation, and intraaortic balloon counterpulsation have been used.
Chronic Therapy
Antiarrhythmic drugs can be considered in two main settings: as adjunctive therapy in patients with an ICD and as preventive therapy in patients who do not want or are not candidates for an ICD (e.g., because of marked comorbidities). Because an ICD does not prevent arrhythmias, patients who have frequent symptoms or device discharges triggered by VT/VF may benefit from adjunctive drug therapy. There are three main indications for antiarrhythmic drug therapy along with an ICD: to reduce the frequency of ventricular arrhythmias in patients with unacceptably frequent ICD therapies, to reduce the rate of VT so that it is better tolerated hemodynamically and more amenable to pace termination or low-energy cardioversion, and to suppress other arrhythmias (e.g., sinus tachycardia, AF, nonsustained VT) that cause symptoms or interfere with ICD function or cause inappropriate discharges.19,27
When ICD patients need drugs because of frequent shocks, the weight of evidence supports optimizing beta blocker therapy. When long-term antiarrhythmic therapy is required, amiodarone is the drug of choice. Sotalol is less effective than amiodarone and can cause torsades de pointes. Azimilide may be effective with fewer side effects (except torsades de pointes), but is not approved by the U.S. Food and Drug Administration or European authorities, and experience is limited. No comparative data for amiodarone and azimilide are available. For patients who cannot tolerate amiodarone or sotalol, dofetilide has been suggested as an alternative.27
[/not-level-membership-for-cardiovascular-category]
