[level-membership-for-pulmolory-and-respiratory-category]
Physiology of Ventilatory Support
After reading this chapter you will be able to:
 Discuss the pressures and pressure gradients that affect gas delivery during spontaneous breathing, negative pressure ventilation (NPV), and positive pressure ventilation (PPV).
 Identify the effects of mechanical ventilation on oxygenation, ventilation, and lung mechanics.
 Describe the currently available modes of mechanical ventilation.
 Discuss the indications and physiologic effect of positive end expiratory pressure (PEEP).
 Describe the cardiovascular effects of PPV and NPV.
 Describe the effects of PPV on other body systems.
 Identify and list the complications and hazards of providing mechanical ventilatory support.
 Discuss how to minimize adverse effects of mechanical ventilation.
Pressure and Pressure Gradients
For gas to flow through the airway, a pressure gradient must exist. The airways begin at the mouth and end at the alveoli, so mouth pressure (pressure at the airway opening [Pawo]) and alveolar pressure (Palv) are important in describing gas flow, as are intrapleural pressure (Ppl) and body surface pressure or atmospheric pressure (Pbs). In addition, intraabdominal pressure (Pab) affects the impact of Ppl change on diaphragm movement. Ppl is the pressure in the pleural space, the virtual space between the visceral and parietal pleurae, and is usually negative in relation to Palv. Figure 43-1 shows a graphic model of the respiratory system with these pressures identified as points in space. Mathematical models relating pressure, volume, and flow corresponding to this graphic model are constructed using pressure differences. The various components of the graphic model are defined as everything that exists between these points in space. The respiratory system is everything that exists between the airway opening and the body surface. The associated pressure difference is transrespiratory pressure (Ptr), defined as Pawo − Pbs. The components of transrespiratory pressure correspond to the components of the graphic model. The airways are represented by transairway pressure (Pta), defined as Pawo − Palv. The lungs are represented by the transalveolar pressure: (PL = Palv − Ppl). The chest wall is represented by trans–chest wall pressure: (Ptcw = Ppl − Pbs). If the lungs and chest wall are lumped together, they can be represented by transthoracic pressure: (Ptt = Palv − Pbs).
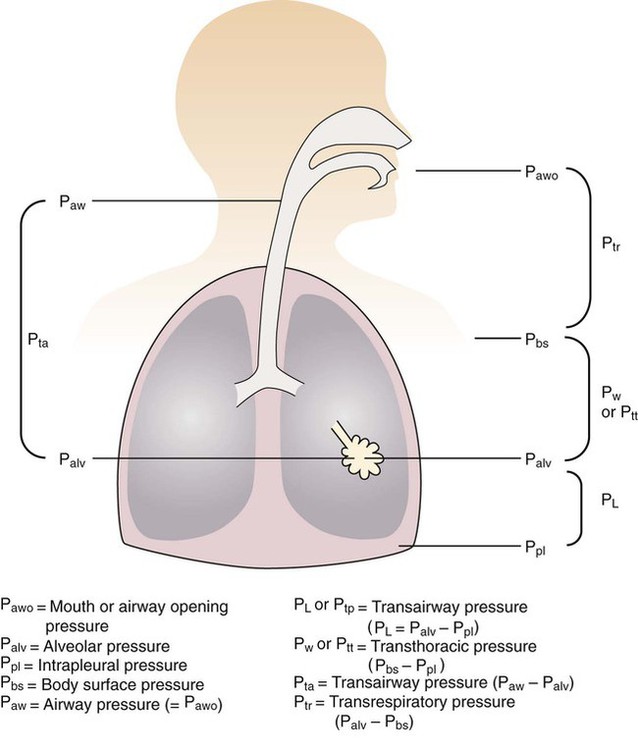
Another pressure gradient not defined in Figure 43-1 that also affects gas movement is the transdiaphragmatic pressure (Pdi). This pressure gradient is the difference between intraabdominal pressure and pleural pressure and affects diaphragmatic movement: (Ppl − Pab). Once these pressures and pressure gradients are understood, the differences between spontaneous ventilation, positive pressure ventilation (PPV), and negative pressure ventilation (NPV) become evident.
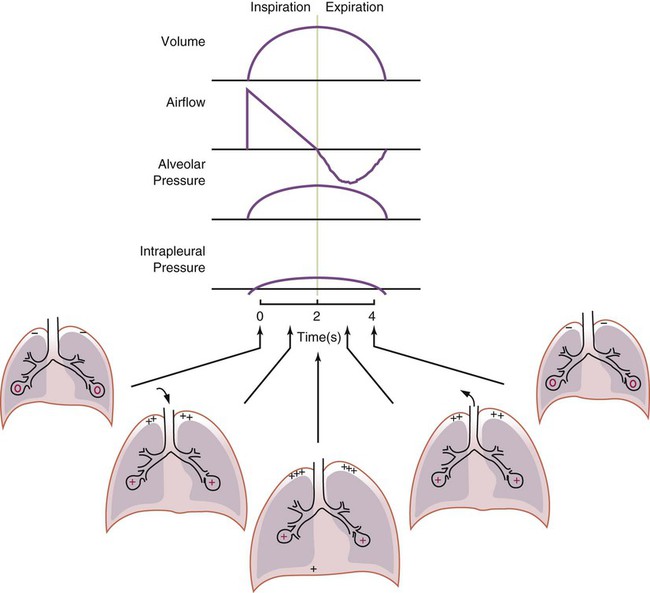
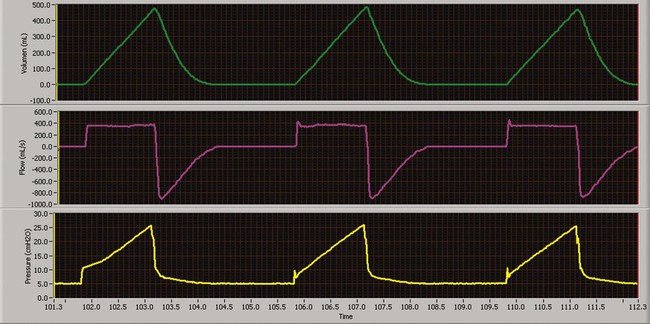
Airway, Alveolar, and Intrathoracic Pressure, Volume, and Flow During Spontaneous Ventilation
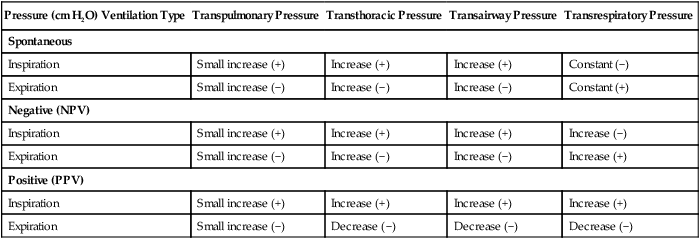
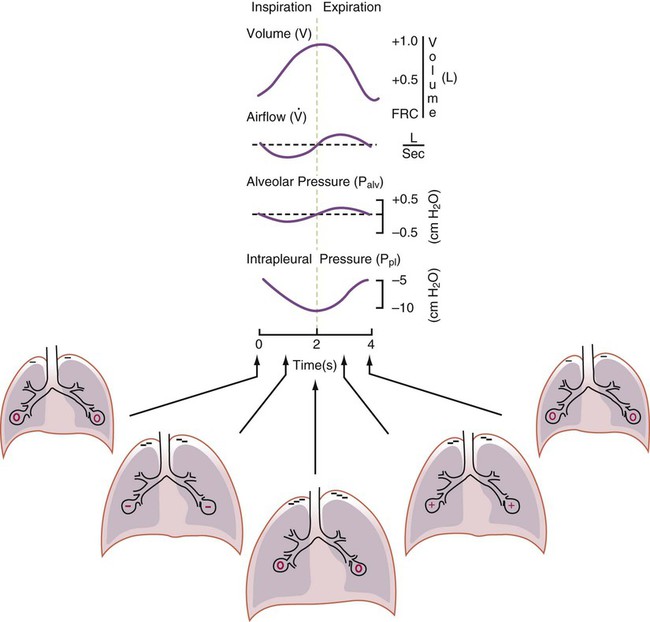
Spontaneous breathing is normally an autonomic phenomenon. In other words, we do not think about breathing; it is controlled by the autonomic nervous system. Not until our breathing is stressed do we consider the effort to breathe or the energy expended. At end-exhalation, intrapleural pressure is slightly negative. Alveolar, mouth, and body surface pressures are zero. The diaphragm contracts in response to stimulation of the phrenic nerve via the respiratory center in the medulla of the brain. When the diaphragm contracts, it descends into the abdominal cavity, decreasing intrapleural pressure. When intrapleural pressure becomes more negative, alveolar pressure becomes negative as well. The effects of spontaneous breathing on the pressure gradients are shown in Table 43-1. Under normal circumstances, a decrease in intrapleural pressure results in decreased alveolar pressure, increased transairway pressure, and inspiration of the tidal volume (VT) (Figure 43-2).
TABLE 43-1
Changes in Airway Pressure Gradients During Spontaneous, Negative, and Positive Pressure Ventilation
| Pressure (cm H2O) Ventilation Type | Transpulmonary Pressure | Transthoracic Pressure | Transairway Pressure | Transrespiratory Pressure |
| Spontaneous | ||||
| Inspiration | Small increase (+) | Increase (+) | Increase (+) | Constant (−) |
| Expiration | Small increase (−) | Increase (−) | Increase (−) | Constant (+) |
| Negative (NPV) | ||||
| Inspiration | Small increase (+) | Increase (+) | Increase (+) | Increase (−) |
| Expiration | Small increase (−) | Increase (−) | Increase (−) | Increase (+) |
| Positive (PPV) | ||||
| Inspiration | Small increase (+) | Increase (+) | Increase (+) | Increase (+) |
| Expiration | Small increase (−) | Decrease (−) | Decrease (−) | Decrease (−) |
VT and flow during spontaneous ventilation may be described by the equation of motion.1,2 The equation of motion describes the relationship between muscle pressure (analogous to pleural pressure in spontaneous breathing), compliance, resistance, flow, and volume as follows:
< ?xml:namespace prefix = "mml" />


Airway, Alveolar, and Intrathoracic Pressure, Volume, and Flow During Negative Pressure Mechanical Ventilation
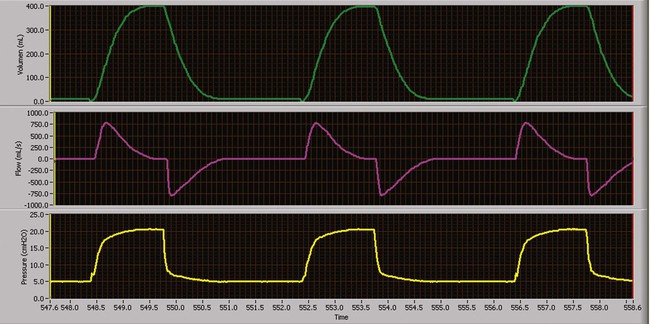
Mechanical NPV is similar to spontaneous breathing. NPV decreases pleural pressure (Ppl) during inspiration by exposing the chest to subatmospheric pressure. Negative pressure at the body surface (Pbs) is transmitted first to the pleural space and then to the alveoli (Palv). Because the airway opening remains exposed to atmospheric pressure during NPV, a transairway pressure gradient is created. Gas flows from the relatively high pressure at the airway opening (zero) to the relatively low pressure in the alveoli (negative). As with spontaneous breathing, alveolar expansion during NPV is determined by the magnitude of the transpulmonary pressure gradient. During expiration in both spontaneous breathing and NPV, the lungs and chest wall passively recoil to their resting end expiratory levels. As this recoil occurs, pleural pressure becomes less negative, and alveolar pressure increases above atmospheric pressure (Figure 43-3). This increase in alveolar pressure reverses the transairway pressure gradient. As Palv becomes greater than Pawo, gas flows from the alveoli to the airway opening. The effects of NPV on the pressure gradients are shown in Table 43-1.

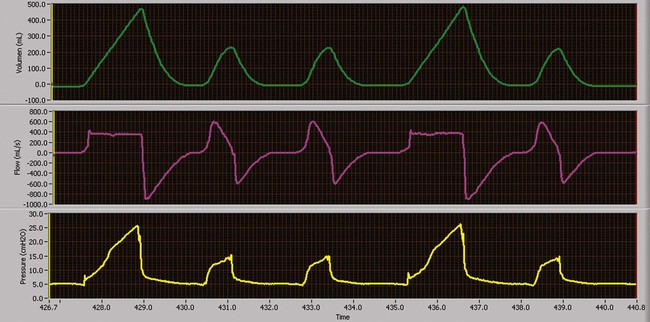
Airway, Alveolar, and Intrathoracic Pressure, Volume, and Flow During Positive Pressure Mechanical Ventilation
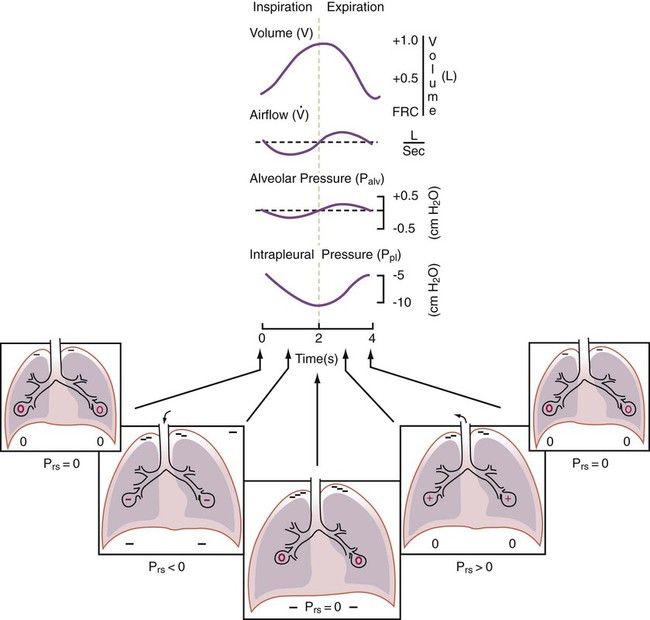
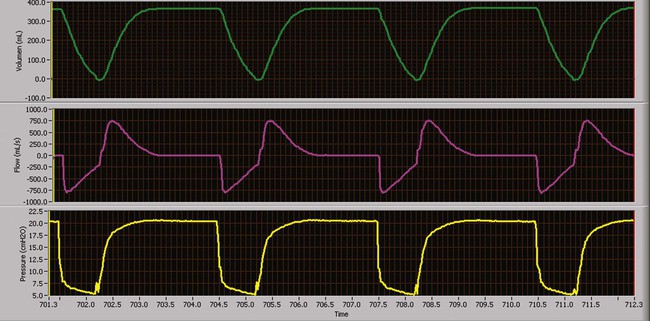
PPV causes air to flow into the lungs because of an increase in airway pressure, not a decrease in pleural pressure as occurs during spontaneous breathing and NPV (Figure 43-4). However, similar to spontaneous breathing and NPV, PPV causes an increase in Ptp, which allows gas to flow into the lungs. Gas flows into the lungs because pressure at the airway opening (Pawo) is positive, and alveolar pressure (Palv) is initially zero or less positive. Alveolar pressure rapidly increases during the inspiratory phase of PPV. The increased alveolar pressure expands the airways and alveoli. Because alveolar pressure is greater than pleural pressure (Ppl) during PPV, positive pressure is transmitted from the alveoli to the pleural space, causing pleural pressure to increase during inspiration. Depending on the compliance and resistance of the lungs, pleural pressure may markedly exceed atmospheric pressure during a portion of inspiration. These changes in pleural pressure during PPV can lead to significant physiologic changes (see later section). Pressure gradients during PPV are similar to pressure gradients during spontaneous breathing and NPV except that they are created by a positive pressure at the airway opening instead of a negative pressure in the pleural space (see Table 43-1). All pressure gradients change in the same direction as during NPV and spontaneous breathing except the transrespiratory pressure, which changes in the opposite direction.
Similar to spontaneous breathing, the recoil force of the lungs and chest wall, stored as potential energy during the positive pressure breath, causes passive exhalation. As gas flows from the alveoli to the airway opening, alveolar pressure decreases to atmospheric level, while pleural pressure is restored to its normal subatmospheric level (see Figure 43-4).
 Rule of Thumb
Effects of Mechanical Ventilation on Ventilation
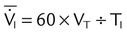
Increased Minute Ventilation
 ) is the product of tidal volume (VT) and ventilatory rate (f):
 Problem
 ) is inversely related to PaCO2 as defined by the following relationship:
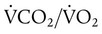
 is carbon dioxide (CO2) production.
 decreases or
  increases, PaCO2 increases, and hypercapnic respiratory failure follows; mechanical ventilation may be indicated in this setting. Because mechanical ventilation increases ventilation, PaCO2 can be decreased to the desired level depending on the total ventilatory rate.
Decreased Ventilation/Perfusion Ratio
Spontaneous ventilation results in gas distribution mainly to the dependent and peripheral zones of the lungs. PPV tends to reverse this normal pattern of gas distribution, and most of the delivered volume is directed to nondependent lung zones (Figure 43-5). This phenomenon is caused partly by the inactivity of the diaphragm and chest wall during PPV. Although these structures actively facilitate gas movement during spontaneous breathing, inactivity of these structures during PPV impedes ventilation to dependent lung zones. An increase in ventilation to the nondependent zones of the lung, where there is less perfusion, increases the ventilation/perfusion ( ) ratio, effectively increasing physiologic dead space. The increase in P(A − a)O2 often observed with PPV is caused by areas of low
  ratio.
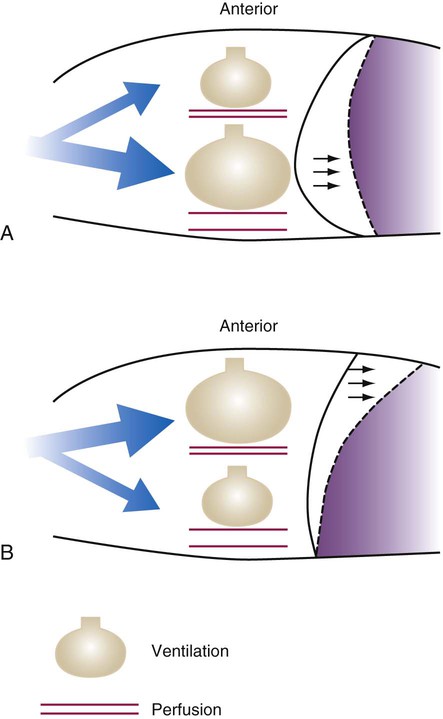
 ratio. Partly because of diaphragmatic inactivity, PPV reverses this normal pattern of gas distribution, and most delivered volume is directed to the upper lung zones. B, An increase in ventilation to the upper lung zones, where there is less perfusion, increases the
  ratio, effectively increasing physiologic dead space. At the same time, higher alveolar pressure in the better ventilated upper lung zones diverts blood flow away from these areas to the areas receiving the least ventilation. The result is areas of low
  ratio and impaired oxygenation.
  ratio in the bases and dependent lung zones mainly as a result of ventilation being primarily distributed to nondependent lung zones. The
  ratio is also decreased in nondependent lung zones because of the effect of PPV on perfusion. PPV can compress the pulmonary capillaries. This compression increases pulmonary vascular resistance and decreases perfusion. Minimal blood
  ratio in those areas and increases the P(A − a)O2.
 of 45 mm Hg. Under normal circumstances, CO2 moves out of the blood at the pulmonary capillary interface; the result is a PaCO2 of 40 mm Hg. In the event of a decrease in alveolar ventilation or an increase in CO2 production, PaCO2 increases. Mechanical ventilation can increase minute volume and alveolar ventilation and reduce P
 ratio. In emphysema, formation of bullae is coincident with the destruction of pulmonary capillaries; the result is large areas of poorly perfused but ventilated alveoli. Pulmonary emboli may completely occlude pulmonary vessels; the result is lack of perfusion to alveoli distal to the blockage.
Changes in Acid-Base Balance
 ) are inadequate to meet the needs of the body. Respiratory acidemia can occur when the VT is low, even though an accompanying mandatory rate is high.
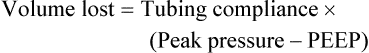
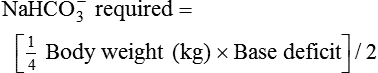
Bicarbonate has been used as therapy for metabolic acidosis. If it is administered, bicarbonate quickly combines with hydrogen ions and dissociates to form CO2 and water, a reaction that may increase WOB. Generally, bicarbonate administration is not recommended until acidosis is severe (pH < 7.2). When necessary, bicarbonate is administered according to the following formula:2
Metabolic alkalemia is defined as a normal PaCO2 with an elevated pH (>7.45) and an increased bicarbonate level (>26 mEq/L) and base excess (>+2 mEq/L). With metabolic alkalemia, in an effort to compensate for the increased pH, the patient tries to decrease minute ventilation. If weaning is attempted when the patient has a metabolic alkalemia, the patient may continue to hypoventilate, and weaning may fail. As with metabolic acidemia, the underlying cause should be determined and managed. Common causes of metabolic alkalosis include hypochloremia or hypokalemia secondary to gastrointestinal loss, diuretics, or steroid administration. See Chapter 13 for details on acid-base balance.
Effects of Mechanical Ventilation on Oxygenation
Increased Inspired Oxygen
 ratio or hypoventilation is more responsive to increased FiO2 than hypoxemia caused by a diffusion defect or shunt. Hypoxemia caused by hypoventilation responds well to an increase in FiO2, but alveolar ventilation can be restored only by improved ventilation. Hypoxemia caused by diffusion defect and shunt generally respond better to an increase in PEEP than to an increase in FiO2. The fact that PaO2 responds well to increased FiO2 generally indicates that a low
  ratio is the cause of hypoxemia. If the patient is receiving mechanical ventilation and has adequate alveolar ventilation, failure of the PaO2 to respond to increased FiO2 likely means that hypoxemia is due to a diffusion defect or shunt.
 ratio. In the event that PaO2 is not restored by an increase in FiO2, hypoxemia is probably due to a diffusion defect or shunt.
 ), normally 0.8.
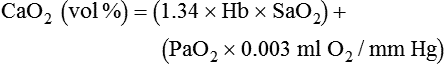
 matching and arterial oxygenation.
Increased Tissue Oxygen Delivery
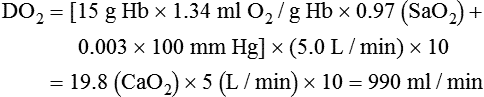
When a mechanical ventilator is used to improve arterial oxygenation by increasing FiO2 or PEEP, CaO2 increases. However, the increase in CaO2 represents only part of tissue O2 delivery because O2 delivery is defined by CaO2 and cardiac output, as follows:2
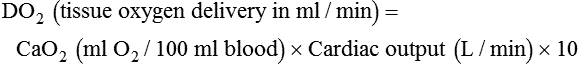
where 10 is a constant for converting deciliters to milliliters.
Normal tissue O2 delivery is approximately 990 ml/min because the normal CaO2 is approximately 20 vol%, and the normal cardiac output is approximately 5 L/min. When PaO2, CaO2, and cardiac output are adequate, so is tissue O2 delivery. When PEEP is needed to improve PaO2, it must be used cautiously because PEEP increases intrathoracic pressure. When intrathoracic pressure is increased, pleural pressure around the heart also increases, and the increase can affect the mechanical activity of the heart and impede venous return and decrease cardiac output. As discussed in Chapter 44, careful titration of PEEP must include monitoring the cardiovascular status of the patient. Optimal PEEP provides adequate arterial oxygenation and tissue O2 delivery.
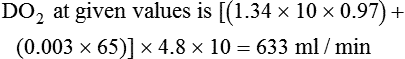
 Problem
Effects of Positive Pressure Mechanical Ventilation on Lung Mechanics
Time Constants
Asthma is very different from COPD, in which the inspiratory time constant is normal, but the expiratory time constant is long. In general, asthma requires very slow respiratory rates with longer than normal inspiratory and expiratory times to account for the altered time constants during both inspiration and expiration. Patients with COPD generally tolerate a more rapid rate because only the expiratory time constant is lengthened. In both of these situations, air trapping is very common because of the long time constants. In patients with COPD, inspiratory times are generally short (about 0.7 to 0.9 second). In patients with ARDS or acute lung injury (ALI), time constants are very short, and as a result inspiratory times can also be very short. Most patients with ARDS require an inspiratory time of only 0.5 to 0.6 second. Expiratory time constants are also short—hence the ability to ventilate these patients rapidly with small VT. Respiratory rates greater than 30 breaths/min are frequently well tolerated by patients with ARDS. The major concern with patients with ARDS and their short time constants is that any disruption of the airway rapidly results in loss of lung volume. Atelectasis occurs with disconnections from the ventilator of only 1 or 2 seconds. As a result, all patients with ARDS should be suctioned only with inline suction catheters, and any circuit disconnection should be avoided. Ventilator management in the care of patients with COPD, asthma, and ARDS is described in detail in Chapter 44.
Increased Pressure
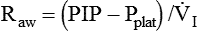
Plateau pressure (Pplat) is the pressure observed during a period of inflation hold or end inspiratory pause. To obtain a plateau pressure, the RT initiates an inspiratory pause time of 0.5 to 2.0 seconds. During inspiration, the peak pressure is reached and then immediately followed by the inspiratory pause. During the pause, pressure decreases to a pressure plateau. When a valid plateau pressure value is obtained, the inspiratory pause time is returned to zero. Plateau pressure represents the average peak alveolar pressure (Palv). In volume-controlled ventilation, plateau pressure is always lower than peak pressure because the peak pressure is the sum of the alveolar pressure and the pressure needed to overcome airway resistance. When flow is delivered by a square waveform, the difference between plateau pressure and peak pressure is the pressure necessary to overcome airway resistance. If the VT is divided by the difference between the plateau pressure and PEEP, the quotient is the quasistatic lung-thorax compliance:3

This value is referred to as the lung-thorax compliance because the compliance of the lungs and the compliance of the rib cage are being calculated as a unit. The lung compliance cannot be determined without the use of an esophageal balloon.3 Ideally, the volume lost owing to tubing compliance should be subtracted from the VT if the ventilator has not compensated for it, making the equation:3

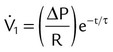
Airway resistance (Raw) during volume ventilation is estimated by the difference between PIP and Pplat divided by the inspiratory flow ( ) in L/sec, provided that the flow is constant (square waveform):3
During mechanical ventilation, the plateau pressure should be less than 30 cm H2O.4 At levels greater than 30 cm H2O, alveolar damage from overdistention is likely. This form of ventilator-induced lung injury (VILI) is referred to as volutrauma (see later). This trauma can result in air leakage from alveoli, the release of inflammatory mediators, and multisystem organ failure (MSOF). When the plateau pressure approaches 30 cm H2O during either volume or pressure ventilation, the pressure limit or the VT should be decreased. This approach to ventilation is referred to as lung protective ventilation.3
 Rule of Thumb
Mean Airway Pressure
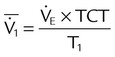
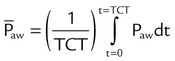
Mean airway pressure is the average pressure across the total cycle time (TCT). The mean airway pressure ( ) can be calculated manually if the flow is constant, as follows:3

Mean airway pressure is computed by the ventilator as the integral of the pressure signal over the total cycle time (as a rolling average), so the RT can record the ventilator computed value, rather than manually calculating it. Because expiratory (baseline) pressure is lower than inspiratory pressure, the mean pressure is between peak and end expiratory pressure. The variables affecting mean pleural and mean airway pressure are summarized in Box 43-1. For a given minute volume, partial ventilatory support modes such as synchronized intermittent mandatory ventilation (SIMV) result in lower mean airway and pleural pressures than continuous mandatory ventilation (CMV) modes. For a specific mandatory breath, as peak pressure increases, so does mean pressure. Likewise, long inspiratory times increase mean pressure. Prolonging expiratory time has the opposite effect on mean airway pressure. Generally, the harmful cardiovascular effects of PPV are more likely to occur when  or inspiratory-to-expiratory (I : E) ratio increases (e.g., >1 : 1).
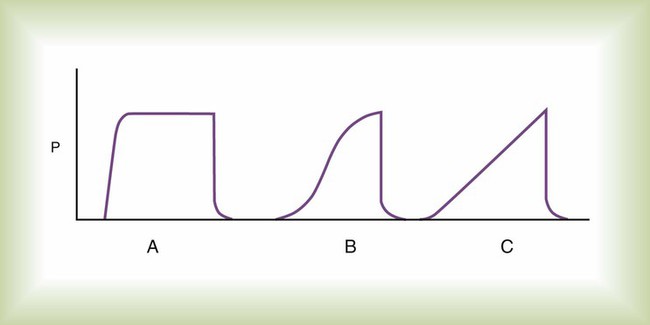
The pressure waveform of a mandatory breath affects mean pressure. In Figure 43-6, for a given inspiratory time, the constant pressure pattern (curve A) results in the greatest area under the airway pressure curve and the highest mean airway pressure. A constant pressure pattern is normally produced by a pressure targeted breath that provides decreasing (descending ramp) flow. The effect of PEEP on mean airway pressure is simple: Every 1 cm H2O of applied PEEP increases the mean airway pressure 1 cm H2O.
Effect of Peak Airway Pressure on Lung Recruitment
As peak airway pressure increases, previously collapsed, small, or fluid-filled alveoli are recruited, that is, reopened.5 This reopening of alveoli increases alveolar surface area and restores functional residual capacity (FRC). At the alveolar level, the surface area available for diffusion is increased. As a result, PaO2 increases, consistent with Fick’s law. The use of extrinsic PEEP maintains the airways and recruited open alveoli. Extrinsic PEEP is controlled directly by the PEEP control on the ventilator, and the RT always knows how much extrinsic PEEP is present. Several factors, including inverse ratio ventilation (IRV), may add intrinsic PEEP or auto-PEEP by starting the next breath before the previous exhalation has ended. The amount of intrinsic PEEP added by IRV can be measured by implementing an end expiratory pause, which stops the next breath from being delivered. During this end expiratory pause, alveolar and mouth pressures equilibrate, and the total PEEP is now presented by the ventilator. The amount of auto-PEEP present is the difference between the total PEEP and the extrinsic PEEP:

Increased Lung Volume: Tidal Volume
If pressure serves as the limit variable instead of the cycle variable, changes in airway resistance during pressure-limited ventilation may or may not affect delivered volume. In this case, the key factor is the time available for pressure equilibration. Volume can remain constant even if airway resistance increases, as long as there is sufficient time for alveolar and airway pressures to equilibrate. However, if insufficient time is available for pressure equilibration, delivered volume decreases as airway resistance increases. The length of time needed for pressure equilibration is usually at least three times greater than the time constant for the respiratory system. In pressure modes, ventilator-delivered flow varies with patient effort and lung mechanics; this tends to avoid patient-ventilator asynchrony.6
Increased Functional Residual Capacity
FRC is not known to change significantly with the application of PPV alone because passive exhalation allows the end expiratory pressure to return to atmospheric pressure with each breath. If an increase in FRC is to be achieved, end expiratory pressure must be increased. This increase is commonly achieved with PEEP or CPAP. PEEP or CPAP does not recruit collapsed lung units but prevents lung units that have been opened from collapsing at end expiration. Peak airway pressure recruits lung volume. The magnitude of the increase in FRC sustained by PEEP or CPAP is proportional to the lung-thorax compliance. With acute restriction, as PEEP is increased, lung compliance improves. Initially, FRC gain as PEEP is added is small. However, as FRC and compliance increase, additional increments of PEEP tend to result in larger increases in FRC up to the point at which overdistention occurs. At that point, as PEEP is increased, increases in FRC decline, as does compliance. There is no practical way of measuring FRC in all patients, so other methods of determining an increase in FRC are used, such as improving PaO2 at a constant FiO2, increasing PaO2/FiO2 ratio, decreasing shunt fraction, or decreasing FiO2 while maintaining PaO2. The management of PEEP is described in more detail in Chapter 44.
Pressure-Volume Curve and Lung Recruitment in Acute Respiratory Distress Syndrome
Figure 43-7 depicts the pressure-volume (P-V) relationship of the lung-thorax in an idealized patient with ARDS.7 On the inflation P-V curve, there are two points of inflection: the lower inflection point referred to as Pflex or lower corner pressure, and an upper inflection point, also referred to as upper corner pressure. These two points represent defined changes in compliance. The lower inflection point represents an abrupt increase in lung-thorax compliance as collapsed or atelectatic lung begins to be recruited.8 The upper deflection points represent the point where the rate of lung recruitment decreases and overinflation begins. It is most important to realize from this graph that the lung is recruited by pressure and that the higher the peak airway pressure, the greater the potential for lung to be recruited. The maximum pressure needed to recruit a given patient’s lung is unknown; however, pressures up to 50 cm H2O most likely are safe with most patients when applied for short (1 to 3 minutes) periods.9–11 If these pressures were applied for longer periods, lung injury would most likely result.
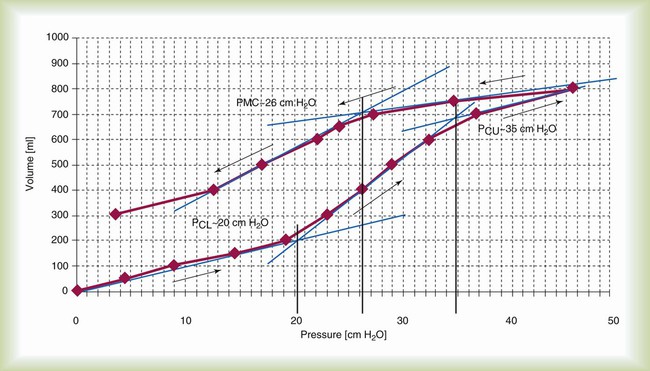
The deflation limb of the P-V curve is similar in shape to the inflation limb but is separated from the inflation limb. This hysteresis (separation) is a result of surfactant and surface tension interactions. Basically, less pressure is required to keep the lung open on the deflation limb of the P-V curve than on the inflation limb; this is obvious on examination of the volume maintained in the lung at Pflex, or 20 cm H2O. On the inflation limb, lung volume increases about 200 ml at 20 cm H2O, but on the deflation limb, lung volume increases about 550 ml. The goal of an open lung approach to ventilation that has been proposed by many authors is to open the lung and then to ventilate the patient on the deflation limb of the P-V curve.9–11
Figure 43-7 is an idealized P-V curve; actual patient P-V curves in ARDS are not as well defined. In 10% to 20% of patients with ARDS, Pflex cannot be identified on the inflation P-V curve. As a result, despite two positive randomized controlled trials using Pflex to set PEEP,12,13 the use of P-V curves clinically has not become common practice; a second reason for this is the difficulty measuring the P-V curve. However, many newer ICU ventilators are including algorithms that allow P-V curves to be performed by the ventilator with the ventilator identifying Pflex. This option may increase the use of the P-V curve for the management of patients with ARDS.
An approach to setting PEEP that has been proposed more recently in association with an open lung approach to ARDS management is a decremental PEEP trial immediately after a lung recruitment maneuver (RM).11,12,14 Many different approaches to performing lung RMs have been published, but the approach that is considered the safest and most efficacious is the use of pressure-controlled continuous mandatory ventilation (PV-CMV).11,12,14 To perform a lung RM with PC-CMV, high enough PEEP must be set to avoid derecruitment after each inspiration. Essentially, a minimum of 20 cm H2O PEEP is required during the RM. Peak pressure is usually started at 40 cm H2O, and if the patient tolerates the pressure hemodynamically, it may be increased to 50 cm H2O (Box 43-2). Inspiratory time is increased to about 1.5 to 2.0 seconds, and respiratory rate is decreased to about 15 to 20 breaths/min. The maneuver is applied for 1 to 3 minutes. During the RM, the patient must be sedated to apnea to avoid fighting the ventilator.
After an RM, the best way to identify the minimum effective PEEP level that maintains the lung open is to perform a decremental PEEP trial.11,12,14 This trial is performed by changing the mode from PC-CMV to volume-controlled continuous mandatory ventilation (VC-CMV), VT 4 to 6 ml/kg, inspiratory time 1.0 second or less, PEEP 20 cm H2O, and rate set at the maximum that does not cause auto-PEEP.7 After stabilization (3 to 5 minutes), dynamic compliance is measured.7 PEEP is then decreased 2 cm H2O, the patient is stabilized (3 to 5 minutes), and measurement of dynamic compliance is repeated; this is continued until the PEEP level at which the compliance decreases is identified. Generally, compliance at 20 cm H2O PEEP is low, and it increases as PEEP is decreased; compliance then decreases as PEEP is decreased further. Open lung PEEP is the PEEP associated with the highest compliance. Set PEEP is open lung PEEP plus 2 cm H2O.
 Rule of Thumb
Increased Dead Space
The dead space fraction is increased with the institution of mechanical ventilation owing to inspiratory mechanical bronchodilation and the preferential ventilation of more apical, nondependent alveoli, the reduction of blood flow away from ventilated alveoli and the continued perfusion of basilar or dependent alveoli (see Figure 43-5). This increase is concurrent with a decrease in  ratio.
Decreased Work of Breathing
Mode, trigger setting, and inspiratory flow have an effect on WOB. WOB consists of two components: (1) ventilator work (WOBvent) occurring as the ventilator forces gas into the lungs and (2) patient work (WOBpt) as the inspiratory muscles draw gas into the lungs. The magnitude of WOBpt depends on compliance, resistance, and ventilatory drive and on ventilator variables, such as trigger sensitivity, peak flow, cycling coordination, and VT.15,16
Regardless whether flow or pressure triggering is selected, either should always be set as sensitive as possible without causing autotriggering. The less sensitive the setting, the greater the patient effort. In older generation ventilators, flow triggering was shown to require less effort than pressure triggering.17 However, with the newest generation of ICU ventilators, both are equally effective.
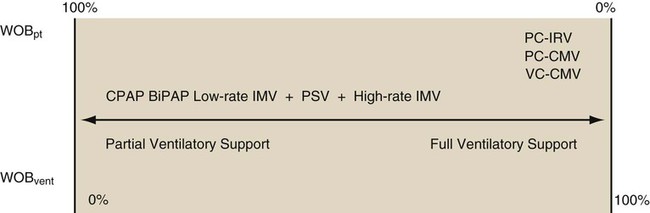
As described in Chapter 42, a mode of ventilation is a ventilatory pattern that can be described by identifying the control variable, breath sequence, and targeting scheme. The breath sequence may be thought of as being on a continuum from assuming very little to assuming all WOB (Figure 43-8). As the breath sequence is changed from continuous spontaneous ventilation (CSV) to CMV, the ventilator assumes more WOB. An example of this transition would be from CPAP to pressure support to IMV to CMV. In CPAP, a continuous spontaneous mode of ventilation, the patient assumes all WOB. The ventilator merely provides positive pressure throughout the patient’s breathing cycle. The ventilator assumes more WOB during IMV and CMV. Pressure support is also an example of CSV. During pressure support ventilation (PSV), the patient determines breath timing (length of inspiration and expiration) and frequency. Depending on the set inspiratory pressure, the clinician may program the ventilator to provide a minimal to a maximal amount of WOB. In instances where the patient has no spontaneous efforts, all breaths during IMV or CMV are time triggered, and all work performed is WOBvent. This situation commonly occurs when the diaphragmatic paralysis occurs as a result of pharmacologic intervention (sedation or paralysis), disease state (Guillain-Barré syndrome), or trauma (spinal cord injury). Although it may be advantageous for the ventilator to assume all WOB for a while, extended periods of passive ventilation may cause diaphragmatic atrophy, which may unnecessarily prolong the need for mechanical ventilation and delay weaning. At initiation of patient-triggered pressure or volume modes, WOBpt resumes. With volume ventilation, this work is primarily associated with triggering the ventilator and inspiring the VT at the set inspiratory flow. If the sensitivity, VT, and inspiratory flow are set appropriately, WOBpt is small. If flow or VT are set too low, patient-ventilator asynchrony often occurs, and increased WOBpt results.
During assisted ventilation, pressure-targeted modes are generally more capable of meeting patient ventilatory demands and minimizing WOBpt.18 As pressure level is increased, ventilatory muscles are unloaded, VT increases for a given amount of patient effort, and WOBpt decreases. Most clinicians increase pressure level until the breathing pattern approaches normal—that is, until the spontaneous ventilatory rate is 15 to 25 breaths/min and the spontaneous VT is normal (5 to 8 ml/kg).
Measuring WOB is technically difficult. It is often accomplished by esophageal balloon monitoring, in which a balloon is placed in the distal third of the esophagus, and a pneumotachometer is attached to the airway. WOB is the integral of the esophageal pressure and VT. Normal WOB is 0.6 to 0.8 J/L. One approach to pressure-controlled ventilation is titration of the inspiratory pressure level on the basis of measured WOB. If work is greater than 0.8 J/L, pressure is increased until work decreases to within normal limits (unloading the muscles of ventilation). If work is less than 0.6 J/L, pressure is decreased until work increases to within normal limits (loading the muscles of ventilation). Although it may be useful to titrate pressure level to WOBpt,19 bedside measurement of WOB is rarely performed because it is technically difficult to perform. Respiratory rate, frequency, use of accessory muscles, airway pressure waveform, and patients’ answers to questions about their breathing comfort help the RT determine whether WOBpt is excessive.
Minimizing Adverse Pulmonary Effects of Positive Pressure Mechanical Ventilation
Decreasing Pressure
 Problem
Plateau pressure reflects mean maximum alveolar pressure. Plateau pressures of 30 cm H2O or greater have an increased likelihood of causing lung injury. If plateau pressure approaches 30 cm H2O during volume ventilation, the VT should be decreased so that the plateau pressure is less than 30 cm H2O, or with pressure ventilation, target pressure should be set less than 30 cm H2O.4,20
Positive End Expiratory Pressure or Continuous Positive Airway Pressure
PEEP is the application of positive pressure at end exhalation. PEEP is used primarily to improve oxygenation in patients with refractory hypoxemia. As a rule, refractory hypoxemia exists when PaO2 cannot be maintained at greater than 50 to 60 mm Hg with FiO2 0.60 or greater. PEEP improves oxygenation in these patients by maintaining alveoli open, restoring FRC, and decreasing physiologic shunting. The improved alveolar volume provided by PEEP allows a lower FiO2. Other values such as lung compliance, shunt fraction, and PaO2/FiO2 ratio also may improve when PEEP is appropriately applied. PEEP may be indicated in the care of patients with COPD who have dynamic hyperinflation (auto-PEEP).21,22 (See discussion later in this chapter.)
Beneficial and harmful effects are associated with the use of PEEP (Table 43-2). Detrimental effects of inappropriately high levels of PEEP include decreased cardiac output, increased pulmonary vascular resistance, and increased dead space. When one or more of these problems occur, PEEP is decreased to the previous level or to a value between the current level and the previous level. If cardiac output decreases and an increase in PEEP is necessary to maintain oxygenation, intravenous fluid, inotropic cardiac drugs, or both are administered to restore cardiac output.
TABLE 43-2
Physiologic Effects of Positive End Expiratory Pressure
| Beneficial Effects of Appropriate PEEP | Detrimental Effects of Inappropriate PEEP |
| Restored FRC, avoids derecruitment | Increased pulmonary vascular resistance |
| Decreased shunt fraction | Potential decrease in venous return and cardiac output |
| Increased lung compliance | Decreased renal and portal blood flow |
| Decreased WOB | Increased ICP |
| Increased PaO2 for a given FiO2 | Increased dead space |
PEEP is contraindicated in the presence of a tension pneumothorax. PEEP should be applied cautiously in patients with severe unilateral lung disease because PEEP would overinflate the lung with higher compliance. The result is lung overdistention and compression of adjacent pulmonary capillaries. Independent lung ventilation can be used to apply separate inspiratory and baseline pressures to the right and the left lung when severe unilateral lung disease is present.23 PEEP is contraindicated in the care of patients with increased ICP only if the application of PEEP increases ICP further.
 Rule of Thumb
Effects of Ventilatory Pattern
The most commonly used inspiratory flow patterns are constant or square and descending ramp during volume-controlled ventilation and exponential decay during pressure-controlled ventilation. In mechanical and computer models, a descending ramp (volume-controlled ventilation) flow pattern improves gas distribution to lung units with long-time constants. The literature often refers to the descending ramp as a decelerating flow pattern. Similar findings in humans have been reported. Compared with a square flow waveform, a descending ramp has been shown to reduce peak pressure, inspiratory work, VD/VT, and P(a − a)O2 without affecting hemodynamic values.24 Compared with volume-controlled ventilation with a square flow waveform, pressure-controlled ventilation with an exponential decay flow waveform may result in a higher PaO2, lower PaCO2, and lower PIPs. However, mean airway pressure is higher with pressure-controlled ventilation compared with volume-controlled ventilation because pressure increases to the set inspiratory pressure and remains constant throughout inspiration. During pressure-controlled ventilation, flow is responsive to patient demand. The ventilator delivers flow to the patient in proportion to patient need. Flow is also greater at the onset of inspiration, resulting in VT delivery at a time when the lungs are most compliant, the beginning of the breath. As a breath ends, flow is least, and the volume delivered is small. The result is a lower peak airway pressure for any given VT.
In most spontaneously breathing persons, lower inspiratory flows improve gas distribution. However, during PPV, low inspiratory flow may lead to lengthy inspiratory times and air trapping if expiratory time is too short. High ventilator inspiratory flow allows more time for exhalation and reduces the incidence of air trapping. Avoidance of air trapping improves gas exchange and reduces WOB in patients with high ventilatory demands.16,25
Trigger Site and Work of Breathing
Studies have examined the effects of sensing a patient’s inspiratory effort at the tip of the endotracheal tube rather than in the ventilator circuit, as is done with all ventilators. Triggering and managing gas delivery by measurement of pressure at the tip of the endotracheal tube decreases patient effort and improves synchrony; however, no practical system has been designed.26 In addition, the efficiency of ventilator flow and pressure triggering seems to improve with each new generation of mechanical ventilator.
Physiologic Effects of Ventilatory Modes
Volume-Controlled Ventilation versus Pressure-Controlled Ventilation
Figure 42-5 (see p. 1012) illustrates the important variables for volume ventilation modes. The figure shows that the primary variable to be controlled is the patient’s minute ventilation. A particular ventilator may allow the operator to set minute ventilation directly. More frequently, minute ventilation is adjusted by means of a set VT and frequency. VT is a function of the set inspiratory flow and the set inspiratory time. Inspiratory time is affected by the set frequency and, if applicable, the set I : E ratio. The mathematical relationships among all these variables are shown in Table 43-3.
TABLE 43-3
| Mode | Parameter | Symbol | Equation |
| Volume-controlled | Tidal volume (L) | VT |  |
 |
|||
| Mean inspiratory flow (L/min) |  |
 |
|
 |
|||
| Pressure-controlled | Tidal volume (L) | VT | VT = ΔP × C × (1 − e−t/τ) |
| Instantaneous inspiratory flow (L/min) |  |
 |
|
| Pressure gradient (cm H2O) | ΔP | ΔP = PIP − PEEP | |
| Both modes | Exhaled minute ventilation (L/min) |  |
 |
| Total cycle time or ventilatory period (sec) | TCT | TCT = TI + TE = 60 ÷ f | |
| I : E ratio | I : E | 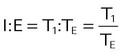 |
|
| Time constant (sec) | τ | τ = R × C | |
| Resistance (cm H2O/L/sec) | R |  |
|
| Compliance (L/cm H2O) | C |  |
|
| Elastance | E |  |
|
| Mean airway pressure (cm H2O) |  |
 |
|
| Primary variables | Pressure (cm H2O) | P | |
| Volume (L) | V | ||
| Flow (cm H2O/L/sec) |  |
||
| Time (sec) | τ | ||
| Inspiratory time (sec) | TI | ||
| Expiratory time (sec) | TE | ||
| Frequency (breaths/min) | f | ||
| Base of natural logarithm (≈2.72) | e |
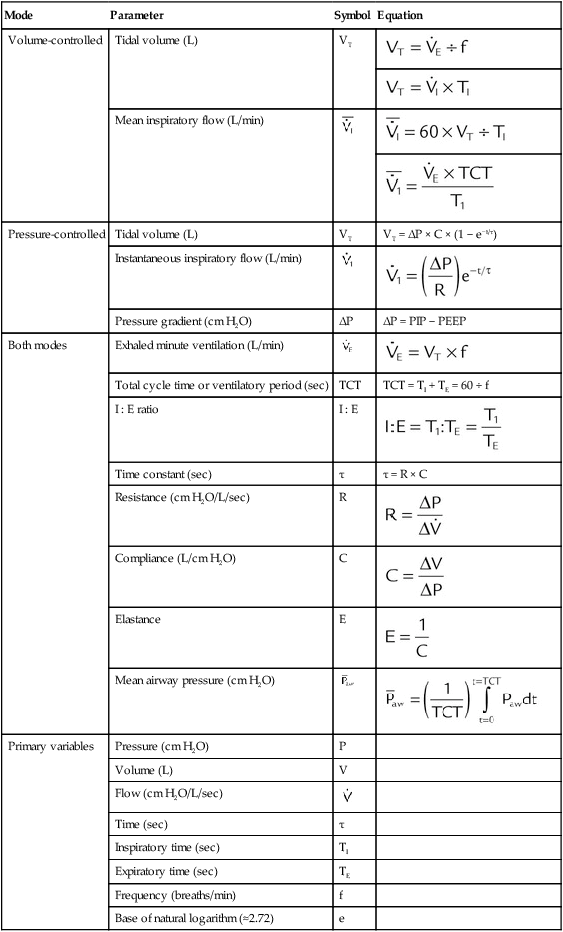
With pressure-controlled ventilation, the goal is also to maintain adequate minute ventilation. However (as the equation of motion shows), when pressure is controlled, VT and minute ventilation are determined not only by the ventilator’s pressure settings but also by the elastance and resistance of the patient’s respiratory system. Minute ventilation and hence gas exchange are less stable in pressure-controlled modes than in volume-controlled modes. Figure 42-6 (see p. 1014) shows the important variables for pressure-controlled ventilation. VT is not operator set on the ventilator. It is the result of the set inspiratory pressure, the patient’s lung mechanics, and the inspiratory time. On most ventilators, the speed with which inspiratory pressure is achieved (i.e., the pressure rise time) is adjustable. That adjustment affects the shape of the pressure waveform and the mean airway pressure.
Continuous Mandatory Ventilation
Volume-Controlled Continuous Mandatory Ventilation
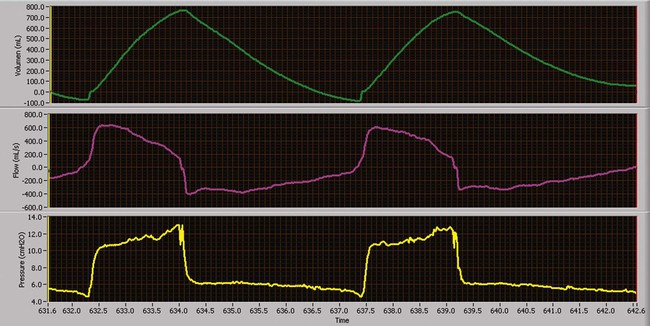
Volume-controlled continuous mandatory ventilation (VC-CMV) is indicated when a precise minute ventilation or blood gas parameter, such as PaCO2, is therapeutically essential to the care of patients.25 Theoretically, volume control (with a constant inspiratory flow) (Figure 43-9) results in a more even distribution of ventilation (compared with pressure control) among lung units with different time constants where the units have equal resistances but unequal compliances (e.g., ARDS).26
Pressure-Controlled Continuous Mandatory Ventilation
Similar to VC-CMV, pressure-controlled continuous mandatory ventilation (CMV) can be used as a basic mode of ventilatory support. The primary difference between volume-controlled and pressure-controlled ventilation is the control variable with which the clinician is most concerned.27,28 Theoretically, pressure control (with a constant inspiratory pressure) (Figure 43-10) results in a more even distribution of ventilation (compared with volume control) among lung units with different time constants when units have equal compliances but unequal resistances (e.g., status asthmaticus).26 The instability of VT caused by airway leaks can be minimized by using pressure-controlled rather than volume-controlled ventilation. Increased VT stability may lead to better gas exchange and lower risk of pulmonary volutrauma.29
Use of a rectangular pressure waveform opens alveoli earlier in the inspiratory phase during PC-CMV and results in a higher mean airway pressure than VC-CMV with a rectangular flow waveform, allowing more time for oxygenation to occur.30 In PC-CMV, however, inspiratory flow is not a parameter set by the clinician. It is variable and dependent on patient effort and lung mechanics, improving patient comfort and patient-ventilator synchrony. However, as lung mechanics or patient effort or both change, volume delivery (VT and minute ventilation) changes, leading to poor control of blood gases.
Because VT is not directly controlled, the pressure gradient (PIP − PEEP) is the primary parameter used to alter the breath size and CO2 tensions. Typically, PIP is adjusted to provide the patient with a VT within the desired range. PIPs may be adjusted to achieve target VT.31 As with VC-CMV, the mandatory breath rate set by the clinician depends on the presence of ventilatory muscle activity and the severity of lung disease. When higher mandatory breath rates are needed (>30 breaths/min), it is essential for the clinician to provide a sufficient expiratory time and prevent air trapping.
As long as lung mechanics and patient effort remain constant, the volume and peak flow delivered to the patient remain unchanged.32 When a decrease in patient effort, decrease in compliance, or increase in resistance occurs, less volume is delivered for the preset pressure for each breath. Conversely, improvements in patient effort and mechanics can dramatically increase the volume delivery to the patient in this mode. Close VT monitoring is required to avoid ventilator-induced hyperventilation or hypoventilation.
Example
The patient’s cardiac index and O2 consumption should be closely monitored as well. Higher mean airway pressures may impair cardiac output. In addition, PC-CMV with IRV can lead to the development of auto-PEEP, which can impair venous return, compromise O2 delivery to the tissues, and result in marked air trapping.33
Pressure-Controlled Inverse Ratio Ventilation
PC-CMV may be used to accomplish pressure-controlled inverse ratio ventilation (PC-IRV), by increasing the inspiratory time directly or by increasing the I : E ratio to the desired value. PC-IRV is defined as pressure-controlled ventilation with an I : E ratio greater than 1 : 1 (Figure 43-11). With PC-IRV, mean airway pressure increases as the I : E ratio increases. Pressure-controlled IRV has been suggested for severe hypoxemia when high FiO2 and high PEEP have failed to improve oxygenation in ALI/ARDS. Because alveoli affected by ALI/ARDS have short time constants, more time is allotted for inspiration, and less time is allotted for expiration. The result is intrinsic PEEP and the maintenance of numerous alveoli open, improving arterial oxygenation.26 Although some studies have shown improvement in oxygenation with PC-IRV versus CMV with PEEP, others have shown concurrent decreases in cardiac output.27,34 Generally, if applied PEEP in normal ratio ventilation is equal to total PEEP (applied and intrinsic PEEP) in PC-IRV, the oxygenation benefits are equivalent without the marked depression in cardiac output.
Mini Clini
Using Pressure-Controlled Ventilation
 Problem
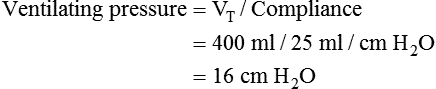
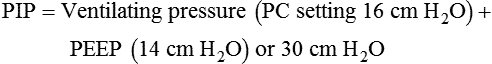
Initial ventilator setting would be as follows:
1. Calculate the patient’s respiratory system compliance:
2. Calculate the pressure limit in PC-CMV mode to achieve the target VT. Because the pressure limit is measured relative to PEEP on this ventilator, the equation is:
 Problem
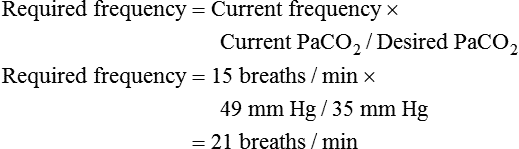
Intermittent Mandatory Ventilation
As a partial support mode, IMV allows or requires the patient to sustain some WOB. The level of mechanical support needed depends on the specific physiologic process causing the need for mechanical ventilation, presence or degree of ventilatory muscle weakness, and presence and severity of lung disease. In this mode, mandatory breaths are delivered at a set rate. Between the mandatory breaths, the patient can breathe spontaneously at his or her own VT and rate (Figure 43-12). Breaths can occur separately (e.g., IMV); breaths can be superimposed on each other (e.g., spontaneous breaths superimposed on mandatory breaths, as in bilevel positive airway pressure [bilevel PAP] or airway pressure release ventilation [APRV]); or mandatory breaths can be superimposed on spontaneous breaths, as in high-frequency ventilation administered during spontaneous breathing. Spontaneous breaths may be assisted (e.g., PSV) (Figure 43-13) or unassisted (e.g., PEEP or CPAP).
When the mandatory breath is patient-triggered, modern-day ventilators deliver the mandatory breath in synchrony with the patient’s inspiratory effort. If no spontaneous efforts occur, the ventilator delivers a time-triggered breath. This delivery is generally much more comfortable for the patient, and it is largely attributed to developments in ventilator design. Because spontaneous breaths decrease pleural pressure, ventilatory support with IMV usually results in a lower mean intrathoracic pressure than CMV, which can result in a higher cardiac output.35
When used to wean a patient from mechanical ventilation, the intent of IMV is to provide respiratory muscle rest during the mandatory breaths and exercise during spontaneous breaths. However, studies have shown that IMV weaning prolongs the duration of mechanical ventilation compared with PSV and spontaneous breathing trials.36,37
Volume-Controlled Intermittent Mandatory Ventilation
Volume-controlled intermittent mandatory ventilation (VC-IMV) has been advocated for patients with relatively normal lung function recovering from sedation or rapidly reversing respiratory failure.38 However, the use of IMV has greatly decreased over the years in favor of VC-CMV, PC-CMV, and PSV.
Example
VC-IMV is usually selected for patients with neuromuscular disorders, such as Guillain-Barré syndrome. Typically, normal lung function and an intact ventilatory drive characterize these patients. As the disease progresses, ascending muscle weakness eventually affects the patient’s ventilatory muscles. Mechanical ventilation is considered when it is difficult for the patient to sustain VT and minute ventilation. The degree of support depends on the patient’s inherent muscle strength. Large VT (8 to 10 ml/kg) and high peak flow (>80 L/min) may be needed to alleviate dyspnea and maximize patient comfort.39 As respiratory muscle function improves, mandatory breath support can be reduced.
Pressure-Controlled Intermittent Mandatory Ventilation
Pressure-controlled intermittent mandatory ventilation (PC-IMV) is indicated when preservation of the patient’s spontaneous efforts is important and patient-ventilatory synchrony is a concern.40 PC-IMV has been traditionally associated with mechanical ventilation of infants not only because of their oxygenation problems but also because traditionally it had been difficult to control VT at such small values.41
Airway Pressure Release Ventilation
A mode related to both PC-IRV and PC-IMV is APRV, in which the patient breathes spontaneously throughout periods of high and low applied CPAP (Figure 43-14).42 APRV intermittently decreases or “releases” the airway pressure from an upper pressure (Phigh) or CPAP level to a lower pressure (Plow) or CPAP level. The pressure release usually lasts about 0.2 to 1.5 seconds depending on whether or not air trapping is desired. In Figure 43-14, inspiratory time is longer than expiratory time, and spontaneous breaths are superimposed on this mandatory pattern of pressurization and release. Spontaneous breaths are supplemented by PSV. This is a feature of APRV available on some ventilators, where APRV is referred to as bilevel ventilation. In APRV, the I : E ratio is usually greater than 1 : 1, which is similar to PC-IRV, but APRV offers the advantage of allowing spontaneous breathing throughout the periods of inspiratory and expiratory positive pressure. Spontaneous breathing offers the benefits of lung recruitment, and improved ventilation of dependent lung zones, resulting in improved  matching with decreased shunt.43
APRV also provides ventilation and oxygenation without adversely affecting hemodynamic values because of the periodic reductions in intrathoracic pressure during the spontaneous breaths. Because patients receiving APRV are breathing spontaneously, less sedation is needed than during PC-IRV. In addition, peak airway pressure during APRV may be less than with VC-IRV for comparable oxygenation and ventilation.44 In one study, VC-IRV was compared with APRV in patients with ALI. During APRV, peak airway pressure and venous admixture were lower than during VC-IRV, a finding that indicated progressive alveolar recruitment.45 In a review of APRV in patients with ALI/ARDS by Fan and Stewart,46 results of studies comparing APRV with conventional volume-controlled or pressure-controlled SIMV showed that with APRV there was a decrease in peak airway pressures, improved hemodynamics, and a decreased need for vasopressor and intropic support. However, the cost of these potential benefits is patient effort, and WOB is markedly increased during APRV. There are no data to indicate a better outcome with APRV than with other approaches to ventilatory support when a similar approach to managing oxygenation is used.
Continuous Spontaneous Ventilation
PSV (pressure-controlled continuous spontaneous ventilation [PC-CSV]) is indicated in any spontaneously breathing patient with an intact ventilatory drive, especially if patient-ventilator synchrony is a problem during CMV. As with all spontaneous breathing modes, PSV also improves or stabilizes oxygenation by reducing alveolar derecruitment in intubated patients who do not require full ventilatory support.46,47
CPAP provides no ventilatory assist or inspiratory muscle unloading (other than possibly improving lung compliance). Rather, it improves or stabilizes oxygenation by reducing alveolar derecruitment in patients who do not require ventilatory support. CPAP also reduces abnormalities in gas exchange that can be associated with the presence of an artificial airway in patients requiring no assisted mechanical ventilatory support. Low levels of CPAP (3 to 5 cm H2O) maintain physiologic PEEP and prevent alveolar collapse at end expiration.47
PAV and NAVA are very similar modes of ventilation.48 In both modes, pressure, flow, volume, and time are not set, and each mode augments patient effort by performing a defined proportion of total WOB (PAV) or providing a defined number of cm H2O pressure assist for each microvolt of diaphragmatic electrical activity (NAVA). The primary differences between the two modes are that NAVA requires the placement of a specially designed nasogastric tube with built-in electromyographic (EMG) electrodes, and NAVA can unload the work associated with air trapping and auto-PEEP, whereas PAV cannot because its measurements are based on airway pressure, flow, and volume.
If CPAP levels are set inappropriately high, alveolar overdistention and air trapping rather than alveolar recruitment result.49 In addition to deleterious pulmonary effects, circulatory impairment may result from a decrease in left ventricular stroke volume. The reduction in cardiac output and arterial blood pressure also hinders adequate O2 delivery.50
Continuous Positive Airway Pressure
CPAP is spontaneous breathing at an elevated baseline pressure (Figure 43-15). Breaths are patient-triggered and cycled. VT depends on patient effort and lung mechanics. CPAP increases alveolar pressure and maintains alveoli open. In contrast to NPV and PPV, airway pressure with CPAP is theoretically constant (baseline pressure ±2 cm H2O) throughout the respiratory cycle. Because airway pressure does not change, CPAP does not provide ventilation. For gas to move into the lungs during CPAP, the patient must create a spontaneous transairway pressure gradient. Although NPV and PPV produce the pressure gradients needed for gas flow into the lungs, CPAP maintains alveoli at greater inflation volume, restoring FRC. An important physiologic feature of CPAP is that as alveoli are maintained open, FiO2 needed to maintain adequate PaO2 may decrease. Oxygenation becomes more efficient at any given FiO2, as measured by PaO2/FiO2 ratio and shunt fraction. The potential side effects associated with PPV also exist for CPAP but usually to a lesser degree.
Pressure Support Ventilation
PSV is a form of PC-CSV that assists the patient’s inspiratory efforts (Figure 43-16). At very low levels of support, this mode unloads WOB the ventilator circuitry imposes on the respiratory muscles.51 If the level of support is maximized, the ventilator may assume all WOB.52 The result of high levels of support is a reduction in the respiratory rate, reduction in respiratory muscle activity and fatigue, reduction in O2 consumption, and improvement or stabilization of spontaneous VT.53,54 However, the positive attributes of this mode of ventilation can be negated if ventilator parameters are not properly set. The ventilator must be able to detect spontaneous patient effort. It is critical for the clinician to adjust the trigger sensitivity correctly. Of equal importance is the clinician-set rise time, the time required for the ventilator to reach the inspiratory pressure limit, and termination criteria, the minimal flow resulting in cycling to exhalation. Ventilator graphics are often helpful when adjusting these parameters and optimizing patient-ventilator synchrony.
Regardless of the level of support provided, the patient has primary control over the breath rate and inspiratory time and flow rate delivered during this mode of assisted ventilation. PSV is designed to provide assisted ventilation with pressure as the only control variable. In addition, PSV overcomes airway resistance caused by an endotracheal tube, secretions, bronchospasm, or other imposed mechanical resistance. Regardless of the pressure support level provided, the patient has primary control over the breathing frequency, inspiratory time, and flow. The VT resulting from a PSV breath depends on the preset pressure level, patient effort, and mechanical forces opposing ventilation (lung–chest wall compliance and airway resistance). Of all of the classic modes of ventilation, PSV exerts the least control over the patient’s ventilatory pattern and as a result should improve patient-ventilator synchrony. Since the first description of PSV in 1982, it has been used either to overcome the imposed resistance associated with the artificial airway or to provide ventilatory support with minimal control.55 PSV is useful in any patient with an intact ventilatory drive and a stable ventilatory demand.
Bilevel PAP (BiPAP; Respironics, Inc, Murrysville, PA) is simply PSV with PEEP applied noninvasively.56 With bilevel PAP, inspiratory positive airway pressure (or PSV) and expiratory positive airway pressure (PEEP) are set. The duration of inspiratory positive airway pressure and expiratory positive airway pressure can be independently adjusted to set the I : E ratio. Although it was originally developed to enhance the capabilities of home CPAP systems used for management of obstructive sleep apnea, bilevel PAP has been successfully used in the home and the hospital for noninvasive ventilatory support of patients with acute and chronic respiratory failure.57
Example
An example of the use of PC-CSV is noninvasive PSV and PEEP in the management of a patient with COPD in an acute exacerbation. As described in detail in Chapter 45, PSV has been shown in this setting to decrease the frequency of intubation, length of mechanical ventilation, development of ventilator-associated pneumonia, and patient mortality.
Proportional Assist Ventilation

where Pmusc is pressure generated by the respiratory muscles, Pappl is pressure applied by the ventilator, and E and R are elastic and resistance properties of the respiratory system. Assuming that E and R are linear during inspiration, the instantaneous flow and volume to be delivered are proportional to the resistive and elastic WOB. The ventilator continuously measures the instantaneous flow and volume and periodically measures the E and R. Using this information, the ventilator software adjusts gas delivery by estimating Pmusc and assisting Pmusc in a proportional manner. The patient is the determinant of the ventilatory pattern. Patients are given the freedom to select a ventilatory pattern that is rapid and shallow or slow and deep. If the patient desires a small VT, a low level of pressure is applied, and if a large VT is desired, a high pressure is applied. The ventilator does not force any control variable except the unloading of E and R in a proportional manner. See Chapter 42 for details on operation of PAV.
Numerous studies have evaluated the effect of PAV during noninvasive PPV.58–62 Most of these comparisons were between PAV and PSV,58,62 and in almost all of these comparisons the patients evaluated had chronic respiratory failure and were in an acute exacerbation. Patients managed with PAV had a lower refusal rate, had a more rapid reduction in respiratory rate, and developed fewer complications.60,61 In these studies, gas exchange and respiratory pattern did not differ between PSV and PAV, but the patients ventilated with PAV were more comfortable. PAV has also been shown to be essentially equivalent to PSV in stable patients with chronic ventilatory failure59 and in patients with acute cardiogenic pulmonary edema.62
PAV has been most widely studied during invasive mechanical ventilation.63–65 As with the evaluation of PAV in other settings, most of the comparisons focused on the physiologic response observed when PSV is changed to PAV. Generally, during invasive ventilation, the change from PSV to PAV results in lower VT, more rapid respiratory rate, lower peak airway pressure, and lower mean airway pressure without significant changes in gas exchange or hemodynamics.66–68 Ranieri and colleagues63 and Grasso and associates64 were unable to identify a difference in patients’ work and effort between PSV and PAV as ventilatory load was increased. The best long-term evaluation of PAV versus PSV randomly assigned the application of each for a 48-hour period in a series of critically ill patients.65 The percentage of patients’ failing the transition to PAV or PSV differed (P = .04): 11% failing PAV versus 22% failing PSV. In addition, the proportion of patients developing asynchrony was greater with PSV versus PAV (29% vs. 5.6%, P < .001). The primary reason for the asynchrony was missed triggers. This difference was a result of PSV forcing a larger VT causing air trapping and preventing normal triggering. Trigger synchrony is generally better in PAV because a large VT is not forced on the patient. The current data on PAV indicates it can sustain the same patients as PSV—patients who can breathe spontaneously and manage their ventilator drive normally.
Neurally Adjusted Ventilatory Assist
Colombo and coworkers69 matched the setting during NAVA and PSV by adjusting both to produce a VT of 6 to 8 ml/kg. These investigators compared the two modes at these settings and setting 50% higher and 50% lower. At the initial and lowest setting, they found no differences in gas exchange, ventilatory pattern, ventilatory assistance, or respiratory drive between the modes. At the highest setting, VT significantly increased, and ventilator response rate and peak diaphragmatic EMG activity significantly decreased during PSV resulting in air trapping and cycling asynchrony. The asynchrony index was greater than 10% in five of the six patients studied during PSV and 0.0% in all patients during NAVA even at the highest settings. Sgahija and coworkers70 reported similar finding in a series of 12 patients with an acute exacerbation of COPD. The asynchrony index was 23% ± 12% of breaths during PSV but only 7% ± 2% during NAVA (P < .05). The authors cited air trapping as the cause of the cycling asynchrony during PSV.
The effect of PEEP titration during NAVA was reported by Passath and colleagues71 in a series of 20 patients (only 1 with ARDS). These investigators titrated PEEP level up and down evaluating its effect on respiratory drive. They found that at adequate NAVA levels increasing PEEP reduced ventilatory drive and that monitoring VT divided by diaphragmatic EMG activity during PEEP changes identified the PEEP level at which tidal breathing occurred at a minimal EMG activity cost.
NAVA application in neonates results in similar outcomes as observed in adults.72,73 After the change to NAVA, VT tends to decrease, respiratory rate to increase, and peak diaphragmatic EMG activity to decrease. In addition, despite the open ventilating system (uncuffed artificial airway), triggering and cycling were still primarily neurally activated. Beck and associates72 reported no significant difference between triggering and cycling delays during invasive and noninvasive application of NAVA in 936-g, 26-week neonates. In a series of 21 mechanically ventilated children 2 days to 15 years old, Bengtsson and Edberg73 noted that neural triggering occurred 68% of the time, and neural cycling occurred 88% of the time.
Automatic Tube Compensation
ATC is similar to the flow assist aspect of PAV but considers only the resistance of the endotracheal tube.74 ATC is an adjunct that automatically adjusts the airway pressure to compensate for endotracheal tube resistance to gas flow by maintaining tracheal pressure constant at the baseline level.74 The goal is to eliminate WOB imposed by the endotracheal tube. In ATC, the RT inputs into the ventilator the type and size of artificial airway (endotracheal tube or tracheostomy tube) and the percent compensation desired (10% to 100%). The ventilator continuously measures flow and calculates the amount of pressure needed to overcome the resistance of the airway (pressure = resistance × flow). As a result, the greater the inspiratory demand, the greater the pressure applied. Pressure varies throughout the breath.
ATC may be applied during inspiration (positive airway pressure) or during both inspiration and expiration (negative airway pressure). However, expiratory ATC may result in early airway closure and increased air trapping. ATC has been referred to as electronic extubation, meaning that if the airway pressure is low during inspiration (5 to 7 cm H2O), it is simply overcoming the resistance of the endotracheal tube with a normal inspiratory effort.75 Consequently, many clinicians consider this an indication that spontaneous ventilation can be maintained without ventilatory support and the patient should be considered for extubation. Although in theory the use of ATC to wean patients appears ideal, no data to date have indicated that ATC weans patients faster than T-piece trials.
Adaptive Modes and Dual Control
The first adaptive control/dual control mode was described by Amato and colleagues.76 Their major finding was that the ventilatory workload imposed on the inspiratory muscles during volume-assured PSV was significantly reduced by the use of dual control. In this mode, pressure support is combined with volume control. However, this benefit was due to the fact that inspiration started out in pressure support and stayed there unless the VT target was not met. The improvement was mostly a result of the improved synchrony between the patient and the machine. These investigators did not show a specific benefit of the actual dual nature of the mode (i.e., switching from pressure support to volume control), and no evidence has been published in the literature since then supporting this mode. Anecdotal reports indicate that it is difficult to adjust pressure, volume, and flow settings to make the mode work properly, in particular, if the mechanical properties of the patient’s respiratory system are changing rapidly.
The patient-ventilator interaction is monitored on a breath-by-breath basis. If the patient’s lung compliance improves (or patient effort increases), the ventilator delivers subsequent mandatory breaths at a lower pressure level to maintain the target VT. This adjustment by the ventilator reduces the risk of alveolar overdistention and volutrauma. Conversely, the ventilator responds to worsening pulmonary compliance (or decreasing patient effort) by increasing the pressure limit until the VT is achieved. The ventilator makes pressure level changes in small increments, 1 to 3 cm H2O per breath, and does not exceed the maximum pressure limit set by the clinician. These automatic ventilator responses to changes in a patient’s lung mechanics minimize the risk of ventilator-induced hyperventilation or hypoventilation. The desired outcome is a stable or consistent minute ventilation and enhanced patient comfort. However, the major problem with these modes is that the ventilator cannot distinguish between the patient improving and heightened levels of ventilator demand. If patient demand results in a larger VT, the ventilator ventilates less.77
In most ventilators, pressure can be decreased all the way to the PEEP level. This situation can lead to ventilatory failure.75 Both RPVC and VS should be used very cautiously in all patients with a normal or increased ventilatory demand. Randomized comparison between these modes and other, more traditional, modes failed to show any outcome benefit.78,79
Example
PRVC or VS has been used in infants with respiratory distress syndrome.80 Rapidly changing pulmonary mechanics from surfactant administration are associated with complications such as pulmonary air leaks, intraventricular hemorrhage, and bronchopulmonary dysplasia. These adaptive modes respond to changes in a patient’s lung mechanics and may reduce the incidence of these common complications.
Adaptive support ventilation (ASV), or PC-IMV, is an example of optimal control in adaptive ventilation. Adaptive support ventilation is a pressure-targeted mode that optimizes the relationship between VT and respiratory frequency based on lung mechanics as predicted by Otis.81 ASV uses a pressure ventilation format establishing a ventilatory pattern that minimizes WOB and auto-PEEP, while limiting peak airway pressure. In this regard, ASV is similar to PC-CMV and PRVC in its gas delivery format. It differs from PC-CMV and PRVC by its additional algorithmic control of the ventilatory pattern.82 ASV automatically determines the VT and respiratory rate that best maintains the peak pressure below the target level.83 The clinician inputs the patient’s ideal body weight, high pressure limit, PEEP, FiO2, inspiratory rise time, flow cycle percentage, and percentage of predicted minute volume desired. The ventilator periodically measures dynamic compliance and the respiratory time constant and determines the desired mandatory rate. Ideal body weight is used by the ventilator to calculate the minute volume, which is divided by the rate for determination of VT.84
Tassaux and associates85 compared VC-IMV with ASV in patients with respiratory failure of various causes. They concluded that ASV decreased inspiratory load and improved patient-ventilator synchrony. Sulzer and coworkers86 showed that ASV resulted in a shorter duration of intubation than VC-IMV in postoperative cardiac patients with no complications. More recently, Belliato and colleagues87 compared PC-IMV (optimal) in ventilated patients with acute respiratory failure, ventilated patients with chronic respiratory failure, and ventilated patients with normal lungs and in a physical lung model. Their results showed that the ventilator was able to differentiate between these types of patients and select appropriate settings. Using a lung model, Sulemanji and coworkers89 determined that ASV could provide better lung protection than a fixed VT of 6 ml/kg ideal body weight. ASV control has been adapted to respond to end-tidal CO2 levels.89 This new adaptation allows specific algorithms to be selected based on patient diagnosis: ARDS, COPD, brain injury, or healthy lung. This mode is the most sophisticated of the closed loop control modes available on ICU ventilators at the present time. However, additional study is needed to determine fully the type of patient in whom ASV is most useful. Current data would indicate ASV works very well in patients under controlled approaches to ventilatory support, but additional data in spontaneously ventilated patients are needed before it can be recommended in these patients.
 Rule of Thumb
Patient Positioning to Optimize Oxygenation and Ventilation
Patients receiving mechanical ventilation are turned frequently, usually at least every 2 hours, unless turning is contraindicated. Kinetic beds continually rotate patients and are designed to help prevent atelectasis, hypoxemia, secretion retention, and pressure sores. When patients are kept immobile, pooling of secretions in dependent lung zones can promote nosocomial pneumonia, and shrinking of dependent alveoli leads to decreases in ventilation and hypoxemia. However, the use of rotating kinetic beds is controversial in the prevention of nosocomial pneumonia.90 No data are available to indicate that these very expensive beds improve patient outcome.
 ratio in the affected lung contributes to venous admixture and hypoxemia. However, if the patient is rotated so that the good lung is in the dependent position, these relationships are reversed. With the good lung down, blood flows to well-ventilated alveoli, and
  matching and arterial blood gas values improve. An added benefit of this maneuver is that the affected lung is placed in a postural drainage position, which promotes gravity drainage of retained secretions so that they can be removed.
A similar phenomenon has been described in ARDS. In a supine patient with ARDS, alveoli in the bases and posterior segments become atelectatic. Shunt increases, and the patient requires a high FiO2 and PEEP for adequate oxygenation. If the patient is rotated into the prone position, several mechanisms have been proposed to improve oxygenation.91 Blood flow is redistributed to areas that are better ventilated. This redistribution improves  relationships. Prone positioning removes the weight of the heart from its position over the lungs while the patient is supine. Pleural pressure in the now nondependent collapsed lung becomes more negative, improving alveolar recruitment. In addition, the stomach no longer lies over the dependent basilar posterior segments of the lower lobes.
In a review of 20 randomized clinical studies comprising 297 patients referred to as a “meta-analysis,” Curley92 found that oxygenation improved within 2 hours in 69% of cases, and improvements were cumulative and persistent. However, factors predictive of patients’ responses were inconsistent, and patients’ initial responses were not predictive of long-term response. An improvement in PaO2 of 10 mm Hg within 30 minutes seemed to differentiate responders from nonresponders. However, patient positioning is not without complications. Several persons are needed to “flip” the patient while ensuring monitoring lines and catheters are not disrupted and the patient is not inadvertently extubated. Wound dehiscence, facial or upper chest wall necrosis despite extensive padding, cardiac arrest immediately after movement to the prone position, dependent edema of the face, and corneal abrasion have been reported.93 A meta-analysis of existing randomized controlled trials indicated no outcome benefit from prone positioning in patients with ARDS.94 However, this meta-analysis also found that patients with PaO2/FiO2 less than 100 mm Hg were the group most likely to benefit from prone positioning. Considering the complications associated with prone positioning, only patients with very severe hypoxemia (PaO2/FiO2 < 100 mm Hg) should be placed prone.
 Rule of Thumb
 relationships. Prone positioning is indicated only if the PaO2/FiO2 is less than 100 mm Hg. When positioning the patient, great care should be taken to avoid the hazards associated with prone positioning.
[/level-membership-for-pulmolory-and-respiratory-category][not-level-membership-for-pulmolory-and-respiratory-category]
Physiology of Ventilatory Support
After reading this chapter you will be able to:
Discuss the pressures and pressure gradients that affect gas delivery during spontaneous breathing, negative pressure ventilation (NPV), and positive pressure ventilation (PPV).
Identify the effects of mechanical ventilation on oxygenation, ventilation, and lung mechanics.
Describe the currently available modes of mechanical ventilation.
Discuss the indications and physiologic effect of positive end expiratory pressure (PEEP).
Describe the cardiovascular effects of PPV and NPV.
Describe the effects of PPV on other body systems.
Identify and list the complications and hazards of providing mechanical ventilatory support.
Discuss how to minimize adverse effects of mechanical ventilation.
Pressure and Pressure Gradients
For gas to flow through the airway, a pressure gradient must exist. The airways begin at the mouth and end at the alveoli, so mouth pressure (pressure at the airway opening [Pawo]) and alveolar pressure (Palv) are important in describing gas flow, as are intrapleural pressure (Ppl) and body surface pressure or atmospheric pressure (Pbs). In addition, intraabdominal pressure (Pab) affects the impact of Ppl change on diaphragm movement. Ppl is the pressure in the pleural space, the virtual space between the visceral and parietal pleurae, and is usually negative in relation to Palv. Figure 43-1 shows a graphic model of the respiratory system with these pressures identified as points in space. Mathematical models relating pressure, volume, and flow corresponding to this graphic model are constructed using pressure differences. The various components of the graphic model are defined as everything that exists between these points in space. The respiratory system is everything that exists between the airway opening and the body surface. The associated pressure difference is transrespiratory pressure (Ptr), defined as Pawo − Pbs. The components of transrespiratory pressure correspond to the components of the graphic model. The airways are represented by transairway pressure (Pta), defined as Pawo − Palv. The lungs are represented by the transalveolar pressure: (PL = Palv − Ppl). The chest wall is represented by trans–chest wall pressure: (Ptcw = Ppl − Pbs). If the lungs and chest wall are lumped together, they can be represented by transthoracic pressure: (Ptt = Palv − Pbs).
Another pressure gradient not defined in Figure 43-1 that also affects gas movement is the transdiaphragmatic pressure (Pdi). This pressure gradient is the difference between intraabdominal pressure and pleural pressure and affects diaphragmatic movement: (Ppl − Pab). Once these pressures and pressure gradients are understood, the differences between spontaneous ventilation, positive pressure ventilation (PPV), and negative pressure ventilation (NPV) become evident.
Airway, Alveolar, and Intrathoracic Pressure, Volume, and Flow During Spontaneous Ventilation
Spontaneous breathing is normally an autonomic phenomenon. In other words, we do not think about breathing; it is controlled by the autonomic nervous system. Not until our breathing is stressed do we consider the effort to breathe or the energy expended. At end-exhalation, intrapleural pressure is slightly negative. Alveolar, mouth, and body surface pressures are zero. The diaphragm contracts in response to stimulation of the phrenic nerve via the respiratory center in the medulla of the brain. When the diaphragm contracts, it descends into the abdominal cavity, decreasing intrapleural pressure. When intrapleural pressure becomes more negative, alveolar pressure becomes negative as well. The effects of spontaneous breathing on the pressure gradients are shown in Table 43-1. Under normal circumstances, a decrease in intrapleural pressure results in decreased alveolar pressure, increased transairway pressure, and inspiration of the tidal volume (VT) (Figure 43-2).
TABLE 43-1
Changes in Airway Pressure Gradients During Spontaneous, Negative, and Positive Pressure Ventilation
| Pressure (cm H2O) Ventilation Type | Transpulmonary Pressure | Transthoracic Pressure | Transairway Pressure | Transrespiratory Pressure |
| Spontaneous | ||||
| Inspiration | Small increase (+) | Increase (+) | Increase (+) | Constant (−) |
| Expiration | Small increase (−) | Increase (−) | Increase (−) | Constant (+) |
| Negative (NPV) | ||||
| Inspiration | Small increase (+) | Increase (+) | Increase (+) | Increase (−) |
| Expiration | Small increase (−) | Increase (−) | Increase (−) | Increase (+) |
| Positive (PPV) | ||||
| Inspiration | Small increase (+) | Increase (+) | Increase (+) | Increase (+) |
| Expiration | Small increase (−) | Decrease (−) | Decrease (−) | Decrease (−) |
VT and flow during spontaneous ventilation may be described by the equation of motion.1,2 The equation of motion describes the relationship between muscle pressure (analogous to pleural pressure in spontaneous breathing), compliance, resistance, flow, and volume as follows:
< ?xml:namespace prefix = "mml" />
Airway, Alveolar, and Intrathoracic Pressure, Volume, and Flow During Negative Pressure Mechanical Ventilation
Mechanical NPV is similar to spontaneous breathing. NPV decreases pleural pressure (Ppl) during inspiration by exposing the chest to subatmospheric pressure. Negative pressure at the body surface (Pbs) is transmitted first to the pleural space and then to the alveoli (Palv). Because the airway opening remains exposed to atmospheric pressure during NPV, a transairway pressure gradient is created. Gas flows from the relatively high pressure at the airway opening (zero) to the relatively low pressure in the alveoli (negative). As with spontaneous breathing, alveolar expansion during NPV is determined by the magnitude of the transpulmonary pressure gradient. During expiration in both spontaneous breathing and NPV, the lungs and chest wall passively recoil to their resting end expiratory levels. As this recoil occurs, pleural pressure becomes less negative, and alveolar pressure increases above atmospheric pressure (Figure 43-3). This increase in alveolar pressure reverses the transairway pressure gradient. As Palv becomes greater than Pawo, gas flows from the alveoli to the airway opening. The effects of NPV on the pressure gradients are shown in Table 43-1.
Airway, Alveolar, and Intrathoracic Pressure, Volume, and Flow During Positive Pressure Mechanical Ventilation
PPV causes air to flow into the lungs because of an increase in airway pressure, not a decrease in pleural pressure as occurs during spontaneous breathing and NPV (Figure 43-4). However, similar to spontaneous breathing and NPV, PPV causes an increase in Ptp, which allows gas to flow into the lungs. Gas flows into the lungs because pressure at the airway opening (Pawo) is positive, and alveolar pressure (Palv) is initially zero or less positive. Alveolar pressure rapidly increases during the inspiratory phase of PPV. The increased alveolar pressure expands the airways and alveoli. Because alveolar pressure is greater than pleural pressure (Ppl) during PPV, positive pressure is transmitted from the alveoli to the pleural space, causing pleural pressure to increase during inspiration. Depending on the compliance and resistance of the lungs, pleural pressure may markedly exceed atmospheric pressure during a portion of inspiration. These changes in pleural pressure during PPV can lead to significant physiologic changes (see later section). Pressure gradients during PPV are similar to pressure gradients during spontaneous breathing and NPV except that they are created by a positive pressure at the airway opening instead of a negative pressure in the pleural space (see Table 43-1). All pressure gradients change in the same direction as during NPV and spontaneous breathing except the transrespiratory pressure, which changes in the opposite direction.
Similar to spontaneous breathing, the recoil force of the lungs and chest wall, stored as potential energy during the positive pressure breath, causes passive exhalation. As gas flows from the alveoli to the airway opening, alveolar pressure decreases to atmospheric level, while pleural pressure is restored to its normal subatmospheric level (see Figure 43-4).
Effects of Mechanical Ventilation on Ventilation
Increased Minute Ventilation
Decreased Ventilation/Perfusion Ratio
Spontaneous ventilation results in gas distribution mainly to the dependent and peripheral zones of the lungs. PPV tends to reverse this normal pattern of gas distribution, and most of the delivered volume is directed to nondependent lung zones (Figure 43-5). This phenomenon is caused partly by the inactivity of the diaphragm and chest wall during PPV. Although these structures actively facilitate gas movement during spontaneous breathing, inactivity of these structures during PPV impedes ventilation to dependent lung zones. An increase in ventilation to the nondependent zones of the lung, where there is less perfusion, increases the ventilation/perfusion () ratio, effectively increasing physiologic dead space. The increase in P(A − a)O2 often observed with PPV is caused by areas of low ratio.
Changes in Acid-Base Balance
Bicarbonate has been used as therapy for metabolic acidosis. If it is administered, bicarbonate quickly combines with hydrogen ions and dissociates to form CO2 and water, a reaction that may increase WOB. Generally, bicarbonate administration is not recommended until acidosis is severe (pH < 7.2). When necessary, bicarbonate is administered according to the following formula:2
Metabolic alkalemia is defined as a normal PaCO2 with an elevated pH (>7.45) and an increased bicarbonate level (>26 mEq/L) and base excess (>+2 mEq/L). With metabolic alkalemia, in an effort to compensate for the increased pH, the patient tries to decrease minute ventilation. If weaning is attempted when the patient has a metabolic alkalemia, the patient may continue to hypoventilate, and weaning may fail. As with metabolic acidemia, the underlying cause should be determined and managed. Common causes of metabolic alkalosis include hypochloremia or hypokalemia secondary to gastrointestinal loss, diuretics, or steroid administration. See Chapter 13 for details on acid-base balance.
Effects of Mechanical Ventilation on Oxygenation
Increased Inspired Oxygen
Increased Tissue Oxygen Delivery
When a mechanical ventilator is used to improve arterial oxygenation by increasing FiO2 or PEEP, CaO2 increases. However, the increase in CaO2 represents only part of tissue O2 delivery because O2 delivery is defined by CaO2 and cardiac output, as follows:2
where 10 is a constant for converting deciliters to milliliters.
Normal tissue O2 delivery is approximately 990 ml/min because the normal CaO2 is approximately 20 vol%, and the normal cardiac output is approximately 5 L/min. When PaO2, CaO2, and cardiac output are adequate, so is tissue O2 delivery. When PEEP is needed to improve PaO2, it must be used cautiously because PEEP increases intrathoracic pressure. When intrathoracic pressure is increased, pleural pressure around the heart also increases, and the increase can affect the mechanical activity of the heart and impede venous return and decrease cardiac output. As discussed in Chapter 44, careful titration of PEEP must include monitoring the cardiovascular status of the patient. Optimal PEEP provides adequate arterial oxygenation and tissue O2 delivery.
