Chapter 5 Physiology of the Airway
I Normal Respiratory Physiology (Nonanesthetized)
A Gravity-Determined Distribution of Perfusion and Ventilation
1 Distribution of Pulmonary Perfusion
Contraction of the right ventricle imparts kinetic energy to the blood in the main pulmonary artery. As this energy is dissipated in climbing a vertical hydrostatic gradient, the absolute pressure in the pulmonary artery (Ppa) decreases by 1 cm H2O per centimeter of vertical distance up the lung (Fig. 5-1). At some height above the heart, Ppa becomes zero (i.e., equal to atmospheric pressure), and still higher in the lung, Ppa becomes negative.1 In this region, then, alveolar pressure (PA) exceeds Ppa and pulmonary venous pressure (Ppv), which is very negative at this vertical height. Because the pressure outside the vessels is greater than the pressure inside the vessels, the vessels in this region of the lung are collapsed, and no blood flow occurs; this is known as zone 1 (PA > Ppa > Ppv). Because there is no blood flow, no gas exchange is possible, and the region functions as alveolar dead space, or wasted ventilation. Little or no zone 1 exists in the lung under normal conditions,2 but the amount of zone 1 lung may be greatly increased if Ppa is reduced, as in oligemic shock, or if PA is increased, as in the application of excessively large tidal volumes (VT) or levels of positive end-expiratory pressure (PEEP) during positive-pressure ventilation.
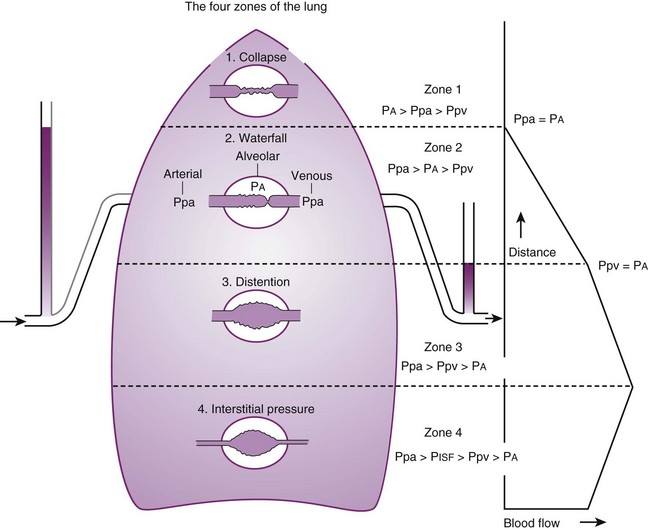
Further down the lung, absolute Ppa becomes positive, and blood flow begins when Ppa exceeds PA (zone 2, Ppa > PA > Ppv). At this vertical level in the lung, PA exceeds Ppv, and blood flow is determined by the mean Ppa − PA difference rather than by the more conventional Ppa − Ppv difference (see later discussion).3 In zone 2, the relationship between blood flow and alveolar pressure has the same physical characteristics as a waterfall flowing over a dam. The height of the upstream river (before reaching the dam) is equivalent to Ppa, and the height of the dam is equivalent to PA. The rate of water flow over the dam is proportional to only the difference between the height of the upstream river and the dam (Ppa − PA), and it does not matter how far below the dam the downstream riverbed (Ppv) is. This phenomenon has various names, including the waterfall, Starling resistor, weir (dam made by beavers), and sluice effect. Because mean Ppa increases down this region of the lung but mean PA is relatively constant, the mean driving pressure (Ppa − PA) increases linearly, and therefore mean blood flow increases linearly as one descends down this portion of the lung. However, respiration and pulmonary blood flow are cyclic phenomena. Therefore, absolute instantaneous Ppa, Ppv, and PA are changing continuously, and the relationships among Ppa, Ppv, and PA are dynamically determined by the phase lags between the cardiac and respiratory cycles. Consequently, a given point in zone 2 may actually be in either a zone 1 or a zone 3 condition at a given moment, depending on whether the patient is in respiratory systole or diastole or in cardiac systole or diastole.
Finally, whenever pulmonary vascular pressures (Ppa) are extremely high, as they are in a severely volume-overloaded patient, in a severely restricted and constricted pulmonary vascular bed, in an extremely dependent lung (far below the vertical level of the left atrium), and in patients with pulmonary embolism or mitral stenosis, fluid can transude out of the pulmonary vessels into the pulmonary interstitial compartment. In addition, pulmonary interstitial edema can be caused by extremely negative Ppl and perivascular hydrostatic pressure, such as may occur in a vigorously spontaneously breathing patient with an obstructed airway due to laryngospasm (most commonly) or upper airway masses (e.g., tumors, hematoma, abscess, edema), strangulation, infectious processes (e.g., epiglottitis, pharyngitis, croup), or vocal cord paralysis; with rapid reexpansion of lung; or with the application of very negative Ppl during thoracentesis.4,5 Transuded pulmonary interstitial fluid can significantly alter the distribution of pulmonary blood flow.
When the flow of fluid into the interstitial space is excessive and the fluid cannot be cleared adequately by the lymphatics, it accumulates in the interstitial connective tissue compartment around the large vessels and airways and forms peribronchial and periarteriolar edema fluid cuffs. The transuded pulmonary interstitial fluid fills the pulmonary interstitial space and may eliminate the normally present negative and radially expanding interstitial tension on the extra-alveolar pulmonary vessels. Expansion of the pulmonary interstitial space by fluid causes pulmonary interstitial pressure (PISF) to become positive and to exceed Ppv (zone 4, Ppa > PISF > Ppv > PA).6,7 In addition, the vascular resistance of extra-alveolar vessels may be increased at a very low lung volume (i.e., residual volume); at such volumes, the tethering action of the pulmonary tissue on the vessels is also lost, and as a result, PISF increases positively (see later discussion of lung volume).8,9 Consequently, zone 4 blood flow is governed by the arteriointerstitial pressure difference (Ppa − PISF), which is less than the Ppa − Ppv difference, and therefore zone 4 blood flow is less than zone 3 blood flow. In summary, zone 4 is a region of the lung from which a large amount of fluid has transuded into the pulmonary interstitial compartment or is possibly at a very low lung volume. Both these circumstances produce positive interstitial pressure, which causes compression of extra-alveolar vessels, increased extra-alveolar vascular resistance, and decreased regional blood flow.
It should be evident that as Ppa and Ppv increase, three important changes take place in the pulmonary circulation—namely, recruitment or opening of previously unperfused vessels, distention or widening of previously perfused vessels, and transudation of fluid from very distended vessels.10,11 Thus, as mean Ppa increases, zone 1 arteries may become zone 2 arteries, and as mean Ppv increases, zone 2 veins may become zone 3 veins. The increase in both mean Ppa and Ppv distends zone 3 vessels according to their compliance and decreases the resistance to flow through them. Zone 3 vessels may become so distended that they leak fluid and become converted to zone 4 vessels. In general, pulmonary capillary recruitment is the principal change as Ppa and Ppv increase from low to moderate levels, distention is the principal change as Ppa and Ppv increase from moderate to high levels, and transudation is the principal change when Ppa and Ppv increase from high to very high levels.
2 Distribution of Ventilation
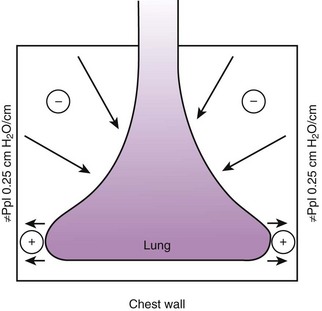
Gravity also causes differences in vertical Ppl, which in turn causes differences in regional alveolar volume, compliance, and ventilation. The vertical gradient of Ppl can best be understood by imagining the lung as a plastic bag filled with semifluid contents; in other words, it is a viscoelastic structure. Without the presence of a supporting chest wall, the effect of gravity on the contents of the bag would cause the bag to bulge outward at the bottom and inward at the top (i.e., it would assume a globular shape). Inside the supporting chest wall, the lung cannot assume a globular shape. However, gravity still exerts a force on the lung to assume a globular shape; this force creates relatively more negative pressure at the top of the pleural space (where the lung pulls away from the chest wall) and relatively more positive pressure at the bottom of the lung (where the lung is compressed against the chest wall) (Fig. 5-2). The density of the lung determines the magnitude of this pressure gradient. Because the lung has about one fourth the density of water, the gradient of Ppl (in cm H2O) is about one fourth the height of the upright lung (30 cm). Thus, Ppl increases positively by 30/4 = 7.5 cm H2O from the top to the bottom of the lung.12
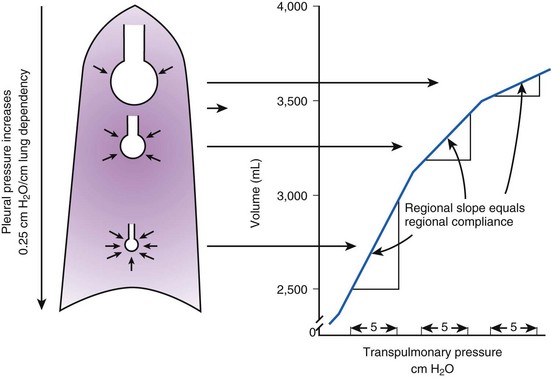
Because PA is the same throughout the lung, the Ppl gradient causes regional differences in transpulmonary distending pressure (PA − Ppl). Ppl is most positive (least negative) in the dependent basilar lung regions, so alveoli in these regions are more compressed and are therefore considerably smaller than the superior, relatively noncompressed apical alveoli. (The volume difference is approximately fourfold.)13 If regional differences in alveolar volume are translated to a pressure-volume (compliance) curve for normal lung (Fig. 5-3), the dependent small alveoli are on the midportion, and the nondependent large alveoli are on the upper portion of the S-shaped compliance curve. Because the different regional slopes of the composite curve are equal to the different regional lung compliance values, dependent alveoli are relatively compliant (steep slope), and nondependent alveoli are relatively noncompliant (flat slope). Therefore, most of the VT is preferentially distributed to dependent alveoli which expand more per unit pressure change than the nondependent alveoli.
3 The Ventilation-Perfusion Ratio
Blood flow and ventilation (both shown on the left vertical axis of Fig. 5-4) increase linearly with distance down the normal upright lung (horizontal axis, reverse polarity).14 Because blood flow increases from a very low value and more rapidly than ventilation does with distance down the lung, the ventilation-perfusion ratio ( , right vertical axis of Fig. 5-4) decreases rapidly at first and then more slowly.
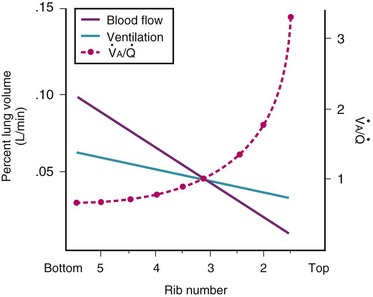
Figure 5-4 Distribution of ventilation and blood flow (left vertical axis) and the ventilation-perfusion ratio ( , right vertical axis) in normal upright lung. Both blood flow and ventilation are expressed in liters per minute per percentage of alveolar volume and have been drawn as smoothed-out linear functions of vertical height. The closed circles mark the
  ratios of horizontal lung slices (three of which are shown in Fig. 5-5). A cardiac output of 6 L/min and a total minute ventilation of 5.1 L/min were assumed.
(Redrawn with modification from West JB: Ventilation/Blood flow and gas exchange, ed 4, Oxford, 1970, Blackwell Scientific.)
 best expresses the amount of ventilation relative to perfusion in any given lung region. For example, alveoli at the base of the lung are overperfused in relation to their ventilation (
 < 1). Figure 5-5 shows the calculated ventilation (
 ) and blood flow (
 ), the
  ratio, and the alveolar partial pressures of oxygen (PAO2) and carbon dioxide (PACO2) for horizontal slices from the top (7% of lung volume), middle (11% of lung volume), and bottom (13% of lung volume) of the lung.15 PAO2 increases by more than 40 mm Hg, from 89 mm Hg at the base to 132 mm Hg at the apex, whereas PCO2 decreases by 14 mm Hg, from 42 mm Hg at the bottom to 28 mm Hg at the top. Therefore, in keeping with the regional
  ratio, the bottom of the lung is relatively hypoxic and hypercapnic compared with the top of the lung.
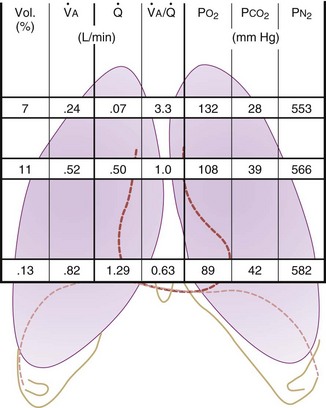
Figure 5-5 Ventilation-perfusion ratio ( ) and the regional composition of alveolar gas. Values for regional flow (
 ), ventilation (
 ), partial pressure of oxygen (PO2), and partial pressure of carbon dioxide (PCO2) were derived from Figure 5-4. Partial pressure of nitrogen (PN2) represents what remains from total gas pressure (760 mm Hg including water vapor, which equals 47 mm Hg). The percentage volumes (Vol.) of the three lung slices are also shown. When compared with the top of the lung, the bottom of the lung has a low
  ratio and is relatively hypoxic and hypercapnic.
(Redrawn from West JB: Regional differences in gas exchange in the lung of erect man. J Appl Physiol 17:893, 1962.)
 inequalities have different effects on arterial CO2 tension (PaCO2) than on arterial O2 tension (PaO2). Blood passing through underventilated alveoli tends to retain its CO2 and does not take up enough O2; blood traversing overventilated alveoli gives off an excessive amount of CO2 but cannot take up a proportionately increased amount of O2 because of the flatness of the oxygen-hemoglobin (oxy-Hb) dissociation curve in this region (see Fig. 5-25). A lung with uneven
  relationships can eliminate CO2 from the overventilated alveoli to compensate for the underventilated alveoli. As a result, with uneven
  relationships, PACO2-to-PaCO2 gradients are small, and PAO2-to-PAO2 gradients are usually large.
In 1974, Wagner and colleagues described a method of determining the continuous distribution of  ratios within the lung based on the pattern of elimination of a series of intravenously infused inert gases.16 Gases of differing solubility are dissolved in physiologic saline solution and infused into a peripheral vein until a steady state is achieved (20 minutes). Toward the end of the infusion period, samples of arterial and mixed expired gas are collected, and total ventilation and total cardiac output (
 ) are measured. For each gas, the ratio of arterial to mixed venous concentration (retention) and the ratio of expired to mixed venous concentration (excretion) are calculated, and retention-solubility and excretion-solubility curves are drawn. The retention- and excretion-solubility curves can be regarded as fingerprints of the particular distribution of
  ratios that give rise to them.
Figure 5-6 shows the types of distributions found in young, healthy subjects breathing air in the semirecumbent position.17 The distributions of both ventilation and blood flow are relatively narrow. The upper and lower 9% limits shown (vertical interrupted lines) correspond to  ratios of 0.3 and 2.1, respectively. Note that these young, healthy subjects had no blood flow perfusing areas with very low
  ratios, nor did they have any blood flow to unventilated or shunted areas (
 = 0) or unperfused areas (
 = 8). Figure 5-6 also shows PAO2 and PACO2 in respiratory units with different
  ratios. Within the 95% range of
  ratios (i.e., 0.3 to 2.1), PO2 ranges from 60 to 123 mm Hg, whereas the corresponding PCO2 range is 44 to 33 mm Hg.
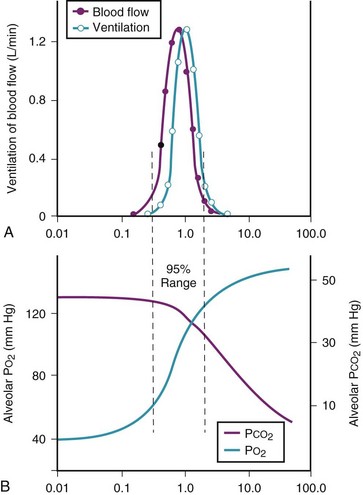
 ) in normal, young, semirecumbent subjects. The 95% range (between dashed lines) is 0.3 to 2.1. B, Corresponding variations in partial pressures of oxygen (P
B Nongravitational Determinants of Blood Flow Distribution
1 Passive Processes
a Cardiac Output
The pulmonary vascular bed is a high-flow, low-pressure system in health. As  increases, pulmonary vascular pressures increase minimally.18 However, increases in
  distend open vessels and recruit previously closed vessels. Accordingly, pulmonary vascular resistance (PVR) drops because the normal pulmonary vasculature is quite distensible (and partly because of the addition of previously unused vessels to the pulmonary circulation). As a result of the distensibility of the normal pulmonary circulation, an increase in Ppa increases the radius of the pulmonary vessels, which causes PVR to decrease (Fig. 5-7). Conversely, the opposite effect occurs within the pulmonary vessels during a decrease in
  . As
. As  decreases, pulmonary vascular pressures decrease, the radii of the pulmonary vessels are reduced, and PVR consequently increases. The pulmonary vessels of patients with significant pulmonary hypertension are less distensible and act more like rigid pipes. In this setting, Ppa increases much more sharply with any increase in
  because PVR in these stiff vessels does not decrease significantly due to minimal expansion of their radii.
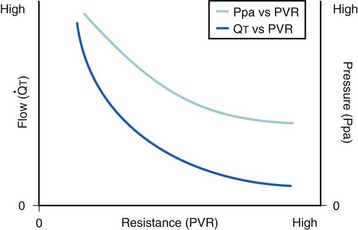
 ): PVR = Ppa/
 . As
. As  increases, Ppa also increases, but to a lesser extent, and PVR decreases. As
  decreases, Ppa also decreases, but to a lesser extent, and PVR increases.
Understanding the relationships among Ppa, PVR, and  during passive events is a prerequisite to recognition of active vasomotion in the pulmonary circulation (see Lung Volume). Active vasoconstriction occurs whenever
  decreases and Ppa either remains constant or increases. Increased Ppa and PVR have been found to be “a universal feature of acute respiratory failure.”19
 increases and Ppa either remains constant or decreases. When deliberate hypotension is achieved with sodium nitroprusside,
  often remains constant or increases, but Ppa decreases, and therefore so does PVR.
b Lung Volume
Lung volume and PVR have an asymmetric, U-shaped relationship because of the varying effect of lung volume on small intra-alveolar and large extra-alveolar vessels, which in both cases is minimal at functional residual capacity (FRC). FRC is defined as the amount of volume (gas) in the lungs at end-exhalation during normal tidal breathing. Ideally, this means that the patient is inspiring a normal VT, with minimal or no muscle activity or pressure difference between the alveoli and atmosphere at end-exhalation. Total PVR is increased when lung volume is either increased or decreased from FRC (Fig. 5-8).20–22 The increase in total PVR above FRC results from alveolar compression of small intra-alveolar vessels, which results in an increase in small-vessel PVR (i.e., creation of zone 1 or zone 2).23 As a relatively small mitigating or counterbalancing effect to the compression of small vessels, the large extra-alveolar vessels can be expanded by the increased tethering of interstitial connective tissue at high lung volumes (and with spontaneous ventilation only—the negativity of perivascular pressure at high lung volumes). The increase in total PVR below FRC results from an increase in the PVR of large extra-alveolar vessels (passive effect). The increase in large-vessel PVR is partly due to mechanical tortuosity or kinking of these vessels (passive effect). In addition, small or grossly atelectatic lungs become hypoxic, and it has been shown that the increased large-vessel PVR in these lungs is also caused by an active vasoconstrictive mechanism known as hypoxic pulmonary vasoconstriction (HPV).24 The effect of HPV (discussed in greater detail in “Alveolar Gases”) is significant whether the chest is open or closed and whether ventilation is by positive pressure or spontaneous.25
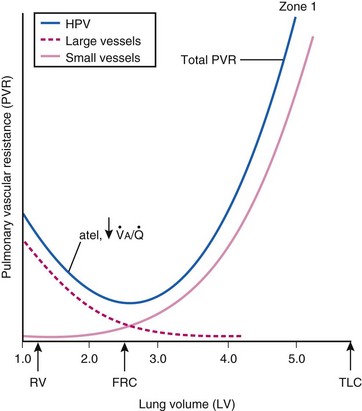
 ) and atelectatic (atel) areas that demonstrate hypoxic pulmonary vasoconstriction (HPV).
2 Active Processes and Pulmonary Vascular Tone
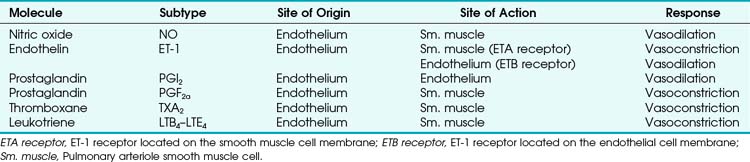
Four major categories of active processes affect the pulmonary vascular tone of normal patients: (1) local tissue (endothelial- and smooth muscle–derived) autocrine or paracrine products, which act on smooth muscle (Table 5-1); (2) alveolar gas concentrations (chiefly hypoxia), which also act on smooth muscle; (3) neural influences; and (4) humoral (or hormonal) effects of circulating products within the pulmonary capillary bed. The neural and humoral effects work by means of either receptor-mediated mechanisms involving the autocrine/paracrine molecules listed in Table 5-1 or related mechanisms ultimately affecting the smooth muscle cell.26 These four interrelated systems, each affecting pulmonary vascular tone, are briefly reviewed in sequence.
TABLE 5-1 Local Tissue (Autocrine/Paracrine) Molecules Involved in Active Control of Pulmonary Vascular Tone
a Tissue (Endothelial- and Smooth Muscle–derived) Products
The pulmonary vascular endothelium synthesizes, metabolizes, and converts a multitude of vasoactive mediators and plays a central role in the regulation of PVR. However, the main effecter site of pulmonary vascular tone is the pulmonary vascular smooth muscle cell (which both senses and produces multiple pulmonary vasoactive compounds).27 The autocrine/paracrine molecules listed in Table 5-1 are all actively involved in the regulation of pulmonary vascular tone during various conditions. Numerous additional compounds bind to receptors on the endothelial or smooth muscle cell membranes and modulate the levels (and effects) of these vasoactive molecules.
Nitric oxide (NO) is the predominant endogenous vasodilatory compound. Its discovery by Palmer and colleagues 25 years ago ended the long search for the so-called endothelium-derived relaxant factor (EDRF).28 Since then, a massive amount of laboratory and clinical research has demonstrated the ubiquitous nature of NO and its predominant role in vasodilation of both pulmonary and systemic blood vessels.29 In the pulmonary endothelial cell, L-arginine is converted to L-citrulline by means of nitric oxide synthase (NOS) to produce the small, yet highly reactive NO molecule.30 Because of its small size, NO can diffuse freely across membranes into the smooth muscle cell, where it binds to the heme moiety of guanylate cyclase (which converts guanosine triphosphate to cyclic guanosine monophosphate [cGMP]).31 cGMP activates protein kinase G, which dephosphorylates the myosin light chains of pulmonary vascular smooth muscle cells and thereby causes vasodilation.31 NOS exists in two forms: constitutive (cNOS) and inducible (iNOS). cNOS is permanently expressed in some cells, including pulmonary vascular endothelial cells, and produces short bursts of NO in response to changing levels of calcium and calmodulin and shear stress. The cNOS enzyme is also stimulated by linked membrane-based receptors that bind numerous molecules in the blood (e.g., acetylcholine, bradykinin).31 In contrast, iNOS is usually produced only as a result of inflammatory mediators and cytokines and, when stimulated, produces large quantities of NO for an extended duration.31 It is well known that NO is constitutively produced in normal lungs and contributes to the maintenance of low PVR.32,33
Endothelin-1 (ET-1) is a pulmonary vasoconstrictor.34 The endothelins are 21-amino-acid peptides that are produced by a variety of cells. ET-1 is the only family member produced in pulmonary endothelial cells, and it is also produced in vascular smooth muscle cells.34 ET-1 exerts its major vascular effects through activation of two distinct G protein–coupled receptors (ETA and ETB). ETA receptors are found in the medial smooth muscle layers of the pulmonary (and systemic) blood vessels and in atrial and ventricular myocardium.34 When stimulated, ETA receptors induce vasoconstriction and cellular proliferation by increasing intracellular calcium.35 ETB receptors are localized on endothelial cells and some smooth muscle cells.36 Activation of ETB receptors stimulates the release of NO and prostacyclin, thereby promoting pulmonary vasodilation and inhibiting apoptosis.30 Bosentan, an ET-1 receptor antagonist, has produced modest improvement in the treatment of pulmonary hypertension.37 The more selective ETA receptor antagonist, sitaxsentan, showed additional benefit in improving pulmonary hypertension.38 However, both of these ET-1 receptor antagonists are associated with an increased risk of liver toxicity.39 In summary, it appears that there is a normal balance between NO and ET-1, with a slight predominance toward NO production and vasodilation in health.
Similarly, various eicosanoids are elaborated by the pulmonary vascular endothelium, with a balance toward the vasodilatory compounds in health. Prostaglandin I2 (PGI2), now known as epoprostenol (previously known as prostacyclin), causes vasodilation and is continuously elaborated in small amounts in healthy endothelium. In contrast, thromboxane A2 and leukotriene B4 are elaborated under pathologic conditions and are thought to be involved in the pathophysiology of pulmonary artery hypertension (PAH) associated with sepsis and reperfusion injury.26
Therapeutically, epoprostenol has been used successfully to decrease PVR in patients with chronic PAH when infused or inhaled.40,41 Currently, the synthetic PGI2 (iloprost) is the most commonly used inhaled eicosanoid for reduction of PVR in patients with PAH.41Although most patients with chronic PAH are unresponsive to an acute vasodilator challenge with short-acting agents such as epoprostenol, adenosine, or NO,42 long-term administration of epoprostenol has been shown to decrease PVR in these patients.43 Furthermore, some patients with previously severe PAH have been weaned from epoprostenol after long-term administration, with dramatically decreased PVR and improved exercise tolerance.42 The vascular remodeling required to provide such a dramatic reduction in PVR is probably the result of mechanisms besides simple local vasodilation, as predicted by Fishman in an editorial in 1998.44 One such mechanism that appears to be important is the increased clearance of ET-1 (a potent vasoconstrictor and mitogen) with long-term epoprostenol administration.45
b Alveolar Gases
Hypoxia-induced vasoconstriction constitutes a fundamental difference between pulmonary vessels and all other systemic blood vessels (which vasodilate in the presence of hypoxia). Alveolar hypoxia of in vivo and in vitro whole lung, unilateral lung, lobe, or lobule of lung results in localized pulmonary vasoconstriction. This phenomenon is widely referred to as HPV and was first described more than 65 years ago by Von Euler and Liljestrand.46 The HPV response is present in all mammalian species and serves as an adaptive mechanism for diverting blood flow away from poorly ventilated to better ventilated regions of the lung and thereby improving  ratios.47 The HPV response is also critical for fetal development because it minimizes perfusion of the unventilated lung.
The HPV response occurs primarily in pulmonary arterioles of about 200 µm internal diameter (ID) in humans (60 to 700 µm ID in other species).48 These vessels are advantageously situated anatomically in close relation to small bronchioles and alveoli, which permits rapid and direct detection of alveolar hypoxia. Indeed, blood may actually become oxygenated in small pulmonary arteries because of the ability of O2 to diffuse directly across the small distance between the contiguous air spaces and vessels.49 This direct access that gas in the airways has to small arteries makes possible a rapid and localized vascular response to changes in gas composition.
The O2 tension at the HPV stimulus site (PsO2) is a function of both PAO2 and mixed venous O2 pressure ( ).50 The PsO2-HPV response is sigmoid, with a 50% response when PAO2,
  , and PsO2 are approximately 30 mm Hg. Usually, PAO2 has a much greater effect than
  does because O2 uptake is from the alveolar space to the blood in the small pulmonary arteries.50
Numerous theories have been developed to explain the mechanism of HPV.46,51–53 Many vasoactive substances have been proposed as mediators of HPV, including leukotrienes, prostaglandins, catecholamines, serotonin, histamine, angiotensin, bradykinin, and ET-1, but none has been identified as the primary mediator. In 1992, Xuan proposed that NO has a pivotal role in modulating PVR.54 NO is involved, but not precisely in the way that Xuan first proposed. There are multiple sites of O2 sensing with variable contributions from the NO, ET-1, and eicosanoid systems (described earlier). In vivo, HPV is currently thought to result from the synergistic action of molecules produced in both endothelial cells and smooth muscle cells.55 However, HPV can proceed in the absence of intact endothelium, suggesting that the primary O2 sensor is in the smooth muscle cell and that endothelium-derived molecules modulate only the primary HPV response.
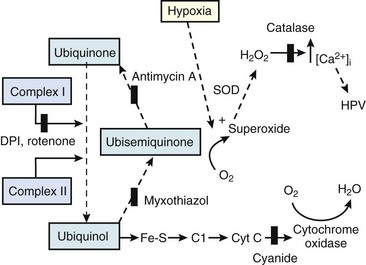
The precise mechanism of HPV is still under investigation. However, current data support a mechanism involving the smooth muscle mitochondrial electron transport chain as the HPV sensor (Fig. 5-9).56 In addition, reactive oxygen species (possibly H2O2 or superoxide) are released from complex III of the electron transport chain and probably serve as second messengers to increase calcium in pulmonary artery smooth muscle cells during acute hypoxia.57 However, alternative (less likely) mechanisms are still being investigated.58 One alternative hypothesis suggests that smooth muscle microsomal reduced nicotinamide adenine dinucleotide phosphate (NADPH) oxidoreductase or sarcolemmal NADPH oxidase is the sensing mechanism.58 Another, previously popular theory posited that voltage-sensitive potassium (KV) channels were required for the HPV response. However, KV channels are no longer believed to be obligate but instead are thought to be attenuators, because a study demonstrated that inhibition of KV channels failed to inhibit the HPV response.58
The clinical effects of HPV in humans can be classified under three basic mechanisms. First, life at high altitude or whole-lung respiration of a low inspired concentration of O2 (FIO2) increases Ppa. This is true for newcomers to high altitude, for the acclimatized, and for natives.53 The vasoconstriction is considerable; in healthy people breathing 10% O2, Ppa doubles whereas pulmonary wedge pressure remains constant.59 The increased Ppa increases perfusion of the apices of the lung (through recruitment of previously unused vessels), which results in gas exchange in a region of lung not normally used (i.e., zone 1). Therefore, with a low FIO2, PAO2 is greater and the alveolar-arterial O2 tension difference and the ratio between dead space and tidal volume (VD/VT) are less than would be expected or predicted on the basis of a normal (sea level) distribution of ventilation and blood flow. High-altitude pulmonary hypertension is an important component in the development of mountain sickness subacutely (hours to days) and cor pulmonale chronically (weeks to years).60 There is now good evidence that in both patients with chronic obstructive pulmonary disease (COPD) and those with obstructive sleep apnea (OSA), nocturnal episodes of arterial O2 desaturation (caused by episodic hypoventilation) are accompanied by elevations in Ppa that can eventually lead to sustained pulmonary hypertension and cor pulmonale.61
Second, hypoventilation (low  ratio), atelectasis, or nitrogen ventilation of any region of the lung usually causes a diversion of blood flow away from the hypoxic to the nonhypoxic lung (40% to 50% in one lung, 50% to 60% in one lobe, 60% to 70% in one lobule) (Fig. 5-10).62 The regional vasoconstriction and blood flow diversion are of great importance in minimizing transpulmonary shunting and normalizing regional
  ratios during disease of one lung, one-lung anesthesia (see Chapter 26), inadvertent intubation of a main stem bronchus, and lobar collapse.
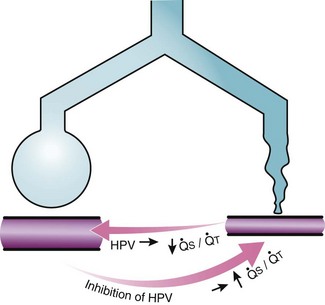
 ) that can occur through the hypoxic lung. Inhibition of hypoxic lung HPV causes an increase in the amount of shunt flow through the hypoxic lung, thereby decreasing the alveolar oxygen tension (P
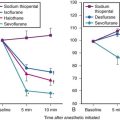
Third, in patients who have COPD, asthma, pneumonia, or mitral stenosis but not bronchospasm, administration of pulmonary vasodilator drugs such as isoproterenol, sodium nitroprusside, or nitroglycerin inhibits HPV and causes a decrease in PaO2 and PVR and an increase in right-to-left transpulmonary shunting.63 The mechanism for these changes is thought to be deleterious inhibition of preexisting and, in some lesions, geographically widespread HPV without concomitant and beneficial bronchodilation.63 In accordance with the latter two lines of evidence (one-lung or regional hypoxia and vasodilator drug effects on whole-lung or generalized disease), HPV is thought to divert blood flow away from hypoxic regions of the lung, thereby serving as an autoregulatory mechanism that protects PaO2 by favorably adjusting regional  ratios. Factors that inhibit regional HPV are extensively discussed elsewhere.64,65
c Neural Influences on Pulmonary Vascular Tone
The three systems used to innervate the pulmonary circulation are the same ones that innervate the airways: the sympathetic, parasympathetic, and nonadrenergic noncholinergic (NANC) systems.26 Sympathetic (adrenergic) fibers originate from the first five thoracic nerves and enter the pulmonary vessels as branches from the cervical ganglia, as well as from a plexus of nerves arising from the trachea and main stem bronchi. These nerves act mainly on pulmonary arteries down to a diameter of 60 µm.26 Sympathetic fibers cause pulmonary vasoconstriction through α1-receptors. However, the pulmonary arteries also contain vasodilatory α2-receptors and β2-receptors. The α1-adrenergic response predominates during sympathetic stimulation, such as occurs with pain, fear, and anxiety.26 The parasympathetic (cholinergic) nerve fibers originate from the vagus nerve and cause pulmonary vasodilation through an NO-dependent process.26 Binding of acetylcholine to a muscarinic (M3) receptor on the endothelial cell increases intracellular calcium and stimulates cNOS.26 NANC nerves cause pulmonary vasodilation through NO-mediated systems by using vasoactive intestinal peptide as the neurotransmitter. The functional significance of this system is still under investigation.26
d Humoral Influences on Pulmonary Vascular Tone
Numerous molecules are released into the circulation that either affect pulmonary vascular tone (by binding to pulmonary endothelial receptors) or are acted on by the pulmonary endothelium and subsequently become activated or inactivated (Table 5-2). The entire topic of nonrespiratory function of the lung is fascinating but beyond the scope of this chapter. Here, we highlight the effects that circulating molecules have on pulmonary vascular tone.
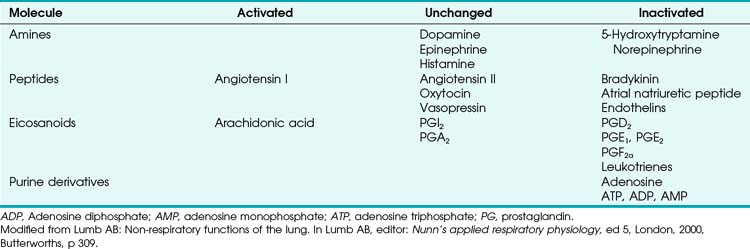
Endogenous catecholamines (epinephrine and norepinephrine) bind to both α1- (vasoconstrictor) and β2-(vasodilator) receptors on the pulmonary endothelium, but when elaborated in high concentration, they have a predominant α1 (vasoconstrictor) effect. The same is true for exogenously administered catecholamines. Other amines (e.g., histamine, serotonin) are elaborated systemically or locally after various challenges and have variable effects on PVR. Histamine can be released from mast cells, basophils, and elsewhere. When histamine binds directly to H1 receptors on endothelium, NO-mediated vasodilation occurs (as seen after epinephrine-induced pulmonary vasoconstriction). Direct stimulation of H2 receptors on smooth muscle cell membranes also causes vasodilation. In contrast, stimulation of H1 receptors on the smooth muscle membrane results in vasoconstriction. Serotonin (5-hydroxytryptamine) is a potent vasoconstrictor that can be elaborated from activated platelets (e.g., after pulmonary embolism) and can lead to acute severe pulmonary hypertension.66
Two other classes of molecules must be mentioned for completeness: eicosanoids (whose vasoactive effects were discussed earlier) and purine nucleosides (which are similarly highly vasoactive).26 Adenosine is a pulmonary vasodilator in normal subjects, whereas adenosine triphosphate (ATP) has a variable normalizing effect, depending on baseline pulmonary vascular tone.67
3 Alternative (Nonalveolar) Pathways of Blood Flow Through the Lung
Blood can use several possible pathways to travel from the right side of the heart to the left without being fully oxygenated or oxygenated at all. Blood flow through poorly ventilated alveoli (regions of low  with an FIO2 <0.3 have a right-to-left shunt effect on oxygenation) and blood flow through nonventilated alveoli (in atelectatic or consolidated regions,
  = 0 at all FIO2 values) are sources of right-to-left shunting. Low-
 and atelectatic lung units occur in conditions in which the FRC is less than the closing capacity (CC) of the lung (see “Lung Volumes, Functional Residual Capacity, and Closing Capacity”).
Intrapulmonary arteriovenous anastomoses are normally closed, but in the presence of acute pulmonary hypertension, such as may be caused by a pulmonary embolus, they may open and result in a direct increase in right-to-left shunting. The foramen ovale is patent (PFO) in 20% to 30% of individuals but it usually remains functionally closed because left atrial pressure normally exceeds right atrial pressure. However, any condition that causes right atrial pressure to be greater than left atrial pressure may produce a right-to-left shunt, with resultant hypoxemia and possible paradoxical embolization. Such conditions include the use of high levels of PEEP, pulmonary embolization, pulmonary hypertension, COPD, pulmonary valvular stenosis, congestive heart failure, and postpneumonectomy states.68 Even such common events as mechanical ventilation and reaction to the presence of an endotracheal tube (ETT) during the excitement phase of emergence from anesthesia have caused right-to-left shunting across a PFO and severe arterial desaturation (with the potential for paradoxical embolization).69,70
Transesophageal echocardiography has been demonstrated to be a sensitive modality for diagnosing a PFO in anesthetized patients with elevated right atrial pressure.71 Esophageal to mediastinal to bronchial to pulmonary vein pathways have been described and may explain in part the hypoxemia associated with portal hypertension and cirrhosis. There are no known conditions that selectively increase thebesian channel blood flow. (Thebesian vessels nourish the left ventricular myocardium and originate and empty into the left side of the heart.)
C Nongravitational Determinants of Pulmonary Compliance, Resistance, Lung Volume, Ventilation, and Work of Breathing
1 Pulmonary Compliance
 (1)
(1) (2)
(2)During a positive- or negative-pressure inspiration of sufficient duration, transthoracic ΔP first increases to a peak value and then decreases to a lower plateau value. The peak transthoracic pressure value is the pressure required to overcome both elastic and airway resistance (see “Airway Resistance”). Transthoracic pressure decreases to a plateau value after the peak value because with time, gas is redistributed from stiff alveoli (which expand only slightly and therefore have only a short inspiratory period) into more compliant alveoli (which expand a great deal and therefore have a long inspiratory period). Because the gas is redistributed into more compliant alveoli, less pressure is required to contain the same amount of gas, which explains why the pressure decreases. In practical terms, dynamic compliance is the volume change divided by the peak inspiratory transthoracic pressure, and static compliance is the volume change divided by the plateau inspiratory transthoracic pressure. Therefore, static CT is usually greater than dynamic CT, because the former calculation uses a smaller denominator (lower pressure) than the latter. However, if the patient is receiving PEEP, that pressure must first be subtracted from the peak or plateau pressure before thoracic compliance is calculated (i.e., compliance is equal to the volume delivered divided by the peak or plateau pressure − PEEP).
According to the Laplace expression, shown in equation (3), the pressure in an alveolus (P, in dynes per square centimeter) is higher than ambient pressure by an amount that depends on the surface tension of the lining liquid (T, in dynes per centimeter) and the radius of curvature of the alveolus (R, in centimeters). This relationship is expressed in the following equation:
 (3)
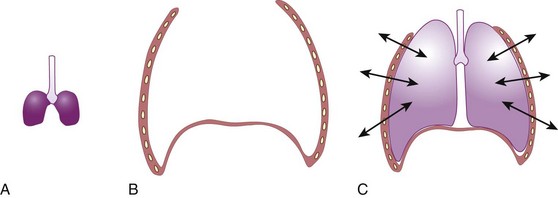
(3)Although surface tension contributes to the elastic resistance and retractive forces of the lung, two difficulties must be resolved. First, the pressure inside small alveoli should be higher than that inside large alveoli, a conclusion that stems directly from the Laplace equation (R in the denominator). From this reasoning, one would expect a progressive discharge of each small alveolus into a larger one until eventually only one gigantic alveolus would be left (Fig. 5-11A). The second problem concerns the relationship between lung volume and transpulmonary ΔP (PA − Ppl). Theoretically, the retractive forces of the lung should increase as lung volume decreases. If this were true, lung volume would decrease in a vicious circle, with an increasingly progressive tendency to collapse as lung volume diminishes.
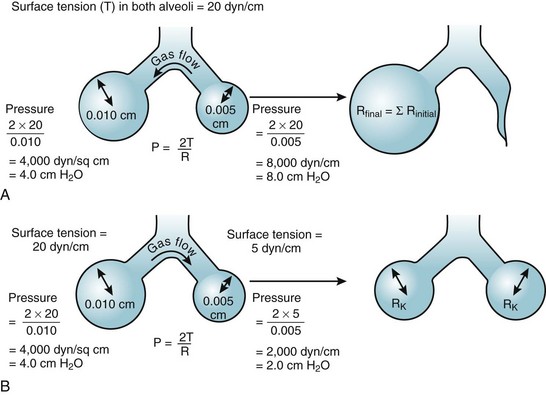
These two problems are resolved by the fact that the surface tension of the fluid lining the alveoli is variable and decreases as its surface area is reduced. The surface tension of alveolar fluid can reach levels that are well below the normal range for body fluids such as water and plasma. When an alveolus decreases in size, the surface tension of the lining fluid falls to an extent greater than the corresponding reduction in radius; as a result, the transmural pressure gradient (equal to 2T/R) diminishes. This explains why small alveoli do not discharge their contents into large alveoli (see Fig. 5-11B) and why the elastic recoil of small alveoli is less than that of large alveoli.
2 Airway Resistance
 ).
). (4)
(4) (5)
(5)ΔP is the pressure drop (in cm H2O),  is the volume flow rate (in mL/sec), µ is viscosity (in poises), L is the length of the tube (in cm), and r is the radius of the tube (in cm).
When flow exceeds the critical velocity, it becomes turbulent. The significant feature of turbulent flow is that the pressure drop along the airway is no longer directly proportional to the flow rate but is proportional to the square of the flow rate according to equation (6) for turbulent flow:
 (6)
(6)ΔP is the pressure drop (in cm H2O),  is the volume flow rate (in mL/sec), ρ is the density of the gas (or liquid), f is a friction factor that depends on the roughness of the tube wall, and r is the radius of the tube (in cm).72 With increases in turbulent flow (or orifice flow, as described in the next paragraph), ΔP increases much more than
  and therefore RAW also increases more, as predicted by equation (4).
3 Different Regional Lung Time Constants
Thus far, the compliance and airway resistance properties of the chest have been discussed separately. In the following analysis, pressure at the mouth is assumed to increase suddenly to a fixed positive value (Fig. 5-12) that overcomes both elastic and airway resistance and to be maintained at this value during inflation of the lungs.73 The ΔP required to overcome nonelastic airway resistance is the difference between the fixed mouth pressure and the instantaneous height of the dashed line in Figure 5-12 and is proportional to the flow rate during most of the respiratory cycle.
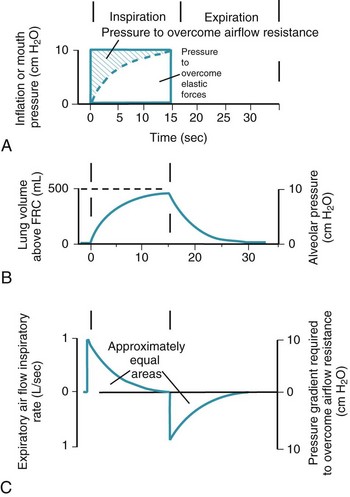
Figure 5-12 Artificial ventilation by intermittent application of constant pressure (square wave) followed by passive expiration. The pressure required to overcome airway resistance (hatched lines in A) and the airflow rate (in C) from equation (4) in the text are proportional to one another and decrease exponentially (assuming that resistance to airflow is constant). The pressure required to overcome the elastic forces (height of the dashed line in A) and lung volume (B) are proportional to one another and increase exponentially. Values shown are typical for an anesthetized supine paralyzed patient: total dynamic compliance, 50 mL/cm H2O; pulmonary resistance, 3 cm H2O/L/sec; apparatus resistance, 7 cm H2O/L/sec; total resistance, 10 cm H2O/L/sec; time constant, 0.5 seconds. FRC, Functional residual capacity.
(Redrawn from Lumb AB: Artificial ventilation. In Lumb AB, editor: Nunn’s applied respiratory physiology, ed 5, London, 2000, Butterworths, p 590.)
The ΔP required to overcome nonelastic airway resistance is maximal initially but then decreases exponentially (see Fig. 5-12, A, hatched lines). The rate of filling therefore also declines in an approximately exponential manner. The remainder of the pressure gradient overcomes the elastic resistance (the instantaneous height of the dashed line in Fig. 5-12A) and is proportional to the change in lung volume. The ΔP required to overcome elastic resistance is minimal initially but then increases exponentially, as does lung volume. Alveolar filling ceases (lung volume remains constant) when the pressure resulting from the retractive elastic forces balances the applied (mouth) pressure (see Fig. 5-12A, dashed line).
4 Pathways of Collateral Ventilation
Collateral ventilation is another nongravitational determinant of the distribution of ventilation. Four pathways of collateral ventilation are known. First, interalveolar communications (pores of Kohn) exist in most species; their number ranges from 8 to 50 per alveolus, and they may increase with age and with the development of obstructive lung disease. Their precise role has not been defined, but they probably function to prevent hypoxia in neighboring but obstructed lung units. Second, distal bronchiole-to-alveolus communications are known to exist (channels of Lambert); their function in vivo is speculative but may be similar to that of the pores of Kohn. Third, respiratory bronchiole–to–terminal bronchiole connections have been found in adjacent lung segments (channels of Martin) in healthy dogs and in humans with lung disease. Fourth, interlobar connections exist; the functional characteristics of interlobar collateral ventilation through these connections have been described in dogs,74 and they have been observed in humans as well.75
5 Work of Breathing
The pressure-volume characteristics of the lung also determine the work of breathing (WOB). Because
 (7)
(7)work is defined by the equation
 (8)
(8)and ventilatory work may be analyzed by plotting pressure against volume.76 In the presence of increased airway resistance or decreased CL, increased transpulmonary pressure is required to achieve a given VT with a consequent increase in the WOB. The metabolic cost of the WOB at rest constitutes only 1% to 3% of the total O2 consumption in healthy subjects, but it is increased considerably (up to 50%) in patients with pulmonary disease.
Two different pressure-volume diagrams are shown in Figure 5-13. During normal inspiration, transpulmonary pressure increases from 0 to 5 cm H2O while 500 mL of air is drawn into the lung. Potential energy is stored by the lung during inspiration and is expended during expiration; as a consequence, the entire expiratory cycle is passive. The hatched area plus the triangular area ABC represents pressure multiplied by volume and is the WOB during one breath. Line AB is the lower section of the pressure-volume curve of Figure 5-13. The triangular area ABC is the work required to overcome elastic forces (CT), whereas the hatched area is the work required to overcome airflow or frictional resistance (R). The second graph applies to an anesthetized patient with diffuse obstructive airway disease resulting from the accumulation of mucous secretions. There is a marked increase in both the elastic (triangle AB′C) and the airway (hatched area) resistive components of respiratory work. During expiration, only 250 mL of air leaves the lungs during the passive phase when intrathoracic pressure reaches the equilibrium value of 0 cm H2O. Active effort-producing work is required to force out the remaining 250 mL of air, and intrathoracic pressure actually becomes positive.
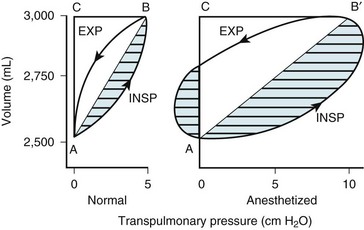
Figure 5-13 Lung volume plotted against transpulmonary pressure in a pressure-volume diagram for a healthy awake patient (Normal) and an anesthetized patient. The lung compliance of the awake patient (slope of line AB = 100 mL/cm H2O) equals that shown for the small dependent alveoli in Figure 5-3. The lung compliance of the anesthetized patient (slope of line AB′ = 50 mL/cm H2O) equals that shown for the medium midlung alveoli in Figure 5-3 and for the anesthetized patient in Figure 5-12. The total area within the oval and triangles has the dimensions of pressure multiplied by volume and represents the total work of breathing. The hatched areas to the right of lines AB and AB′ represent the active inspiratory work necessary to overcome resistance to airflow during inspiration (INSP). The hatched area to the left of the triangle AB′C represents the active expiratory work necessary to overcome resistance to airflow during expiration (EXP). Expiration is passive in the healthy subject because sufficient potential energy is stored during inspiration to produce expiratory airflow. The fraction of total inspiratory work necessary to overcome elastic resistance is shown by the triangles ABC and AB′C. The anesthetized patient has decreased compliance and increased elastic resistance work (triangle AB′C) compared with the healthy patient’s compliance and elastic resistance work (triangle ABC). The anesthetized patient represented in this figure has increased airway resistance to both inspiratory and expiratory work.
 (9)
(9) is the minute ventilation (rr × VT) required to achieve a normal Paco2. When patients have an increased CO2 production (as occurs with fever) the
  , and hence the WOB, will need to be higher. When the dead space (either alveolar or anatomic) is increased, the
  will need to increase to achieve a normal Paco2. Similarly, when airway resistance (RAW) is increased, or compliance (CL) is decreased, there will be a corresponding increase in the WOB.
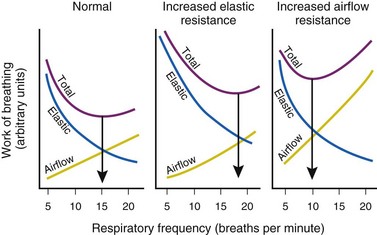
Furthermore, for any constant minute volume, the work done against elastic resistance is increased when breathing is deep and slow. On the other hand, the work done against airflow resistance is increased when breathing is rapid and shallow. If the two components are summed and the total work is plotted against respiratory frequency, there is an optimal respiratory frequency at which the total WOB is minimal (Fig. 5-14).77 In patients with diseased lungs in which elastic resistance is high (e.g., pulmonary fibrosis, pulmonary edema, infants), the optimal frequency is increased, and rapid, shallow breaths are favored. As with other muscles, respiratory muscles can become fatigued, especially with rapid, shallow breathing.78 When airway resistance is high (e.g., asthma, obstructive lung disease), the optimal frequency is decreased, and slow, deep breaths are favored. Although the optimal frequency is slow (allowing a prolonged expiratory phase), a rapid, shallow breathing pattern also develops in these patients when fatigued and further exacerbates their primary (airway resistance) problem.78
6 Lung Volumes, Functional Residual Capacity, and Closing Capacity
a Lung Volumes and Functional Residual Capacity
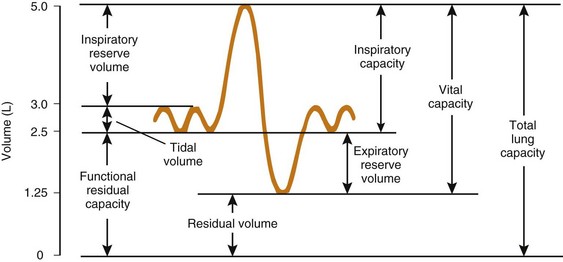
FRC is defined as the volume of gas in the lung at the end of a normal expiration when there is no airflow and PA equals ambient pressure. Under these conditions, expansive chest wall elastic forces are exactly balanced by retractive lung tissue elastic forces (Fig. 5-15).79
The expiratory reserve volume is part of FRC; it is the additional gas beyond the end-tidal volume that can be consciously exhaled, resulting in the minimum volume of lung possible, known as residual volume. Therefore, FRC equals residual volume plus expiratory reserve volume (Fig. 5-16). With regard to the other lung volumes shown in Figure 5-16, VT, vital capacity, inspiratory capacity, inspiratory reserve volume, and expiratory reserve volume can be measured by simple spirometry. Total lung capacity (TLC), FRC, and residual volume contain a fraction (residual volume) that cannot be measured by simple spirometry. However, if one of these three volumes is measured, the others can easily be derived, because the other lung volumes, which relate these three volumes to one another, can be measured by simple spirometry.
Residual volume, FRC, and TLC can be measured by any of three techniques: (1) nitrogen washout, (2) inert gas dilution (e.g., helium washin), and (3) total-body plethysmography. The first method, the nitrogen washout technique, is based on measuring expired nitrogen concentrations before and after the patient breathes pure O2 for several minutes; the difference is the total quantity of nitrogen eliminated. If, for example, 2 L of N2 is eliminated and the initial alveolar N2 concentration was 80%, the initial volume of the lung was 2.5 L. The second method, the inert gas dilution technique, uses the washin of an inert tracer gas such as helium. If 50 mL of helium is introduced into the lungs and, after equilibration, the helium concentration is found to be 1%, the volume of the lung is 5 L. The third method, the total-body plethysmography technique, uses Boyle’s law (P1V1 = P2V2, where P1= initial pressure, V1 = initial volume). The subject is confined within a gas-tight box (plethysmograph) so that changes in the volume of the body during respiration may be readily determined as a change in pressure within the sealed box. Although each technique has technical limitations, all are based on sound physical and physiologic principles and provide accurate results in normal patients. Disparity between FRC as measured in the body plethysmograph and as determined by the helium dilution method is often used as a way of detecting large, nonventilating air-trapped blebs.80 Obviously, there are difficulties in applying the body plethysmograph to anesthetized patients.
b Airway Closure and Closing Capacity
As discussed earlier (see “Distribution of Ventilation”), Ppl increases from the top to the bottom of the lung and determines regional alveolar size, compliance, and ventilation. Of even greater importance to the anesthesiologist is the recognition that these gradients in Ppl may lead to airway closure and collapse of alveoli.
Patient with Normal Lungs
Figure 5-17A illustrates the normal resting end-expiratory (FRC) position of the lung–chest wall combination. The distending transpulmonary ΔP and the intrathoracic air passage transmural ΔP are 5 cm H2O, and the airways remain patent. During the middle of a normal inspiration (see Fig. 5-17B), there is an increase in transmural ΔP (to 6.8 cm H2O) that encourages distention of the intrathoracic air passages. During the middle of a normal expiration (see Fig. 5-17C), expiration is passive; PA is attributable only to the elastic recoil of the lung (2 cm H2O), and there is a decrease (to 5.2 cm H2O) but still a favorable (distending) intraluminal transmural ΔP. During the middle of a severe forced expiration (see Fig. 5-17D), Ppl increases far higher than atmospheric pressure and is communicated to the alveoli, which have a pressure that is still higher because of the elastic recoil of the alveolar septa (an additional 2 cm H2O).
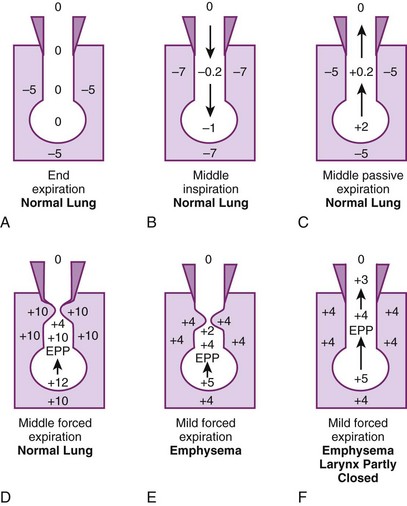
At high gas flow rates, the pressure drop down the air passage is increased, and there is a point at which intraluminal pressure equals either the surrounding parenchymal pressure or Ppl; that point is termed the equal pressure point (EPP). If the EPP occurs in small intrathoracic air passages (distal to the 11th generation, the airways have no cartilage and are called bronchioles), they may be held open at that particular point by the tethering effect of the elastic recoil of the immediately adjacent or surrounding lung parenchyma. If the EPP occurs in large extrathoracic air passages (proximal to the 11th generation, the airways have cartilage and are called bronchi), they may be held open at that particular point by their cartilage. Downstream of the EPP (in either small or large airways), transmural ΔP is reversed (−6 cm H2O), and airway closure occurs. Thus, the patency of airways distal to the 11th generation is a function of lung volume, and the patency of airways proximal to the 11th generation is a function of intrathoracic (pleural) pressure. In extrathoracic bronchi with cartilage, the posterior membranous sheath appears to give first by invaginating into the lumen.81 If lung volume were abnormally decreased (e.g., because of splinting) and expiration were still forced, the caliber of the airways would be relatively reduced at all times, which would cause the EPP and point of collapse to move progressively from larger to smaller air passages (closer to the alveolus).
In adults with normal lungs, airway closure can still occur even if exhalation is not forced, provided that residual volume is approached closely enough. Even in patients with normal lungs, as lung volume decreases toward residual volume during expiration, small airways (0.5 to 0.9 mm in diameter) show a progressive tendency to close, whereas larger airways remain patent.82,83 Airway closure occurs first in the dependent lung regions (as directly observed by computed tomography) because the distending transpulmonary pressure is less and the volume change during expiration is greater.32 Airway closure is most likely to occur in the dependent regions of the lung whether the patient is in the supine or the lateral decubitus position and whether ventilation is spontaneous or positive-pressure ventilation.32,84,85
Patients with Abnormal Lungs
In emphysema, the elastic recoil of the lung is reduced (to 1 cm H2O in Fig. 5-17 E), the air passages are poorly supported by the lung parenchyma, the point of airway resistance is close to the alveolus, and transmural ΔP can become negative quickly. Therefore, during only a mild forced expiration in an emphysematous patient, the EPP and the point of collapse are near the alveolus (see Fig. 5-17E). The use of pursed-lip or grunting expiration (the equivalents of partly closing the larynx during expiration), PEEP, and continuous positive airway pressure in an emphysematous patient restores a favorable (distending) intrathoracic transmural air ΔP (see Fig. 5-17F). In bronchitis, the airways are structurally weakened and may close when only a small negative transmural ΔP is present (as with mild forced expiration). In asthma, the middle-sized airways are narrowed by bronchospasm, and if expiration is forced, they are further narrowed by a negative transmural ΔP. Finally, with pulmonary interstitial edema, perialveolar interstitial edema compresses the alveoli and acutely decreases FRC; the peribronchial edema fluid cuffs (within the connective tissue sheaths around the larger arteries and bronchi) compress the bronchi and acutely increase closing volume.86–88
Measurement of Closing Capacity
CC is a sensitive test of early small-airways disease and is performed by having the patient exhale to residual volume (Fig. 5-18).89 As inhalation from residual volume toward TLC is begun, a bolus of tracer gas (e.g., xenon 133, helium) is injected into the inspired gas. During the initial part of this inhalation from residual volume, the first gas to enter the alveolus is the VD gas and the tracer bolus. The tracer gas enters only alveoli that are already open (presumably the apices of the lung) and does not enter alveoli that are already closed (presumably the bases of the lung). As the inhalation continues, the apical alveoli complete filling and the basilar alveoli begin to open and fill, but with gas that does not contain any tracer gas.
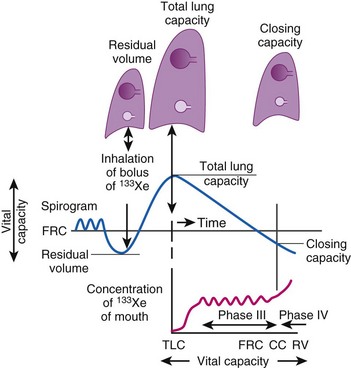
Figure 5-18 Measurement of closing capacity (CC) with the use of a tracer gas such as xenon 133 (133Xe). The bolus of tracer gas is inhaled near residual volume (RV) and, because of airway closure in the dependent lung, is distributed only to nondependent alveoli whose air passages are still open. During expiration, the concentration of tracer gas becomes constant after the dead space is washed out. This plateau (phase III) gives way to a rising concentration of tracer gas (phase IV), when there is once again closure of the dependent airways because the only contribution made to expired gas is by the nondependent alveoli with a high 133Xe concentration. FRC, Functional residual capacity; TLC, total lung capacity.
(Redrawn with modification from Lumb AB: Respiratory system resistance: Measurement of closing capacity. In Lumb AB, editor: Nunn’s applied respiratory physiology, ed 5, London, 2000, Butterworths, p 79.)
A differential tracer gas concentration is thus established, with the gas in the apices having a higher tracer concentration than that in the bases (see Fig. 5-18). As the subject exhales and the diaphragm ascends, a point is reached at which the small airways just above the diaphragm start to close and thereby limit airflow from these areas. The airflow now comes more from the upper lung fields, where the alveolar gas has a much higher tracer concentration, which results in a sudden increase in the tracer gas concentration toward the end of exhalation (phase IV of Fig. 5-18).
Closing volume (CV) is the difference between the onset of phase IV and residual volume; because it represents part of a vital capacity maneuver, it is expressed as a percentage of vital lung capacity. CV plus residual volume is known as CC and is expressed as a percentage of TLC. Smoking, obesity, aging, and the supine position increase CC.90 In healthy individuals at a mean age of 44 years, CC = FRC in the supine position, and at a mean age of 66 years, CC = FRC in the upright position.91
Relationship Between Functional Residual Capacity and Closing Capacity
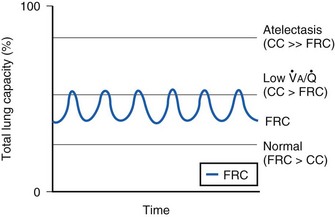
The relationship between FRC and CC is far more important than consideration of FRC or CC alone, because it is this relationship that determines whether a given respiratory unit is normal or atelectatic or has a low  ratio. The relationship between FRC and CC is as follows. When the volume of the lung at which some airways close is greater than the whole of VT, lung volume never increases enough during tidal inspiration to open any of these airways. As a result, these airways stay closed during the entire tidal respiration. Airways that are closed all the time are equivalent to atelectasis (Fig. 5-19). If the CV of some airways lies within VT, as lung volume increases during inspiration, some previously closed airways open for a short time until lung volume recedes once again below the CV of these airways. Because these opening and closing airways are open for a shorter time than normal airways are, they have less chance or time to participate in fresh gas exchange, a circumstance equivalent to a low-
 region. If the CC of the lung is below the whole of tidal respiration, no airways are closed at any time during tidal respiration; this is a normal circumstance. Anything that decreases FRC relative to CC or increases CC relative to FRC converts normal areas to low-
 and atelectatic areas,83 which causes hypoxemia.
 ) relationships or atelectasis. The abscissa is time.
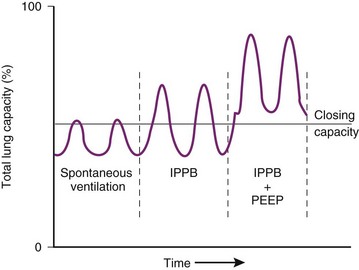
Mechanical intermittent positive-pressure breathing (IPPB) may be efficacious because it can take a previously spontaneously breathing patient with a low- relationship (in which CC is greater than FRC but still within VT, as depicted in Figure 5-20, right panel) and increase the amount of inspiratory time that some previously closed (at end-exhalation) airways spend in fresh gas exchange, thereby increasing
  (see Fig. 5-20, middle panel). However, if PEEP is added to IPPB, PEEP increases FRC to a lung volume equal to or greater than CC, thereby restoring a normal FRC-to-CC relationship so that no airways are closed at any time during the tidal respiration depicted in Figure 5-20 (left panel) (IPPB + PEEP). Thus, anesthesia-induced atelectasis (identified by crescent-shaped densities on computed tomography) in the dependent regions of patients’ lungs has not been reversed with IPPB alone but has been reversed with IPPB plus PEEP (5 to 10 cm H2O).32
D Oxygen and Carbon Dioxide Transport
1 Alveolar and Dead Space Ventilation and Alveolar Gas Tensions
In normal lungs, approximately two thirds of each breath reaches perfused alveoli to take part in gas exchange. This constitutes the effective or alveolar ventilation ( ). The remaining third of each breath takes no part in gas exchange and is therefore termed the total (or physiologic) dead space ventilation (VD). The relationship is as follows: alveolar ventilation (
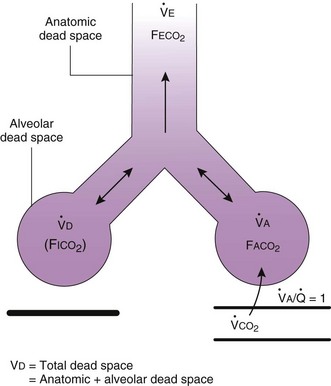
 ) = frequency (f) (VT − VD). The physiologic (or total) dead space ventilation (VDphysiologic) may be further divided into two components: a volume of gas that ventilates the conducting airways, the anatomic dead space (VDanatomic), and a volume of gas that ventilates unperfused alveoli, the alveolar dead space (VDalveolar). Clinical examples of VDalveolar ventilation include zone 1, pulmonary embolus, and destroyed alveolar septa; such ventilation does not participate in gas exchange. Figure 5-21 shows a two-compartment model of the lung in which the anatomic and alveolar dead space compartments have been combined into the total (physiologic) dead space compartment; the other compartment is the alveolar ventilation compartment, whose idealized
  ratio is 1.0.
 ). F
). F = alveolar ventilation;
  = carbon dioxide production;
  = expired minute ventilation.
  = 1 means that ventilation and perfusion are equal in liters per minute. Normally, the amount of CO2 eliminated at the airway (
 × F
× FThe VDanatomic varies with lung size and is approximately 2 mL/kg of body weight (150 mL in a 70-kg adult). In a normal healthy adult lying supine, VDanatomic and total VD are approximately equal to each other, because VDalveolar is normally minimal. In the erect posture, the uppermost alveoli may not be perfused (zone 1), and VDalveolar may increase from a negligible amount to 60 to 80 mL. Figure 5-21 illustrates that in a steady state, the volume of CO2 entering the alveoli ( ) is equal to the volume of CO2 eliminated in the expired gas, (
 )(FECO2), where
  = minute ventilation and FECO2 = fraction of expired CO2. Thus,
 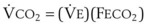 . However, the expired gas volume consists of alveolar gas, (
 )(FACO2), and
  gas, (
 )(FICO2), where FACO2 and FICO2 are the alveolar and inspired fractions of CO2, respectively. Thus,
 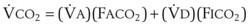 . Setting the first equation equal to the second equation and using the relationship,
  , subsequent algebraic manipulation, including setting PACO2 equal to PaCO2, results in the modified Bohr equation:

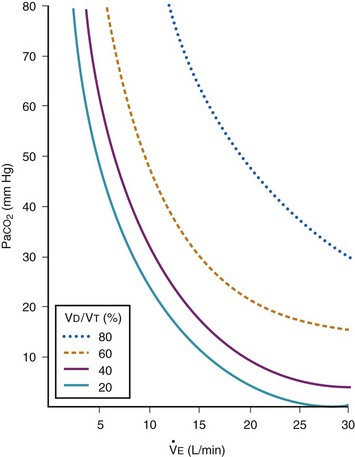
The CO2 tension in expired gas, PECO2, may be obtained by measuring exhaled CO2 in a large (Douglas) bag or, more commonly, by using end-tidal CO2 tension (PETCO2) as a surrogate. In severe lung disease, physiologic VD/VT provides a useful expression of the inefficiency of ventilation. In a healthy adult, this ratio is usually less than 30%; that is, ventilation is more than 70% efficient. In a patient with COPD, VD/VT may increase to 60% to 70%. Under these conditions, ventilation is obviously grossly inefficient. Figure 5-22 shows the relationship between  and PaCO2 for several VD/VT values. As
  decreases, PaCO2 increases for all VD/VT values. As VD/VT increases, a given decrease in
  causes a much greater increase in PaCO2. If PaCO2 is to remain constant while VD/VT increases,
  must increase more.
 , L/min) and arterial partial pressure of carbon dioxide (Pa
 values. See equation (10) in the text.
 . Thus, for gas X during dry conditions, P
 (output or uptake)/
 , where P
 = output or uptake of gas X, and
  = alveolar ventilation.
For CO2, PACO2 = 713(FICO2 +  ). Because FICO2 = 0 and using standard conversion factors:
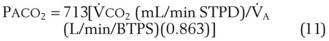

For example, 100 mm Hg = 713(0.21 – 225/3200).
Figure 5-23 shows the hyperbolic relationships expressed in equations (10) and (11) between PaCO2 and  (see Fig. 5-22) and between PAO2 and
  for different levels of
  and
and  , respectively. PaCO2 is substituted for PACO2 because PACO2-to-PaCO2 gradients are small (as opposed to PAO2-to-Pao2 gradients, which can be large). Note that as
  increases, the second term on the right side of equations (11) and (12) approaches zero and the composition of the alveolar gas approaches that of the inspired gas. In addition, Figures 5-22 through Figure 5-24 show that, because anesthesia is usually administered with an oxygen-enriched gas mixture, hypercapnia is a more common result of hypoventilation than hypoxemia is.
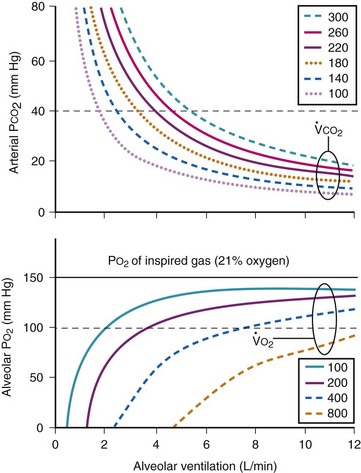
 ). Bottom, The relationship between alveolar ventilation and alveolar oxygen tension (P
 ). Values are derived from equations (10) and (11) in the text, and the curves are hyperbolic. As alveolar ventilation increases, P
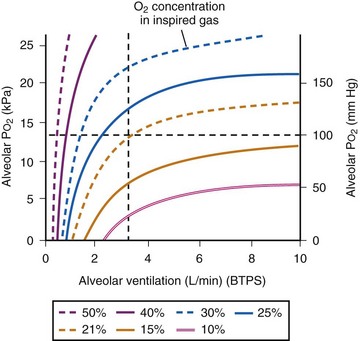
2 Oxygen Transport
a Overview
The principal function of the heart and lungs is supporting O2 delivery to and CO2 removal from the tissues in accordance with metabolic requirements while maintaining arterial blood O2 and CO2 partial pressures within a narrow range. The respiratory and cardiovascular systems are linked in series to accomplish this function over a wide range of metabolic requirements, which may increase 30-fold from rest to heavy exercise. The functional links in the O2 transport chain are as follows: (1) ventilation and distribution of ventilation with respect to perfusion, (2) diffusion of O2 into blood, (3) chemical reaction of O2 with Hb, (4) total cardiac output of arterial blood, and (5) distribution of blood to tissues and release of O2 (Table 5-3). The system is seldom stressed except at exercise, and the earliest symptoms of cardiac or respiratory diseases are often seen only during exercise.
TABLE 5-3 Functional Capacities and Potential Maximum O2 Transport of Each Link in the O2 Transport Chain in Normal Humans* at Sea Level
| Link in Chain | Functional Capacity in Normal Humans | Theoretical Maximum O2 Transport Capacity |
|---|---|---|
| Ventilation | 200 L/min (MVV) | 0.030 × MVV = 6.0 L O2/min |
| Diffusion and chemical reaction | DLO2 = 6.1 L O2/min | |
| Cardiac output | 20 L/min | |
| O2 extraction | 75% | 0.16 × Cardiac output = 3.2 L O2/min |
(CaO2 −  difference) difference) |
(16 mL O2/100 mL or 0.16) |
CaO2 −  , Arteriovenous O2 content difference; DLO2, diffusing capacity of lung for oxygen; MVV, maximum voluntary ventilation.
* Hemoglobin = 15 g/dL; physiologic dead space in percentage of tidal volume = 0.25; partial alveolar pressure of oxygen >110 mm Hg.
From Cassidy SS: Heart-lung interactions in health and disease. Am J Med Sci 30:451–461, 1987.
The maximum functional capacity of each link can be determined independently. Table 5-3 lists these measured functional capacities for healthy, young men. Because theoretical maximal O2 transport at the ventilatory step or at the diffusion and chemical reaction step (approximately 6 L/min in healthy humans at sea level) exceeds the O2 transportable by the maximum cardiac output and distribution steps, the limit to O2 transport is the cardiovascular system. Respiratory diseases would not be expected to limit maximum O2 transport until functional capacities are reduced by 40% to 50%.
b Oxygen-Hemoglobin Dissociation Curve
The oxy-Hb dissociation curve relates the saturation of Hb (rightmost y-axis in Fig. 5-25) to PAO2. Hb is fully saturated (100%) by a PO2 of approximately 700 mm Hg. The saturation at normal arterial pressure (point a on upper, flat part of the oxy-Hb curve in Figure 5-25) is 95% to 98%, achieved by a PaO2 of about 90 to 100 mm Hg. When PO2 is less than 60 mm Hg (90% saturation), saturation falls steeply, and the amount of Hb uncombined with O2 increases greatly for a given decrease in PO2. Mixed venous blood has a PO2 ( ) of about 40 mm Hg and is approximately 75% saturated, as indicated by the middle of the three points (
 ) on the oxy-Hb curve in Figure 5-25.
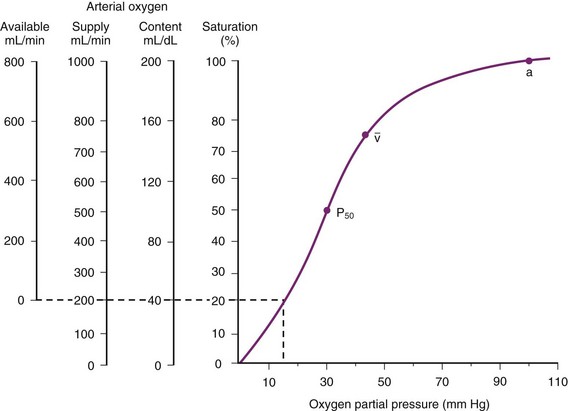
 , normal mixed venous pressure; P50, the partial pressure (27 mm Hg) at which hemoglobin is 50% saturated.
The oxy-Hb curve can also relate the O2 content (CO2) (vol%, or mL of O2 per dL of blood; see Fig. 5-25) to PO2. Oxygen is carried both in solution in plasma (0.003 mL of O2/mm Hg PO2 per dL) and combined with Hb (1.39 mL of O2/g of Hb), to the extent (percentage) that Hb is saturated. Therefore,

 of 40 mm Hg, the arterial O2 content (Ca
 ) = (1.39)(15)(0.75) + (0.003)(40) = 15.6 + 0.1 = 15.7 mL/dL. Therefore, the normal arteriovenous O2 content difference is approximately 5.5 mL/dL of blood.
Note that equation (13) uses the constant 1.39, which means that 1 g of Hb can carry 1.39 mL of O2. Controversy exists over the magnitude of this number. Originally, 1.34 had been used,92 but with determination of the molecular weight of Hb (64,458), the theoretical value of 1.39 became popular.93 After extensive human studies, Gregory observed in 1974 that the applicable value was 1.31 mL O2/g of Hb in human adults.94 That the clinically measured CO2 is lower than the theoretical 1.39 is probably due to the small amount of methemoglobin (MetHb) and carboxyhemoglobin (COHb) normally present in blood.
The oxy-Hb curve can also relate O2 transport (L/min) to the peripheral tissues (see Fig. 5-25) to PO2. The term O2 transport is synonymous with the term O2 delivery. This value is obtained by multiplying the O2 content by  (O2 transport =
  × CaO2). To do this multiplication, one must convert the content unit of mL/dL to mL/L by multiplying by 10; subsequent multiplication of mL/L against
  in L/min yields mL/min. Thus, if
  = 5 L/min and CaO2 = 20 mL of O2/dL, the arterial point corresponds to 1000 mL O2/min going to the periphery, and the venous point corresponds to 750 mL O2/min returning to the lungs, with
  = 250 mL/min.
The oxy-Hb curve can also relate the O2 actually available to the tissues (leftmost y axis in Fig. 5-25) as a function of PO2. Of the 1000 mL/min of O2 normally going to the periphery, 200 mL/min of O2 cannot be extracted because it would lower PO2 below the level at which organs such as the brain can survive (rectangular dashed line in Fig. 5-25); the O2 available to tissues is therefore 800 mL/min. This amount is approximately three to four times the normal resting  . When
  = 5 L/min and arterial saturation is less than 40%, the total flow of O2 to the periphery is reduced to 400 mL/min; the available O2 is then 200 mL/min, and O2 supply just equals O2 demand. Consequently, with low arterial saturation, tissue demand can be met only by an increase in
  or, in the longer term, by an increase in Hb concentration.
The affinity of Hb for O2 is best described by the PO2 level at which Hb is 50% saturated (P50) on the oxy-Hb curve. The normal adult P50 is 26.7 mm Hg (see Fig. 5-25).
The effect of a change in PO2 on Hb saturation is related to both P50 and the portion of the oxy-Hb curve at which the change occurs.95 In the region of normal PaO2 (75 to 100 mm Hg), the curve is relatively horizontal, and shifts of the curve have little effect on saturation. In the region of mixed venous PO2, where the curve is relatively steep, a shift of the curve leads to a much greater difference in saturation. A P50 lower than 27 mm Hg describes a left-shifted oxy-Hb curve, which means that at any given PO2, Hb has a higher affinity for O2 and is therefore more saturated than normal. This lower P50 may require higher than normal tissue perfusion to produce the normal amount of O2 unloading. Causes of a left-shifted oxy-Hb curve are alkalosis (metabolic and respiratory—the Bohr effect), hypothermia, abnormal fetal Hb, carboxyhemoglobin, methemoglobin, and decreased RBC 2,3-diphosphoglycerate (2,3-DPG) content. (The last condition may occur with the transfusion of old acid citrate-dextrose–stored blood; storage of blood in citrate-phosphate-dextrose minimizes changes in 2,3-DPG with time.95) A P50 higher than 27 mm Hg describes a right-shifted oxy-Hb curve, which means that at any given PO2, Hb has a low affinity for O2 and is less saturated than normal. This higher P50 may allow a lower tissue perfusion than normal to produce the normal amount of O2 unloading. Causes of a right-shifted oxy-Hb curve are acidosis (metabolic and respiratory—the Bohr effect), hyperthermia, abnormal Hb, increased RBC 2,3-DPG content, and inhaled anesthetics (see later discussion).95 Abnormalities in acid-base balance result in alteration of 2,3-DPG metabolism to shift the oxy-Hb curve to its normal position. This compensatory change in 2,3-DPG requires between 24 and 48 hours. Therefore, with acute acid-base abnormalities, O2 affinity and the position of the oxy-Hb curve change. However, with more prolonged acid-base changes, the reciprocal changes in 2,3-DPG levels shift the oxy-Hb curve and O2 affinity back toward normal.95
Many inhaled anesthetics have been shown to shift the oxy-Hb dissociation curve to the right.96 Isoflurane shifts P50 to the right by 2.6 ± 0.07 mm Hg at a vapor pressure of approximately 1 minimum alveolar concentration (MAC) (1.25%).97 On the other hand, high-dose fentanyl, morphine, and meperidine do not alter the position of the curve.
c Effect of  on Alveolar Oxygen Tension
PAO2 is directly related to FIO2 in normal patients. PAO2 and FIO2 also correspond to PaO2 when there is little to no right-to-left transpulmonary shunt ( ). Figure 5-26 shows the relationship between FIO2 and PaO2 for a family of right-to-left transpulmonary shunts; the calculations assume a constant and normal
  and PaCO2. With no
  , a linear increase in FIO2 results in a linear increase in PAO2 (solid straight line). As the shunt is increased, the
  lines relating FIO2 to PaO2 become progressively flatter.98 With a shunt of 50% of
  , an increase in FIO2 results in almost no increase in PaO2. The solution to the problem of hypoxemia secondary to a large shunt is not increasing the FIO2 but rather causing a reduction in the shunt (e.g., PEEP, patient positioning, suctioning, fiberoptic bronchoscopy, diuretics, antibiotics).
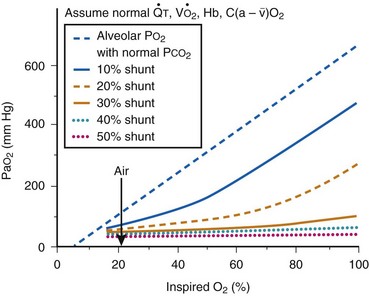
 ), hemoglobin (Hb), oxygen consumption (
 ), and arteriovenous oxygen content differences [C(a −
  )
)d Effect of  and
and  on Arterial Oxygen Content
In addition to an increased  , CaO2 is decreased by decreased
  (for a constant
  ) and by increased
  (for a constant
  ). In either case, along with a constant right-to-left shunt, the tissues must extract more O2 from blood per unit blood volume, and therefore,
  must primarily decrease (Fig. 5-27). When blood with lower
  passes through whatever shunt exists in the lung and remains unchanged in its
  , it must inevitably mix with oxygenated end-pulmonary capillary blood (c′ flow) and secondarily decrease CaO2. The amount of O2 flowing per minute through any particular lung channel, as depicted in Figure 5-27, is a product of blood flow times the O2 content of that blood. Thus,
 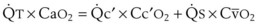 . With
 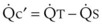 and further algebraic manipulation,99
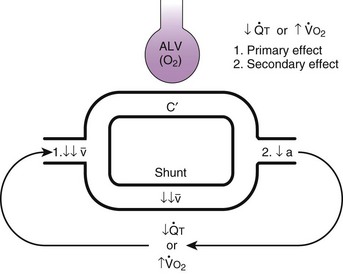
 ) or an increase in oxygen consumption (
 ) on mixed venous and arterial oxygen content. Mixed venous blood (
 ) either perfuses ventilated alveolar capillaries (ALV) and becomes oxygenated end-pulmonary capillary blood (c′), or it perfuses whatever true shunt pathways exist and remains the same in composition (i.e., desaturated). These two pathways must ultimately join together to form mixed arterial (a) blood. If
  decreases or
  increases, or both, the tissues must extract more oxygen per unit volume of blood than under normal conditions. Thus, the primary effect of a decrease in
  or an increase in
  is a decrease in mixed venous oxygen content. The mixed venous blood with a decreased oxygen content must flow through the shunt pathway as before (which may remain constant in size) and lower the arterial content of oxygen. Thus, the secondary effect of a decrease in
  or an increase in
  is a decrease in arterial oxygen content.
The larger the intrapulmonary shunt, the greater is the decrease in CaO2, because more venous blood with lower  can admix with end-pulmonary capillary blood (c′) (see Fig. 5-37).100,101 Therefore, the alveolar-arterial oxygen difference P(A − a)O2 is a function both of the size of the
  and of what is flowing through the
  —namely,
  —and
—and  is a primary function of
  and
and  . Figure 5-28 shows the equivalent circuit of the pulmonary circulation in a patient with a 50% shunt, a normal
  of 15 mL/dL, and a moderately low CaO2 of 17.5 mL/dL. Decreasing
  or increasing
  , or both, causes a larger primary decrease in
  to 10 mL/dL and a smaller but still significant secondary decrease in CaO2 to 15 mL/dL; the ratio of change in
  to change in CaO2 in this example of 50%
  is 2 : 1.
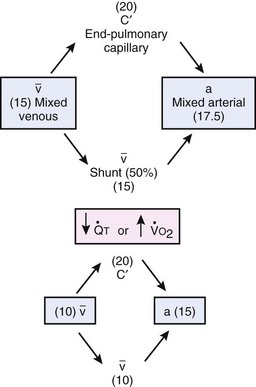
 ) or an increase in O2 consumption (
 ) can cause a decrease in mixed venous oxygen content, from 15 to 10 mL/dL in this example, which in turn causes a decrease in the arterial content of oxygen, from 17.5 to 15.0 mL/dL). In this 50% shunt example, the decrease in mixed venous oxygen content was twice the decrease in arterial oxygen content.
If a decrease in  or an increase in
  is accompanied by a decrease in
  , there may be no change in PaO2 (i.e., a decreasing effect on PaO2 is offset by an increasing effect on PaO2) (Table 5-4). These changes sometimes occur in diffuse lung disease. However, if a decrease in
  or an increase in
  is accompanied by an increase in
  , PaO2 may be greatly decreased (i.e., a decreasing effect on PaO2 is compounded by another decreasing effect on PaO2). These changes sometimes occur in regional ARDS and atelectasis.102
TABLE 5-4 Relationship Between Cardiac Output ( ), Shunt (
 ), and Venous (
 ) and Arterial (PaO2) Oxygenation
| Changes | Clinical Situation |
|---|---|
If  ↓ → ↓ ↓ → ↓  and and  = 0 → PaO2↓ = 0 → PaO2↓ |
Decreased cardiac output, stable shunt |
If  ↓ → ↓ ↓ → ↓  and and  ↓ → PaO2 = 0 ↓ → PaO2 = 0 |
Application of PEEP in ARDS |
If  ↓ → ↓ ↓ → ↓  and and  ↑ → PaO2 ↓↓ ↑ → PaO2 ↓↓ |
Shock combined with ARDS or atelectasis |
ARDS, Adult respiratory distress syndrome; 0, no change; PEEP, positive end-expiratory pressure; ↓, decrease; ↑, increase.
e Fick Principle
 and states that the amount of O2 consumed by the body (
 ) is equal to the amount of O2 leaving the lungs (
 )(Ca
)(Ca )(
)( ):
):
Condensing the content symbols yields the usual expression of the Fick equation:

This equation states that O2 consumption is equal to  times the arteriovenous O2 content difference [C(a −
  ) O2]. Normally, (5 L/min)(5.5 mL)/dL = 0.27 L/min (see “Oxygen-Hemoglobin Dissociation Curve”).

 ) is equal to the amount of O2 brought into the lungs by ventilation (
 )(F
)(F )(F
)(F is expired minute ventilation and F
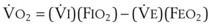 . Because the difference between
  and
and  is due to the difference between
  (normally 250 mL/min) and
  (normally 200 mL/min) and is only 50 mL/min (see later discussion),
  essentially equals
  .
. = 5.0 L/min(0.21 − 0.16) = 0.25 L/min. In determining
  in this way,
  can be measured with a spirometer, F
 on Pa
on Pa . If
. If  remains constant (K) and
  decreases (↓), the arteriovenous O2 content difference has to increase (↑):
The C(a −  )O2 difference increases because a decrease in
  causes a much larger and primary decrease in
  versus a smaller and secondary decrease in CaO2, as follows101:
Thus,  and
and  are much more sensitive indicators of
  because they change more with changes in
  than CaO2 (or PaO2) does (see Figs. 5-27 and 5-37).
3 Carbon Dioxide Transport
 ) parallels O2 consumption (
 ) according to the respiratory quotient (RQ):
In plasma, CO2 exists both in physical solution and as H2CO3:
 (18)
(18)The CO2 in solution can be related to PCO2 by the use of Henry’s law.103

 (20)
(20) HHb). The HCO3− produced passes out of the RBC into plasma to perform its function as a buffer. To maintain electrical neutrality within the RBC, chloride ion (−) moves in as HCO3− moves out (− shift). Finally, CO2 can combine with Hb in the erythrocyte (to produce Hb-CO2). Again, as in HCO3− release, an H+ ion is formed in the reaction of CO2 and Hb. This H+ ion is also buffered by Hb.
4 Bohr and Haldane Effects
Just as the percent saturation of Hb with O2 is related to PO2 (described by the oxy-Hb curve), so the total CO2 in blood is related to PCO2. In addition, Hb has variable affinity for CO2; it binds more avidly in the reduced state than as oxy-Hb.95 The Bohr effect describes the effect of PCO2 and [H+] ions on the oxy-Hb curve. Hypercapnia and acidosis both shift the curve to the right (reducing the O2-binding affinity of hemoglobin), and hypocapnia and alkalosis both shift the curve to the left. Conversely, the Haldane effect describes the shift in the CO2 dissociation curve caused by oxygenation of Hb. Low PO2 shifts the CO2 dissociation curve to the left so that the blood is able to pick up more CO2 (as occurs in capillaries of rapidly metabolizing tissues). Conversely, oxygenation of Hb (as occurs in the lungs) reduces the affinity of Hb for CO2, and the CO2 dissociation curve is shifted to the right, thereby increasing CO2 removal.
E Pulmonary Microcirculation, Interstitial Space, and Fluid (Pulmonary Edema)
The ultrastructural appearance of an alveolar septum is depicted schematically in Figure 5-29.104 Capillary blood is separated from alveolar gas by a series of anatomic layers: capillary endothelium, endothelial basement membrane, interstitial space, epithelial basement membrane, and alveolar epithelium (of the type I pneumocyte).
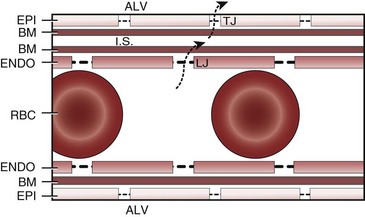
On one side of the alveolar septum (the thick, upper, fluid- and gas-exchanging side), the epithelial and endothelial basement membranes are separated by a space of variable thickness containing connective tissue fibrils, elastic fibers, fibroblasts, and macrophages. This connective tissue is the backbone of the lung parenchyma; it forms a continuum with the connective tissue sheaths around the conducting airways and blood vessels. Thus, the pericapillary perialveolar interstitial space is continuous with the interstitial tissue space that surrounds terminal bronchioles and vessels, and both spaces constitute the connective tissue space of the lung. There are no lymphatics in the interstitial space of the alveolar septum. Instead, lymphatic capillaries first appear in the interstitial space surrounding terminal bronchioles, small arteries, and veins.105
The opposite side of the alveolar septum (the thin, down, gas-exchanging-only side) contains only fused epithelial and endothelial basement membranes. The interstitial space is greatly restricted on this side because of fusion of the basement membranes. Interstitial fluid cannot separate the endothelial and epithelial cells from one another. As a result the space and distance barrier to fluid movement from the capillary to the alveolar compartment is reduced; it is composed of only the two cell linings with their associated basement membranes.106
Between the individual endothelial and epithelial cells are holes or junctions that provide a potential pathway for fluid to move from the intravascular space to the interstitial space and finally from the interstitial space to the alveolar space (see Fig. 5-29). The junctions between endothelial cells are relatively large and are therefore termed “loose”; the junctions between epithelial cells are relatively small and are therefore termed “tight.” Pulmonary capillary permeability is a direct function of, and essentially equivalent to, the size of the holes in the endothelial and epithelial linings.
The concepts of a continuous connective tissue sheath–alveolar septum interstitial space and a negative interstitial space ΔP are prerequisite to understanding interstitial fluid kinetics. After entering the lung parenchyma, both the bronchi and the arteries run within a connective tissue sheath that is formed by an invagination of the pleura at the hilum and ends at the level of the bronchioles (Fig. 5-30A).This results in a potential perivascular space between the arteries and the connective tissue sheath and a potential peribronchial space between the bronchi and the connective tissue sheath. The negative pressure in the pulmonary tissues surrounding the perivascular connective tissue sheath exerts a radial outward traction force on the sheath. This radial traction creates negative pressure within the sheath that is transmitted to the bronchi and arteries and tends to hold them open and increase their diameters.106 The alveolar septum interstitial space is the space between the capillaries and alveoli (or, more precisely, the space between the endothelial and epithelial basement membranes) and is continuous with the interstitial tissue space that surrounds the larger arteries and bronchi. Studies indicate that the alveolar interstitial pressure is also uniquely negative but not as much so as the negative interstitial space pressure around the larger arteries and bronchi.107
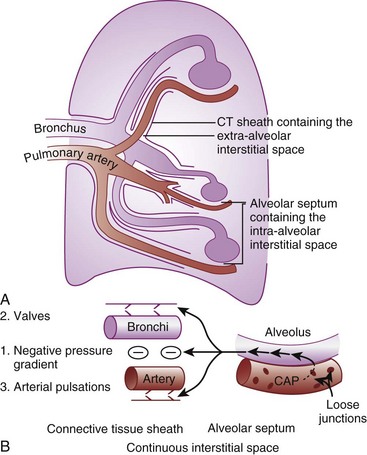
 (21)
(21)Negative (subatmospheric) interstitial space pressure would promote, by suction, a slow loss of fluid across the endothelial holes.108 Indeed, extremely negative pleural (and perivascular hydrostatic) pressure, such as may occur in a vigorously spontaneously breathing patient with an obstructed airway, can cause pulmonary interstitial edema (Box 5-1).109 Relative to the vertical level of the junction of zones 2 and 3, as lung height decreases (lung dependence), absolute Pinside increases, and fluid has a propensity to transudate; as lung height increases (lung nondependence), absolute Pinside decreases, and fluid has a propensity to be reabsorbed. However, fluid transudation induced by an increase in Pinside is limited by a concomitant dilution of proteins in the interstitial space and therefore a decrease in πoutside.110 Any change in the size of the endothelial junctions, even if the foregoing four forces remain constant, changes the magnitude and perhaps even the direction of fluid movement. Increased size of endothelial junctions (increased permeability) promotes transudation, whereas decreased size of endothelial junctions (decreased permeability) promotes reabsorption.
No lymphatics are present in the interstitial space of the alveolar septum. The lymphatic circulation starts as blind-ended lymphatic capillaries, first appearing in the interstitial space sheath surrounding terminal bronchioles and small arteries, and ends at the subclavian veins. Interstitial fluid is normally removed from the alveolar interstitial space into the lymphatics by a sump (pressure gradient) mechanism, which is caused by the presence of more negative pressure surrounding the larger arteries and bronchi.3,111 The sump mechanism is aided by the presence of valves in the lymph vessels. In addition, because the lymphatics run in the same sheath as the pulmonary arteries, they are exposed to the massaging action of arterial pulsations. The differential negative pressure, the lymphatic valves, and the arterial pulsations all help propel the lymph proximally toward the hilum through the lymph nodes (pulmonary to bronchopulmonary to tracheobronchial to paratracheal to scalene and cervical nodes) to the central venous circulation depot (see Fig. 5-30B). An increase in central venous pressure, which is the backpressure for lymph to flow out of the lung, would decrease lung lymph flow and perhaps promote pulmonary interstitial edema.