[level-membership-for-cardiothoracic-surgery-category]
Chapter 1 Physiology and Pathophysiology
In this chapter the physiologic principles relating to conditions and treatments encountered in the cardiothoracic intensive care unit (ICU) are reviewed. Most of the topics relate to the cardiovascular system, but some coverage of the respiratory and renal systems is also included. The physiology of acid/base homeostasis and water and electrolyte balance is covered in Chapters 31 and Chapter 32, respectively.
ELECTRICAL ACTIVITY OF THE HEART
Cardiac Action Potential
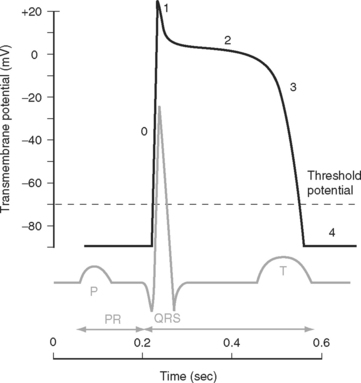
An increase in the membrane potential (i.e., the inside becomes less negative) is called depolarization; a decrease in the membrane potential (i.e., the inside becomes more negative) is called repolarization. Action potentials are cycles of depolarization and repolarization and are the result of minute ion fluxes across the membrane due to changes in the permeability of the membrane to different ions. Alterations in membrane ion permeability are achieved by the opening and closing of transmembrane ion channels. Many of the channels are voltage gated, which means that they open when the membrane potential reaches a certain value.
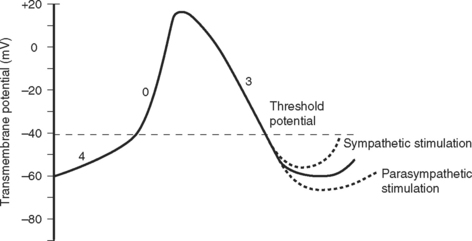
Two basic types of cardiac action potential are recognized: fast action potentials (Fig. 1-1), which occur predominantly in atrial and ventricular myocytes, and slow action potentials (Fig. 1-2), which occur in pacemaker cells of the sinoatrial (SA) and atrioventricular (AV) nodes.
Action Potential in Cardiac Muscle Cells
A cardiac action potential is transmitted deep within the myocyte by invaginations of the cell membrane known as T tubules. The entry of calcium into the cell during an action potential leads to the release of calcium from the sarcoplasmic reticulum into the cytoplasm of the myocyte, precipitating muscular contraction.
Cardiac Conducting System
Relationship between the Action Potential and the Electrocardiogram
The electrocardiogram (ECG) is the surface recording of the electrical activity of the heart. (Its interpretation is described in Chapter 8.) The relationship between the action potential and the ECG is shown in Figure 1-1. The P wave corresponds to depolarization of the atria during late ventricular diastole. The PR interval is the time from the onset of atrial activation to the onset of ventricular activation—a significant portion of which is taken up by the delay through the AV node. The QRS complex corresponds to ventricular depolarization. The ST segment spans the time when the ventricular myocytes are in phase 2 (plateau) of their action potentials, and the T wave corresponds to ventricular repolarization.
Control of Heart Rate and Cardiac Conduction
The electric activity in the heart is controlled by the autonomic nervous system and circulating epinephrine. Parasympathetic stimulation via the vagus nerve causes the release of acetylcholine that binds to muscarinic receptors on cells within the SA and AV nodes, leading to an increase in potassium permeability within these cells. Increased potassium permeability hyperpolarizes the cell membrane (meaning the membrane potential becomes more negative) and reduces the slope of phase 4 of the action potential (see Fig. 1-2), thus reducing heart rate and prolonging conduction through the AV node (↑PR interval). Intense vagal stimulation (e.g., during laryngoscopy) can lead to asystole (SA block) or complete heart block (AV block).
Sympathetic stimulation causes the release of norepinephrine, which activates β1 receptors on the cellular membrane. This leads to decreased potassium permeability and increased calcium and sodium permeability, which reduces the extent of repolarization and increases the slope of phase 4 in pacemaker cells (see Fig. 1-2), thus increasing heart rate and shortening the PR interval. Sympathetic nervous system activation also causes increased excitability throughout the entire conducting system.
A completely denervated heart has a resting rate of about 100 beats/min, this being the intrinsic rate of discharge of the SA node. The normal resting heart rate is 60 to 70 beats/min, indicating that parasympathetic tone dominates in the normal heart at rest. Abnormalities of impulse generation and conduction are discussed in Chapter 21.
Cardiac Cycle
The cardiac cycle is divided into ventricular systole (contraction and ejection) and ventricular diastole (relaxation and filling) (Fig. 1-3).
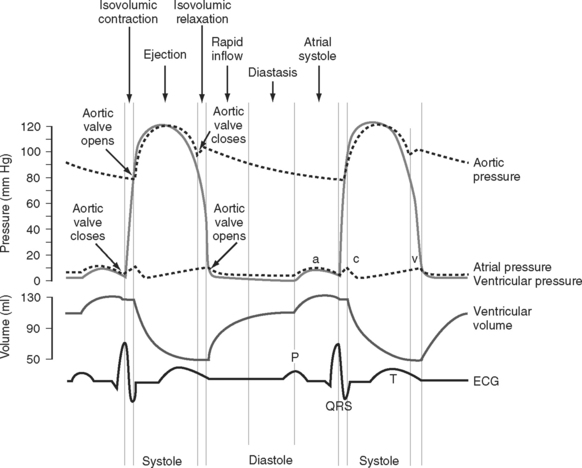
Diastole
In various disease states diastolic filling is abnormal. For instance, with mitral stenosis a high proportion of ventricular filling occurs late in diastole. In this circumstance, shortening of diastole due to tachycardia or loss of atrial systole due to the development of atrial fibrillation can cause marked hemodynamic compromise. A similar situation exists when active relaxation is prolonged (e.g., due to myocardial ischemia or left ventricular hypertrophy). Conversely, in some circumstances (e.g., restrictive cardiomyopathy) a greater proportion of diastolic filling occurs early in diastole. In this circumstance, cardiac output may be improved with modest tachycardia. Diastolic dysfunction is discussed in Chapter 20.
Pressure-volume Loops
A useful way of evaluating cardiac function experimentally is by plotting ventricular pressure against ventricular volume throughout the cardiac cycle (Fig. 1-4). Families of pressure-volume loops can be generated under different physiologic conditions. Stroke volume (SV) is the difference between the end-diastolic volume (EDV; see Fig. 1-4, position b) and the end-systolic volume (ESV; see Fig. 1-4, position d). Ejection fraction (EF) is the proportion of the end-diastolic volume that is ejected during systole:
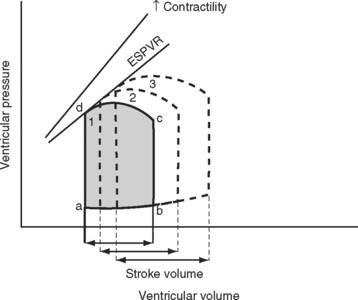
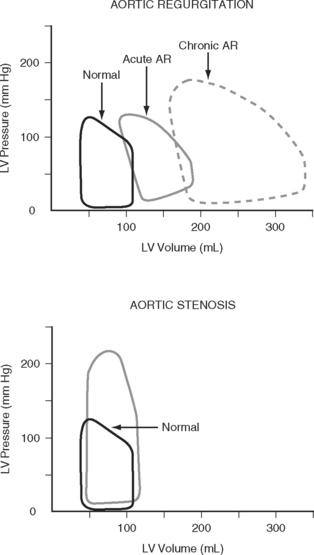
The area bound by the pressure volume-loop gives myocardial work. Characteristic changes in the pressure-volume loop are seen with alterations in the loading conditions or contractile function of the ventricle and with disease (Figs. 1-4, 1-5, 1-6, and 1-7).
Determinants of Cardiac Output
Cardiac output is the product of stroke volume and heart rate. Stroke volume is determined by preload, afterload, and contractility. Cardiac output may be divided by body surface area to obtain the cardiac index. The normal value for cardiac output in awake normotensive subjects is 1.9 to 3.5 L/min/m2 (see Chapter 8).
Preload
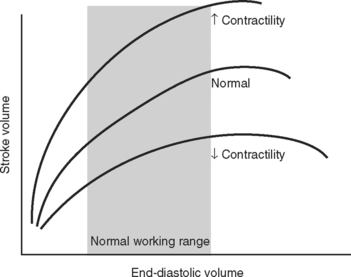
The functional contractile unit of the myocyte is the sarcomere, which is composed of overlapping thick and thin filaments. The thick filaments contain the protein myosin; the thin filaments contain the proteins actin, tropomyosin, and the troponin complex. Activation of the troponin complex by calcium leads to binding between actin and myosin and contraction of the sarcomere. The force of contraction is partly dependent on the degree of overlap of the thick and thin filaments. In the resting state the sarcomere is 1.8 to 2.0 μm long. Maximum overlap of the filaments occurs at a sarcomere length of about 2.3 μm—that is, when the sarcomere is prestretched above its resting length. This property of the sarcomere underlies the Starling law of the heart, which states that the degree of fiber stretch at end-diastole (preload) determines the force of contraction. In the intact heart, this is represented by the relationship between end-diastolic volume and stroke volume and can be displayed as a ventricular function curve (Fig. 1-8). Over the physiologic range, the relationship is relatively linear; thus, the ejection fraction, which is the slope of the ventricular function curve (SV/EDV), is relatively preload independent. In the ICU, left ventricular end-diastolic volume (or its surrogate, end-diastolic area) may be estimated by echocardiography. The effect of increasing preload on the pressure-volume loop is shown in Figure 1-4.
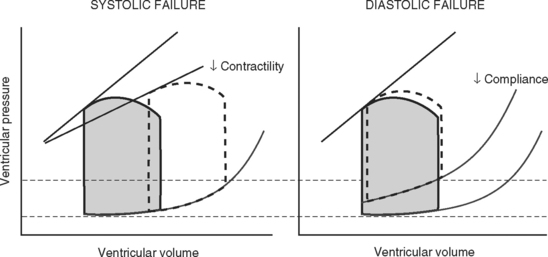
Left Ventricular Compliance
Because end-diastolic pressure is related to end-diastolic volume through the passive pressure-volume relationship (see Fig. 1-6), end-diastolic pressure is used as a surrogate for end-diastolic volume as a measure of preload. Clinically, left ventricular end-diastolic pressure is usually inferred from the pulmonary artery wedge pressure (PAWP; Chapter 8), which is obtained by means of a pulmonary artery catheter. Unfortunately, the relationship between end-diastolic volume and end-diastolic pressure (ventricular compliance) is not linear. At high ventricular volumes, a small increase in end-diastolic volume is associated with a big increase in end-diastolic pressure (see Fig. 1-6). Furthermore, left ventricular compliance may be altered by disease. For example, compliance is decreased in aortic stenosis and increased in aortic regurgitation (see Fig. 1-7). In some situations, an increase in filling pressure may actually be associated with a reduction in preload (e.g., pericardial tamponade). Thus, the estimation of preload from the PAWP may be misleading (see Chapter 8).1,2
Ventricular Interactions
Afterload
Afterload can be defined as ventricular wall stress during systole. It is determined by the impedance to ejection and ventricular geometry. Wall stress can be calculated by using the Laplace law:
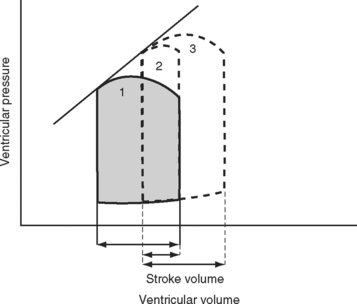
A sudden increase in afterload is associated with an immediate fall in stroke volume. Over the next few beats, stoke volume gradually recovers due to increased diastolic ventricular volume (see Fig. 1-5). However, patients with congestive cardiac failure who are operating on the plateau part of their ventricular function curve (see Fig. 1-8) are unable to increase stroke volume by increasing preload—that is, they have reduced preload reserve. Thus, in patients with congestive cardiac failure, increased afterload (e.g., due to phenylephrine) can cause a precipitous fall in cardiac output. Indeed, afterload reduction is a fundamental principle of the treatment of left ventricular failure.
Contractility
Contractility is the intrinsic contractile function of the ventricle, independent of preload and afterload. Alterations in contractility are shown on the ventricular function curve in Figure 1-8. An increase in contractility shifts the curve upward and to the left, resulting in an increased stroke volume for a given end-diastolic volume; a decrease in contractility shifts the curve downward and to the right, resulting in reduced stoke volume for the same end-diastolic volume.
Experimentally, contractility may be evaluated by pressure-volume loops. If a number of loops are obtained by varying preload, the coordinates at end-systole form a straight line, known as the end-systolic pressure/volume relationship. The slope of this line is a reasonably load-independent measure of contractility (see Figs. 1-4 and 1-6). Unfortunately, there is no simple method of assessing contractility clinically. Ejection fraction and cardiac output, the commonly used clinical parameters of cardiac performance, are influenced by loading conditions, as explained subsequently.
The force of contraction of a given degree of myocyte overlap is determined by the cytoplasmic concentration of calcium, and this is the basis of alterations in contractility. The intracellular calcium concentration is regulated mainly by the activity of the sympathetic nervous system and circulating epinephrine. Physiologic and pharmacologic control of contractility is discussed in Chapter 3.
Myocardial Dysfunction
Potentially reversible cardiac dysfunction can occur as a consequence of myocardial ischemia, stunning or hibernation, or remodeling.7 Irreversible myocardial dysfunction occurs due to myocyte loss caused by infarction or replacement (e.g., with amyloid or fibrotic tissue).
Ischemia, Stunning, and Hibernation
Relief of ischemia does not always result in an immediate return of contractile function. Myocardial stunning is temporary myocardial dysfunction that persists following the resolution of an ischemic episode (postischemic dysfunction). This dysfunction occurs in the presence of normal, or near normal, coronary blood flow and in the absence of irreversible cellular damage. Return of contractile function occurs over a period of hours to days. Myocardial stunning arises primarily from reperfusion injury. The mechanisms of reperfusion injury and myocardial stunning are incompletely understood, but they involve the generation of oxygen-derived free radicals (e.g., superoxide, peroxynitrite), altered concentration and sensitivity to intracellular calcium, and endothelial dysfunction.3,4 Myocardial stunning is encountered in a number of clinical situations, such as after cardiopulmonary bypass and subsequent to reperfusion therapy for an acute coronary syndrome.
Hibernating myocardium is a state of chronic ischemic dysfunction. Hibernating myocardium was initially thought to be caused by low baseline blood flow. However, it is now recognized that baseline blood flow may be near normal and that the primary problem is reduced vasodilator reserve. Small increases in oxygen demand can then provoke acute ischemia that is typically painless.5 As with stunning, hibernating myocardium is not associated with permanent disruption of cellular integrity. However, there is some loss of the contractile elements, along with disorganization of the cytoskeletal proteins and interstitial inflammation.6 The downregulation of cellular function that occurs with myocardial hibernation serves to reduce myocardial oxygen requirements, helping to minimize cellular damage. Once blood supply has been restored, recovery of normal function is slower than with myocardial stunning, taking some days. If hibernating myocardium is not revascularized, myocardial fibrosis and irreversible dysfunction eventually occur. Hibernating myocardium is a significant cause of congestive cardiac failure in patients with coronary artery disease; the other two causes are infarction and remodeling (see subsequent material).
Collectively, ischemic, hibernating, and stunned myocardium are referred to as viable myocardium. The distinctions among normal, viable, and infarcted myocardium are of tremendous importance in terms of prognosis and treatment options for patients with coronary artery disease, and are discussed in Chapter 5.
Remodeling
Remodeling7 is an alteration in ventricular structure that occurs as part of normal growth or due to a pathologic process such as hypertension, valvular heart disease, myocardial infarction, or a cardiomyopathy. The primary feature of remodeling is hypertrophy. Ventricular hypertrophy is an adaptive response to a change in loading conditions that helps to attenuate ventricular dilatation, reduce wall stress (see Equation 1-3), and stabilize contractile function. Ventricular hypertrophy is initiated by myocardial stretch and various neuroendocrine processes.
Unchecked, ventricular remodeling can eventually result in irreversible cardiac dysfunction due to myocardial fibrosis. However, if appropriate therapy is introduced early enough, remodeling can be interrupted or reversed. If possible, treatment should be directed to the underlying cause: for valvular heart disease, this involves valve repair or replacement; and for hypertension, it involves effective control of blood pressure. Following myocardial infarction, pharmacologic antagonists (angiotensin-converting enzyme [ACE] inhibitors, β blockers, aldosterone antagonists) to the neuroendocrine pathways involved in the remodeling process have proven to be partially effective (see Chapter 19).
Clinical Assessment of Cardiac Function: Stroke Volume and Ejection Fraction
Stroke volume is influenced by preload and afterload, whereas ejection fraction is relatively preload independent but is affected by changes in afterload. Both are influenced by contractility. Cardiac output is the parameter that determines total oxygen delivery to the tissues and is therefore of the greater interest in critically unwell patients. However, ejection fraction and ventricular volumes are predictive of survival following myocardial infarction and cardiac surgery; therefore, they too are important.8,9
Vascular Resistance

where PVR = pulmonary vascular resistance. Rearranged versions of these equations can be used to calculate systemic and pulmonary vascular resistances. The units of resistance are mmHg/min/l (also called Wood units), but in the ICU dynes.sec.cm−5 are commonly used, which are obtained by multiplying Wood units by 80. Although pulmonary and systemic vascular resistances may be estimated from a pulmonary artery catheter, there are a number of reasons why these parameters should not be used to guide therapy.10 First, the calculations, particularly of pulmonary resistance, are prone to error due to inaccuracies in the measurements of the individual parameters. Second, the results may be clinically misleading. For instance, the finding of a high systemic resistance occurs with hypovolemia and does not necessarily imply the need for a vasodilator. Finally, the “normal” value for a resistance is highly dependent on the clinical condition. For example, a patient with sepsis who is appropriately resuscitated may have a MAP of 75 mmHg, a cardiac output of 8 l/min, and a CVP of 10 mmHg, yielding a calculated systemic resistance of 650 dyne.sec.cm−5—a low number, but quite appropriate in the circumstances. Interventions to “normalize” systemic vascular resistance would not be indicated.
Determinants of Vascular Resistance

On the basis of this equation it is seen that resistance is inversely proportional to the 4th power of the radius of the vessel; that is, a fourfold reduction in diameter increases resistance 256 times! The muscular arterioles, by virtue of their ability to alter their caliber dramatically in response to various physiologic signals, are the main sites at which systemic vascular resistance is determined. Another contributor to systemic vascular resistance is blood viscosity, which is largely determined by hematocrit. Doubling of the hematocrit from 0.3 to 0.6 increases blood viscosity fivefold to tenfold. Elevated hematocrit, such as that which occurs in patients with cyanotic heart disease or chronic hypoxemia, can cause clinically important increases in systemic vascular resistance. For turbulent flow through atherosclerotic arteries or stenotic valves, flow is not directly proportional to the pressure gradient as shown in Equation 1-4; it is proportional to the square root of the pressure gradient. Thus, for a given perfusion pressure, flow is reduced in a system with turbulent flow.
Arterial System
Blood Pressure
Blood is ejected into the aorta in a pulsatile fashion. The pulse pressure is the difference between the systolic and diastolic arterial pressures and is normally in the range of 30 to 60 mmHg. Pulse pressure is determined mainly by stroke volume and the compliance of the arterial tree, particularly the aorta. An increase in stroke volume is associated with an increase in pulse pressure. The aorta is a compliant structure that expands during systole to accommodate the stroke volume and recoils during diastole as the stroke volume leaves the aorta. In this way, the aorta damps down the magnitude of the pulse pressure. With increasing age, the compliance of the aorta decreases and the damping effect on the arterial waveform is diminished. This leads to an increase in pulse pressure, which is caused mainly by an increase in the systolic component of blood pressure. Pulse pressure diminishes progressively as blood moves distally within the arterial system so that flow is essentially pulseless at the level of the capillary. Alterations in the arterial pressure waveform at different sites within the arterial tree and in various disease states are discussed in Chapter 8.
Blood Velocity

Because the flow (cardiac output) is the same throughout the circulation, and because the total cross-sectional area of the blood vessels is greatest in the microcirculation, the velocity of blood flow is slowest in the capillaries and greatest in the large blood vessels such as the aorta. Average blood flow velocity at rest is 0.3 m/sec in the aorta and just 1 mm/sec in the capillaries. Blood flow is pulsatile in the arteries, so flow velocity can vary markedly. At rest, the peak velocity in the aorta is about 1 m/sec and this may increase to more than 3 m/sec during exercise, when cardiac output is increased. Similarly, blood velocity increases at a site of pathologic narrowing (e.g., aortic coarctation, aortic valve stenosis). For instance, if the aortic valve cross-sectional area falls from 3 cm2 to 0.5 cm2 but cardiac output remains unchanged, peak aortic velocity increases sixfold, typically from about 1 m/sec to 6 m/sec. This is discussed further in Chapter 7.
Wall Stress and Aneurysm Growth
The Laplace relationship (see Equation 1-3) in the heart is also an important principle when considering arterial aneurysms. Untreated, arterial aneurysms progressively dilate and eventually rupture. An increase in the diameter of the vessel wall leads to an increase wall stress, which in turn leads to further damage to and dilatation of the vessel wall and further increases in wall stress. Also, based on the Bernoulli relationship described earlier, as blood flow velocity decreases in the dilated vessel, pressure energy increases, causing further increases in wall stress. This cycle of increasing wall stress and progressive dilatation continues in a self-reinforcing cycle until the vessel finally ruptures.
Distribution of Cardiac Output
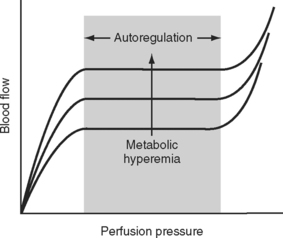
The main mechanism by which blood flow to and within specific organs is regulated is alterations in the resistance of the muscular arterioles. Blood flow to an organ or tissue bed is closely coupled to metabolic activity. As metabolic activity increases, arteriolar dilatation leads to an increase in blood flow. In this way, the supply of metabolic substrates (oxygen, glucose, free fatty acids, and so forth) and the removal of metabolic wastes (carbon dioxide, hydrogen ions) are determined by metabolic need. The metabolic signals that lead to a change in vascular tone have not been fully elucidated, but likely candidates include the periarteriolar concentrations of oxygen, carbon dioxide, adenosine, and potassium. This so-called metabolic theory of vasodilation provides an explanation for the phenomenon of autoregulation, in which a relatively constant organ blood flow is maintained over a wide range of perfusion pressures (Fig. 1-10). As perfusion pressure varies, vascular tone is adjusted to provide a constant supply of nutrients and to wash out the products of metabolism. Thus, if metabolic activity remains constant, blood flow is maintained at a steady level despite variations in perfusion pressure. If metabolic activity increases or decreases the autoregulation curve is shifted upward or downward, respectively, as shown in Figure 1-10. In addition to metabolic control, the magnitude and distribution of cardiac output are influenced by a range of neuroendocrine mechanisms, as described in Control of Blood Pressure.
Specialized Circulations
Coronary Circulation

Coronary atherosclerosis is an important limiting factor for coronary blood flow. In the presence of fixed coronary artery stenoses and maximal arteriolar dilatation (such as occurs during exercise or stress), coronary flow is dependent on the extent of the coronary narrowing and perfusion pressure, not on arteriolar tone. Thus, autoregulation is lost, and coronary flow is pressure dependent. Furthermore, in regions of coronary stenoses, blood flow may be turbulent, increasing frictional losses that further reduce perfusion pressure and coronary flow. The determinants of myocardial oxygen supply and demand are discussed later in this chapter.
Pulmonary Circulation
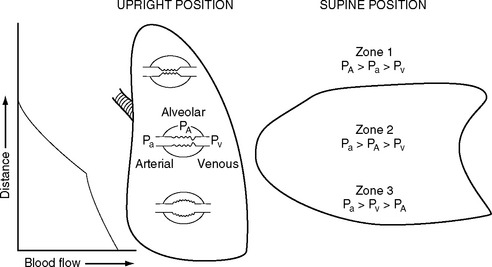
The pulmonary vascular bed is a low-pressure, low-resistance circulation. The normal resistance in the pulmonary circulation is one tenth that of the systemic circulation, and it requires a transpulmonary perfusion gradient of just 5 to 10 mmHg to drive blood through the lungs. The transpulmonary gradient is the difference between the mean pulmonary artery pressure and the left atrial pressure. A value greater than 10 mmHg suggests increased pulmonary vascular resistance. In keeping with the low pressure, the walls of the pulmonary artery and its branches are normally thin and contain little smooth muscle. The pulmonary capillaries are surrounded by gas-filled spaces, the alveoli. Because the pulmonary capillaries are thin walled, a change in alveolar pressure can cause the capillaries to collapse or distend. In a spontaneously breathing erect subject, the alveolar pressure at the apex of the lung may be greater than the capillary pressure, causing collapse of the capillaries and a region of no-flow (Fig. 1-11). This zone of no-flow is increased by factors that reduce capillary hydrostatic pressure (e.g., hypovolemia) and raise intrathoracic pressure (e.g., positive pressure ventilation and PEEP). As explained later in Alveolar Dead Space, these regions of no blood flow constitute alveolar dead space and can contribute to hypercarbia.
Another important determinant of pulmonary vascular resistance is alveolar oxygen tension (Pao2). Within individual lung units, a fall in the Pao2 results in pulmonary arteriolar vasoconstriction. This process is known as hypoxic pulmonary vasoconstriction, and it has a very important role in matching ventilation and perfusion within the lung and maintaining systemic arterial oxygen tension (Pao2) (see Matching Ventilation and Perfusion later in this chapter). Hypoxic vasoconstriction becomes significant when the alveolar oxygen tension falls below about 9 kPa (70 mmHg). Pulmonary vascular resistance is also influenced by pH: acidosis (and therefore hypercarbia) leads to increased resistance. The causes and treatment of elevated pulmonary vascular resistance are discussed in Chapter 24.
Cerebral Circulation
The brain has a high blood flow (about 50 ml/100 g/min) that is tightly autoregulated. Cerebral blood flow is strongly influenced by arterial carbon dioxide tension (Paco2): a decrease in Paco2 is associated with cerebral vasoconstriction and a fall in cerebral blood flow; a rise in Paco2 is associated with cerebral vasodilation and an increase in cerebral blood flow. Severe hypoxia (Pao2 <8 kPa or 60 mmHg) is associated with cerebral vasodilation and an increase in cerebral blood flow. Cerebral perfusion pressure is the difference between MAP and CVP or intracranial pressure—whichever is the highest. Raised intracranial pressure (e.g., due to an intracerebral bleed) will potentially reduce CPP below the lower autoregulatory limit, thereby compromising cerebral blood flow. In this situation, augmentation of MAP to preserve cerebral perfusion pressure is indicated. Hyperventilation has been used in the past for the treatment of elevated intracranial pressure, but the resultant fall in cerebral blood flow is the reason this strategy is no longer recommended.
Splanchnic Circulation
In contrast to the cerebral and coronary circulations, the gastrointestinal tract is under a high level of sympathetic nervous system control. Under conditions of circulatory shock, intense splanchnic vasoconstriction releases blood from venous reservoirs into the central circulation but may also induce gut and hepatic ischemia. This ischemia, with or without subsequent reperfusion injury, can contribute to systemic inflammation (see Chapter 2).
Control of Blood Pressure
Autonomic Nervous System
Epinephrine and, to a lesser extent, norepinephrine are released into the blood from the adrenal medulla under the influence of the sympathetic nervous system. Epinephrine has actions similar to those of norepinephrine at α1 and β1 receptors, but it also stimulates vasodilatory β2 receptors, particularly in the arterioles of skeletal muscle, the heart, and the liver. Pharmacologic manipulations of the sympathetic nervous system are discussed in Chapter 3.
Renin-Angiotensin-Aldosterone System
The RAAS is modified therapeutically by ACE inhibitors, angiotensin receptor blockers, and aldosterone antagonists (see Chapter 3).
Vasopressin
Vasopressin (antidiuretic hormone; ADH) is a peptide released from the posterior pituitary in response to an increase in serum osmolarity and hypovolemia. The main actions of vasopressin are antidiuresis and vasoconstriction. An increase in serum osmolarity to above 285 mOsm/l (e.g., due to water loss or as a consequence of aldosterone-mediated renal sodium retention) leads to increased vasopressin secretion, resulting in water retention within the distal tubule of the kidney (see Tubular Function). This process ensures that water is always retained with sodium and that serum osmolarity is tightly controlled.
Nonosmotic release of vasopressin occurs in response to hypovolemia (mediated by atrial stretch receptors) and hypotension (mediated by arterial baroreceptors). In addition to antidiuresis, high concentrations of vasopressin cause intense vasoconstriction in most vascular beds except the cerebral and coronary circulations. Thus, in the presence of hypovolemia, vasopressin helps maintain blood pressure and facilitates the redistribution of flow to essential organs. Vasopressin secretion in response to hypovolemia occurs even if osmolarity is normal. Thus, circulating volume is defended at the expense of tonicity. The therapeutic use of vasopressin is described in Chapter 3.
Natriuretic Peptides
Plasma levels of brain natriuretic peptide are elevated in a range of cardiac conditions, including congestive heart failure,11 aortic stenosis,12 pulmonary embolus,13 and shock14 and following cardiac surgery.15 Plasma levels of brain natriuretic peptide are useful in distinguishing cardiac from noncardiac causes of acute dyspnea16 and in predicting the outcome of congestive cardiac failure.11 Brain natriuretic peptide is available in a human recombinant form (nesiritide) for the treatment of acute heart failure (see Chapter 3).
Nitric Oxide
Nitric oxide is a small, unstable (half-time of 6 sec), vasodilatory molecule that is synthesized from the amino acid L-arginine and released from vascular endothelium. Low levels (picomolar) of nitric oxide are produced under the influence of the enzyme constitutive nitric oxide synthetase (cNOS) as part of normal homeostasis. The main stimulus for cNOS-mediated nitric oxide production is vascular shear stress. This is thought to be the mechanism of flow-induced vasodilation, in which large arteries dilate in response to distal arteriolar dilatation. Nitric oxide also has antiplatelet, antiinflammatory, and antiatherosclerotic functions.17 Reduced production of nitric oxide has been linked to a range of cardiovascular disease, including essential hypertension18 and coronary atherosclerosis.19 Conversely, in systemic inflammatory states (see Chapter 2), high quantities (nanomolar) of nitric oxide are synthesized under the influence of the enzyme inducible nitric oxide synthetase (iNOS) and contribute to pathologic vasodilation and cellular injury.20
Inhaled nitric oxide is used as a vasodilator of pulmonary arterioles to reduce pulmonary vascular resistance and improve the matching of ventilation and perfusion (and therefore Pao2) within the lung. The drugs nitroglycerin and nitroprusside function as vasodilators by acting as donors of nitric oxide (see Chapter 3).
Endothelins
Endothelins21 (endothelin 1, 2, and 3) are vasoconstrictor peptides synthesized by endothelium. As with nitric oxide, endothelins are produced and act locally (paracrine effect). Plasma levels increase rapidly in response to a reduction in blood pressure (e.g., due to adopting the upright position). The synthesis and release of endothelins occur mainly in response to direct mechanical effects on the endothelium. However, their levels are augmented by norepinephrine, vasopressin, and angiotensin and are inhibited by nitric oxide, atrial natriuretic peptides, and prostacyclin. Endothelin levels are increased in all forms of shock but particularly in septic shock. A nonselective endothelin antagonist, bosentan, is used in the treatment of pulmonary hypertension (see Chapter 24).
Microcirculation
The capillary is a tube formed by a thin membrane of endothelial cells. Small molecules, such as oxygen, carbon dioxide, glucose, ions, and amino acids, diffuse through the junctions between the endothelial cells based on their concentration gradients. In addition, there is mass movement of fluid (filtration) between the capillary lumen and the interstitial fluid based on the balance of Starling forces across capillary wall. The Starling forces are composed of the hydrostatic pressure gradient and the osmotic gradient between the capillary lumen and the interstitial space, as expressed in the Starling law of ultrafiltration:

Tissue Edema
RENAL FUNCTION
Glomerular Function and Renal Blood Flow
The kidneys receive approximately 20% of the resting cardiac output. This high blood flow is required to purify the blood, and greatly exceeds the flow required to meet the metabolic demands of the kidney itself. The functional anatomy of the nephron and its accompanying blood supply are shown in Figure 1-12. The great majority of the renal blood flow passes to the glomeruli of the renal cortex. Only 10% of tubules and their accompanying vasa recta (capillaries) extend into the renal medulla—the so-called juxtamedullary nephrons. Consequently, the blood flow in the renal medulla is much lower than that in the cortex. However, metabolic activity in the medulla is high (see subsequent material). Furthermore, the oxygen tension of blood in the vasa recta is very low. This is the case for two reasons. First, the blood has already passed through a capillary bed (the glomerulus). Second, the countercurrent exchange mechanism that operates in the medulla results in a progressive fall in oxygen tension from the cortex to the inner medulla.
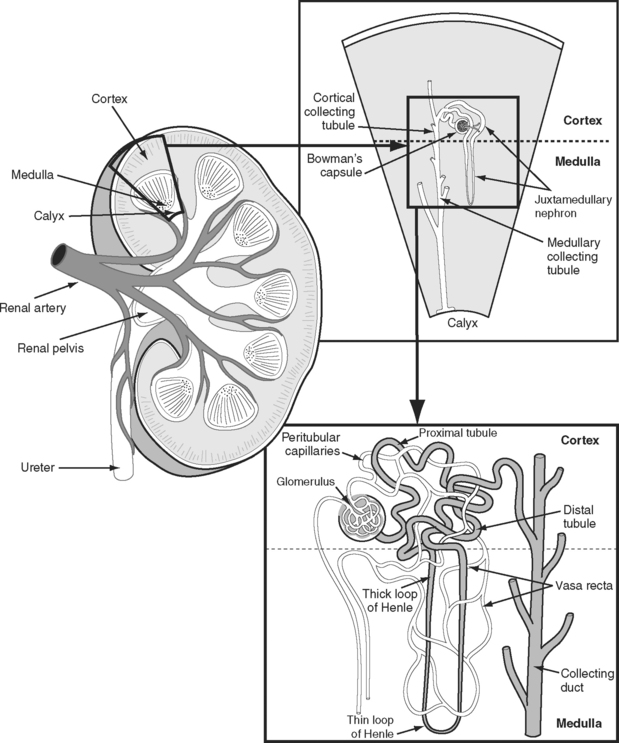
The nephron consists of two functional components: (1) the Bowman capsule, where plasma is filtered, and (2) the tubules, where selective reabsorption and secretion occur. The glomerulus is a tuft of capillaries that invaginate into the Bowman capsule. The hydrostatic pressure within the glomerular capillary is very high, (about 60 mmHg). Thus, the balance of Starling forces favors net filtration into the nephron along the entire length of the capillary, resulting in the net filtration of 20% of plasma flow—the highest filtration fraction of any capillary bed. Under normal circumstances, the glomerular filtration rate (GFR) is about 120 ml/min. To keep GFR relatively constant, renal blood flow is tightly autoregulated (Fig. 1-13).
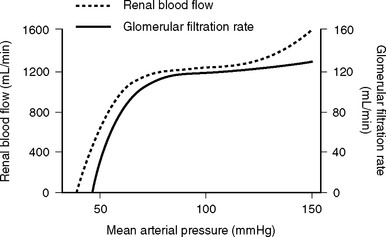
Renal autoregulation is achieved primarily by a mechanism known as tubuloglomerular feedback, in which the vascular tone of the afferent and efferent glomerular arterioles is determined when the solute load reaches the distal nephron. Specialized cells of the distal tubule of the nephron (the macula densa) and the afferent arteriole (the juxtaglomerular cells) lie adjacent to each other. Decreased delivery of solute to the distal tubule (due to reduced GFR) is sensed by the macula densa, which results in the dilation of the afferent arteriole and the release of renin from the juxtaglomerular cells. Renin leads to the production of angiotensin II, which causes selective constriction of the efferent arteriole. Afferent arteriolar vasodilation results in an increase in renal blood flow which, in combination with efferent vasoconstriction, increases glomerular capillary pressure and restores GFR. Angiotensin II also causes systemic vasoconstriction and leads to the release of aldosterone. Aldosterone results in sodium reabsorption in the distal tubule. In this way, the kidneys, via the RAAS, maintain circulating volume and defend arterial blood pressure. Additionally, the kidney synthesizes a number of vasodilatory prostaglandins (mainly prostacyclin and PGE2) in response to vasoconstrictor substances such as angiotensin II, vasopressin, norepinephrine, and endothelins.
Tubular Function
More than 99% of the glomerular filtrate (water, sodium, chloride, bicarbonate) is reabsorbed along the length of the tubule, resulting in a daily urine volume of 400 to 2000 ml. Waste products such as urea, creatinine, and organic anions become progressively concentrated in the tubular fluid and are eliminated in the urine. Some substances, notably hydrogen ions, urate, and potassium, are also actively secreted into the tubule.
Pathophysiology of Acute Renal Failure
Acute Tubular Necrosis
Urine output is low or may cease entirely due to the greatly reduced GFR and tubular obstruction. Loss of the hypertonic medulla causes urinary osmolarity to fall and urinary sodium to rise (>40 mmol/l). In addition to prerenal tubular ischemia, tubular dysfunction can also occur as the result of toxicity to drugs, particularly radiographic contrast agents and antibiotics (gentamicin, amphotericin).
OXYGEN DELIVERY AND CONSUMPTION
Oxygen Carriage in the Blood

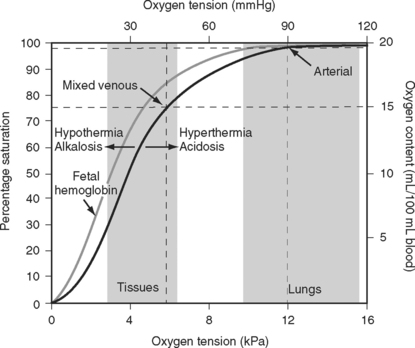
The binding of oxygen and hemoglobin is determined primarily by oxygen tension (Po2). The relationship between Po2 and hemoglobin saturation is not linear but follows a sigmoid-shaped curve (the oxygen-hemoglobin dissociation curve; Fig. 1-14). The shape of this curve confers two important benefits. Above a Po2 of about 8 kPa (60 mmHg), the curve is relatively flat; this is the working part of the curve for the lungs. Thus, in the presence of pulmonary disease that results in modest decrease in Pao2, the oxygen content of arterial blood remains relatively normal. However, when the Po2 ranges from 3 to 7 kPa (20 to 50 mmHg), the curve is very steep; this is the working part of the curve for the tissues. Thus, a modest fall in tissue Po2 results in the unloading of a large additional volume of oxygen.
Oxygen Delivery and Consumption
The two main functions of the heart and the lungs are the adequate delivery of oxygen and nutrients (primarily glucose and free fatty acids) to the tissues so as to sustain aerobic metabolism, and the removal of the waste products of metabolism (primarily carbon dioxide and hydrogen ions).

When measuring venous oxygen saturation (Svo2), blood from the pulmonary artery (mixed venous blood) should be used in preference to blood from the right atrium, because right atrial blood may preferentially sample streams of blood from the inferior vena cava (high saturation) or coronary sinus (low saturation). (An exception to this is when there are intracardiac shunts; see Chapter 5.) Blood from the superior vena cava is usually a good approximation of mixed venous blood.22
Mixed Venous Oxygen Saturation
In Equation 1-15 it is seen that mixed venous oxygen saturation (Svo2) depends on: (1)  O2 (2) Sao2; (3) hemoglobin concentration; (4) cardiac output. If Sao2 and hemoglobin concentration are within normal limits, the Svo2 provides a guide to whether cardiac output is appropriate for metabolic requirements. For example, if cardiac output is low (e.g., 2 l/min/m2) but Svo2 is normal (e.g., 70%), global oxygen delivery is adequate. Conversely, if cardiac output is high (5 l/min/m2) but Svo2 is low (e.g., 50%), global oxygen delivery is inadequate. However, the situation is complicated by the fact that Svo2 does not provide a measure of the adequacy of tissue oxygenation. For instance, the widespread vasodilation that occurs with systemic inflammation may result in the opening of cutaneous arteriovenous shunts, while at the same time blood flow through the microcirculation may be greatly reduced (see Chapter 2). In this situation, oxygenated blood bypasses the tissues, resulting in a normal or elevated Svo2 despite severe tissue hypoxemia.
Oxygen Supply and Demand in the Coronary Circulation
In diverse clinical situations it is often difficult to tell how manipulations of the overall hemodynamic state affect the balance of myocardial oxygen supply and demand, particularly in patients with heart failure or coronary artery disease. For instance, the administration of a vasopressor such as norepinephrine will increase left ventricular afterload and therefore increase myocardial oxygen consumption. However, by increasing perfusion pressure, oxygen delivery may be augmented. Whether the net effect is beneficial or harmful depends on the clinical situation. In a septic hypotensive patient with fixed coronary stenoses, the overall effect of norepinephrine is likely to be beneficial, but in a normotensive patient with borderline perfusion of the subendocardium, norepinephrine may worsen myocardial ischemia. A particular dilemma is the combination of low cardiac output (manifesting as a low Svo2) and coronary artery disease, for instance, a patient who suffers cardiogenic shock following a large anterior myocardial infarction. In this situation, most manipulations to increase global oxygen delivery will increase myocardial oxygen demands and potentially exacerbate myocardial ischemia. However, four interventions that do make physiologic sense in this situation are: (1) reducing oxygen consumption with sedation, neuromuscular blockade, and the avoidance of hyperthermia; (2) insertion of an intraaortic balloon pump (see Chapter 40); (3) treating anemia; (4) insulin therapy (see Chapter 36). The administration of insulin increases the uptake of glucose and reduces the utilization of free fatty acids by the heart, which has an oxygen-sparing effect.23
Arterial Carbon Dioxide Tension and Hypercarbia
 E) is the total (expired) ventilation that occurs in 1 minute and is composed of alveolar ventilation
  A) and dead space ventilation
  D).
D).
Alveolar Ventilation and Paco2
 co2):
co2):
By examining Equations 1-16 and 1-17, all of the causes of hypercarbia can be understood:
Lung Compliance
A plot of lung volume against pressure throughout the respiratory cycle yields a loop such as that shown in Figure 1-15. The slope of the curve (ΔV/ΔP) represents the compliance of the lung and chest wall. Compliance changes throughout the respiratory cycle depending on the lung volume. Compliance is reduced at very low and very high lung volumes; that is, a greater distending pressure is required to achieve the same volume change. Compliance is determined mainly by the elastic properties of the lungs and chest wall and by the surface tension of the liquid film lining the alveoli.
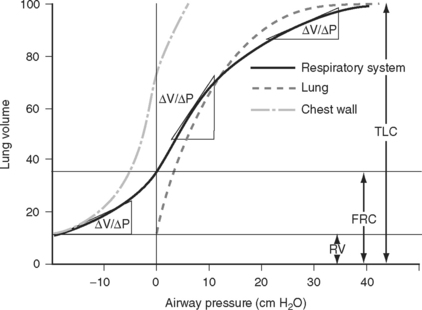
Figure 1.15 Static pressure-volume curve for the respiratory system during expiration from total lung capacity (TLC) to residual volume (RV). The volume at the end of a quiet expiration is functional residual capacity (FRC). The slope of the curve (ΔV/ΔP) is compliance. Compliance is reduced at very low and very high lung volumes. The curves for the lung and chest wall are also shown. The total compliance of the respiratory system is the sum of the reciprocals of the lung and chest wall compliances (1/Ctotal = 1/Clungs + 1/Cchest). A static compliance curve is obtained by having a subject slowly expire through a spirometer. A tap is then closed and the subject relaxes the respiratory muscles; after a few seconds the pressure is recorded. The process is repeated at multiple lung volumes. This static curve is quite different from the dynamic pressure-volume loops that are recorded during mechanical ventilation (see Chapter 29).
(Modified from Rahn H et al: Am J Physiol 146:161, 1946.)
Work of Breathing
Inspiration is an active process in which energy is expended to overcome the elastic recoil of the lungs and the resistance to gas flow through the air passages. Expiration is normally passive; the potential energy stored in the deformed elastic tissues is used to overcome airway resistance. If airway resistance is greatly increased, expiration may become active.
Hypoventilation
where RQ is the respiratory quotient, the ratio of carbon dioxide production to oxygen consumption:
RQ varies between 0.7 and 1, depending on which energy substrate is being utilized; on a normal diet it is about 0.8. The alveolar air equation has important clinical implications. For example, if a patient breathing room air hypoventilates sufficiently to double her or his Paco2 from 5 to 10 kPa (38 to 75 mmHg), the Pao2 will fall from 13.75 to 7.5 kPa (103 to 56 mmHg)—a substantial reduction. However, if the patient then breathes supplemental oxygen to increase the fraction of inspired oxygen to 33% (PIo2 = 33 kPa or 248 mmHg), Pao2 increases to 20 kPa (150 mmHg) which, in the absence of major V/Q mismatch, results in a Pao2 of about 18 kPa (135 mmHg). This example illustrates the fact that hypoxemia due to pure hypoventilation can be corrected easily by supplemental oxygen.
V/Q Mismatch and Intrapulmonary Shunting
Time Dependence of Ventilation.

With increased airways resistance, the time required for lung inflation and deflation is increased. In patients who are mechanically ventilated, inadequate expiratory time leads to air trapping (auto-PEEP, dynamic pulmonary hyperinflation) and the potential for hemodynamic collapse. Conversely, with reduced compliance, the time constants of expiration and inflation are short. In diseased lungs, increased heterogeneity of time constants exists, with some subpopulations of alveoli having long-time constants and some having short-time constants. Lung units with long-time constants may receive less ventilation than lung units with short-time constants, resulting in V/Q mismatch. This is a particular problem when patients with diseased lungs are mechanically ventilated with short inspiratory times. These ideas are explored further in Chapter 29.
Matching of Ventilation and Perfusion.
For efficient gas exchange to take place there must be a match between ventilation and perfusion throughout the lung. The lung can be thought of as being composed of multiple units, each with its own V/Q ratio (Fig. 1-16). Ideally, each unit would have a V/Q ratio of 1. In practice, V/Q ratios vary throughout the lung due to regional differences in ventilation and blood flow.
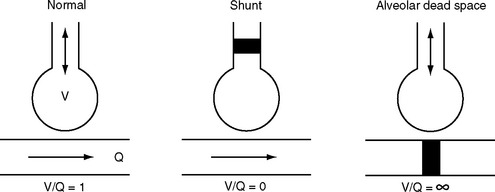
Figure 1.16 Schematic to illustrate the causes of ventilation-perfusion mismatch within the lung. See text for details.
Lung units with a V/Q ratio less than 1 have inadequate ventilation relative to perfusion. In the extreme form, no ventilation occurs (V/Q = 0), and intrapulmonary shunting exists; this is the situation in consolidated or atelectatic lung tissue. Conversely, lung units with a V/Q ratio greater than 1 have inadequate perfusion relative to ventilation. In the extreme form, no perfusion occurs (V/Q = ∞), and alveolar dead space exists; this is the situation that occurs within West zone 1 (see Fig. 1-11 and Pulmonary Circulation, discussed previously) and downstream from a pulmonary embolus.
Most forms of acute and chronic lung disease are characterized by increased heterogeneity of V/Q ratios, with regions of relative shunt and regions of relative dead space. The main way in which the impact of V/Q mismatch on Pao2 and Paco2 is minimized is by means of hypoxic pulmonary vasoconstriction, described earlier in Pulmonary Circulation.
Consequences of V/Q Mismatch.
Consequences of Hypoxemia and Hypercarbia
Hypoxemia.
The lowest tolerable level of tissue oxygenation is a value below which cerebral (as the most vulnerable organ) dysfunction occurs. This has been estimated to be a jugular venous oxygen tension of about 2.7 kPa (20 mmHg),24 which corresponds to a jugular venous oxygen saturation of 32%. Assuming normal values for cerebral oxygen extraction, hemoglobin, and blood flow, this corresponds to a Pao2 of 4.8 kPa (36 mmHg) or an Sao2 of 68%. However, in practice, organ dysfunction may occur at a much higher value of Sao2. Hemoglobin concentration, cardiac output, and oxygen consumption commonly are not normal. Also, specific organs may be particularly vulnerable to the effects of hypoxemia (e.g., the heart in patients with coronary artery disease). In practice, if Sao2 is >85%, hypoxemia is unlikely to contribute to organ ischemia, and this value can be considered a lower limit of acceptable arterial oxygen saturation.
Hypercarbia.
Hypercarbia exerts a wide range of effects that are clinically significant. Paco2 is a primary determinant of pH (see Chapter 31), and many of the effects of Paco2 are mediated in this way. In particular, the pH of the cerebrospinal fluid is the main determinant of ventilatory drive.
Elevated Paco2 has a number of important effects on the central nervous system, including a hypnotic effect that is seen when Paco2 exceeds about 12 kPa (90 mmHg); a lowering of the threshold for convulsions; and cerebral vasodilation. The last effect can result in raised intracranial pressure in patients with space-occupying intracranial lesions. As with hypoxemia, hypercarbia results in activation of the sympathetic nervous system, vasodilation, and a rightward shift in the oxygen-hemoglobin dissociation curve. Patients typically appear flushed and have bounding pulses and distended veins. Hypercarbia reduces Pao2 (see Equation 1-18) and contributes to hypoxemia. Respiratory acidosis results in hyperkalemia that can exacerbate arrhythmias. Patients with type 2 respiratory failure (↓Pao2, ↑Paco2; Chapter 27) can develop both respiratory and metabolic acidosis.
1 Kumar A, Anel R, Bunnell E, et al. Pulmonary artery occlusion pressure and central venous pressure fail to predict ventricular filling volume, cardiac performance, or the response to volume infusion in normal subjects. Crit Care Med. 2004;32:691-699.
2 Cicek S, Demirkilic U, Kuralay E, et al. Prediction of intraoperative hypovolemia in patients with left ventricular hypertrophy: comparison of transesophageal echocardiography and Swan-Ganz monitoring. Echocardiography. 1997;14:257-260.
3 Kim SJ, Depre C, Vatner SF. Novel mechanisms mediating stunned myocardium. Heart Fail Rev. 2003;8:143-153.
4 Verma S, Fedak PW, Weisel RD, et al. Fundamentals of reperfusion injury for the clinical cardiologist. Circulation. 2002;105:2332-2336.
5 Dutka DP, Camici PG. Hibernation and congestive heart failure. Heart Fail Rev. 2003;8:167-173.
6 Frangogiannis NG. The pathological basis of myocardial hibernation. Histol Histopathol. 2003;18:647-655.
7 Sutton MG, Sharpe N. Left ventricular remodeling after myocardial infarction: pathophysiology and therapy. Circulation. 2000;101:2981-2988.
8 Migrino RQ, Young JB, Ellis SG, et al. End-systolic volume index at 90 to 180 minutes into reperfusion therapy for acute myocardial infarction is a strong predictor of early and late mortality. The Global Utilization of Streptokinase and t-PA for Occluded Coronary Arteries (GUSTO)-I Angiographic Investigators. Circulation. 1997;96:116-121.
9 Cohn PF, Gorlin R, Cohn LH, et al. Left ventricular ejection fraction as a prognostic guide in surgical treatment of coronary and valvular heart disease. Am J Cardiol. 1974;34:136-141.
10 Bartlett RH. Alice in intensiveland. Being an essay on nonsense and common sense in the ICU, after the manner of Lewis Carroll. Chest. 1995;108:1129-1139.
11 Doust JA, Glasziou PP, Pietrzak E, et al. A systematic review of the diagnostic accuracy of natriuretic peptides for heart failure. Arch Intern Med. 2004;164:1978-1984.
12 Gerber IL, Stewart RA, Legget ME, et al. Increased plasma natriuretic peptide levels reflect symptom onset in aortic stenosis. Circulation. 2003;107:1884-1890.
13 Kucher N, Printzen G, Goldhaber SZ. Prognostic role of brain natriuretic peptide in acute pulmonary embolism. Circulation. 2003;107:2545-2547.
14 Bhalla V, Bhalla MA, Maisel AS. Evolution of B-type natriuretic peptide in evaluation of intensive care unit shock. Crit Care Med. 2004;32:1787-1789.
15 Sinha AM, Breithardt OA, Schmid M, et al. Brain natriuretic peptide release in cardiac surgery patients. Thorac Cardiovasc Surg. 2005;53:138-143.
16 Dao Q, Krishnaswamy P, Kazanegra R, et al. Utility of B-type natriuretic peptide in the diagnosis of congestive heart failure in an urgent-care setting. J Am Coll Cardiol. 2001;37:379-385.
17 Rubio AR, Morales-Segura MA. Nitric oxide, an iceberg in cardiovascular physiology: far beyond vessel tone control. Arch Med Res. 2004;35:1-11.
18 Schlaich MP, Parnell MM, Ahlers BA, et al. Impaired L-arginine transport and endothelial function in hypertensive and genetically predisposed normotensive subjects. Circulation. 2004;110:3680-3686.
19 Feron O, Dessy C, Moniotte S, et al. Hypercholesterolemia decreases nitric oxide production by promoting the interaction of caveolin and endothelial nitric oxide synthase. J Clin Invest. 1999;103:897-905.
20 Laffey JG, Boylan JF, Cheng DC. The systemic inflammatory response to cardiac surgery: implications for the anesthesiologist. Anesthesiology. 2002;97:215-252.
21 Taddei S, Virdis A, Ghiadoni L, et al. Role of endothelin in the control of peripheral vascular tone in human hypertension. Heart Fail Rev. 2001;6:277-285.
22 Reinhart K, Kuhn HJ, Hartog C, et al. Continuous central venous and pulmonary artery oxygen saturation monitoring in the critically ill. Intens Care Med. 2004;30:1572-1578.
23 Wolff AA, Rotmensch HH, Stanley WC, et al. Metabolic approaches to the treatment of ischemic heart disease: the clinicians ’ perspective. Heart Fail Rev. 2002;7:187-203.
24 Lamb A. Nunn’s Applied Respiratory Physiology, ed 6, Philadelphia: Butterworth-Heinemann, 2005.
[/level-membership-for-cardiothoracic-surgery-category][not-level-membership-for-cardiothoracic-surgery-category]
Chapter 1 Physiology and Pathophysiology
In this chapter the physiologic principles relating to conditions and treatments encountered in the cardiothoracic intensive care unit (ICU) are reviewed. Most of the topics relate to the cardiovascular system, but some coverage of the respiratory and renal systems is also included. The physiology of acid/base homeostasis and water and electrolyte balance is covered in Chapters 31 and Chapter 32, respectively.
ELECTRICAL ACTIVITY OF THE HEART
Cardiac Action Potential
An increase in the membrane potential (i.e., the inside becomes less negative) is called depolarization; a decrease in the membrane potential (i.e., the inside becomes more negative) is called repolarization. Action potentials are cycles of depolarization and repolarization and are the result of minute ion fluxes across the membrane due to changes in the permeability of the membrane to different ions. Alterations in membrane ion permeability are achieved by the opening and closing of transmembrane ion channels. Many of the channels are voltage gated, which means that they open when the membrane potential reaches a certain value.
Two basic types of cardiac action potential are recognized: fast action potentials (Fig. 1-1), which occur predominantly in atrial and ventricular myocytes, and slow action potentials (Fig. 1-2), which occur in pacemaker cells of the sinoatrial (SA) and atrioventricular (AV) nodes.
Action Potential in Cardiac Muscle Cells
A cardiac action potential is transmitted deep within the myocyte by invaginations of the cell membrane known as T tubules. The entry of calcium into the cell during an action potential leads to the release of calcium from the sarcoplasmic reticulum into the cytoplasm of the myocyte, precipitating muscular contraction.
Cardiac Conducting System
Relationship between the Action Potential and the Electrocardiogram
The electrocardiogram (ECG) is the surface recording of the electrical activity of the heart. (Its interpretation is described in Chapter 8.) The relationship between the action potential and the ECG is shown in Figure 1-1. The P wave corresponds to depolarization of the atria during late ventricular diastole. The PR interval is the time from the onset of atrial activation to the onset of ventricular activation—a significant portion of which is taken up by the delay through the AV node. The QRS complex corresponds to ventricular depolarization. The ST segment spans the time when the ventricular myocytes are in phase 2 (plateau) of their action potentials, and the T wave corresponds to ventricular repolarization.
Control of Heart Rate and Cardiac Conduction
The electric activity in the heart is controlled by the autonomic nervous system and circulating epinephrine. Parasympathetic stimulation via the vagus nerve causes the release of acetylcholine that binds to muscarinic receptors on cells within the SA and AV nodes, leading to an increase in potassium permeability within these cells. Increased potassium permeability hyperpolarizes the cell membrane (meaning the membrane potential becomes more negative) and reduces the slope of phase 4 of the action potential (see Fig. 1-2), thus reducing heart rate and prolonging conduction through the AV node (↑PR interval). Intense vagal stimulation (e.g., during laryngoscopy) can lead to asystole (SA block) or complete heart block (AV block).
Sympathetic stimulation causes the release of norepinephrine, which activates β1 receptors on the cellular membrane. This leads to decreased potassium permeability and increased calcium and sodium permeability, which reduces the extent of repolarization and increases the slope of phase 4 in pacemaker cells (see Fig. 1-2), thus increasing heart rate and shortening the PR interval. Sympathetic nervous system activation also causes increased excitability throughout the entire conducting system.
A completely denervated heart has a resting rate of about 100 beats/min, this being the intrinsic rate of discharge of the SA node. The normal resting heart rate is 60 to 70 beats/min, indicating that parasympathetic tone dominates in the normal heart at rest. Abnormalities of impulse generation and conduction are discussed in Chapter 21.
Cardiac Cycle
The cardiac cycle is divided into ventricular systole (contraction and ejection) and ventricular diastole (relaxation and filling) (Fig. 1-3).
Diastole
In various disease states diastolic filling is abnormal. For instance, with mitral stenosis a high proportion of ventricular filling occurs late in diastole. In this circumstance, shortening of diastole due to tachycardia or loss of atrial systole due to the development of atrial fibrillation can cause marked hemodynamic compromise. A similar situation exists when active relaxation is prolonged (e.g., due to myocardial ischemia or left ventricular hypertrophy). Conversely, in some circumstances (e.g., restrictive cardiomyopathy) a greater proportion of diastolic filling occurs early in diastole. In this circumstance, cardiac output may be improved with modest tachycardia. Diastolic dysfunction is discussed in Chapter 20.
Pressure-volume Loops
A useful way of evaluating cardiac function experimentally is by plotting ventricular pressure against ventricular volume throughout the cardiac cycle (Fig. 1-4). Families of pressure-volume loops can be generated under different physiologic conditions. Stroke volume (SV) is the difference between the end-diastolic volume (EDV; see Fig. 1-4, position b) and the end-systolic volume (ESV; see Fig. 1-4, position d). Ejection fraction (EF) is the proportion of the end-diastolic volume that is ejected during systole:
The area bound by the pressure volume-loop gives myocardial work. Characteristic changes in the pressure-volume loop are seen with alterations in the loading conditions or contractile function of the ventricle and with disease (Figs. 1-4, 1-5, 1-6, and 1-7).
Determinants of Cardiac Output
Cardiac output is the product of stroke volume and heart rate. Stroke volume is determined by preload, afterload, and contractility. Cardiac output may be divided by body surface area to obtain the cardiac index. The normal value for cardiac output in awake normotensive subjects is 1.9 to 3.5 L/min/m2 (see Chapter 8).
Preload
The functional contractile unit of the myocyte is the sarcomere, which is composed of overlapping thick and thin filaments. The thick filaments contain the protein myosin; the thin filaments contain the proteins actin, tropomyosin, and the troponin complex. Activation of the troponin complex by calcium leads to binding between actin and myosin and contraction of the sarcomere. The force of contraction is partly dependent on the degree of overlap of the thick and thin filaments. In the resting state the sarcomere is 1.8 to 2.0 μm long. Maximum overlap of the filaments occurs at a sarcomere length of about 2.3 μm—that is, when the sarcomere is prestretched above its resting length. This property of the sarcomere underlies the Starling law of the heart, which states that the degree of fiber stretch at end-diastole (preload) determines the force of contraction. In the intact heart, this is represented by the relationship between end-diastolic volume and stroke volume and can be displayed as a ventricular function curve (Fig. 1-8). Over the physiologic range, the relationship is relatively linear; thus, the ejection fraction, which is the slope of the ventricular function curve (SV/EDV), is relatively preload independent. In the ICU, left ventricular end-diastolic volume (or its surrogate, end-diastolic area) may be estimated by echocardiography. The effect of increasing preload on the pressure-volume loop is shown in Figure 1-4.
Left Ventricular Compliance
Because end-diastolic pressure is related to end-diastolic volume through the passive pressure-volume relationship (see Fig. 1-6), end-diastolic pressure is used as a surrogate for end-diastolic volume as a measure of preload. Clinically, left ventricular end-diastolic pressure is usually inferred from the pulmonary artery wedge pressure (PAWP; Chapter 8), which is obtained by means of a pulmonary artery catheter. Unfortunately, the relationship between end-diastolic volume and end-diastolic pressure (ventricular compliance) is not linear. At high ventricular volumes, a small increase in end-diastolic volume is associated with a big increase in end-diastolic pressure (see Fig. 1-6). Furthermore, left ventricular compliance may be altered by disease. For example, compliance is decreased in aortic stenosis and increased in aortic regurgitation (see Fig. 1-7). In some situations, an increase in filling pressure may actually be associated with a reduction in preload (e.g., pericardial tamponade). Thus, the estimation of preload from the PAWP may be misleading (see Chapter 8).1,2
Ventricular Interactions
Afterload
Afterload can be defined as ventricular wall stress during systole. It is determined by the impedance to ejection and ventricular geometry. Wall stress can be calculated by using the Laplace law:
A sudden increase in afterload is associated with an immediate fall in stroke volume. Over the next few beats, stoke volume gradually recovers due to increased diastolic ventricular volume (see Fig. 1-5). However, patients with congestive cardiac failure who are operating on the plateau part of their ventricular function curve (see Fig. 1-8) are unable to increase stroke volume by increasing preload—that is, they have reduced preload reserve. Thus, in patients with congestive cardiac failure, increased afterload (e.g., due to phenylephrine) can cause a precipitous fall in cardiac output. Indeed, afterload reduction is a fundamental principle of the treatment of left ventricular failure.
Contractility
Contractility is the intrinsic contractile function of the ventricle, independent of preload and afterload. Alterations in contractility are shown on the ventricular function curve in Figure 1-8. An increase in contractility shifts the curve upward and to the left, resulting in an increased stroke volume for a given end-diastolic volume; a decrease in contractility shifts the curve downward and to the right, resulting in reduced stoke volume for the same end-diastolic volume.
Experimentally, contractility may be evaluated by pressure-volume loops. If a number of loops are obtained by varying preload, the coordinates at end-systole form a straight line, known as the end-systolic pressure/volume relationship. The slope of this line is a reasonably load-independent measure of contractility (see Figs. 1-4 and 1-6). Unfortunately, there is no simple method of assessing contractility clinically. Ejection fraction and cardiac output, the commonly used clinical parameters of cardiac performance, are influenced by loading conditions, as explained subsequently.
The force of contraction of a given degree of myocyte overlap is determined by the cytoplasmic concentration of calcium, and this is the basis of alterations in contractility. The intracellular calcium concentration is regulated mainly by the activity of the sympathetic nervous system and circulating epinephrine. Physiologic and pharmacologic control of contractility is discussed in Chapter 3.
Myocardial Dysfunction
Potentially reversible cardiac dysfunction can occur as a consequence of myocardial ischemia, stunning or hibernation, or remodeling.7 Irreversible myocardial dysfunction occurs due to myocyte loss caused by infarction or replacement (e.g., with amyloid or fibrotic tissue).
Ischemia, Stunning, and Hibernation
Relief of ischemia does not always result in an immediate return of contractile function. Myocardial stunning is temporary myocardial dysfunction that persists following the resolution of an ischemic episode (postischemic dysfunction). This dysfunction occurs in the presence of normal, or near normal, coronary blood flow and in the absence of irreversible cellular damage. Return of contractile function occurs over a period of hours to days. Myocardial stunning arises primarily from reperfusion injury. The mechanisms of reperfusion injury and myocardial stunning are incompletely understood, but they involve the generation of oxygen-derived free radicals (e.g., superoxide, peroxynitrite), altered concentration and sensitivity to intracellular calcium, and endothelial dysfunction.3,4 Myocardial stunning is encountered in a number of clinical situations, such as after cardiopulmonary bypass and subsequent to reperfusion therapy for an acute coronary syndrome.
Hibernating myocardium is a state of chronic ischemic dysfunction. Hibernating myocardium was initially thought to be caused by low baseline blood flow. However, it is now recognized that baseline blood flow may be near normal and that the primary problem is reduced vasodilator reserve. Small increases in oxygen demand can then provoke acute ischemia that is typically painless.5 As with stunning, hibernating myocardium is not associated with permanent disruption of cellular integrity. However, there is some loss of the contractile elements, along with disorganization of the cytoskeletal proteins and interstitial inflammation.6 The downregulation of cellular function that occurs with myocardial hibernation serves to reduce myocardial oxygen requirements, helping to minimize cellular damage. Once blood supply has been restored, recovery of normal function is slower than with myocardial stunning, taking some days. If hibernating myocardium is not revascularized, myocardial fibrosis and irreversible dysfunction eventually occur. Hibernating myocardium is a significant cause of congestive cardiac failure in patients with coronary artery disease; the other two causes are infarction and remodeling (see subsequent material).
Collectively, ischemic, hibernating, and stunned myocardium are referred to as viable myocardium. The distinctions among normal, viable, and infarcted myocardium are of tremendous importance in terms of prognosis and treatment options for patients with coronary artery disease, and are discussed in Chapter 5.
Remodeling
Remodeling7 is an alteration in ventricular structure that occurs as part of normal growth or due to a pathologic process such as hypertension, valvular heart disease, myocardial infarction, or a cardiomyopathy. The primary feature of remodeling is hypertrophy. Ventricular hypertrophy is an adaptive response to a change in loading conditions that helps to attenuate ventricular dilatation, reduce wall stress (see Equation 1-3), and stabilize contractile function. Ventricular hypertrophy is initiated by myocardial stretch and various neuroendocrine processes.
Unchecked, ventricular remodeling can eventually result in irreversible cardiac dysfunction due to myocardial fibrosis. However, if appropriate therapy is introduced early enough, remodeling can be interrupted or reversed. If possible, treatment should be directed to the underlying cause: for valvular heart disease, this involves valve repair or replacement; and for hypertension, it involves effective control of blood pressure. Following myocardial infarction, pharmacologic antagonists (angiotensin-converting enzyme [ACE] inhibitors, β blockers, aldosterone antagonists) to the neuroendocrine pathways involved in the remodeling process have proven to be partially effective (see Chapter 19).
Clinical Assessment of Cardiac Function: Stroke Volume and Ejection Fraction
[/not-level-membership-for-cardiothoracic-surgery-category]
