Appendix 2 Comments on the Interpretation of Diagnostic Tests
The interpretation of tests used in clinical practice is important, but studies that define the accuracy of diagnostic tests can be difficult to understand. In chapter 23, the paper by Stein and colleagues1 on the diagnosis of pulmonary embolism is discussed briefly. Let us consider its results in relation to the use of multidetector computed tomographic angiography (CTA) in the diagnosis of pulmonary embolism. This diagnostic procedure was compared with a reference standard. The authors report (in the abstract) that the test was inconclusive in 51 of 824 patients, but in the remaining 773 it had a sensitivity of 83% and a specificity of 96%. They also report that in patients likely (on clinical grounds) to have a pulmonary embolus, the positive predictive value of the test was 96%. What does this mean?
Let us begin by considering just the 773 patients who had both a positive reference diagnosis and a technically successful CTA. More generally, assume that n patients were tested for pulmonary embolus, of whom some had the condition and some did not. The test will have been positive in some and negative in others (Table 1). These results will include true-positives (a) and true-negatives (d), but unless the test was perfect, there will have been some false-positives (b) and some false-negatives (c). These results can be represented in a table in which a + c patients have the disease and b + d do not, and in which a + b tested positive and c + d tested negative.
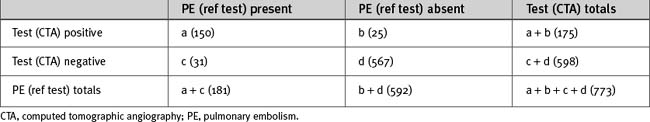
If we assume the reference test is absolutely reliable, we can say that we have: (a) (150) true positives; (b) (25) false-positives; (d) (567) true-negatives; and (c) (31) false-negatives. The sensitivity of the test is the proportion of patients with the condition who will be correctly identified by the test. It is the percentage of patients with the disease who have a true-positive, a/a + c or 150/181 = 83%. The specificity is the percentage of patients without the condition who will be correctly identified by the test, d/(b + d), or 567/592 = 96%. These are actually proportions expressed as percentages, and it is possible to calculate confidence limits for any proportion, so the authors have very helpfully reported 95% limits. If the proportion were the same but more tests had been done, these limits would be tighter, and vice versa.
More information is given in the body of the paper. The positive predictive valve is the percentage of patients in whom the test is positive and who actually do have the condition (i.e., the truly positive proportion of all positives), a/(a + b) or 150/175 = 86%. The negative predictive valve is the percentage of patients in whom the test is negative and who indeed do not have the condition (i.e., the truly negative proportion of all negatives), d/(c + d) or 567/598 = 95%. These figures are refined for subgroups with specific diagnoses (but note that the numbers in these subgroups are now rather small, so the confidence limits would be wider). For example, the positive predictive value for a pulmonary embolism in the main or pulmonary artery is stated as being 116 of 120 patients, or 97% (the 95% confidence limits for this would be 92% to 99%), so the test is clearly more reliable in this clinically important subgroup of patients.
One of the difficulties with studies comparing a new test with an established test is that the reference test may not be perfect. This is addressed in the study by allowing for the highest and lowest known false-positive and false-negative results of the reference test. In this case, it makes little difference to the results because the reference test is relatively accurate.
It is sometimes not appreciated that the interpretation of a test may depend not only on the characteristics of the test but also on the characteristics of the population under consideration. In fact, if a condition is uncommon in the tested population, the likelihood that a patient who tests positively actually has that condition may be less than the likelihood that he or she does not. Consider a test that has a false-positive rate of 0.1%. That sounds fairly accurate. However, if only one person in every 10,000 of the tested population has the condition, that means that if a random sample of 10,000 people is tested, a false-positive result will probably be obtained in 10 people and a true-positive in 1. Thus, the chance that a person with a positive result actually has the disease will be about 10%. In other words, the positive and negative predictive values vary according to the prevalence of the condition, which is the proportion of the patients in the population who actually have the condition at the specified time. (The incidence of a condition is the proportion of patients in the population who develop the condition over a specified period of time.)
This difficulty is dealt with in the study on pulmonary embolus. In the group in whom clinical assessment suggested a high probability of pulmonary embolus, the positive predictive value of the test was 96% (much better than the overall value of 86%); in the group with low clinical probability of the condition, the false-positive rate was 42%. This is a beautiful illustration of the fallacy of relying on a test in isolation. Clinical diagnosis depends on a synthesis of information from history, physical examination, and usually more than one test (in the study, the value of adding venous-phase imaging to CTA is also considered). Tests that may be very useful for confirming the diagnosis in patients likely to have a condition may be of little value for screening populations in general and cannot be substituted for a complete evaluation of each individual patient.
There is one other aspect of the study that might perhaps be less than obvious from a reading of the abstract alone but that is made very clear in the paper itself. Of 77,284 patients with suspected pulmonary embolism for various reasons, only 824 received the reference diagnosis and underwent a CTA. Furthermore, patients were not recruited at night or during the weekends. Thus, the 824 patients analyzed were not randomly selected, so there is a real possibility that patients being studied in one’s own institution may not be the same as those who had CTA in this study. Of these 824, only 773 had adequate CTAs; however, it turns out that the proportion of positives (23%) in the 773 who had successful CTAs is very similar to that in the 824 who had the reference diagnosis, so on this occasion no systematic bias was introduced by the technicalities of the test. Nevertheless, some 6% of patients tested will be left with no result at all. This means that the actual utility of the test in differentiating patients admitted to one’s intensive care unit will be less than one might imagine from its positive and negative predictive values. This is not a test that will give one a diagnosis in anything like 96% of patients who come through the door, even though that is its positive predictive value in patients likely to have a pulmonary embolus who actually end up undergoing a technically successful CTA.
For more detailed information on the interpretation of diagnostic tests, the reader is referred to Practical Statistics for Medical Research.2