Chapter 41 Risk Assessment and Quality Improvement
Despite continued advances in perioperative care, cardiac surgery carries an appreciable risk for serious morbidity and for mortality. At the same time, there is a strong demand by the public, regulatory bodies, professional organizations, and the legal system for evidence that healthcare is being delivered to a high standard. In some jurisdictions, this demand has led to the reporting of mortality figures for individual institutions and surgeons.1 However, the likelihood of adverse outcomes for patients is highly dependent on their preoperative risk profiles. For example, the mortality risk provided in Chapter 10 for isolated mitral valve surgery is 6%. However, an otherwise well 50-year-old male undergoing mitral valve repair for severe mitral regurgitation has a mortality risk (predicted using the logistic EuroSCORE; see subsequent material) of 1.5%.
RISK-SCORING SYSTEMS IN CARDIAC SURGERY
General Versus Specific Risk-Scoring Systems
Risk-scoring systems may be classified as either general or specific. General scoring systems are widely used in ICU practice. Examples include the Acute Physiology and Chronic Health Evaluation (APACHE), which has undergone four iterations (I through IV); Mortality Probability Models (MPM) II; and the Simplified Acute Physiology Score (SAPS) II. With APACHE IV, mortality risk is calculated on the basis of multiple factors, including (1) acute derangements of 17 physiologic variables measured within 24 hours of ICU admission; (2) the patient’s age; (3) the presence of chronic, severe organ failure involving the heart, lungs, kidneys, liver, or immune system; (4) the admission diagnosis; (5) the pre-ICU length of hospital stay. (Downloadable risk calculators for APACHE IV are available from www.criticaloutcomes.cerner.com.) Although useful for most ICU patients, these general scoring systems are of limited value for cardiac surgery patients because many of the acute physiologic changes that occur in the first 24 hours are related to the effects of surgery and cardiopulmonary bypass and do not reflect patients’ risk for dying or suffering morbid events. Although APACHE IV has a mortality-prediction algorithm for use in patients who have had coronary artery bypass graft (CABG) surgery using postoperative day 1 variables, it may not be valid outside the United States and is not designed for use in patients undergoing other cardiac operations.2 General scoring systems are not discussed further.
Principles of Cardiac Risk-Scoring Systems
To appreciate the strengths and weaknesses of risk-scoring systems, it is important to consider how they are developed and validated.3–5
Development of Risk-Scoring Systems
The most widely used statistical tool for developing risk models is logistic regression.6 First, univariate regression analysis is used to identify statistical associations between predictor variables and the outcome variable. From these variables, a multivariate logistic regression model is developed in which independent predictor variables are identified and included in a regression equation of the following general form:

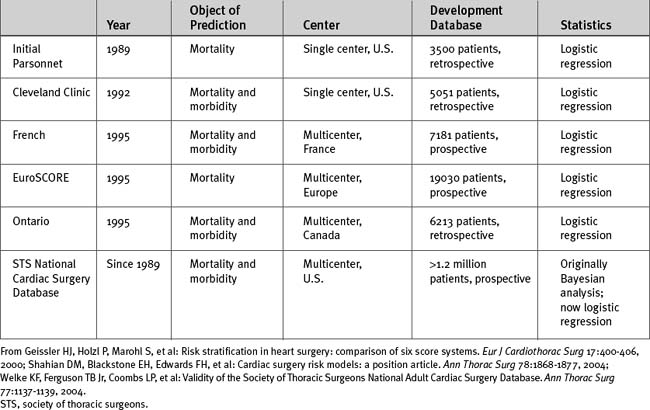
Other than database size, additional important issues are the time the data were collected, the geographic location of the patients in the database, whether the database is single-center or multicenter, and whether the data were collected prospectively or retrospectively (Table 41-1). For instance, the Parsonnet score—the first widely used cardiac risk-scoring system—was originally developed from a retrospective database of 3500 patients operated on between 1982 and 1987 in the United States. Given the changes in patient populations and surgical management since then, outcome predictions based on this patient population may no longer be valid, particularly outside the United States.
Validating Risk-Scoring Systems
Calibration refers to how well the model assigns appropriate risk. It is evaluated by dividing patients into groups (usually deciles) according to expected risk and then comparing expected to observed risk within those groups. A well-calibrated model shows a close agreement between the observed and expected mortality rates, both overall and within each decile of risk. Most cardiac risk models are well calibrated in the midrange but less so for patients at the extremes of risk, both high and low.7
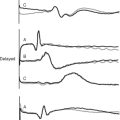
Discrimination refers to how well the model distinguishes patients who survive from those who die (Fig. 41-1). It is evaluated by analyzing receiver operating characteristic (ROC) curves.8 ROC curves are plots of sensitivity (true positive rate) against 1− specificity (false positive rate) at various levels of predicted risk (cutoffs). They graphically display the tradeoff between sensitivity and specificity as shown in Figure 41-2. For randomly selected pairs of patients with different outcomes (survival or death), a model should predict a higher mortality risk for the patient who dies than for the patient who survives. The area under the ROC curve (c-statistic) varies between 0.5 and 1.0 and indicates the probability that a randomly chosen patient who dies has a higher risk than a randomly chosen survivor. A model with no discrimination has an area under the ROC curve of 0.5 (see Fig. 41-2, graph B), meaning that the chance of correctly predicting the death in a randomly chosen pair is 50%, which is no better than the toss of a coin. By contrast, a model with an area under the ROC curve of 1 (see Fig. 41-2, graph A) implies perfect discrimination, meaning that the model always assigns a higher risk to a randomly chosen death than to a randomly chosen survival. In such a situation, there is no tradeoff between sensitivity and specificity; they are always 100% at every percentage risk prediction. A good explanation of ROC curves with applets allowing graphic manipulation of the threshold and sample population separation is given at http://www.anaesthetist.com/mnm/stats/roc/index.htm.
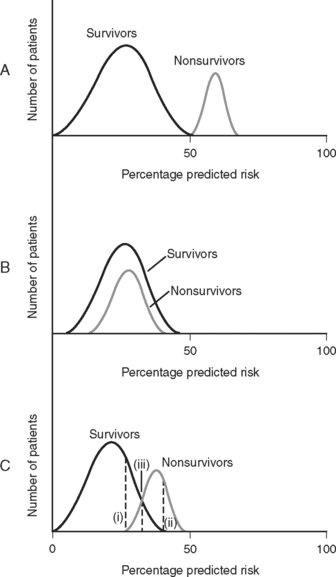
Figure 41.1 Discrimination of risk models. A, A risk model with perfect discrimination. In this example, all of the patients with a predicted mortality risk of 50% or less survive, and all of the patients with a predicted mortality risk of 50% or greater die. B, A risk model with no discrimination. C. Although an oversimplification, model C is more typical of a real-world cardiac risk model. Nonsurvivors tend to have a higher predicted mortality rate than survivors, but there is some overlap. No cutoff separates all survivors from all nonsurvivors. Line (i) represents the cutoff point corresponding to 100% sensitivity for predicting death. That is, 100% of nonsurvivors have a mortality prediction greater than line (i). Line (ii) represents the cutoff point corresponding to 100% specificity for predicting death. That is, there are no survivors beyond line (ii). Line (iii) represents the optimal tradeoff between sensitivity and specificity. Most of the patients who die have a risk score above this cutoff point, and most of the patients who survive have a risk score below this cutoff point. Sensitivity and specificity are further discussed in Appendix 2.
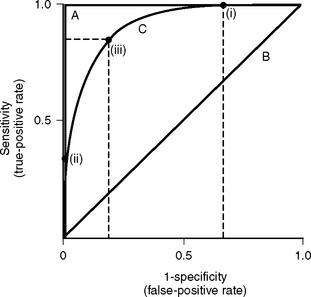
Figure 41.2 Receiver operating characteristic (ROC) curves for mortality prediction. ROC curves are constructed by plotting sensitivity (true-positive fraction) against 1-specificity (false-positive fraction) for all levels (cutoffs) of predicted risk from 0% to 100%. Three curves are shown; they correspond to A, B, and C in Fig. 41-1. For curve A, as sensitivity rises there is no loss of specificity (and as specificity rises, there is no loss of sensitivity). This model has perfect discrimination, and the area under the ROC curve is 1.0 (see text). For curve B, as sensitivity rises there is loss of specificity by an exactly equal amount, and vice versa. This model has no discrimination, and the area under the ROC curve is 0.5 (see text). Curve C is more typical of cardiac risk scores. A sensitivity of 100% is associated with a specificity of about 30% (i.e., 1-specificity of 0.7). This is shown as point (i) on curve C. A specificity of 100% (i.e., 1-specificity of 0) is associated with a sensitivity of about 30%. This is shown as point (ii) on curve C. Point (iii) represents the risk score at which sensitivity and specificity are both optimal, in this case about 80% for each. The area under curve C is about 0.85, which represents a high degree of discrimination—most risk models in medicine and surgery perform well below this. Sensitivity and specificity are defined formally in Appendix 2.
Choice of Risk Models
The two most important cardiac surgery risk-scoring systems currently in use are the EuroSCORE and the system developed from the STS National Cardiac Surgery Database. The STS database was established in 1989 and is the largest cardiac surgery database in the world. In 2004 there were 638 contributing hospitals, and it contained information from more than 2 million surgical procedures.5,9 Participating hospitals submit their data to the STS on a biannual basis and receive detailed reports after analysis of the data from all participants. Reports contain risk-adjusted measures of mortality rates, which allow participating hospitals to benchmark their results against regional and national standards. The reports also provide data for research projects. Risk scoring is based on 24 patient-, cardiac-, and operation-related predictor variables. An online risk calculator is available from the STS website (www.sts.org) at http://66.89.112.110/STSWebRiskCalc/. The web calculator provides mortality predictions for five main operations: CABG surgery, aortic valve replacement, mitral valve replacement, CABG surgery plus aortic valve replacement, and CABG surgery plus mitral valve replacement. In addition, outcome predictions for five morbidities in CABG surgery are also provided: reoperation, permanent stroke, renal failure, deep sternal wound infection, and prolonged ventilation. Unlike other risk-scoring systems, the STS system has not released into the public domain the logistic regression equations it uses.
The EuroSCORE was developed from a prospective database of more than 19,000 patients involving 132 centers in eight European countries.10 Data were collected over a 3-month period in 1995. Two forms of the EuroSCORE have been developed—the additive score and the logistic score. Both are based on the same 17 predictor variables. The additive score is shown in Table 41-2. The EuroSCORE website (www.EuroSCORE.org) provides the β coefficients for the logistic regression equation and makes available online and downloadable risk calculators for the logistic score. In head-to-head comparisons, the EuroSCORE has been shown to have better discrimination than other scoring systems (i.e., a higher area under the ROC curve).11–13 However, some investigators have found that the EuroSCORE (both additive and logistic) tends to overestimate observed mortality risk across a range of risk profiles (i.e., limited calibration).12,14,15 This may indicate that the EuroSCORE should be recalibrated to account for changes in patients and practices since it was developed in the 1990s. By contrast, other investigators have found that the additive EuroSCORE tends to underestimate observed risk in high-risk patients16,17 and in patients undergoing combined valve and CABG surgery.18
| Patient-Related Factors | Score | |
|---|---|---|
| Age | Per 5 years or part thereof over 60 years | 1 |
| Sex | Female | 1 |
| Chronic pulmonary disease | Long-term use of bronchodilators or steroids for lung disease | 1 |
| Extracardiac arteriopathy | Any one or more of the following: claudication, carotid occlusion or >50% stenosis, previous or planned intervention in the abdominal aorta, limb arteries, or carotids | 2 |
| Neurologic dysfunction disease | Severely affecting ambulation or day-to-day functioning | 2 |
| Previous cardiac surgery | Requiring opening of the pericardium | 3 |
| Serum creatinine | Greater than 200 m μ/l preoperatively | 2 |
| Active endocarditis | Patient still under antibiotic treatment for endocarditis at the time of surgery | 3 |
| Critical preoperative state | Any one or more of the following: ventricular tachycardia or fibrillation or aborted sudden death, preoperative cardiac massage, preoperative ventilation before arrival in the anesthetic room, preoperative inotropic support, intraaortic balloon counterpulsation or preoperative acute renal failure (anuria or oliguria <10 ml/hour) | 3 |
| Cardiac-Related Factors | Score | |
| Unstable angina | Rest angina requiring IV nitrates until arrival in the anesthetic room | 2 |
| LV dysfunction | Moderate or LVEF 30% to 50% | 1 |
| Poor or LVEF <30 | 3 | |
| Recent myocardial infarction | Within 90 days | 2 |
| Pulmonary hypertension | Systolic PA pressure >60 mmHg | 2 |
| Operation-Related Factors | Score | |
| Emergency | Carried out on referral before the beginning of the next working day | 2 |
| Other than isolated CABG | Major cardiac procedure other than or in addition to CABG | 2 |
| Surgery on thoracic aorta | For disorder of ascending, arch, or descending aorta | 3 |
| Post myocardial infarction septal rupture | 4 |
CABG, coronary artery bypass graft; LV, left ventricular; LVEF, left ventricular ejection fraction; PA, pulmonary arterial.
Note: If a risk factor is present in a patient, a score is assigned. The weights are added to give an approximate percent predicted mortality.
Applications of Risk Scores
It is important to appreciate an essential limitation in applying risk scores to individuals. For a dichotomous variable such as mortality, the observed outcome (died or survived) never matches the predicted outcome (e.g., 10% mortality risk) on an individual level (i.e., individuals cannot be 10% dead!). Thus, a risk model may correctly identify that 10 out of 100 patients with a given set of risk factors may die, but not which 10. Also, because mortality predictions are risk estimates, some authors have suggested that mortality-risk predictions for individual patients should be accompanied by confidence limits, indicating their uncertainty.5,19 However, currently used risk models do not routinely provide these confidence limits. Furthermore, other authors have questioned the benefit of confidence limits because by not correcting for random or systematic errors, they do not cover the total uncertainty of the measurement.20
A common way of reporting the performance of individuals or institutions is the ratio of the observed to the expected mortality rates, the O/E ratio. An O/E ratio greater than 1 reflects a higher than expected mortality rate; a value less than 1 represents a lower than expected mortality. O/E ratios must be interpreted with caution. When the sample size is small (i.e., low-volume providers), outcomes may be influenced by random events. Also, O/E ratios do not accurately account for nonrandom allocation; for instance, the high prevalence of heart failure in a heart transplant center. Because of the limitations of risk-scoring systems, it is important that individuals and institutions that are identified as statistical outliers are not arbitrarily labeled as substandard.5
Surgical performance charts
One approach to monitoring surgical performance that has become popular over the past decade is surgical performance charts,21,22 also known as quality-control charts. Surgical performance charts graphically display performance (either raw or risk-adjusted) over time and allow random (common-cause) variation to be distinguished from special-cause variation (due to changes in performance). A number of different methods may be used, including cumulative sum (cusum) charts, risk-adjusted cusum charts, sequential probability ratio tests, and variable life-adjusted display (VLAD) charts. Only VLAD charts are discussed here.
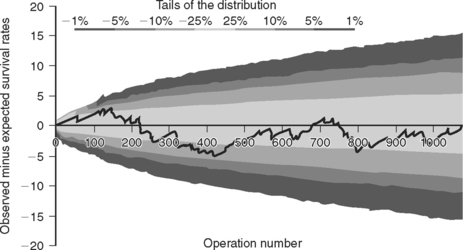
VLAD charts are plots of the cumulative observed minus expected survival rates against the cumulative number of operations. Observed survival is equal to 1 (survived) or 0 (died). Expected survival is calculated as 1 minus expected mortality. Thus, if the predicted mortality for a patient is 10% (0.1), the expected survival is 0.9. With each operation the chart rises for a survival and falls for a death. For example, if a patient has a predicted mortality of 10% and he or she survives, the plot increases by 0.1 (1 − 0.9); if he or she dies, the plot decreases by 0.9 (0 − 0.9). Similarly, if a patient with a 25% predicted mortality dies, the plot falls by 0.75, whereas if the patient survives, the plot increases by 0.25. In this way, the high-risk patients carry the highest “reward” for success and the lowest “penalty” for failure. If there is no difference between observed and expected performance over a series of operations, the chart appears as a line that tracks around the X-axis. If observed performance consistently exceeds expected performance, the chart deviates positively, and vice versa. To help distinguish deviations due to random variation from changes in performance, boundary lines may be drawn on the chart; they provide the levels of probability that deviation from expected performance is due to chance. A Microsoft Excel spreadsheet for creating VLAD charts with boundary lines, which employs the logistic EuroSCORE for calculating expected risk, is available for download from The Clinical Operational Research Unit at University College London (www.ucl.ac.uk/operational-research/vladdownloadz.htm). For each operation, the outcome (survived or died) along with the 17 EuroSCORE predictor variables are entered, and the VLAD chart is automatically updated. An example of a VLAD chart using these principles—but in this case, for a congenital cardiac risk model, not the EuroSCORE—is shown in Figure 41-3.
Predicting Morbidity
The cardiac surgery scoring systems previously discussed are designed primarily for predicting mortality. However, morbidities, such as prolonged ICU stay, stroke, renal failure, and cognitive impairment, have important cost and quality-of-life implications. Unfortunately, morbidity data are more difficult to collect than mortality data and, because definitions of morbid events are nonstandard, they are subject to bias. As noted, morbidity prediction is provided with the STS national database for patients undergoing CABG surgery but not for patients undergoing other cardiac operations. Although some authors have found the EuroSCORE useful for morbidity prediction, particularly for prolonged length of ICU stay,23,24 the score was not developed for that purpose. Furthermore, other authors have found the EuroSCORE (and other mortality scoring systems) to be of limited use for predicting morbidity.12 Specific morbidities are predicted by the presence of certain preoperative risk factors. For instance, the presence of preoperative renal dysfunction is a powerful predictor of postoperative renal failure. Risk factors for specific postoperative morbidities are discussed in their appropriate chapters.
An issue separate from predicting morbidity and mortality based on preoperative risk is predicting futile treatment in individuals who have unexpectedly complicated postoperative courses. This is of great clinical importance because if it were possible to identify factors that were highly predictive of imminent death or very poor quality of life, cessation of intensive therapies may be justified. Unfortunately, identification of such factors is very difficult. In one study of 194 cardiac surgery patients requiring at least 5 days of postoperative ventilation, the 30-day and 1-, 2-, and 3-year mortality rates were 91.3%, 85.6%, 80.9%, and 75.1%, respectively. At 1 year, 72% of survivors had no physical symptoms or minimal physical symptoms; 6% were defined as disabled and 3% as severely handicapped. Of the 19 potential predictors of poor outcome that were considered, only dialysis was predictive of reduced long-term survival and only sustained neurologic deficit was predictive of poor functional outcome. At 1 year, 80% of patients considered themselves to be in better condition than they had been in their preoperative states.25 In another study of 148 patients who required at least 7 days of postoperative ventilation, survival at hospital discharge and long-term follow-up (36 ± 12 months) were 54.7% and 39.1%, respectively; of survivors, 69% had no limitation or mild limitation in daily living at long-term follow-up.26 Thus, most patients who survive a prolonged ICU stay do so with a good quality of life that is maintained over time.
QUALITY IMPROVEMENT IN THE ICU
Quality improvement (QI), also known as quality assessment or quality assurance, is an organized process in which health services are assessed and evaluated to improve practice or quality of care. The characteristics by which quality in healthcare is defined are listed in Table 41-3. Central to all of these characteristics is that healthcare should be centered on the needs of the patient.
Table 41-3 The Characteristics by Which Quality in Healthcare is Defined
| Access |
| Efficacy and effectiveness |
| Efficiency |
| Safety |
| Timeliness |
| Acceptability |
| Appropriateness |
QI is composed of three core elements: structure, process, and outcome.27 Structure refers to the way patient care is organized, and for an ICU, it refers to issues such as the size and staffing of the unit, whether the unit is open or closed, and the technology that is available. Process refers to what is done or fails to be done and has clinical (e.g., patient care algorithms, regular rounding by an intensivist) and nonclinical (e.g., organizational management, continuing medical education) components. Outcome refers to the results that are achieved. Although risk-adjusted mortality rate is the most widely used parameter, to fully assess ICU quality, multiple outcome measures should be employed (Table 41-4).
Table 41-4 Outcome Measures That May Be Collected in a Cardiothoracic ICU
| Standardized mortality rate |
| Deep sternal wound infection rate |
| Chest reopening rate |
| Central venous catheter bloodstream infection rate |
| Multidrug-resistant microorganism infection rate |
| Serious adverse drug event rate |
| Unplanned extubation rate |
| Reintubation rate |
| Unscheduled readmission to ICU within 24 to 48 hours of discharge |
| Family satisfaction |
ICU, intensive care unit.
Modified from Curtis JR, Cook DJ, Wall RJ, et al: Intensive care unit quality improvement: a “how-to” guide for the interdisciplinary team. Crit Care Med 34:211-218, 2006.
A QI program functions at a number of levels (individual, unit, institution) and comprises a range of activities. Although there are no strict definitions, activities that are relevant for an ICU-based QI program are listed in Table 41-5. All healthcare professionals should participate in a QI program, and each program should have a coordinator who is responsible for its supervision and implementation. QI programs are often organized along professional lines (cardiac surgeons, intensivists, ICU nurses, cardiologists, anesthesiologists, etc.). However, when possible, individual QI programs should be linked together as part of a wider hospital QI program, for example, for the reporting of critical incidents. QI is a broad topic; interested readers are referred to recent review articles on the subject.27–30 Only three areas of quality improvement are discussed further here: (1) implementing evidence-based medicine; (2) adverse events, errors, and critical-incident reporting; (3) the role of intensivists in improving outcomes.
Table 41-5 Quality Improvement Activities for an ICU-Based Quality Improvement Program
| Evaluation of departmental structure and performance |
| Staff |
| Numbers and qualifications (medical, nursing, technical, secretarial) |
| Appointment criteria; allocation of duties; levels of supervision |
| Workload and conditions of work |
| Assessment of staff well-being |
| Physical facilities |
| Working space for clinical and nonclinical duties |
| Equipment, including compliance with standards, maintenance, and replacement |
| Finances |
| Budgets |
| Expenditures |
| Research and teaching programs within the ICU |
| Evaluation of patient management activities |
| Monitoring of admission and discharge |
| Risk-adjusted morbidity and mortality |
| Diagnostic methods used |
| Integration of best evidence into medical practice |
| Indications for specific therapies |
| Record keeping |
| Evaluation of performance of ICU staff |
| Annual performance reviews |
| Participation in a CME or MOPS program |
| Health, morale, safety |
| Teaching and research |
| Peer reviews |
| Mortality and morbidity meetings |
| Reviews of randomly selected patients |
| Critical incident monitoring |
| Patient/relative surveys |
CME, continuing medical education; ICU, intensive care unit; MOPS, maintenance of professional standards.
Implementing Evidence-Based Medicine in Clinical Practice
Evidence-based medicine “is the conscientious, explicit, and judicious use of current best evidence to make decisions about the care of individual patients.”31 Despite the publication of more than 10,000 randomized trials each year, the increased development of evidence-based treatment guidelines, and widespread interest in the subject, evidence-based best practice is not always incorporated into routine clinical care.32,33 Barriers to the implementation of evidence-based medicine include lack of knowledge of best practice, lack of agreement among providers about best practice, lack of practice guidelines, failure to adhere to practice guidelines, and financial or time disincentives. A physician-centered model of patient care, in which healthcare is determined primarily by the knowledge, memory, preferences, and best intentions of a senior physician, may also limit the implementation of evidence-based best practice.
Strategies to increase the implementation of evidence-based medicine include (1) participation of healthcare professionals in continuing medical education programs; (2) audit of and feedback concerning clinical care; (3) the development of practice guidelines; (4) the use of standing orders for the treatment of common problems; (5) the use of treatment protocols by default rather than by the requirement of active decision; (6) the use of electronic and physical reminders; (7) changes in the structure of the ICU from a physician-centered to a patient-centered model of care.30,34 To achieve the last goal, it is necessary to develop a cooperative approach in which there is input from and communication among medical, nursing, and technical staff on all issues relating to patient care. In such a model, the responsibility for implementing evidence-based medicine shifts from senior physicians to the unit as a whole.
Table 41-6 Levels of Evidence for Therapy as Defined by the Oxford Centre for Evidence-Based Medicine
| 1a | Systematic review of randomized controlled trials (with homogeneity*) |
| 1b | Individual randomized controlled trial with narrow confidence interval |
| 1c | All-or-none case series |
| 2a | Systematic review of cohort studies (with homogeneity) |
| 2b | Individual cohort study or low-quality randomized controlled trial |
| 3a | Systematic review of case-control studies (with homogeneity) |
| 3b | Individual case-control studies |
| 4 | Case series and poor cohort or case-control studies |
| 5 | Expert opinion without explicit critical appraisal, or based on physiology, bench research, or “first principles” |
Note: See http://www.cebm.net/levels_of_evidence.asp.
* Homogeneity refers to a systematic review that is free of worrisome variations in the directions and degrees of results among individual studies.
Table 41-7 Classification of Recommendations as Defined by the Oxford Centre for Evidence-Based Medicine
| A | Consistent level 1 studies |
| B | Consistent level 2 or 3 studies or extrapolations from level 1 studies |
| C | Level 4 studies or extrapolations from level 2 or 3 studies |
| D | Level 5 evidence or troublingly inconsistent or inconclusive studies of any level |
Note: See http://www.cebm.net/levels_of_evidence.asp.
When reviewing published studies, a number of points must be considered. First, the quality of the research must be evaluated. Thus, systematic reviews involving multiple, multicenter, prospective randomized, controlled trials are given more weight than single-center, randomized, controlled trials (particularly if published by advocates of a particular therapy); in turn, those are given more weight than cohort studies or case control studies. Numerous ways of ranking evidence have been developed; the method used by the Oxford Centre for Evidence Based Medicine (http://www.cebm.net/index.asp) is shown in Table 41-6. This system differs, for example, from that used by the American College of Cardiology and the American Heart Association.
Second, it is important to ensure that results obtained in study populations are relevant to one’s own patients. Thus, the results of a trial concerning blood pressure management in young septic patients may not be directly transferable to elderly cardiac surgery patients (see page 296). Similarly, the lack of benefit of an intervention in one study population does not indicate a lack of benefit in another or, indeed, in specific individuals. This principle is relevant to the debate about pulmonary artery catheterization, as outlined in Chapter 8.
The ease of implementation, the safety, and the cost-benefit ratio of interventions must also be considered. These issues are encapsulated in the study of tight glucose control by van den Berghe and colleagues, which demonstrated improved survival rates in critically ill patients when a glucose level of between 80 and 110 mg/dl (4.4-6.1 mmol/l) was targeted (see Chapter 36).35 The following points should be noted. (1) The study involved only surgical ICU patients (despite being titled Intensive Insulin Therapy in Critically Ill Patients), of whom 60% had undergone cardiac surgery. (2) The survival benefit occurred principally among patients staying in the ICU for more than 5 days (which constitutes a small proportion of most cardiac surgery patients). (3) An aggressive approach to intravenous nutrition (including the use of concentrated dextrose solutions) was used in both study and control patients—a strategy that is not widely practiced and may have influenced the results. (4) Without meticulous attention to detail (such as that which occurs in a study), targeting a blood glucose of 80 to 110 mg/dl carries a significant risk for causing hypoglycemia. For these reasons, and on the basis of this paper alone, it could be argued that the institution of aggressive insulin therapy (targeting a blood glucose of 80 to 110 mg/dl) in all cardiac surgery patients is not justified. However, based on this and other studies, it is probably appropriate to treat hyperglycemia (e.g., blood glucose >180 mg/dl or 10 mmol/l), particularly in diabetics and critically ill patients (see Chapter 36), while the results of other studies are awaited. Many aspects of care in the cardiothoracic ICU are suitable for treatment guidelines or protocols based on best available evidence; some of these are listed in Table 41-8.
Table 41-8 Some of the Aspects of Care in the Cardiothoracic ICU That Are Suitable for Protocolized Care Based on Evidence-Based Medicine
| Routine management of postoperative cardiac surgery patients | Chapter 17 |
| Prophylaxis against deep venous thrombosis | Chapter 17 |
| Use of sedation and analgesia for patients requiring prolonged ICU stay | Chapter 4 |
| Treatment of acute pulmonary edema | Chapters 19, 28, and 29 |
| Treatment of acute coronary syndromes | Chapter 18 |
| Prophylaxis and treatment of atrial fibrillation | Chapter 21 |
| Use of pulmonary artery catheters | Chapters 8 and Chapter 20 |
| Institution of mechanical cardiac support | Chapter 22 |
| Diagnosis and treatment of massive pulmonary embolism | Chapter 23 |
| Diagnosis and treatment of massive hemoptysis | Chapter 26 |
| Stress ulcer prophylaxis | Chapter 34 |
| Institution of enteral nutrition | Chapter 34 |
| Prevention of ventilator-associated pneumonia | Chapter 35 |
| Prevention of sternal wound infections | Chapter 35 |
| Prevention of central venous catheter bloodstream infections | Chapter 35 |
| Rational use of antimicrobial therapy | Chapter 35 |
| Treatment of sepsis | Chapter 35 |
| Ventilation strategies for acute lung injury | Chapter 29 |
| Rational use of blood component therapy | Chapter 30 |
| Control of hyperglycemia | Chapter 36 |
ICU, intensive care unit.
Adverse Events, Errors, Violations, and Incident Reporting
The term “adverse event” may be defined as any injury that occurs as the result of medical management rather than because of the underlying disease; the term “medical error” may be defined as the unintentional use of the wrong plan to achieve an aim or as failure to carry out a planned action as intended.36,37 Violations may be defined as acts that are known to incur risks; violations differ from errors in that they imply an element of choice.38 Not all adverse events are the result of error (e.g., a rash due to a previously unknown drug sensitivity), and not all errors cause adverse events. Both adverse events and medical errors occur commonly in patients admitted to ICUs. For instance, in one study using direct observation, errors in drug administration occurred in 30% of ICU patients.39 In another study, employing a combination of direct observation and voluntary and solicited incident reporting, adverse events occurred to 20% of patients.36 Of these adverse events, 45% were considered preventable, and 12% were considered life threatening. In an autopsy study, missed diagnoses, which may have influenced therapy, were identified in 39% of patients who died in an ICU.40
Errors and adverse events occur in all complex systems, and in many cases are caused or facilitated by established structures and systems.38 The first step in reducing errors and adverse events is to identify them accurately. The second step is to implement robust processes to analyze and respond to them.
Identification of Critical Incidents
Hospitals typically have incident reporting systems to identify adverse events and errors. A major limitation of these systems is that they dramatically underreport the true incidence of adverse events. For instance, in one study of ICU patients, of 54 adverse drug events identified by stimulated self-report and daily chart review, only 3 resulted in an incident report or a call to the pharmacy hotline.41 Reasons for underreporting include a perceived risk for liability or blame, lack of feedback, and the burden of reporting.42 Methods to improve reporting include making the reporting system voluntary and anonymous, having a no-blame approach (with exceptions; see subsequent material), and focusing on the deficits of the system and processes, not on the individual.42
Critical Incident Analysis and Response
The most common method of analyzing adverse events is discussion of them at regular, usually monthly, morbidity and mortality case review sessions. Such sessions are widely used by cardiac surgeons, intensivists, and anesthesiologists, and they have the potential to influence quality: in one study, not having monthly morbidity and mortality review sessions was significantly associated with increased use of ICU resources.43 However, it is important that morbidity and mortality reviews adhere to the principles of incident reporting outlined earlier; that is, there should be a no-blame approach (see subsequent material), and focus should be on deficits in the system not on the individual. It is also important that the meetings be structured, including having an agenda, recording minutes (with patient and clinician identifiers removed), and forming action plans to ensure that appropriate changes in structure and process occur.
In addition to monthly meetings to discuss morbidity and mortality rates, processes should exist for more detailed analyses of errors and serious adverse events. A number of techniques have been developed for in-depth analysis of critical incidents, including critical incident technique, significant event auditing, root cause analysis, and the organizational accident causation model. (For more information the interested reader is referred to the detailed review by Woloshynowych and colleagues.44) In the United States, the most widely used of these techniques is root cause analysis. The Joint Commission on Accreditation of Healthcare Organizations (JCAHO), the predominant standards-setting and accrediting body in healthcare in the United States, requires hospitals to use root cause analysis to investigate serious incidents such as deaths related to delayed treatment. Root cause analysis is a “systematic approach that drills down deep to identify the basic reason(s) for the problem—the root cause” by repeatedly asking “why” questions until no further logical answers can be obtained.44 The focus of root cause analysis is identifying the systems and processes, rather than the individuals, that led to the event so as to reduce the chance that it will occur in the future. It is carried out by healthcare professionals knowledgeable in the area under consideration. The JCAHO website (www.jointcommission.org/) provides a range of forms and tools for undertaking root cause analysis, including a detailed 21-step guide.
Simplified approaches have also been developed, including that of Amo,45 in which analysis is based on seven steps: (1) identifying the incident to be analyzed; (2) organizing a team to carry out the analysis; (3) studying the work processes; (4) collecting the facts; (5) searching for the cause; (6) taking action; (7) evaluating the action.44 Criticisms of root cause analysis are that it is reactive rather proactive, that there is poor agreement among experts about the causes of adverse events, and that, rather than identifying and improving structures, the response of many institutions to a serious adverse event is to add layers of complexity to processes, thus creating an even more maladaptive system.30
If an adverse event or a medical error results in harm, it should be disclosed to the affected patient and their family in an open, honest, and timely manner.46,47 This requires setting aside a specific time to meet with the patient and the family, often more than once. The patient and the family may wish to be accompanied by an advocate or knowledgeable friend; this should be encouraged. Even when not directly involved, the attending physician (intensivist or cardiac surgeon) should take the lead in these discussions. The event and the likely consequences should be described as clearly as possible, using nonmedical terms, and if an error has occurred, a genuine apology by each participant for his or her part in the error should be provided.46 When the process of critical incident analysis is complete, the results and recommendations for change should be fed back to the patient and the family.
Issue of Blame
Blaming and punishing well-intentioned individuals who make errors exacerbates underreporting and may increase patient harm.37,38 Conversely, failure to assign blame when it is appropriate to do so, for example, for intentional harm or behavior that is grossly reckless, undermines trust in the medical profession as well as its accountability. Adverse events should be triaged early, and when it is apparent that an individual or individuals may be blameworthy, dealt with separately from the usual process of incident analysis.
Role of the Intensivist in Improving Outcomes
One factor that has been shown to improve outcome in ICUs is the presence of dedicated ICU physicians (intensivists). In a systematic review of randomized and observational controlled trials, ICUs with high-intensity input by intensivists, in which intensivist consultation was mandatory or the ICU functioned as a closed unit (all care directed by intensivist), were associated with significantly lower mortality rates than were ICUs with low-intensity input by intensivists, that is, ICUs in which there was either no intensivist input or intensivist consultation was elective.48 Furthermore, a recent financial analysis by the same group indicates the potential for substantial cost savings when using an intensivist model of ICU staffing compared with the traditional open unit model widely used in the United States.49 The benefits of having dedicated ICU physicians are likely to apply equally well to cardiothoracic ICUs: in one small nonrandomized study (using historical controls) of cardiac surgery patients, the introduction of attending physicians dedicated to ICU care was associated with a reduced postoperative intubation time and reduced costs.50
1 Green J, Wintfeld N. Report cards on cardiac surgeons. Assessing New York State ’s approach. N Engl J Med. 1995;332:1229-1232.
2 Zimmerman JE, Kramer AA, McNair DS, et al. Acute Physiology and Chronic Health Evaluation (APACHE) IV: hospital mortality assessment for today ’s critically ill patients. Crit Care Med. 2006;34:1297-1310.
3 Heijmans JH, Maessen JG, Roekaerts PM. Risk stratification for adverse outcome in cardiac surgery. Eur J Anaesthesiol. 2003;20:515-527.
4 Omar RZ, Ambler G, Royston P, et al. Cardiac surgery risk modeling for mortality: a review of current practice and suggestions for improvement. Ann Thorac Surg. 2004;77:2232-2237.
5 Shahian DM, Blackstone EH, Edwards FH, et al. Cardiac surgery risk models: a position article. Ann Thorac Surg. 2004;78:1868-1877.
6 Marshall G, Grover FL, Henderson WG, et al. Assessment of predictive models for binary outcomes: an empirical approach using operative death from cardiac surgery. Stat Med. 1994;13:1501-1511.
7 Steyerberg EW, Eijkemans MJ, Harrell FEJr, et al. Prognostic modeling with logistic regression analysis: a comparison of selection and estimation methods in small data sets. Stat Med. 2000;19:1059-1079.
8 Grunkemeier GL, Jin R. Receiver operating characteristic curve analysis of clinical risk models. Ann Thorac Surg. 2001;72:323-326.
9 Welke KF, Ferguson TBJr, Coombs LP, et al. Validity of the Society of Thoracic Surgeons National Adult Cardiac Surgery Database. Ann Thorac Surg. 2004;77:1137-1139.
10 Roques F, Nashef SA, Michel P, et al. Risk factors and outcome in European cardiac surgery: analysis of the EuroSCORE multinational database of 19030 patients. Eur J Cardiothorac Surg. 1999;15:816-822.
11 Nilsson J, Algotsson L, Hoglund P, et al. Early mortality in coronary bypass surgery: the EuroSCORE versus The Society of Thoracic Surgeons risk algorithm. Ann Thorac Surg. 2004;77:1235-1239.
12 Geissler HJ, Holzl P, Marohl S, et al. Risk stratification in heart surgery: comparison of six score systems. Eur J Cardiothorac Surg. 2000;17:400-406.
13 Nilsson J, Algotsson L, Hoglund P, et al. Comparison of 19 pre-operative risk stratification models in open-heart surgery. Eur Heart J. 2006;27:867-874.
14 Bhatti F, Grayson AD, Grotte G, et al. The logistic EuroSCORE in cardiac surgery: how well does it predict operative risk ? Heart. 2006;92:1715-1716.
15 Yap CH, Reid C, Yii M, et al. Validation of the EuroSCORE model in Australia. Eur J Cardiothorac Surg. 2006;29:441-446. discussion 446
16 Michel P, Roques F, Nashef SA. Logistic or additive EuroSCORE for high-risk patients ? Eur J Cardiothorac Surg. 2003;23:684-687.
17 Gogbashian A, Sedrakyan A, Treasure T. EuroSCORE: a systematic review of international performance. Eur J Cardiothorac Surg. 2004;25:695-700.
18 Karthik S, Srinivasan AK, Grayson AD, et al. Limitations of additive EuroSCORE for measuring risk stratified mortality in combined coronary and valve surgery. Eur J Cardiothorac Surg. 2004;26:318-322.
19 Kuss O, Borgermann J. Prognoses from the logistic EuroSCORE are statistical estimates that require confidence intervals. Eur J Cardiothorac Surg. 2005;27:1129. au reply 1129-1132
20 Michel P, Domecq S, Salmi L, et al. Reply to “Prognoses from the logistic EuroSCORE are statistical estimates that require confidence intervals.”. Eur J Cardiothorac Surg. 2005;27:1129-1132.
21 Rogers CA, Reeves BC, Caputo M, et al. Control chart methods for monitoring cardiac surgical performance and their interpretation. J Thorac Cardiovasc Surg. 2004;128:811-819.
22 Sherlaw-Johnson C, Gallivan S, Treasure T, et al. Computer tools to assist the monitoring of outcomes in surgery. Eur J Cardiothorac Surg. 2004;26:1032-1036.
23 Toumpoulis IK, Anagnostopoulos CE, Swistel DG, et al. Does EuroSCORE predict length of stay and specific postoperative complications after cardiac surgery ? Eur J Cardiothorac Surg. 2005;27:128-133.
24 Toumpoulis IK, Anagnostopoulos CE. Does EuroSCORE predict length of stay and specific postoperative complications after heart valve surgery ? J Heart Valve Dis. 2005;14:243-250.
25 Gersbach P, Tevaearai H, Revelly JP, et al. Are there accurate predictors of long-term vital and functional outcomes in cardiac surgical patients requiring prolonged intensive care ? Eur J Cardiothorac Surg. 2006;29:466-472.
26 Pappalardo F, Franco A, Landoni G, et al. Long-term outcome and quality of life of patients requiring prolonged mechanical ventilation after cardiac surgery. Eur J Cardiothorac Surg. 2004;25:548-552.
27 Curtis JR, Cook DJ, Wall RJ, et al. Intensive care unit quality improvement: a “how-to” guide for the interdisciplinary team. Crit Care Med. 2006;34:211-218.
28 Pronovost PJ, Miller MR, Dorman T, et al. Developing and implementing measures of quality of care in the intensive care unit. Curr Opin Crit Care. 2001;7:297-303.
29 Garland A. Improving the ICU: Part 1. Chest. 2005;127:2151-2164.
30 Garland A. Improving the ICU: Part 2. Chest. 2005;127:2165-2179.
31 Sackett DL, Rosenberg WM, Gray JA, et al. Evidence-based medicine: what it is and what it isn ’t. BMJ. 1996;312:71-77.
32 Schuster MA, McGlynn EA, Brook RH. How good is the quality of health care in the United States ? Milbank Q. 1998;76:517-563.
33 McGlynn EA, Asch SM, Adams J, et al. The quality of health care delivered to adults in the United States. N Engl J Med. 2003;348:2635-2645.
34 Grol R, Grimshaw J. From best evidence to best practice: effective implementation of change in patients ’ care. Lancet. 2003;362:1225-1230.
35 van den Berghe G, Wouters P, Weekers F, et al. Intensive insulin therapy in critically ill patients. N Engl J Med. 2001;345:1359-1367.
36 Rothschild JM, Landrigan CP, Cronin JW, et al. The Critical Care Safety Study: The incidence and nature of adverse events and serious medical errors in intensive care. Crit Care Med. 2005;33:1694-1700.
37 Runciman WB, Merry AF, Tito F. Error, blame, and the law in health care —an antipodean perspective. Ann Intern Med. 2003;138:974-979.
38 Merry AF, McCall Smith A. Errors, Medicine and the Law. Cambridge, U.K.: Cambridge University Press, 2001.
39 van den Bemt PM, Fijn R, van der Voort PH, et al. Frequency and determinants of drug administration errors in the intensive care unit. Crit Care Med. 2002;30:846-850.
40 Perkins GD, McAuley DF, Davies S, et al. Discrepancies between clinical and postmortem diagnoses in critically ill patients: an observational study. Crit Care. 2003;7:R129-R132.
41 Cullen DJ, Bates DW, Small SD, et al. The incident reporting system does not detect adverse drug events: a problem for quality improvement. Jt Comm J Qual Improv. 1995;21:541-548.
42 Wu AW, Pronovost P, Morlock L. ICU incident reporting systems. J Crit Care. 2002;17:86-94.
43 Pronovost PJ, Jenckes MW, Dorman T, et al. Organizational characteristics of intensive care units related to outcomes of abdominal aortic surgery. JAMA. 1999;281:310-317.
44 Woloshynowych M, Rogers S, Taylor-Adams S, et al. The investigation and analysis of critical incidents and adverse events in healthcare. Health Technol Assess. 2005;9:1-158.
45 Amo MF. Root cause analysis: a tool for understanding why accidents occur. Balance. 1998;2:12-15.
46 Boyle D, O’ Connell D, Platt FW, et al. Disclosing errors and adverse events in the intensive care unit. Crit Care Med. 2006;34:1532-1537.
47 Lamb R. Open disclosure: the only approach to medical error. Qual Safety Healthcare. 2004;13:3-5.
48 Pronovost PJ, Angus DC, Dorman T, et al. Physician staffing patterns and clinical outcomes in critically ill patients: a systematic review. JAMA. 2002;288:2151-2162.
49 Pronovost PJ, Needham DM, Waters H, et al. Intensive care unit physician staffing: financial modeling of the Leapfrog standard. Crit Care Med. 2004;32:1247-1253.
50 Cannon MA, Beattie C, Speroff T, et al. The economic benefit of organizational restructuring of the cardiothoracic intensive care unit. J Cardiothorac Vasc Anesth. 2003;17:565-570.
51 Kang N, Tsang VT, Gallivan S, et al. Quality assurance in congenital heart surgery. Eur J Cardiothorac Surg. 2006;29:693-697.