[level-membership-for-anesthesiology-category]
Chapter 14 Physiological monitoring
Principles and non-invasive monitoring
Introduction
Monitoring the state of both the patient’s physiology and the function of the anaesthesia delivery system is now an integral part of anaesthetic practice in the developed world. In some countries standards of monitoring are not enforced by law, yet it is difficult to prove that the absence of such monitoring is responsible for significant morbidity, since the trials required to prove this would be unethical. Anaesthesia has become safer in many countries over the last few decades, despite this fact it is difficult to demonstrate that the presence of multi-mode monitoring unequivocally reduces morbidity and mortality.1 The cost of purchasing and maintaining such monitoring means it is unavailable to anaesthetists in many countries throughout the world and so the clinical monitoring skills of the anaesthetist remain crucial. Nonetheless, even in the developed world, all such standards emphasize the need for the continual presence of trained anaesthetic personnel.
The purpose monitoring is to advise the clinician of deviations from the normal and to warn of any unexpected, physiologically threatening events. In a study of closed claims in relation to deaths and cerebral damage under anaesthesia, two-thirds were found to be due to human error; of these, two-thirds were deemed to be due to problems with securing the airway, endotracheal intubation, ventilation and hypoxia.2 A series of studies concluded that of the errors reported, 80% could be avoided by routine use of the pulse oximeter which, if used in conjunction with a capnometer, would lead to avoidance of 93% of such errors.3 Fig. 14.1 shows a graphical representation of the development of a critical incident and avoidance of the harmful results which might follow.4 Arguably, it is the function of monitors to help the anaesthetist detect a critical incident early and avoid development of injury to the patient.
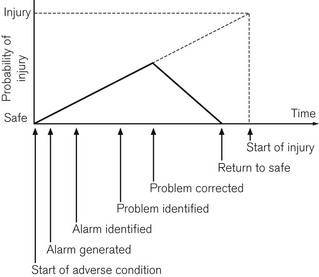
Figure 14.1 Development of a critical incident and its detection by a monitor.
From Magee P, Tooley M (2005) The physics, clinical measurement and equipment of anaesthetic practice. By permission of Oxford University Press.
There are a number of guidelines, published by various authorities such as the Association of Anaesthetists of Great Britain and Ireland (AAGBI), on minimum monitoring standards.5 These help the clinical anaesthetist select monitoring appropriate to the circumstances. It is notable how much the AAGBI guidelines defer to the anaesthetists’ own clinical judgement in this respect, since the ultimate ‘monitors’ are the anaesthetists themselves.6
Classification of monitoring equipment
There are numerous ways of classifying monitoring equipment relevant to the anaesthetist. One way might specify the physiological system that it monitors: respiratory (including gas concentration, volume, flow rate and pressure); cardiovascular (e.g. ECG, arterial and venous pressures, cardiac output); neurological (e.g. EEG, neuromuscular junction); or metabolic (e.g. temperature or blood sugar). Another might include the degree of invasiveness of the monitoring: non-invasive monitoring, such as blood pressure and electrocardiogram (ECG); partially invasive, such as naso-pharyngeal temperature; or invasive, such as central venous pressure and arterial pressure. A third method might include classification according to whether the electrical signal being monitored is naturally generated by the body (e.g. a biological electrical potential such as the ECG), transduced from another signal modality (e.g. invasive arterial blood pressure to waveform on an electronic display), or a manifestation of some form of energy input to the body (e.g. pulse oximetry, ultrasound or magnetic resonance imaging) (Fig. 14.2).
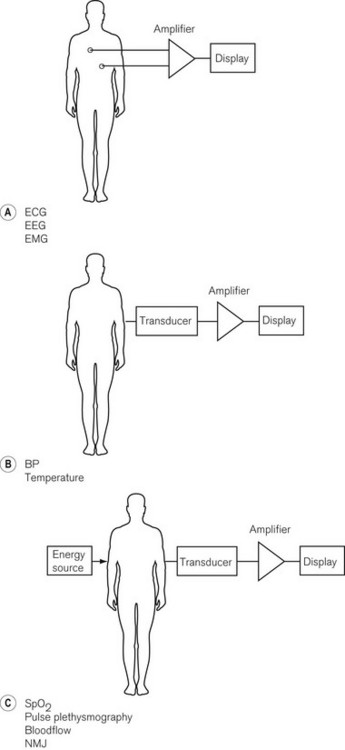
Figure 14.2 Basic classification of monitoring systems and some examples. A. Monitoring electrical signals generated by the patient. B. Conversion of measured variable to an electrical signal with a transducer. C. Passing energy through a patient and measuring the effect the patient has on it.
Important components of a monitoring system, such as an automatic non-invasive blood pressure monitor, may, therefore, include some or all of the following (Fig. 14.3):
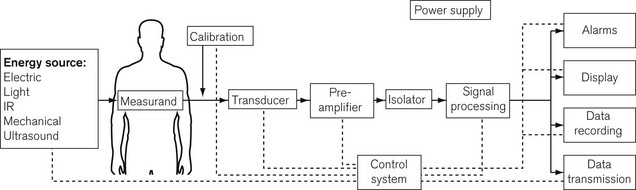
• an energy input source to the body (e.g. mechanical electrical, electromagnetic, infrared, ultrasound)
• a transducer to convert the signal from a measured physiological variable, usually to an electrical signal which can be processed. Transducers need to be zeroed and calibrated: calibration is often done at the factory and the clinician merely has to zero the transducer
• signal processing hardware and software, which amplifies the input signal, ensures the patient is safe from electrical hazards (see Chapter 23), is robust enough not to be damaged by other equipment such as diathermy apparatus or devices containing electromagnetic fields, and provides a good-quality output, free from electrical interference
• a display for easy reading and interpretation by the clinician, who should not be obliged to become preoccupied with the monitor7
• an alarm system, with visual display and annunciation that is helpful rather than distracting, and with reasonable default limits and the ability to change those limits8,9
• modern monitoring systems also have data storage ability for subsequent data analysis, and a means of data transmission to allow the data to be used by other systems such as automated record keeping10 (Chapter 22)
• a monitoring system must be intuitive and easy to use, ergonomically designed, and reliable when used under the conditions for which it is intended.
Almost all monitoring equipment is now controlled by microprocessors, making it possible to design equipment that needs minimal user calibration, offers self-diagnostics for fault conditions and also almost endless variability in user configuration of parameters.11 Single modality monitoring is becoming increasingly rare as a result of the flexibility and miniaturization possible with microprocessor control. Even greater user variability is offered in integrated monitors (one display for several variables) by the use of a modular system, in which the module for each monitored modality may be replaced during use (hot swapped) in the event of a fault or to perform a different function.
The remainder of this chapter will cover non-invasive monitoring, whatever the physiological system being monitored or the source of the electrical signal being processed. Chapter 15 covers gas monitoring and Chapters 16 and 17 cover other aspects of cardiovascular and neurophysiological monitoring.
Monitoring biological electrical potentials
All living cells have a potential difference between the outside and the inside of the cell membrane, which generates small electric currents within and between cells. Such a potential difference, when associated with excitable cells acting in unison, such as muscle or nerve, generates a current sufficient to be detected by a measurement system. Depending on the origin of the biological potential, there is a wide range of amplitudes and frequencies to be measured, processed and displayed, as shown in Table 14.1.
Table 14.1 The range of amplitudes and frequencies generated by biological potentials from different sources
| SOURCE OF BIOLOGICAL ELECTRICAL POTENTIAL | AMPLITUDES | BANDWIDTH (Hz) |
|---|---|---|
| ECG | 0.5–4.0 mV | 0.01–250 |
| EEG | 5–300 µV | DC-150 |
| EMG | 0.1–5.0 mV | DC-10000 |
The quality of the electronics within these monitors must, therefore, be of a high order to measure accurately the currents produced by such small electrical potentials within a wide range of frequencies. Amplifiers used to process biological electrical potentials should have the following properties:12
• The signal to noise ratio of the amplifiers should be high. This is the ability of an amplifier to ensure preferential amplification of the signal being measured in comparison to any electrical noise interfering with this process.
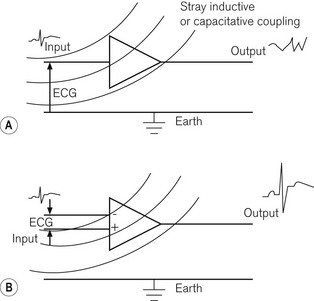
• The common mode rejection ratio should be high; this is achieved by having two input ports, one of which inverts the input signal, so that any random noise signals, such as inductively or capacitatively coupled signals, which are common to both ports, cancel each other out before entering the amplifier, while signal inputs, which are not common to both inputs to the same extent (such as the biological potential itself), are allowed to enter the amplifier. The difference between the two inputs is then subjected to electronic amplification. Fig. 14.4 shows single and double input amplifiers:


Even surface electrodes must be carefully designed in order to minimize degradation of the small surface electrical potentials. A further requirement of the monitors is high-quality electrical isolation between any parts touching the patient, such as the electrodes, and any other electrical components within the device, which might lead to an electrical hazard to the patient. This is particularly important, since it is the only situation where there is a deliberate electrical connection made between the patient and a device which might be connected to a high-voltage mains frequency source. If two pieces of electrical equipment are attached to a patient and one develops a fault allowing an unwanted earth pathway to occur, there is a risk of electrocution or diathermy burns. This is discussed in detail in Chapter 23.
The section below covers the electrocardiogram and monitoring of the neuromuscular junction, while Chapter 17 covers the electroencephalogram and its derivatives.
The electrocardiograph (ECG)
Despite the increasing intraoperative use of other monitors of cardiac function, such as ultrasound (see Chapter 16), the electrocardiogram remains extremely useful at detecting ischaemic events, providing close attention is paid to lead selection, amplification and filtering.13 The electrical depolarization and repolarization of the myocardium is detectable on the surface of the skin, by the electrocardiogram in the form of the familiar PQRST complex. This can be recorded by the use of electrodes connected to limbs and chest, which look at the electrical vector of the ECG from slightly different points of view. The relationship between the electrical axis of the heart and its detection by different limb leads was described by Einthoven in 1901. The signal from the electrodes is then fed into an amplifier, which should meet the requirements discussed above.
As indicated in Table 14.1, the electrical potential from a surface ECG is in the range 0.5–4 mV, lying in the frequency range (bandwidth) of 0.01–250 Hz. The ECG is a complex waveform, which consists of a series of sinusoidal waves with different amplitudes, frequencies and phase relationships to each other. The ability of the monitor to process the ECG waveform depends on its ability to respond to the range of different frequencies of these sinusoidal components, with faithful, unattenuated and undistorted reproduction of the signal, and with the desired amplification or gain. This is a measure of the bandwidth of the monitor and the ECG monitor should ideally have the maximum required bandwidth indicated above. This is not practicable without also allowing amplification of noise within that bandwidth, thereby interfering with the ECG signal. Noise can originate from the amplifier circuit itself, from chest muscle electrical activity, from electromagnetic interference (inductive coupling), or from capacitative coupling to neighbouring electrical equipment such as diathermy apparatus (see Chapter 24). It is, therefore, more common to reduce the bandwidth to 0.05–100 Hz in a monitor with which the clinician wishes to make a range of diagnoses and to an even narrower bandwidth of 0.5–40 Hz in a monitor used in the operating room. The effect of this narrower bandwidth is to exclude high- and low-frequency components of electrical signal, which interfere with the ECG without adversely affecting its quality or the clinician’s ability to diagnose ischaemia and arrhythmias.
Fig. 14.5 shows graphically the effect of electronic filtering, which is achieved by the addition of appropriate electronic components to an amplifier circuit. A low pass filter allows low-frequency components to pass through the amplifier, blocking high-frequency components. A high pass filter does the converse, allowing through high-frequency components. A band pass filter allows through a range of frequencies, blocking signals of frequencies above and below this bandwidth. There is a significant DC voltage of up to 25 mV at the skin–electrode interface, partly due to the resistance in the layers of the skin and partly due to the electrolytic reaction between the Ag/AgCl gel and metal component of the electrode assembly. An ECG amplifier has to eliminate this DC voltage as well as the high-frequency noise and, therefore, a band pass filter is appropriate.
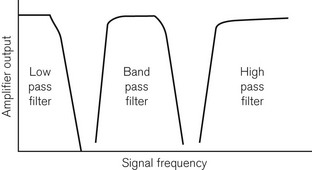
Fig. 14.6 shows a block diagram of the components of a modern ECG monitor. As discussed above, the characteristic features include a differential input to ensure common mode rejection. Electrical isolation of the amplifier is also important for reasons discussed earlier, using either an isolation transformer with good insulation between primary and secondary windings, or an optical isolator, in which the output signal from the amplifier is converted by a light-emitting diode into a light signal and converted back into an electrical signal by a photo-detector, with good insulation between the two.
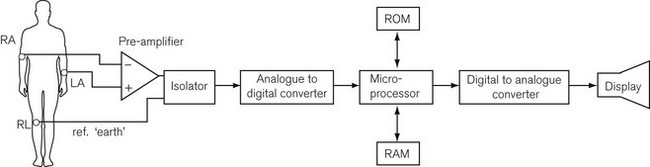
Even these design features may allow the ECG signal to be overwhelmed by high-power radio frequency diathermy signals. To deal with this, an additional technique is adaptive noise filtering. This is a digital electronic technique in which the noise signal is separately detected and digitally subtracted from the output signal, theoretically leaving a clean ECG signal. As Fig. 14.6 shows, analogue to digital conversion of the signal occurs to allow microprocessing of the signal. One of the many things a microprocessor provides is the storage, in digital form in the random access memory (RAM), of enough signal information to reproduce a screen width’s worth of signal. This produces a more persistent and more easily readable screen than the previous phosphor dot screen. The RAM allows continual updating of the stored information so that the most recent 5 or 10 s of data are available. At the same time, the complete RAM storage is rapidly read through the microprocessor and a digital to analogue converter to a display. Thus, a rolling display of the most recent information is available and can be frozen on the screen for closer examination. Modern ECGs have adjustable rate alarms.
Neuromuscular monitoring
The neuromuscular junction is monitored in order to determine onset and recovery from pharmacological neuromuscular blockade.14 A supramaximal electrical stimulus of between 10 and 50 mA is applied near an accessible peripheral motor nerve (for example, the ulnar or facial nerve) and the response of the appropriate muscle group is assessed, either clinically, mechanically or electromyographically (see Chapter 17). The stimulus has a square waveform of width 0.2 ms, to avoid the nerve firing repeatedly. The electrical stimulus applied in a clinical situation is either a single twitch or, more commonly, a train of four twitches (TOF), delivered at 2 Hz,; or as a tetanic stimulus of duration not more than 5 s, delivered at 50 Hz. Double burst stimulation, which is two 40 ms tetanic bursts 750 ms apart, should also be available.
The nerve stimulator should have a constant current output.15 This is desirable to ensure a constant current between the electrodes of the stimulator, whatever the changes in electrical impedance of the tissues to which they are applied. Many devices deliver constant current up to a tissue impedance of 2.5 kΩ. However, in some patients, the tissue resistance may be higher, causing a drop in current output, delivering a stimulus which is no longer supramaximal.
Electromyographic (EMG) assessment in response to peripheral nerve stimulation is no longer used to assess pharmacologically induced block. It is, however, more common elsewhere than it was previously because of advanced signal processing and computer data handling techniques.16 In anaesthetic practice it is more likely now to be met as the technique used to monitor spinal cord integrity during surgery (see Motor-evoked potential monitoring, Chapter 17).
The EMG represents a collection of muscle action potentials which can be recorded through skin electrodes or, ideally, intramuscular needle electrodes. The evoked EMG signal, in response to nerve stimulation, is a high-speed event, with very high-frequency components, as Table 14.1 indicates, and requires considerable processing before any meaningful display.
Blood pressure monitoring
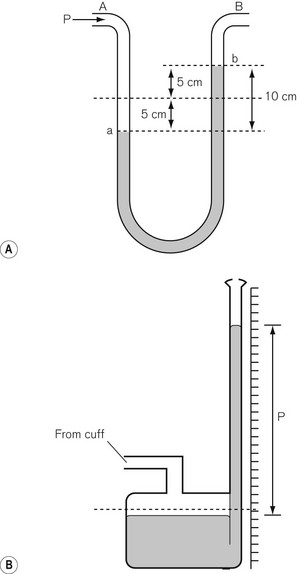
where ρ is fluid density, g is acceleration due to gravity, h is the height of fluid in the manometer column and A is the cross-sectional area of the tube. Hence the colloquial use of a column height (e.g. mmHg, cm H2O) to describe pressure has evolved. The hydraulic pressure being measured is applied to the bottom of the manometer column or to one side of the ‘U-tube’ form of the manometer, shown in Fig. 14.7.
Non-invasive arterial blood pressure (NIBP) measurement
NIBP methods all function by inflating an occlusive cuff around a limb to a pressure above the expected arterial pressure and, on subsequent gradual, stepwise or continuous deflation,17 detecting the return of the pulse downstream of the cuff. Detection methods are described below in more detail. Most non-invasive methods are necessarily intermittent, although the volume clamp method of Peñaz (Finapres; see later) is continuous. In all non-invasive methods that use a cuff, the cuff size is important for accuracy; the width of the inflatable bladder of the cuff should be 40% of the mid-circumference of the limb concerned and its length should be twice this width. A cuff which is too narrow overestimates the blood pressure, while a cuff which is too wide or too loosely wrapped around the limb, underestimates it. Normally the cuff is wrapped round the upper arm to target the brachial artery, but if this is unsuitable (e.g. surgery on the arm or lymphoedema due to breast surgery), then the popliteal artery is targeted by wrapping the cuff around the calf, or, indeed, the posterior tibial artery if the cuff is wrapped around the ankle.18
The sphygmomanometer
The sphygmomanometer is a device that uses a combination of a pneumatic cuff (to wrap around the limb in which the arterial pressure is to be measured), an inflating bulb, a release valve, and a mercury manometer of the type shown in Fig. 14.7B. The classical method of pulse detection is auscultation. If the cuff is used on the upper arm, the sounds of the pulse returning are heard over the brachial artery. These sounds are known as Korotkoff sounds and their onset corresponds to the occurrence of turbulent flow in the artery as the cuff pressure falls below systolic blood pressure; the muffling or disappearance of these sounds corresponds to diastolic pressure.
The reason that Korotkoff sounds correspond to these pressures is unclear, but it is, therefore, not altogether surprising that it does not correlate well with invasive BP measurement under all circumstances. It has been shown that this method overestimates at low pressure and underestimates at high pressure, and has large inter-observer variation.19 On the other hand, the method is simple, uses low-level technology, and has a long history of use. Other methods of pulse detection with the sphygmomanometer include palpation and ultrasound. Palpation is more prone to error in the presence of bradycardia or too rapid cuff deflation and it has been shown also that this method underestimates systolic pressure by 25%.20
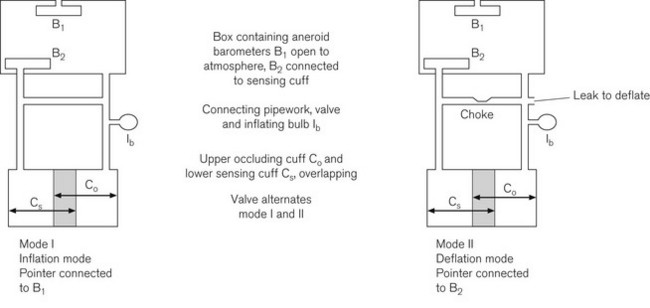
The oscillotonometer
Fig. 14.8 shows the double cuff system used in oscillotonometry. The upper cuff performs the same function as that in the sphygmomanometer, namely limb occlusion. The lower cuff is wider and acts as the pulse detection system. Both cuffs are connected via an inflating bulb and air release valve to an airtight box containing two aneroid barometers. One aneroid (B1) is relatively rigid and its inside is connected to atmosphere to measure the absolute pressure. The other aneroid (B2) is relatively sensitive and its inside is connected to the distal cuff. Both aneroids are connected together by a lever, which is also toggled to the dial pointer. When the system is pressurized by manual inflation (using the bulb), both cuffs, the airtight box and the aneroid B2 are filled to the same pressure. This causes the aneroid B1 to be compressed and via its mechanical linkage moves a pointer to display the pressure in the system.
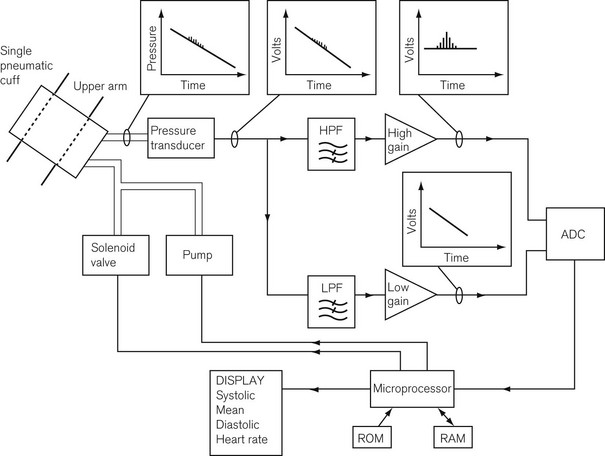
Oscillometry
This method uses a single cuff that both compresses the limb and detects pulsations and uses hydraulics linked to modern electronics to obtain BP measurements. Some systems use a single tube for both inflation and detection, and others use two. Fig. 14.9 shows the components of the system. The hydraulic system consists of a pump to pressurize the system and a solenoid valve through which to depressurize the system, either in discrete steps or continuously, connected to a microprocessor. The detection system consists of a pressure transducer, whose output signal is fed through filters to amplifiers. On deflation, one part of the transducer signal goes through a high pass filter to pass only the high-frequency pulsation components to a high-gain amplifier that amplifies the pulsations due to the oscillations of the arterial wall.
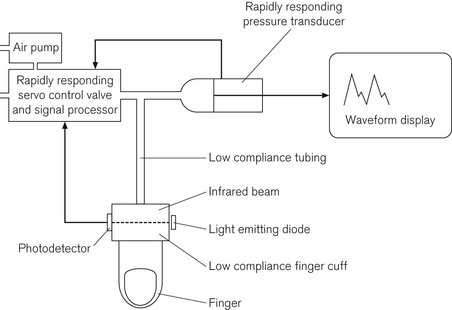
Peñaz volume clamp technique
This method depends on the hypothesis that if the transmural pressure of an artery (the difference between the externally and internally applied pressure across the arterial wall) is kept constant, then the diameter of the artery also remains constant, as will the volume of blood within it and the absorption of infrared light across its lumen. The device consists of a low compliance finger cuff and tubing connected to a rapidly responding solenoid valve and air pump. It also has a light emitting diode as an infrared light source, which transmits light through the finger; the transmitted light is detected on the opposite side by a photodetector. The pump, the solenoid valve and the microprocessor function together to keep the light transmission through the finger constant by maintaining the transmural pressure. The device does this by altering the compression in the finger cuff throughout the cardiac cycle. At any instant the cuff pressure is the same as arterial pressure, and the low compliance of the system ensures rapid response. The output on the display therefore resembles an arterial trace. The Finapres, which is the manufacturer’s name given to the device, is shown schematically in Fig. 14.10. There have been reports of varying accuracy21,22 and it is no longer in extensive clinical use.
Pulse oximetry
Principles
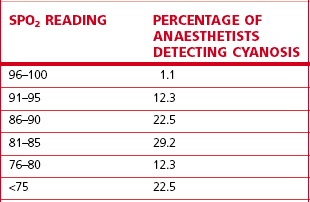
Table 14.2 shows that it is surprisingly difficult even for trained anaesthetists to ascertain accurately the patient’s state of oxygenation, particularly where the oxygen saturations have fallen below optimal levels. Arguably pulse oximetry, first introduced in the early 1980s, has revolutionized clinical monitoring in this respect. It should not be thought of as a replacement for other oxygen monitors, such as those on anaesthetic workstations, but it does provide the best non-invasive monitor of patient oxygenation. The pulse oximeter uses two technologies: one is pulse plethysmography to detect a pulse waveform; the other is infrared spectroscopy to detect the absorption, by the tissue under the probe, of light at two wavelengths in the red and infrared wavebands.
Table 14.2 The ability of experienced anaesthetists to detect hypoxaemia
Reproduced from Magee P. Tooley M (2005) The physics, clinical measurement and equipment of anaesthetic practice. By permission of Oxford University Press.
Apart from the objective indication of SpO2, pulse oximetry may be described as tending to ‘fail-safe’, in that the technique fails and therefore alarms if the pulsatility of the pulse waveform decreases to below a critical level. Further information may be gained by the display of a plethysmographic trace, which enables the differentiation between the pulse waveform and artefacts. No pulse oximeter reading should be accepted unless the plethysmographic trace can confirm lack of artefact (see below, under Limitations).
The spectroscopic aspect of the technology is based on the absorption of light by a ‘dye’ in tissues, in which absorption is proportional to concentration of the dye and the path length through the tissue, and which also depends on the wavelength of light used; these factors are embedded in the Beer-Lambert laws (see Chapter 15). Fig. 14.11 shows the absorption spectra in the red and infrared wavebands of a number of haemoglobin species, including oxygenated and reduced haemoglobin, as well as the less common species, which can nevertheless unhelpfully contribute to a pulse oximetric signal.
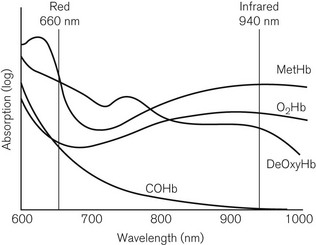
Figure 14.11 The absorption spectra in the red and infrared region for different species of haemoglobin.
The pulse oximeter has light-emitting diodes (LEDs), which transmit light alternately at two wavelengths: 660 nm (red) and 940 nm (infrared). It can be seen that at 660 nm, the absorption of reduced haemoglobin exceeds that of oxygenated haemoglobin and at 940 nm, the converse is true. The absorption scale in Fig. 14.11 is logarithmic, so the differences in absorption are large. The device uses two wavelengths, because it needs to distinguish between absorption of light in pulsatile and non-pulsatile tissues under the probe. Ideally the two wavelengths used should correspond to those at which absorptions of both haemoglobin species (reduced and oxygenated) are equal (the isobestic point) and at which they are furthest apart. LEDs of 660 and 940 nm are used because of their ease of production, constant outputs and narrow bandwidths.
The probe is put on a digit, an earlobe,23 the bridge of the nose or the forehead24 and the more peripherally placed it is, the longer the delay in the device detecting an event causing oxygenation change.25 Probes should be appropriately designed for paediatric use26 because of the penumbra effect where, because of the small size of the digit to which the probe is attached, the path length of the light at the two wavelengths differs significantly. The LED’s rate of alternating on and off is 400 Hz, with a measurable ‘off’ phase, so the photodetector allows for ambient lighting. The photodetector measures the light transmission (transmission fraction = 1 – absorption fraction) of both pulsatile (AC) and non-pulsatile (DC) components at both wavelengths. The pulsatile components are assumed to come mainly from the arterial blood and non-pulsatile components from all other tissues including venous blood. The AC component of absorption represents 1–2% of the total, which puts significant demand on the accuracy of the device. Fig. 14.12A shows the raw signal, with different transmissions of each component at each wavelength. The first stage of signal processing is to change the amplitude of the signal at one of the wavelengths in order to equalize the DC components. The AC components, which are the signals of interest in this context, are now measureable against comparable denominators. The microprocessor in the device calculates the ratio of absorption of the AC component at 660 nm to the absorption of the AC component at 940 nm.
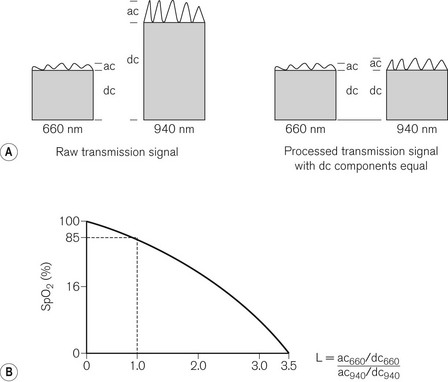
The microprocessor has stored in its memory a number of discrete values of oxygen saturation of arterial blood samples from healthy subjects, measured by a multi-wavelength co-oximeter. Fig. 14.12B shows this ratio plotted against the oxygen saturation and represents the calibration curve for the pulse oximeter. The term SpO2 is used to describe the oxygen saturation derived from this curve. Note that an absorption ratio of 1.0 corresponds to a SpO2 of 85%. The SpO2 displayed is a value averaged over a number of beats, so a change in saturation may not immediately be displayed.
Limitations
Clearly, most values on the calibration curve shown in Fig. 14.12B are either interpolated or extrapolated. Since it would be unethical to collect blood from subjects who had been exposed to life-threatening hypoxia, it is to be expected that SpO2 values below about 80% will be less accurate. In normal clinical circumstances, this is tolerable because values below 90% would be acted upon.
Pulse oximeters are designed to take account of two haemoglobin species, oxygenated and deoxygenated haemoglobin, to calculate functional saturation. As Fig. 14.11 shows, the presence of other haemoglobin species, such as methaemoglobin or carboxyhaemoglobin will affect the measured absorbances at the two wavelengths used. In particular, it can be seen that carboxyhaemoglobin resembles oxyhaemoglobin at 660 nm. This means that the pulse oximeter may give a falsely high SpO2 in smokers, in whom COHb levels can reach 20%. Clearly a pulse oximeter should not be used to assess the oxygenation of a patient who has suffered from carbon monoxide poisoning. Similarly, methaemoglobin, caused by a number of drugs including local anaesthetics and nitrates, resembles deoxygenated haemoglobin at 660 nm. Only a co-oximeter with a minimum of four wavelengths can distinguish these four species, to calculate fractional saturation.
If vascular tone is markedly altered, then there is some limitation to the accuracy of pulse oximetery. This applies to hypertension or vasoconstriction induced by cold27 or otherwise;28 however, the plethysmographic pulse width has been shown to reflect changes in vascular resistance,29 and ear pulse oximetry may be more useful in peripheral vasoconstriction.23 Where vascular tone is reduced, such as in hypovolaemia or sepsis, a peripheral plethysmographic signal may not be detectable.30 However, the quality of the waveform31 may be useful in determining the clinical response to fluid resuscitation. If the venous circulation is hyperdynamic, as in tricuspid regurgitation,32 or if the perivascular tissue is pulsatile,33 then the oximeter will tend to underestimate arterial oxygenation values.
Pulse oximeters are also prone to error in the presence of movement and vibration,34 or electromagnetic interference from ambient light, diathermy or mobile telephones.3
Body temperature monitoring
At both physiological and biochemical levels, the human body functions optimally at 37°C. Anaesthesia and surgery both militate against this by tending to allow body temperature to fall and recovery to be delayed after prolonged surgery (see also Chapter 30). On the other hand, malignant hyperthermia is a potentially fatal condition caused by some anaesthetic drugs in patients pharmacogenetically predisposed to it. It is, therefore, essential for the anaesthetist to monitor body temperature.
A thermistor is a semiconductor device whose electrical resistance changes with temperature in an almost linear fashion. It is the basis of both the nasopharyngeal temperature probe35 and some tympanic membrane thermometers.
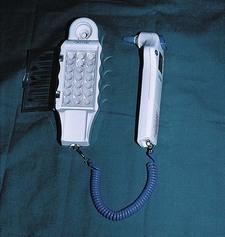
In the infrared tympanic thermometer (Fig. 14.13) a series of thermocouples (thermopile), detect the infrared radiation from the tympanic membrane.36 The thermopile generates a potential difference proportional to tympanic membrane temperature.
Liquid crystal displays are made of materials that change colour with an alteration in temperature. They have been shown to demonstrate hysteresis and are sensitive to draughts.37
1 Watkinson PJ, Barber VS, Price JD, Hann A, Tarassenko L, Young JD. A randomized controlled trial of the effect of continuous electronic physiological monitoring on the adverse event rate in high risk medical and surgical patients. Anaesthesia. 2006;61:1031–1039.
2 Utting JE. Pitfalls in anaesthetic practice. BJA. 1987;59:877–890.
3 Runciman WB, Webb RK, Barker L, Currie M. The pulse oximeter: applications and limitations. The first 2000 AIMS reports. Anaesth Intensive Care. 1993;21:543–550.
4 Schreiber P, Schreiber J. Anesthesia systems risk analysis and risk reduction. Telford PA: Dräger; 1987.
5 AAGBI. Recommendations for standards of monitoring during anaesthesia and recovery, 4th ed, March 2007.
6 Thompson JP, Mahajan RP. Monitoring the monitors. Editorial. BJA. 2006;97:1–3.
7 Görges M, Staggers N. Evaluations of physiological monitoring displays; a systematic review. J Clin Monit Comput. 2008;22:45–66.
8 IEC 60601-1, Medical electrical equipment—Parts 1-8: General requirements, tests and guidance for alarm systems in medical electrical equipment and medical electrical systems. Geneva: International Electrotechnical Commission, 2005.
9 Edworthy J, Hellier E. Alarms and human behaviour: implications for medical alarms. BJA. 2006;97:12–17.
10 Reich DL. Controlling data flow enhances anesthesiology’s role in perioperative care. J Clin Monit Comput. 2008;22:221–224.
11 Bitterman N. Technologies and solutions for data display in the operating room. J Clin Monit Comput. 2006;20:165–173.
12 Smith RJ. Circuits, devices and systems: a first course in electrical engineering, Electronic amplifiers, 2nd ed. New York, Wiley, 1971. p. 343–90
13 Mark JB. Cardiovascular anesthesiology: multimodal detection of perioperative myocardial ischemia. Tex Heart Inst J. 2005;32:461–466.
14 McGrath CD, Hunter JM. Monitoring of neuromuscular block. BJA Continuing Education. 2006;6:7–12.
15 Ford DJ, Pither CE, Raj PP. Electrical characteristics of peripheral nerve stimulators. Implications for nerve localization. Regional Anaesthesia. 1984;9:73–77.
16 Epstein RM, Epstein RA. Electromyography in evaluation of the response to muscle relaxants. In: Katz RL, ed. Muscle relaxants. Amsterdam: Excerpta Medica; 1975:299.
17 Szmuk P, Pavilizza E, Warters RD, Ezri T, Gebhard R. An evaluation of the T-line Tensymeter continuous noninvasive blood pressure device during induced hypotension. Anaesthesia. 2008;63:307–312.
18 Moore C, Dobson A, Kinagi M, Dillon B. Comparison of blood pressure measured in the arm, ankle and calf. Anaesthesia. 2008;63:1327–1331.
19 Pereira E, Prys-Roberts C, Dagnino J, Anger C, Cooper GM, Hutton P. Auscultatory measurement of arterial blood pressure during anaesthesia: a reassessment of the Korotkoff sounds. European Journal of Anaesethesia. 1985;2:11–20.
20 Van Bergen FH, Weatherhead DS, Treloar AE, Dobkin AB, Buckley JJ. Comparison of indirect and direct methods of measuring arterial blood pressure. Circulation. 1954;10:481–490.
21 Farquhar IK. Continuous direct and indirect blood pressure measurement (Finapres) in the critically ill. Anaesthesia. 1991;46:1050–1053.
22 O’Brien E, Waeber B, Parati G, Staessen J, Myers MG. Blood pressure measuring devices: recommendations of the European Society of Hypertension. Anaesthesia. 2001;322:531–536.
23 Awad AA, Stout RG, Ghobashy MA, Rezkanna HA, Silverman DG, Shelley KH. Analysis of the ear pulse oximeter waveform. J Clin Monit Comput. 2006;20:175–184.
24 Casati A, Squicciarini G, Baciarello M, Putzu M, Salvadori A, Fanelli G. Forehead reflectance oximetry: a clinical comparison with conventional digit sensors during laporotomic and laporoscopic abdominal surgery. J Clin Monit Comput. 2007;21:271–276.
25 Ralston AC, Webb RK, Runciman WB. Potential errors in pulse oximetry III. The effects of interference, dyes, dyshaemoglobins and other pigments. Anaesthesia. 1991;46:291–295.
26 Howell SJ, Blogg CE, Ashby MW. Modified sensor for pulse oximetry in children. Anaesthesia. 1993;48:1083–1095.
27 Langton JA, Lassey D, Hanning CD. Comparison of four pulse oximeters: effects of venous occlusion and cold induced vasoconstriction. Br J Anaesth. 1990;65:245–247.
28 Talke P, Stapelfeldt C. Effect of peripheral vasoconstriction on pulse oximetry. J Clin Monit Comput. 2006;20:305–309.
29 Awad AA, Haddadin AS, Tantawy H, Badr TM, Stout RG, Silverman DG, et al. The relationship between the photoplethysmographic waveform and systemic vascular resistance. J Clin Monit Comput. 2007;21:365–372.
30 Secker C, Spiers R. Accuracy of the pulse oximeter in patients with low systemic vascular resistance. Anaesthesia. 1997;52:127–130.
31 Monnet X, Lamia B, Teboul J-L. Pulse oximeter as a sensor of fluid responsiveness: do we have our finger on the best solution? Crit Care. 2005;9:429–430. Published online September 28. doi: 10.1186/cc3876
32 Stewart KG, Rowbottom SJ. Inaccuracy of pulse oximeters in patients with severe tricuspid regurgitation. Anaesthesia. 1991;46:668–670.
33 Yang S, Batchelder PB, Raley DM. Effects of tissue outside of arterial blood vessels in pulse oximetry: a two dimensional pulsation. J Clin Monit Comput. 2007;21:373–379.
34 Langton JA, Hanning CD. Effect of motion artefact on pulse oximeters: evaluation of four instruments and finger probes. Br J Anaesth. 1990;65:564–570.
35 Roth JV, Braitman LE. Nasal temperature can be used as a reliable surrogate measure of core temperature. J Clin Monit Comput. 2008;22:309–314.
36 Edge G, Morgan M. The Genius infrared tympanic thermometer. Anaesthesia. 1993;48:604–607.
37 MacKenzie R, Asbury AJ. Clinical evaluation of liquid crystal skin thermometers. Br J Anaesth. 1994;72:246–249.
[/level-membership-for-anesthesiology-category][not-level-membership-for-anesthesiology-category]
Chapter 14 Physiological monitoring
Principles and non-invasive monitoring
Introduction
Monitoring the state of both the patient’s physiology and the function of the anaesthesia delivery system is now an integral part of anaesthetic practice in the developed world. In some countries standards of monitoring are not enforced by law, yet it is difficult to prove that the absence of such monitoring is responsible for significant morbidity, since the trials required to prove this would be unethical. Anaesthesia has become safer in many countries over the last few decades, despite this fact it is difficult to demonstrate that the presence of multi-mode monitoring unequivocally reduces morbidity and mortality.1 The cost of purchasing and maintaining such monitoring means it is unavailable to anaesthetists in many countries throughout the world and so the clinical monitoring skills of the anaesthetist remain crucial. Nonetheless, even in the developed world, all such standards emphasize the need for the continual presence of trained anaesthetic personnel.
The purpose monitoring is to advise the clinician of deviations from the normal and to warn of any unexpected, physiologically threatening events. In a study of closed claims in relation to deaths and cerebral damage under anaesthesia, two-thirds were found to be due to human error; of these, two-thirds were deemed to be due to problems with securing the airway, endotracheal intubation, ventilation and hypoxia.2 A series of studies concluded that of the errors reported, 80% could be avoided by routine use of the pulse oximeter which, if used in conjunction with a capnometer, would lead to avoidance of 93% of such errors.3 Fig. 14.1 shows a graphical representation of the development of a critical incident and avoidance of the harmful results which might follow.4 Arguably, it is the function of monitors to help the anaesthetist detect a critical incident early and avoid development of injury to the patient.
Figure 14.1 Development of a critical incident and its detection by a monitor.
From Magee P, Tooley M (2005) The physics, clinical measurement and equipment of anaesthetic practice. By permission of Oxford University Press.
There are a number of guidelines, published by various authorities such as the Association of Anaesthetists of Great Britain and Ireland (AAGBI), on minimum monitoring standards.5 These help the clinical anaesthetist select monitoring appropriate to the circumstances. It is notable how much the AAGBI guidelines defer to the anaesthetists’ own clinical judgement in this respect, since the ultimate ‘monitors’ are the anaesthetists themselves.6
Classification of monitoring equipment
There are numerous ways of classifying monitoring equipment relevant to the anaesthetist. One way might specify the physiological system that it monitors: respiratory (including gas concentration, volume, flow rate and pressure); cardiovascular (e.g. ECG, arterial and venous pressures, cardiac output); neurological (e.g. EEG, neuromuscular junction); or metabolic (e.g. temperature or blood sugar). Another might include the degree of invasiveness of the monitoring: non-invasive monitoring, such as blood pressure and electrocardiogram (ECG); partially invasive, such as naso-pharyngeal temperature; or invasive, such as central venous pressure and arterial pressure. A third method might include classification according to whether the electrical signal being monitored is naturally generated by the body (e.g. a biological electrical potential such as the ECG), transduced from another signal modality (e.g. invasive arterial blood pressure to waveform on an electronic display), or a manifestation of some form of energy input to the body (e.g. pulse oximetry, ultrasound or magnetic resonance imaging) (Fig. 14.2).
Figure 14.2 Basic classification of monitoring systems and some examples. A. Monitoring electrical signals generated by the patient. B. Conversion of measured variable to an electrical signal with a transducer. C. Passing energy through a patient and measuring the effect the patient has on it.
Important components of a monitoring system, such as an automatic non-invasive blood pressure monitor, may, therefore, include some or all of the following (Fig. 14.3):
• an energy input source to the body (e.g. mechanical electrical, electromagnetic, infrared, ultrasound)
• a transducer to convert the signal from a measured physiological variable, usually to an electrical signal which can be processed. Transducers need to be zeroed and calibrated: calibration is often done at the factory and the clinician merely has to zero the transducer
• signal processing hardware and software, which amplifies the input signal, ensures the patient is safe from electrical hazards (see Chapter 23), is robust enough not to be damaged by other equipment such as diathermy apparatus or devices containing electromagnetic fields, and provides a good-quality output, free from electrical interference
• a display for easy reading and interpretation by the clinician, who should not be obliged to become preoccupied with the monitor7
• an alarm system, with visual display and annunciation that is helpful rather than distracting, and with reasonable default limits and the ability to change those limits8,9
• modern monitoring systems also have data storage ability for subsequent data analysis, and a means of data transmission to allow the data to be used by other systems such as automated record keeping10 (Chapter 22)
• a monitoring system must be intuitive and easy to use, ergonomically designed, and reliable when used under the conditions for which it is intended.
Almost all monitoring equipment is now controlled by microprocessors, making it possible to design equipment that needs minimal user calibration, offers self-diagnostics for fault conditions and also almost endless variability in user configuration of parameters.11 Single modality monitoring is becoming increasingly rare as a result of the flexibility and miniaturization possible with microprocessor control. Even greater user variability is offered in integrated monitors (one display for several variables) by the use of a modular system, in which the module for each monitored modality may be replaced during use (hot swapped) in the event of a fault or to perform a different function.
The remainder of this chapter will cover non-invasive monitoring, whatever the physiological system being monitored or the source of the electrical signal being processed. Chapter 15 covers gas monitoring and Chapters 16 and 17 cover other aspects of cardiovascular and neurophysiological monitoring.
Monitoring biological electrical potentials
All living cells have a potential difference between the outside and the inside of the cell membrane, which generates small electric currents within and between cells. Such a potential difference, when associated with excitable cells acting in unison, such as muscle or nerve, generates a current sufficient to be detected by a measurement system. Depending on the origin of the biological potential, there is a wide range of amplitudes and frequencies to be measured, processed and displayed, as shown in Table 14.1.
Table 14.1 The range of amplitudes and frequencies generated by biological potentials from different sources
| SOURCE OF BIOLOGICAL ELECTRICAL POTENTIAL | AMPLITUDES | BANDWIDTH (Hz) |
|---|---|---|
| ECG | 0.5–4.0 mV | 0.01–250 |
| EEG | 5–300 µV | DC-150 |
| EMG | 0.1–5.0 mV | DC-10000 |
The quality of the electronics within these monitors must, therefore, be of a high order to measure accurately the currents produced by such small electrical potentials within a wide range of frequencies. Amplifiers used to process biological electrical potentials should have the following properties:12
• The signal to noise ratio of the amplifiers should be high. This is the ability of an amplifier to ensure preferential amplification of the signal being measured in comparison to any electrical noise interfering with this process.
• The common mode rejection ratio should be high; this is achieved by having two input ports, one of which inverts the input signal, so that any random noise signals, such as inductively or capacitatively coupled signals, which are common to both ports, cancel each other out before entering the amplifier, while signal inputs, which are not common to both inputs to the same extent (such as the biological potential itself), are allowed to enter the amplifier. The difference between the two inputs is then subjected to electronic amplification. Fig. 14.4 shows single and double input amplifiers:
Even surface electrodes must be carefully designed in order to minimize degradation of the small surface electrical potentials. A further requirement of the monitors is high-quality electrical isolation between any parts touching the patient, such as the electrodes, and any other electrical components within the device, which might lead to an electrical hazard to the patient. This is particularly important, since it is the only situation where there is a deliberate electrical connection made between the patient and a device which might be connected to a high-voltage mains frequency source. If two pieces of electrical equipment are attached to a patient and one develops a fault allowing an unwanted earth pathway to occur, there is a risk of electrocution or diathermy burns. This is discussed in detail in Chapter 23.
The section below covers the electrocardiogram and monitoring of the neuromuscular junction, while Chapter 17 covers the electroencephalogram and its derivatives.
The electrocardiograph (ECG)
Despite the increasing intraoperative use of other monitors of cardiac function, such as ultrasound (see Chapter 16), the electrocardiogram remains extremely useful at detecting ischaemic events, providing close attention is paid to lead selection, amplification and filtering.13 The electrical depolarization and repolarization of the myocardium is detectable on the surface of the skin, by the electrocardiogram in the form of the familiar PQRST complex. This can be recorded by the use of electrodes connected to limbs and chest, which look at the electrical vector of the ECG from slightly different points of view. The relationship between the electrical axis of the heart and its detection by different limb leads was described by Einthoven in 1901. The signal from the electrodes is then fed into an amplifier, which should meet the requirements discussed above.
As indicated in Table 14.1, the electrical potential from a surface ECG is in the range 0.5–4 mV, lying in the frequency range (bandwidth) of 0.01–250 Hz. The ECG is a complex waveform, which consists of a series of sinusoidal waves with different amplitudes, frequencies and phase relationships to each other. The ability of the monitor to process the ECG waveform depends on its ability to respond to the range of different frequencies of these sinusoidal components, with faithful, unattenuated and undistorted reproduction of the signal, and with the desired amplification or gain. This is a measure of the bandwidth of the monitor and the ECG monitor should ideally have the maximum required bandwidth indicated above. This is not practicable without also allowing amplification of noise within that bandwidth, thereby interfering with the ECG signal. Noise can originate from the amplifier circuit itself, from chest muscle electrical activity, from electromagnetic interference (inductive coupling), or from capacitative coupling to neighbouring electrical equipment such as diathermy apparatus (see Chapter 24). It is, therefore, more common to reduce the bandwidth to 0.05–100 Hz in a monitor with which the clinician wishes to make a range of diagnoses and to an even narrower bandwidth of 0.5–40 Hz in a monitor used in the operating room. The effect of this narrower bandwidth is to exclude high- and low-frequency components of electrical signal, which interfere with the ECG without adversely affecting its quality or the clinician’s ability to diagnose ischaemia and arrhythmias.
Fig. 14.5 shows graphically the effect of electronic filtering, which is achieved by the addition of appropriate electronic components to an amplifier circuit. A low pass filter allows low-frequency components to pass through the amplifier, blocking high-frequency components. A high pass filter does the converse, allowing through high-frequency components. A band pass filter allows through a range of frequencies, blocking signals of frequencies above and below this bandwidth. There is a significant DC voltage of up to 25 mV at the skin–electrode interface, partly due to the resistance in the layers of the skin and partly due to the electrolytic reaction between the Ag/AgCl gel and metal component of the electrode assembly. An ECG amplifier has to eliminate this DC voltage as well as the high-frequency noise and, therefore, a band pass filter is appropriate.
Fig. 14.6 shows a block diagram of the components of a modern ECG monitor. As discussed above, the characteristic features include a differential input to ensure common mode rejection. Electrical isolation of the amplifier is also important for reasons discussed earlier, using either an isolation transformer with good insulation between primary and secondary windings, or an optical isolator, in which the output signal from the amplifier is converted by a light-emitting diode into a light signal and converted back into an electrical signal by a photo-detector, with good insulation between the two.
[/not-level-membership-for-anesthesiology-category]
