Chapter 15 Physiological monitoring
Gasses
Gas analysis during anaesthesia requires continuous monitoring of respired gasses and at times, intermittent sampling of blood gasses. The different techniques described in this chapter utilize various physical or chemical properties of the gas molecules, to detect and quantify the gas. As with all clinical measurement techniques, it is important to understand the principles on which the gas analyzers are based, so that their applications and limitations are recognized.1
Respiratory gas sampling
In a clinical setting, respiratory gas sampling and analysis is important for a number of reasons: ensuring that the gas supply to the patient contains adequate oxygen and volatile anaesthetic agent and ensuring adequacy of ventilation by capnography, which also gives some information about the circulation.2
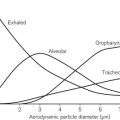
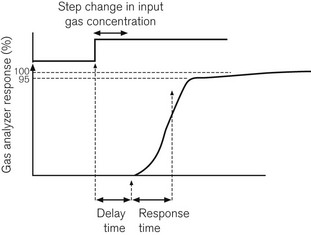
Following a step change in the gas concentration, delay in response time of the analyzer is due to two factors. The first is the delay time or transit time: the time it takes for the sample to get from the patient’s airway to the gas analyzer. The second is the response time or rise time of the analyzer. The response time is usually considered to be the time taken for an analyzer to respond to within 90–95% of an actual step change in gas concentration. A step change can be produced in one of three ways: by moving a gas sampling tube rapidly into and out of a gas stream; by bursting a small balloon within a sampling volume containing a gas sample; or by switching a shutter to a gas sample volume using a solenoid valve. Fig. 15.1 shows how these are related.
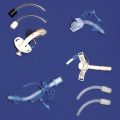
In trying to sample gasses at the end of expiration, it is important to sample as close to the patient’s trachea as possible, particularly where the tidal volume is small and the respiratory rate is high, as when anaesthetizing infants. Some systems have a sampling catheter that extends down the endotracheal tube, but this adds to airway resistance where that tube is of small diameter. Most systems, however, have a sampling port attached to the breathing system adjacent to the artificial airway. It is important that the software within the analyzer can detect minima and maxima in the respiratory waveform, and associate these with inspiratory and expiratory gas concentration values appropriately. It is still possible, however, for a gas sample, taken, for example, from the patient end of a coaxial Mapleson D breathing system, a type of T-piece, to give erroneously low end tidal readings, due to confusion between inspiratory and expiratory gas flows.
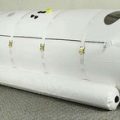
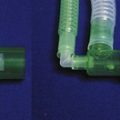
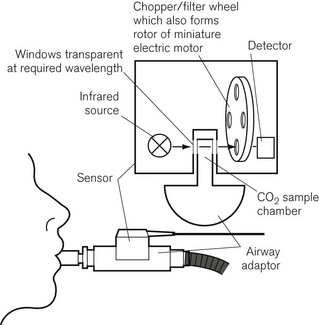
Some analyzers have used mainstream sampling instead, where the analyzer itself sits astride the artificial airway outside the mouth. This is a bulky addition to the airway but it eliminates transit time, and is reported to be more useful in detecting sleep apnoea than sidestream analyzers.3 There is also less of a problem dealing with water vapour in the sample, and the sample is not degraded by the analyzer. An example is the Hewlett Packard infrared CO2 analyzer, shown in Fig. 15.2. The sensor fits onto a sampling chamber inserted into the breathing system. The miniaturized unit contains a motor with filter wheel, an infrared (IR) source and detector, and IR transparent glass for the optical pathways. A second fully encapsulated optical window on the airway adapter provides a reference for calibration.
Gas concentration monitoring
Refractometry
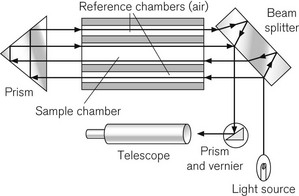
The refractometer is included, not because it is frequently used clinically as a gas analyzer, but because it is an accurate standard of gas analysis against which others are compared. All gasses and volatile agents can be quantified using this method, since all possess the physical property of refractive index. Laboratory refractometers are used by vaporizer manufacturers to calibrate vaporizers. A diagram of the portable version of the refractometer (the Riken refractometer) is shown in Fig. 15.3. Light from a small light source is collimated into a beam, which is split into two parallel beams by prisms. One beam is passed through the reference chamber containing, say, air, and the other is passed through the measuring chamber containing air and another gas/vapour species, for example sevoflurane, whose concentration is to be measured. The beams are reflected back through the chambers to enhance the effect. Each beam is passed through a slit, producing interference fringes. As discussed above, the effective path lengths of the two beams differ and two sets of fringes are produced. These can be realigned by a knob controlling a vernier scale and the amount of realignment is taken as a measure of refractive index change from the reference sample, and thus of concentration of the gas under test.
Infrared absorption spectroscopy
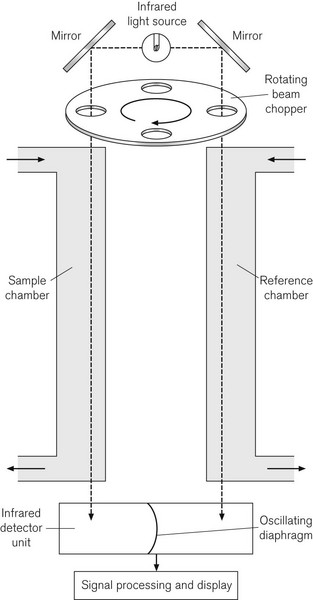
Since CO2 analysis is important in anaesthesia, such devices are available in most anaesthetic locations in modern operating rooms. Fig. 15.4 shows the principle of the Luft or non-dispersive type of IR gas analyzer, which uses a differential technique to minimize error. An IR light source emits radiation at between 1 and 15 µm. A ‘chopper’ wheel, with small windows containing optical filters at the rim, rotates in front of the light source at 25–100 Hz to prevent the gas sample from overheating; additionally the filters allow the passage of IR light of a narrower bandwidth than the source itself, to match the wavelength of maximum absorption of the gas under study. This window might contain a 4.26 µm filter for CO2, a 3.3 µm filter for halothane, isoflurane and enflurane, and a 4.5 µm filter for N2O. The light passes through this to two chambers, a reference chamber and a sample chamber; the sample chamber contains the same background gas as the reference chamber, but additionally contains the gas under analysis. The light, which is not absorbed (the transmitted light) in each sample cell, is passed to a pair of air-filled detector chambers, separated by a diaphragm. Because different amounts of IR light are absorbed in the reference and sample chambers, different amounts of light are, therefore, transmitted to the detector chambers, heating the air in them differentially. Because the chopper wheel produces an oscillating IR source, the changing air pressure in the two detector chambers causes the diaphragm separating them to oscillate. The diaphragm usually forms half of a capacitor and is, therefore, a component of electrical circuitry, which amplifies and processes the signal, to produce an output signal, which is proportional to the gas concentration.
There are a number of sources of error in IR spectroscopy. Although CO2, N2O and CO absorb IR light maximally at 4.3, 4.5 and 4.7 µm respectively, there is considerable overlap in the absorption spectra of these gasses, particularly in the 3–5 µm range. There is also the phenomenon of collision broadening, where the presence of one gas may broaden the IR absorption spectrum of another. This effect is not only caused by IR absorbing agents themselves (such as CO2 and N2O) on the absorption spectra of other IR absorbing agents, but by other non-IR absorbing carrier gasses, such as helium, argon or hydrogen. It has been reported, for example, that in a gas mixture containing 79% helium in oxygen, an IR analyzer under-reads CO2 values.4 Desflurane,5 cyclopropane,6 acetone and alcohol7 all produce errors in IR spectroscopy of respiratory gasses. There are electronic correction factors in the analyzers to allow for the presence of N2O in the gas mix containing CO2. Since water is a strong absorber of IR across the bandwidths of interest, it must be eliminated in the sampling process, in order to avoid some inaccuracy. If one wavelength is used for all volatile agent detection, then that agent must be selected manually, or the device will be inaccurate, if either the wrong agent is selected or if there is a mixture of agents present. Some analyzers use the 10–13 µm bandwidth to detect volatile agents, where there is less chance for interference between absorption spectra of the volatile agent and other gasses.
A variant of the IR analyzer described above utilizes a combination of IR and photo-acoustic spectroscopy. The gasses under test are drawn through a small measurement chamber that is irradiated by an IR source. This IR source is first ‘chopped’ by a rapidly rotating wheel that has three concentric bands of holes that cause the IR energy passing through the holes to pulsate at three different sampling rates. Each part of the now divided beam passes through a separate narrow band optical filter allowing through only that wavelength that corresponds to the maximum absorption of the gas/vapour to be tested (i.e. CO2, N2O and volatile agent). The components of the IR light, now differentiated both by sampling frequency and wavelength, are absorbed by the gas molecules, which are caused to vibrate at different frequencies, leading to a set of audible, fluctuating pressure waves. The families of audible pressure waves are detectable by microphone. Fig. 15.5 shows the Bruel and Kjaer model of the photo-acoustic IR spectroscope. Note that, since oxygen does not absorb IR light, this device has a separate sampling channel that uses magneto-acoustic spectroscopy to measure oxygen (see the section on Paramagnetic oxygen analyzers).
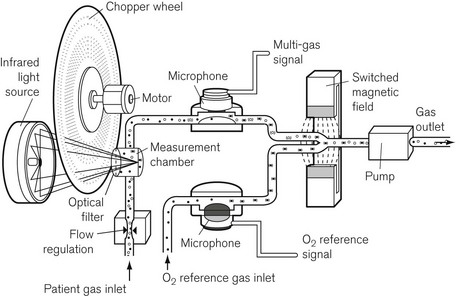
Figure 15.5 The components of the Bruel and Kjaer photo-acoustic and magneto-acoustic spectrophotometer.
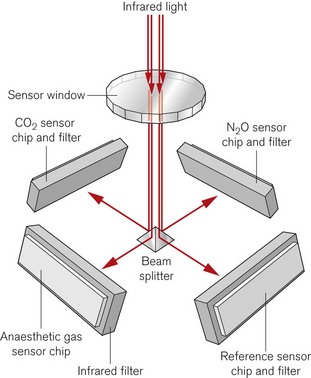
A more recent design of infrared absorption spectroscopy does away with the moving parts of the chopper wheel. Light from a broad-spectrum infrared source passes through a cuvette containing sampled gas. The Dräger ILCA (Fig. 15.6) then uses a prism as a beam splitter. On the four sides of the multichannel detection chamber are appropriate infrared filters and sensors for the maximal absorption wavelengths of each gas. By using two such modules in series the gas bench can quantify CO2, N2O and the individual volatile agents in the gas mixture.
Mass spectrometry
Mass spectrometry identifies gas molecules by a two-stage process; the molecules are first bombarded in a vacuum with electrons, which converts them into charged particles; the charged particles are then separated in a magnetic field according to the ratio of their mass to charge. The method can, therefore, identify and quantify all molecular species, providing there are no unexpected components in a gas mixture, such as the propellant in a bronchodilator or acetone in the expired breath of a diabetic. It is still considered to be the standard against which other gas monitoring techniques are compared, and is more frequently used as a laboratory technique than a clinical one. However, it was available for use as a time-shared, multi-site sampling device before the advent of cheaper IR spectroscopy. One example of a mass spectrometer is shown in Fig. 15.7A. Essentially it has three stages: the first stage is where the sampled gas is drawn into a low-pressure chamber. In the second stage, which is the main part of the device, the sample is drawn into an ionization chamber by an even lower pressure (about 1 mmHg), where the gas molecules are bombarded with electrons. Finally, they are drawn into a dispersion chamber, where they are influenced by a magnetic field. This third stage is where the deflected and separated beams of charged molecules are detected and the signal is processed and displayed.
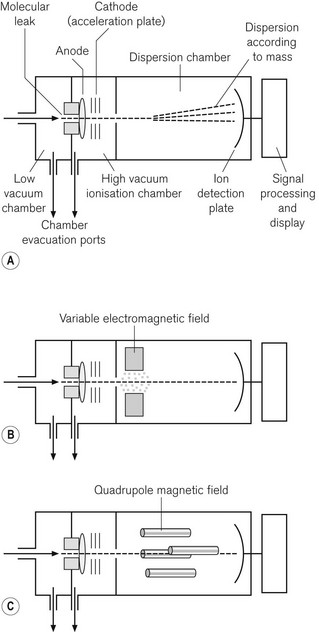
In the vacuum chamber of the second stage of the device, the bombardment of the molecules, by a transverse beam of electrons, results in ionization of the molecule, usually to a single positive charge. The ions of the different molecular species then accelerate towards an electrically negatively charged plate, the acceleration plate, and out through a small hole, the molecular leak, into the dispersion chamber. From here the path of the ions is influenced by a magnetic field. The ions are deflected according to mass; the lightest being deflected the most. The different species of gas are thus separated according to their mass: charge ratio. In the third stage, the ions reach the photovoltaic detectors, where the rate of arrival of the ions is proportional to the partial pressure of the gas. The signal is processed, amplified and displayed.
In the magnetic sector mass spectrometer (Fig. 15.7B) the magnetic field lies at right angles to the path of ions and is produced by a combination of electrical and fixed magnetic fields. By varying the voltage on the acceleration plate, the velocity of the ions entering the magnetic field can be changed. This allows the deflected ion beam to be directed across a single detector plate and different components to be detected in turn. It is, therefore, possible to separate components of the gas sample according to their mass : charge ratio.
More commonly seen these days, is the quadrupole mass spectrometer. This device is more compact and allows better discrimination between the ionic components from a gas mixture. The magnetic field is produced by a combination of DC electrical and AC radio frequency fields. As shown in Fig. 15.7C, the quadrupoles consist of four rods with opposite pairs electrically connected. By careful tuning of the radio frequency component of the magnetic field, only ions of a given mass : charge ratio proceed through the quadrupole to the detector, all other ions oscillating and colliding with the device. By a combination of changing the voltage on the acceleration plate and of judiciously tuning the magnetic field, a spectrum of mass : charge components can be detected and quantified. By scanning at 50 Hz, it is possible to produce a continuous record of gas concentrations.
Raman spectroscopy
Fig. 15.8 shows a diagram of a Raman spectroscope, incorporating an Argon laser source of wavelength 485 nm, high reflectance mirrors to concentrate the laser beam, a gas sampling chamber, appropriate optics, a detection system, and microprocessor and display system. Table 15.1 shows characteristic wavelength or frequency changes, which identify different gasses. If plotted graphically, the amplitudes of the frequency shifted peaks are proportional to the gas concentrations.
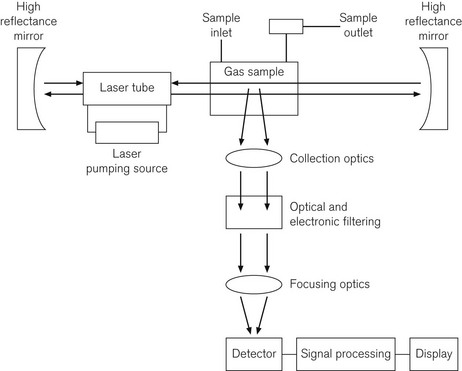
Table 15.1 Frequency shifts in different gasses detectable by Raman spectroscopy (N2O and CO2 give two characteristic frequency shifts).
| GAS | FREQUENCY SHIFT WAVE NUMBER (cm−1) |
|---|---|
| Isoflurane | 995 |
| Halothane | 717 |
| Enflurane | 817 |
| Nitrous oxide | 1285, 2224 |
| Carbon dioxide | 1285, 1388 |
| Oxygen | 1555 |
| Nitrogen | 2331 |
| Water | 3650 |
In Raman spectroscopy, each gas is independently analyzed, including CO2, N2O, volatile agents, O2, N2 and water vapour. This is done by first filtering the Argon laser light at 485 nm, then passing the light through a system of optics to collect and focus the scattered low level light, then through an electronic filtering system; the very low levels of light are then detected by a photomultiplier tube. The response time is 100 ms and the device is, therefore, capable of breath-by-breath analysis. The sample is not altered by the process and can, therefore, be returned to the breathing system, which is a significant advantage in low flow anaesthesia,8 although there is some overlap between gas species.9 However, the devices require a great deal of electrical power and are noisy.
The piezoelectric (Engstrom Emma) gas analyzer
A pair of piezoelectric crystals connected to an electrical power source is made to resonate, with a characteristic frequency difference. The frequency difference occurs because one of the crystals is coated in silicone oil, which absorbs a volatile anaesthetic agent to which it is exposed. This changes the natural frequency of the crystal, and the frequency difference between the crystals changes by an amount dependent on the amount of volatile agent absorbed. Manual identification of the agent is required, but the device is remarkably accurate and stable.10
The paramagnetic gas analyzer
Most gas molecules are repelled by a magnetic field and are, therefore, termed diamagnetic. Two gasses, oxygen and nitric oxide, are attracted into the field and are termed paramagnetic. This property enables oxygen concentrations to be analyzed and is due to the presence of unpaired electrons in the outer shell of an oxygen molecule, which is able to generate force in a magnetic field. A paramagnetic oxygen analyzer of the original type is shown in Fig. 15.9A. Two glass spheres, suspended between the poles of a magnetic field, are filled with nitrogen, a weakly diamagnetic gas. The glass spheres are arranged in a dumbbell shape, suspended by a thread, tensioned to keep the dumb-bell in the plane of the magnetic field. Zeroing should be carried out in the carrier gas destined to have oxygen added to it at a later stage. When a gas mixture containing oxygen is drawn through the analyzer, oxygen is attracted into the magnetic field, displacing the nitrogen filled spheres away from it. The detection system can either be a deflection measurement (Fig. 15.9A) or a null deflection type (Fig. 15.9B), which measures the current required in the circuitry to restore the pointer to its null point. These devices are accurate to within 0.1% O2, but are adversely affected by pressurization, vibration, water vapour and high flow rates; there is also a slow response time of up to 1 min.
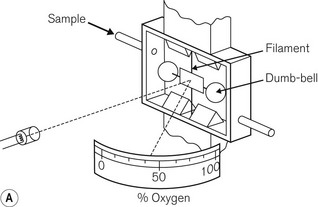
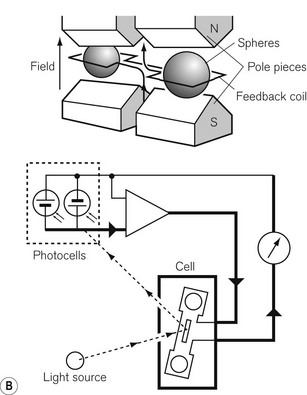
Figure 15.9 A. A simple paramagnetic oxygen analyzer. B. A null deflection paramagnetic oxygen analyzer.
With permission from Kenny GNC, Davis PDD (2003) Basic Physics and Measurement in Anaesthesia, 5th edn. London: Butterworth Heinemann.
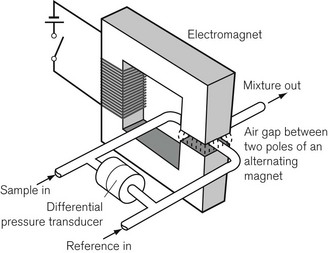
An analyzer has been developed to overcome these disadvantages (Fig. 15.10). A sample of gas to be measured is drawn continuously through one of two capillary tubes at the same rate as a reference gas sample (usually air) is drawn through the other. A powerful electromagnet, producing a pulsed (on/off) magnetic field is placed over the junction of the two tubes. The magnetic field, when switched on, attracts the oxygen from both tubes in proportion to their concentrations. This causes an intermittent differential reduction in pressure upstream in the tubes that is detected and measured by a pressure transducer, and can be calibrated so it displays oxygen concentration. This is the basis of the Datex paramagnetic oxygen analyzer.
It has been reported that a gas mixture containing desflurane interferes with the accuracy of a paramagnetic oxygen analyzer.5
Dräger PATO
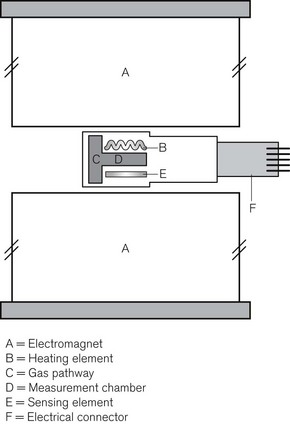
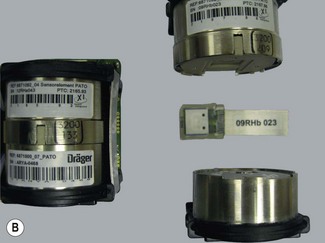
The paramagnetic property of oxygen can be exploited in different ways as the basis for oxygen concentration measurement. In the Dräger PATO O2 sensor a very small measurement chamber lying between two large magnets has heating and temperature measuring elements on either side. The presence of oxygen in the gas mixture reduces the thermal conductivity of the gas between the magnets producing a rapid response oxygen analyzer (Fig. 15.11A and B).
Fuel cells and polarographic cells
The Clarke polarographic electrode is shown in Fig. 15.12A. It consists of a cellophane covered platinum cathode and Ag/AgCl anode in a phosphate and KCl electrolyte, between which a potential difference of –0.6 V is applied by the battery as shown. At the cathode the following reaction takes place:
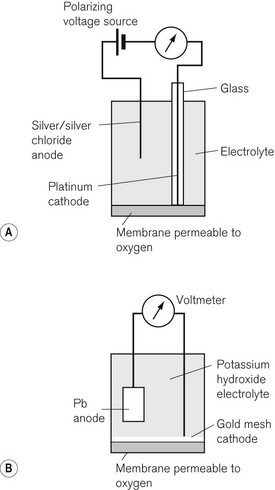
The problem with the polarographic electrode is the dependence on a battery and the reduction of any N2O present at the cathode when it is contaminated by Ag+ ions. A fuel cell is a similar device, which consists of a gold cathode and a lead anode (Fig. 15.12B). The same reaction occurs at the cathode as in the polarographic electrode. A polarizing voltage is generated by the process and ‘fuel’ is consumed, such that the cell needs to be replaced at intervals of 6 months to a year. The fuel cell’s response time is slow, making them acceptable, but less suitable for breath-by-breath analysis than other methods.11
Nitric oxide measurement
All industrial analyzers developed for NO analysis are designed for use in environmental control and, therefore, for gas mixtures containing 21% or less of oxygen. Medical gas mixtures frequently contain more oxygen than this and the accuracy of devices available is not guaranteed. The two methods available are the chemoluminescent and the electrochemical methods.12
Measurement of respiratory volumes
Measurement of respiratory volumes is carried out by one of a number of techniques, most of which involve integration of flow measurement. These include hot wire anemometry, ultrasonic detection of flow vortices, and venturi flow measurement. Devices for volume measurement, which can be considered not to be flow integration techniques, include a turbine respirometer (Wright’s) and the positive displacement volume meter (Dräger). The principles of these techniques are discussed in Chapter 2.
Blood gas analysis
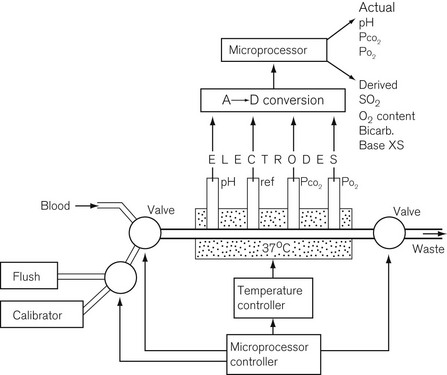
The blood gas analyzer needs a very small, heparinized blood sample, 100–300 µl. The blood is passed through four electrodes sequentially in a temperature stabilized cuvette, shown in Fig. 15.13. The electrodes measure the partial pressure of dissolved oxygen using a Clarke electrode, carbon dioxide using a Severinghaus electrode and pH with a conventional glass electrode; the fourth electrode is a reference electrode. Such a blood gas analyzer frequently measures Hb and some biochemistry as well.12 Derived values from such a device include O2 saturation, O2 content, bicarbonate, base excess and total CO2.
pH electrode
A pH unit, which is the measure of hydrogen ion activity in a liquid, is defined as:
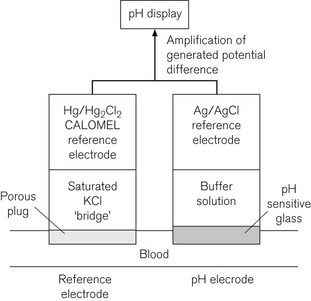
The pH measurement system is shown diagrammatically in Fig. 15.14 and consists of two half electrochemical cells. It has in one half an Ag/AgCl electrode and in the other a Hg/HgCl2 (calomel) electrode. Each electrode maintains a fixed electrical potential. The Ag/AgCl electrode is surrounded by a buffer solution of known pH, surrounded by the pH sensitive glass. Outside the glass membrane is the test solution, usually blood, whose pH is to be measured. It is the potential difference across the glass, between these two solutions, which is variable. The blood or other solution is separated from the calomel electrode by a porous plug and a potassium chloride salt bridge to minimize KCl diffusion. The potential difference across the system is about 60 mV per unit of pH change at 37°C. The internal electrical resistance is high and in order to maximize the device’s accuracy, a voltmeter (or other measuring device) of very high internal resistance must be used to minimize current drawn from the system.
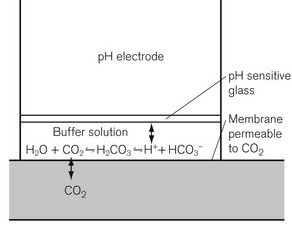
The Severinghaus pCO2 electrode
where α is the Ostwald solubility coefficient, 0.003 mmol L−1 mm Hg−1 at 37°C. pKa, the association constant of the chemical reaction concerned is 6.1. Both α and pKa vary with pH and thus lend the calculation some inaccuracy. It was Astrup who noticed that there was a linear relationship between pH and pCO2.
The pCO2 electrode is essentially a pH electrode with a difference. The sensitive glass membrane is covered with another membrane, which is selectively permeable to CO2. In the original design, a layer of water was trapped between the two membranes, allowing the reaction described above to occur. A later modification had salt and bicarbonate solution in this space (Fig. 15.15). A pCO2 electrode, therefore, allows a pCO2 change to generate a pH change, which is measured by the electrode.
Derived variables from a blood gas machine


Temperature and blood gas analysis
Blood gas analyzers measure blood gas variables at 37°C. A fall in body temperature means that CO2 is more soluble in blood and that CO2 production slows, leading to a fall in pCO2. This shifts the O2 dissociation curve to the left, increasing the O2 content. However, O2 solubility also rises, decreasing pO2 and measured O2 content. pH increases with a fall in temperature. Hypothermia itself does not alter the blood gas values at 37°C and arterial blood taken at lower temperatures should be corrected to 37°C before clinical decisions are made on the results.13
Other ion-selective electrodes
By carefully selecting the proportions of constituents in the glass, glass ion-selective electrodes can be constructed for detection of other ions. For example, a glass electrode for measuring Na+ concentrations consists of 71% SiO2, 18% Al2O3 and 11% Na2O. The K+-sensitive glass electrode consists of 69% SiO2, 4% Al2O3 and 27% Na2O.
Transcutaneous blood gas analyzers
pO2 can be measured transcutaneously by applying a Clarke polarographic electrode to the skin. If the skin is ‘arterialized’ by heating it, a reasonable value for pO2 can be obtained. A modified pCO2 electrode is used to measure transcutaneous pCO2. A common O2/CO2 permeable membrane and electrolyte solution is used, ensuring a common pH for both measurements. Actual measured values do not correlate well with arterial values and should not replace formal respiratory gas analysis,14 but trends are clinically useful and these devices are used particularly in neonatology and when patients are ventilated outside the intensive care setting where arterial blood gas sampling is problematic. Care must be taken to avoid burns due to the heated electrodes.
Intravascular blood gas analyzers
These are microminiaturized versions of the devices described above.
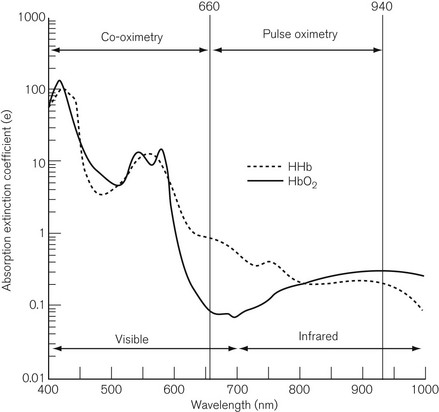
The co-oximeter
A small sample, 200–400 µl, of heparinized blood is injected into a cuvette of known path length. The red blood cells are disrupted by ultrasound or a soap solution, releasing free haemoglobin. Conventional spectroscopy then takes place on the sample at up to 17 wavelengths, which are produced either by a filter wheel with multiple narrow band filters, or by scanning with a diffraction grating or a prism. Fig. 15.16 shows the spectrum covered by a co-oximeter as well as that covered by a pulse oximeter. The result is usually available within 30 s and includes SO2 %, total haemoglobin (Hb) concentration, oxygen content, methaemoglobin (MetHb) %, sulphaemoglobin %, carboxyhaemoglobin (COHb) %. Some devices are capable of distinguishing foetal haemoglobin (HbF). As Fig. 15.16 shows, the pulse oximeter and the co-oximeter operate in different spectra and, therefore, strictly speaking, SO2 and SpO2 should not be compared.
1 Langton JA, Hutton A. Respiratory gas analysis. BJA Continuing Education. 2009;9:19–23.
2 Eipe N, Tarshis J. A system of classification for the clinical applications of capnography. J Clin Monit Comput. 2007;21:341–344.
3 Yamamori S, Takasaki Y, Ozaki M, Iseki H. A flow-through capnometer for obstructive sleep apnoea. J Clin Monit Comput. 2008;22:209–220.
4 Ball JAS, Grounds RM. Calibration of three capnographs for use with helium and oxygen mixtures. Anaesthesia. 2003;58:156–160.
5 Scheeren TWC, Krossa M, Meriläinen P, Arndt JO. Error in measurement of oxygen and carbon dioxide concentrations by the Deltatec II metabolic monitor in the presence of desflurane. Br J Anaesth. 1998;80:521–524.
6 Mason DG, Lloyd-Thomas AR. Cyclopropane and the Datex Capnomac. Anaesthesia. 1991;46:398–399.
7 Foley MA Wood PR, Peel WJ, Jones GM, Lawler PG. The effect of exhaled alcohol on the performance of the Datex Capnomac. Anaesthesia. 1990;45:232–234.
8 Lockwood GG, London MJ, Chakrabarti MK, Whitwam JG. The Ohmeda Rascal II. A new gas analyser for anaesthetic use. Anaesthesia. 1994;49:44–53.
9 Lawson D, Samanta S, Magee PT, Gregonis DE. Gas monitoring in the OR: stability and long term durability of Raman spectroscopy. J Clin Monit. 1993;9:241–251.
10 Humphrey SJE, Luff NP, White DC. Evaluation of the Lamtec anaesthetic agent monitor. Anaesthesia. 1991;46:478–481.
11 Roe PG, Tyler CKG, Tennant R, Barnes PK. Oxygen analysers. Evaluation of five models. Anaesthesia. 1987;42:175–181.
12 Etches PC, Harris ML, McLinley R, Finer NM. Clinical monitoring of inhaled nitric oxide: comparison chemoluminescent and electrochemical sensors. Biomed Instrum Technol. 1995;29:131–140.
13 Rupp SM, Severinghaus J. Hypothermia. In: Mipler R, ed. Anesthesia. 2nd ed. New York: Churchill Livingstone; 1986:2000.
14 Bolliger D, Steiner LA, Kasper J, Aziz OA, Filipovic M, Seeberger MD. The accuracy of non-invasive carbon dioxide monitoring: a clinical evaluation of two transcutaneous systems. Anaesthesia. 2007;62:394–399.
Sykes MK. The determination of pH. In: Scurr C, Feldman S, eds. Scientific foundations, anaesthesia. 3rd ed. London: Heinemann; 1982:108–114.
Hutton P, Hahn C, Clutton-Brock TH. Gas and vapour analysis. In: Hutton P, Prys-Roberts C, eds. Monitoring in anaesthesia and intensive care. London: WB Saunders; 1994:194–203.