Physical Principles of Respiratory Care
After reading this chapter you will be able to:
 Describe the properties that characterize the three states of matter.
 Describe how heat transfer occurs among substances.
 Identify the three common temperature scales and explain how to use them.
 Describe how substances undergo change of state.
 Identify the factors that influence the vaporization of water.
 Describe how water vapor capacity, absolute humidity, and relative humidity are related.


States of Matter
There are three primary states of matter: solid, liquid, and gas. Figure 6-1, A-C depicts simplified models of these states of matter.
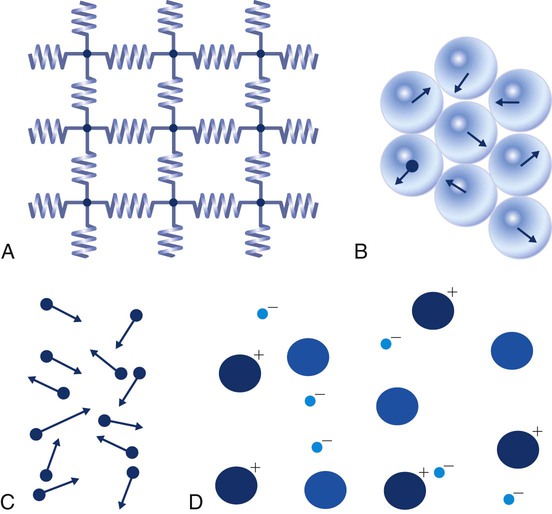
Solids have a fixed volume and shape. The molecules that make up the solid have the shortest distance to travel until they collide with one another. This motion has been referred to as a “jiggle.” Solids have a high degree of internal order; their atoms or molecules are limited to back-and-forth motion about a central position, as if held together by springs (see Figure 6-1, A). Solids maintain their shape because their atoms are kept in place by strong mutual attractive forces, called van der Waals forces.1
Liquids have a fixed volume, but adapt to the shape of their container. If a liquid is not held within a container, the shape is determined by numerous internal and external forces. Liquid molecules exhibit mutual attraction. However, because these forces are much weaker in liquids than in solids, liquid molecules can move about freely (see Figure 6-1, B). This freedom of motion explains why liquids take the shape of their containers and are capable of flow. However, similar to solids, liquids are dense and cannot be compressed easily.
In a gas, molecular attractive forces are very weak. Gas molecules, which lack restriction to their movement, exhibit rapid, random motion with frequent collisions (see Figure 6-1, C). Gases have no inherent boundaries and are easily compressed and expanded. Similar to liquids, gases can flow. For this reason, both liquids and gases are considered fluids. Gases have no fixed volume or shape. Both of these qualities depend on local conditions for the gas.
Plasma has been referred to as a fourth state of matter. Plasma is a combination of neutral atoms, free electrons, and atomic nuclei. Plasmas can react to electromagnetic forces and flow freely similar to a liquid or a gas (see Figure 6-1, D). Although mentioned here for the sake of completeness, plasmas are not discussed further because at this time they are not known to be relevant to the practice of respiratory care.
Internal Energy of Matter
The atoms of all matter, at ordinary temperatures, are in constant motion.2 All matter has some kinetic energy. However, most internal energy in solids and liquids is potential energy. This potential energy is a result of the strong attractive forces between molecules. These intermolecular forces cause rigidity in solids and cohesiveness and viscosity in liquids. In contrast, because these attractive forces are so weak in gases, most internal energy in gases is kinetic energy.

Heat Transfer
Conduction
Heat transfer between objects is quantified by using a measure called thermal conductivity. Table 6-1 lists the thermal conductivities of selected substances in cgs (centimeter-gram-second) system units. As is evident, solids, in particular, metals, tend to have high thermal conductivity. This is why metals feel cold to the touch even when at room temperature. In this case, the high thermal conductivity of metal quickly draws heat away from the skin, creating a feeling of “cold.” In contrast, with fewer molecular collisions than in solids and liquids, gases exhibit low thermal conductivity.
TABLE 6-1
Thermal Conductivities in (cal/sec)/(cm2 °C/cm)
| Material | Thermal Conductivity (k) |
| Silver | 1.01 |
| Copper | 0.99 |
| Aluminum | 0.50 |
| Iron | 0.163 |
| Lead | 0.083 |
| Ice | 0.005 |
| Glass | 0.0025 |
| Concrete | 0.002 |
| Water at 20° C | 0.0014 |
| Asbestos | 0.0004 |
| Hydrogen at 0° C | 0.0004 |
| Helium at 0° C | 0.0003 |
| Snow (dry) | 0.00026 |
| Fiberglass | 0.00015 |
| Cork board | 0.00011 |
| Wool felt | 0.0001 |
| Air at 0° C | 0.000057 |
From Nave CR, Nave BC: Physics for the health sciences, ed 3, Philadelphia, 1985, WB Saunders.
Convection
Heat transfer in both liquids and gases occurs mainly by convection. Convection involves the mixing of fluid molecules at different temperatures. Although air is a poor heat conductor (see Table 6-1), it can efficiently transfer heat by convection. To do so, the air is first warmed in one location and then circulated to carry the heat elsewhere; this is the principle behind forced-air heating in houses and convection heating in infant incubators. Fluid movements carrying heat energy are called convection currents.
Laws of Thermodynamics
Three physical principles describe how energy is handled and transferred. These principles are known as the laws of thermodynamics.3,4
1. The law of conservation of energy states that energy cannot be created or destroyed. This law is usually stated as follows: The total amount of energy in a system is equal to the amount of heat put into the system minus the work.
2. The principle of thermodynamic equilibrium is that given time all systems achieve the lowest possible energy state (entropy).
3. The third law is a statistical law describing the impossibility of achieving absolute zero. As stated in the third law, at absolute zero all processes cease, and entropy is at a minimum value.
Internal Energy and Temperature
Two interrelated terms are significant when discussing thermodynamics: entropy and enthalpy. Entropy is the amount of energy in a system that is unavailable for work. Entropy is the lowest amount of organization that a system can achieve (chaos). Enthalpy is the total measure of energy in the system. Enthalpy can be considered to be the order of a system. Temperature and kinetic energy are closely related.2 Temperature is a measurement of heat. Heat is the result of molecules colliding with one another. The temperature of a gas, with most of its internal energy spent keeping molecules in motion, is directly proportional to its kinetic energy. In contrast, the temperatures of solids and liquids represent only part of their total internal energy.
Temperature Scales
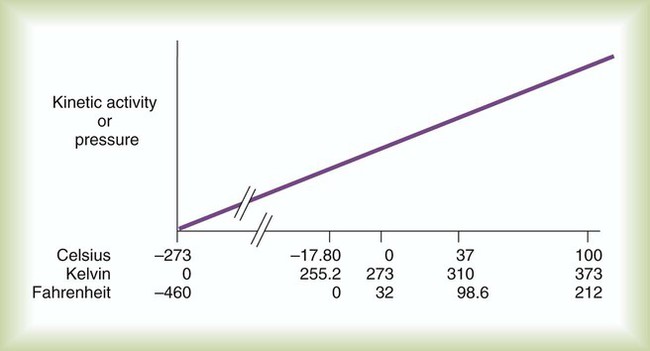
Multiple scales can be used to measure temperature. The Fahrenheit and Celsius scales are based on a property of water. A third scale, the Kelvin scale, is based on molecular motion. Absolute zero provides a logical zero point on which to build a temperature scale. The SI (International System of Units) units for temperature are measured in kelvin (K) with a lower case “k,” with a zero point equal to absolute zero (0° K).5–7 Because the Kelvin scale has 100 degrees between the freezing and boiling points of water, it is a centigrade, or 100-step, temperature scale. The Kelvin scale has the unique quality of being based on the triple point definition for water (the temperature where all three phases of water exist). This temperature happens to be approximately 273° K (0.0° C).5–7


Conversely, to convert degrees Kelvin to Celsius, you simply subtract 273. For example:

To convert degrees Fahrenheit to degrees Celsius, use the following formula:


To convert degrees Celsius to degrees Fahrenheit, simply reverse this formula:


Figure 6-2 shows the relationship between the kinetic activity of matter and temperature on all three common temperature scales. For ease of reference, five key points are defined: the zero point of each scale, the freezing point of water (0° C), body temperature (37° C), and the boiling point of water (100° C).
Change of State
Liquid-Solid Phase Changes (Melting and Freezing)
Melting
The changeover from the solid to liquid state is called melting. The temperature at which this changeover occurs is the melting point.2 The range of melting points is considerable. For example, water (ice) has a melting point of 0° C, carbon has a melting point of greater than 3500° C, and helium has a melting point of less than −272° C.
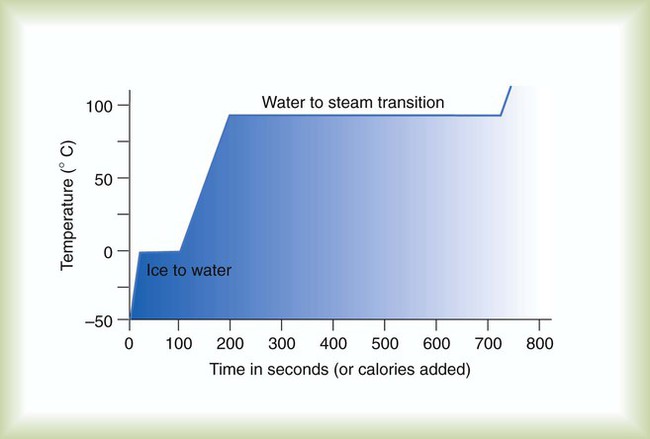
Figure 6-3 depicts the phase change caused by heating water. At the left origin of −50° C, water is solid ice. As the ice is heated, its temperature increases. At its melting point of 0° C, ice begins to change into liquid water. However, the full change to liquid water requires additional heat. This additional heat energy changes the state of water but does not immediately change its temperature.
Properties of Liquids

Buoyancy (Archimedes’ Principle)
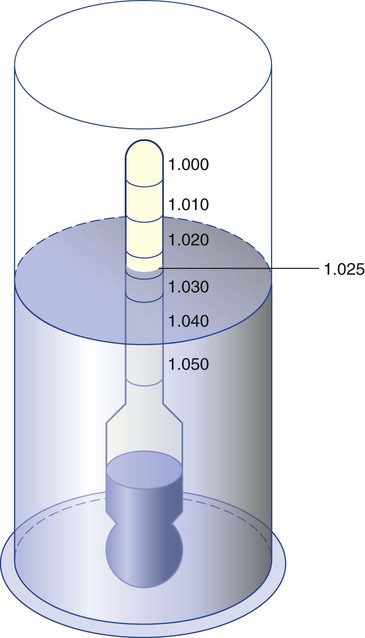
Clinically, Archimedes’ principle is used to measure the specific gravity of certain liquids. The term specific gravity refers to the ratio of the density of one fluid compared with the density of another reference substance, which is typically water. Figure 6-5 shows the use of a hydrometer to measure the specific gravity of urine. The specific gravity of gases also can be measured. In this case, oxygen or hydrogen is used as the standard instead of water.
Gases also exert buoyant force, although much less than that provided by liquids. Buoyancy helps keep solid particles suspended in gases. These suspensions, called aerosols, play an important role in respiratory care. More detail on the characteristics and use of aerosols is provided in Chapter 35.
Viscosity
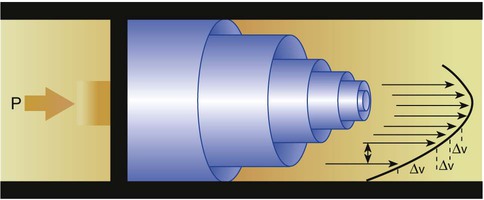
Viscosity is most important when fluids move in discrete cylindrical layers, called streamlines. This pattern of motion is called laminar flow. As shown in Figure 6-6, frictional forces between the streamlines and the tube wall impede movement of the outer layers of a fluid. Each layer, moving toward the center of the tube, hinders the motion of the next inner layer less and less. Laminar flow consists of concentric layers of fluid flowing parallel to the tube wall at velocities that increase toward the center.
Cohesion and Adhesion
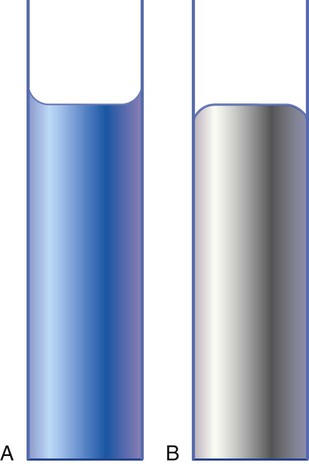
The attractive force between like molecules is called cohesion. The attractive force between unlike molecules is called adhesion. These forces can be observed at work by placing a liquid in a small-diameter tube. As shown in Figure 6-7, the top of the liquid forms a curved surface, or meniscus. When the liquid is water, the meniscus is concave because the water molecules at the surface adhere to the glass more strongly than they cohere to each other (see Figure 6-7A). In contrast, a mercury meniscus is convex (see Figure 6-7B). In this case, the cohesive forces pulling the mercury atoms together exceed the adhesive forces trying to attract the mercury to the glass.
Surface Tension
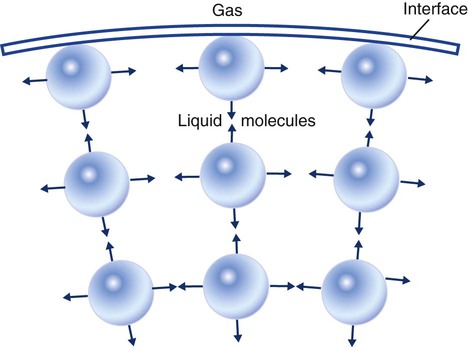
Surface tension is a force exerted by like molecules at the surface of a liquid. A small drop of fluid provides a good illustration of this force. As shown in Figure 6-8, cohesive forces affect molecules inside the drop equally from all directions. However, only inward forces affect molecules on the surface. This imbalance in forces causes the surface film to contract into the smallest possible surface area, usually a sphere or curve (meniscus). This phenomenon explains why liquid droplets and bubbles retain a spherical shape.
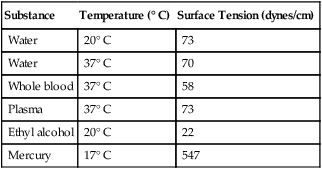
Surface tension is quantified by measurement of the force needed to produce a “tear” in a fluid surface layer. Table 6-2 lists the surface tensions of selected liquids in dynes/cm (cgs). For a given liquid, surface tension varies inversely with temperature: The higher the temperature, the lower is the surface tension.
TABLE 6-2
| Substance | Temperature (° C) | Surface Tension (dynes/cm) |
| Water | 20° C | 73 |
| Water | 37° C | 70 |
| Whole blood | 37° C | 58 |
| Plasma | 37° C | 73 |
| Ethyl alcohol | 20° C | 22 |
| Mercury | 17° C | 547 |

P is the pressure in the bubble, ST is the surface tension, and r is the bubble radius. Figure 6-9 shows this relationship for two bubbles of different sizes, each with the same surface tension.
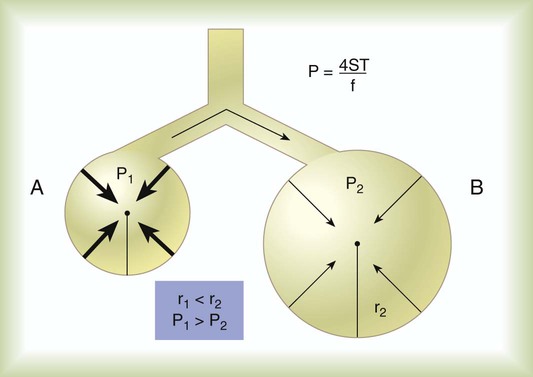
Because the alveoli of the lungs resemble clumps of bubbles, it follows that surface tension plays a key role in the mechanics of ventilation (see Chapter 10). Abnormalities in alveolar surface tension occur in certain clinical conditions, such as acute respiratory distress syndrome. These abnormalities may result in collapse of alveoli secondary to high surface tension.
Capillary Action
Capillary action is a phenomenon in which a liquid in a small tube moves upward, against gravity. Capillary action involves both adhesive and surface tension forces. As shown in Figure 6-10, A, the adhesion of water molecules to the walls of a thin tube causes an upward force on the edges of the liquid and produces a concave meniscus.
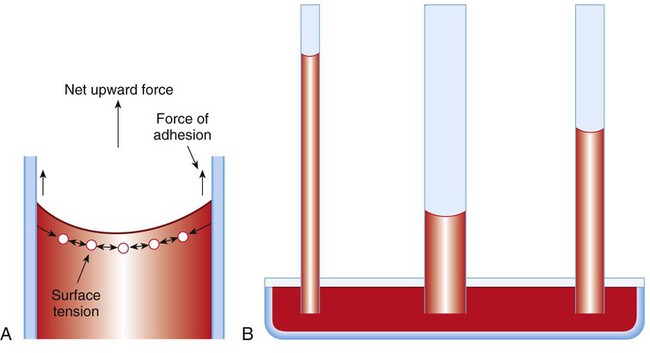
Because surface tension acts to maintain the smallest possible liquid-gas interface, instead of just the edges of the liquid moving up, the whole surface is pulled upward. How strong this force is depends on the amount of liquid that contacts the tube’s surface. Because a small capillary tube creates a more concave meniscus and a greater area of contact, liquid rises higher in tubes with smaller cross-sectional areas (see Figure 6-10, B).
Liquid-Vapor Phase Changes
Only after ice completely melts does additional heat increase the temperature of the newly formed liquid (see Figure 6-3). As the water temperature reaches 100° C, a new change of state begins—from liquid to vapor. This change of state is called vaporization. There are two different forms of vaporization: boiling and evaporation.
Boiling
Melting weakens attractive forces between molecules, whereas vaporization eliminates them. Elimination of these forces converts essentially all of the internal energy of a substance into kinetic energy. For this reason, vaporization requires substantially more energy than melting. As shown in Figure 6-3, almost seven times more energy is needed to convert water to steam (540 cal/g) than is needed to melt ice.
Evaporation, Vapor Pressure, and Humidity
Boiling is only one type of vaporization. A liquid also can change into a gas at temperatures lower than its boiling point through a process called evaporation. Water is a good example (Figure 6-11). When at a temperature lower than its boiling point, water enters the atmosphere via evaporation. The liquid molecules are in constant motion, as in the gas phase. Although this kinetic energy is less intense than in the gaseous state, it allows some molecules near the surface to escape into the surrounding air as water vapor (see Figure 6-11, A).
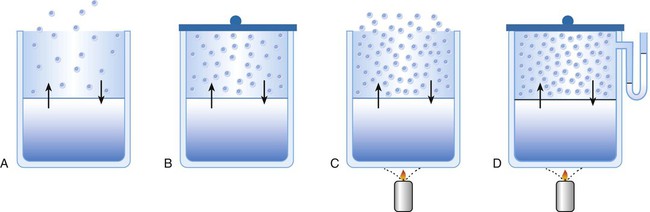
If the container is covered, water vapor molecules continue to enter the air until it can hold no more water (see Figure 6-11, B). At this point, the air over the water is saturated with water vapor. However, vaporization does not stop when saturation occurs. Instead, for every molecule escaping into the air, another returns to the water reservoir. These conditions are referred to as a state of equilibrium.
Influence of Temperature
Second, if water is heated, its kinetic energy is increased, and more molecules are helped to escape from its surface (see Figure 6-11, C). Last, if the container of heated water is covered, the air again becomes saturated (see Figure 6-11, D). However, the heated saturated air, compared with the unheated air (see Figure 6-11, B), now contains more vapor molecules and exerts a higher vapor pressure (as shown by the manometer in Figure 6-11, D). The temperature of a gas affects both its capacity to hold molecular water and the water vapor pressure.
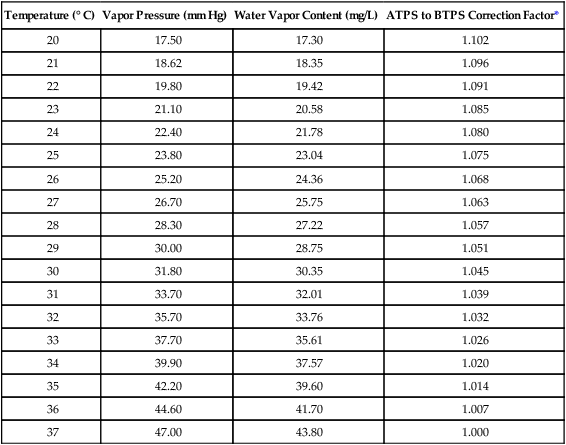
The relationship between water vapor pressure and temperature is shown graphically in Figure 6-12. The left vertical axis plots water vapor pressure in both mm Hg and kPa (kilopascal). The horizontal axis plots temperatures between 0° C and 70° C. This graph shows that the greater the temperature, the greater the saturated water vapor pressure (bold red dots). Table 6-3 lists actual water vapor pressures in saturated air in the clinical range of temperatures (20° C to 37° C).
TABLE 6-3
Water Vapor Pressures and Contents at Selected Temperatures
| Temperature (° C) | Vapor Pressure (mm Hg) | Water Vapor Content (mg/L) | ATPS to BTPS Correction Factor* |
| 20 | 17.50 | 17.30 | 1.102 |
| 21 | 18.62 | 18.35 | 1.096 |
| 22 | 19.80 | 19.42 | 1.091 |
| 23 | 21.10 | 20.58 | 1.085 |
| 24 | 22.40 | 21.78 | 1.080 |
| 25 | 23.80 | 23.04 | 1.075 |
| 26 | 25.20 | 24.36 | 1.068 |
| 27 | 26.70 | 25.75 | 1.063 |
| 28 | 28.30 | 27.22 | 1.057 |
| 29 | 30.00 | 28.75 | 1.051 |
| 30 | 31.80 | 30.35 | 1.045 |
| 31 | 33.70 | 32.01 | 1.039 |
| 32 | 35.70 | 33.76 | 1.032 |
| 33 | 37.70 | 35.61 | 1.026 |
| 34 | 39.90 | 37.57 | 1.020 |
| 35 | 42.20 | 39.60 | 1.014 |
| 36 | 44.60 | 41.70 | 1.007 |
| 37 | 47.00 | 43.80 | 1.000 |
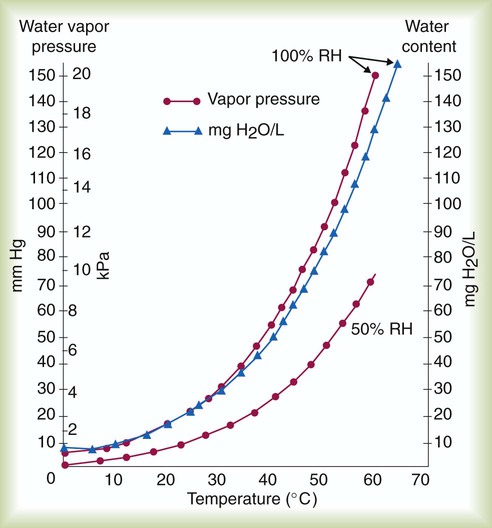
 ) and absolute humidity (mg H2O/L) curves for gas that is fully saturated (relative humidity [RH] = 100%) and gas that is half saturated (RH = 50%).
Humidity
Absolute humidity (AH) can be measured by weighing the water vapor extracted from air using a drying agent. Alternatively, absolute humidity can be computed with meteorologic data according to the techniques of the U.S. Weather Bureau. The common unit of measure for absolute humidity is milligrams of water vapor per liter of gas (mg/L). Absolute humidity values for saturated air at various temperatures are plotted against the right vertical axis of Figure 6-12, using hash marks. The middle column of Table 6-3 lists these absolute humidity values for saturated air between 20° C and 37° C.
A gas does not need to be fully saturated with water vapor. If a gas is only half saturated with water vapor, its water vapor pressure and absolute humidity are only half that in the fully saturated state. Air that is fully saturated with water vapor at 37° C and 760 mm Hg has a water vapor pressure of 47 mm Hg and an absolute humidity of 43.8 mg/L (see Table 6-3). However, if the same volume of air were only 50% saturated with water vapor, its water vapor pressure would be 0.50 × 47 mm Hg, or 23.5 mm Hg, and its absolute humidity would be 0.50 × 43.8 mg/L, or 21.9 mg/L.
For example, saturated air at a room temperature of 20° C has the capacity to hold 17.3 mg/L of water vapor (see Table 6-3). If the absolute humidity is 12 mg/L, the RH is calculated as follows:


Figure 6-13 provides a useful analogy of the relationship between water vapor content, capacity, and RH. The various-sized glasses represent the capacity of a gas to hold water vapor. The larger the glass, the greater is its capacity. The water in the glasses represents the actual water vapor content. A glass that is half full is at 50% capacity, or 50% RH. A full glass represents the saturated state, which is equivalent to 100% RH.
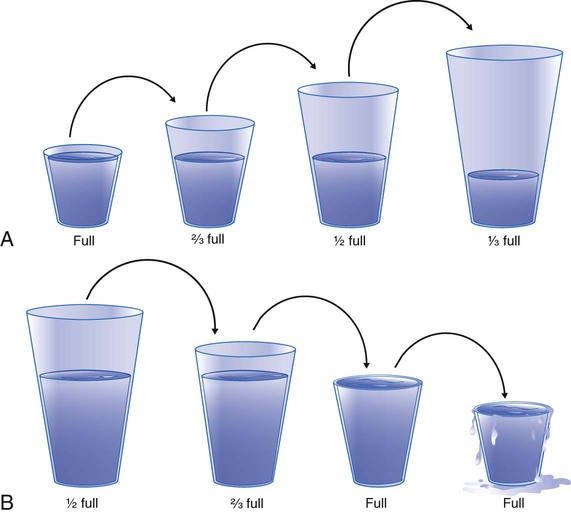
Figure 6-13, A shows what happens when a saturated gas is heated. Warming a gas increases its capacity to hold water vapor but does not change its content. This is equivalent to pouring the contents of the full glass on the left in Figure 6-13, A into progressively larger glasses. The amount of water does not change, but as the glasses get larger, they become less full. We started with a full glass (100% RH) but end up with one that is only one-third full (33% RH).
A decrease in capacity would have the opposite effect. In Figure 6-13, B, we start with a large glass, which is half full (50% RH). The capacity of the glass is decreased by pouring the water into progressively smaller glasses (equivalent to decreasing the gas temperature). Eventually, the water volume is enough to fill a smaller glass (100% RH). What happens if we try to empty this full glass into an even smaller one? Because the smaller glass has less capacity, the excess content must spill over. This spillover is analogous to the condensation occurring when a saturated gas cools below its dew point. However, although condensation has removed the excess moisture from the air, the smaller glass is still full (100% RH).
Mini Clini
Condensation and Evaporation
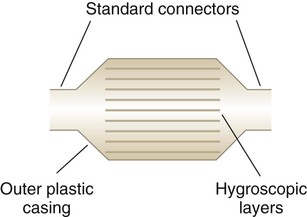
A good clinical example of condensation and evaporation is the hygroscopic condenser humidifier, a form of artificial nose (Figure 6-14). These devices consist of layers of water-absorbent material encased in plastic. When a patient exhales into an artificial nose, the warm, saturated expired gas cools, causing condensation on the absorbent surfaces. As condensation occurs, heat is generated in the device. When the patient inhales through the device, the inspired gases are warmed, and the previously condensed water now evaporates, aiding in airway humidification. Chapter 35 provides more detail on humidification devices, including the artificial nose.
Properties of Gases
Molar Volume and Gas Density
Density
In clinical practice, weight is often substituted for mass, and weight density (weight per unit volume, or dw) is actually measured. Solid or liquid weight density is commonly measured in grams per cubic centimeter (cgs). For gases, the most common unit is grams per liter. Because weight density equals weight divided by volume, the density of any gas at STPD can be computed easily by dividing its molecular weight (gmw) by the universal molar volume of 22.4 L (22.3 for CO2). Box 6-1 provides examples of gas density calculations.
FN2 and FO2 equal the fractional concentrations of nitrogen and oxygen in air.
Gas Pressure
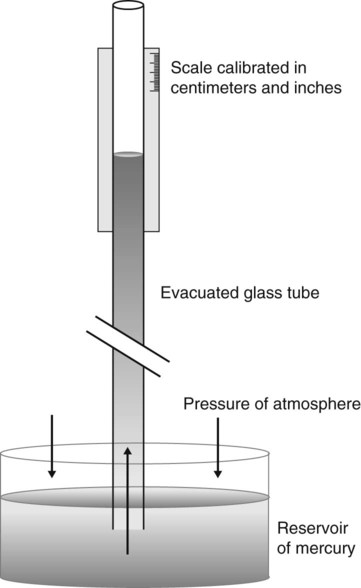
Measuring Atmospheric Pressure
Atmospheric pressure is measured with a barometer. A barometer consists of an evacuated glass tube approximately 1 m long. This tube is closed at the top end, with its lower, open end immersed in a mercury reservoir (Figure 6-15). The pressure of the atmosphere on the mercury reservoir forces the mercury up the vacuum tube a distance equivalent to the force exerted. In this manner, the height of the mercury column (measured in either inches [British] or millimeters [cgs]) represents the downward force of atmospheric pressure. Barometer pressure is reported with readings such as 30.4 inches of mercury (Hg) or 772 mm Hg; this means that the atmospheric pressure is great enough to support a column of mercury 30.4 inches or 772 mm in height.


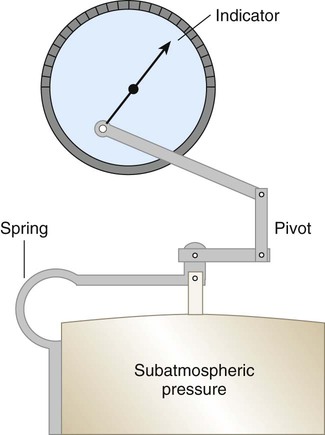
Clinical Pressure Measurements
The simplest mechanical pressure gauge is the aneroid barometer, which is common in homes. An aneroid barometer consists of a sealed evacuated metal box with a flexible, spring-supported top that responds to external pressure changes (Figure 6-16). This motion activates a geared pointer, which provides a scale reading analogous to pressure.
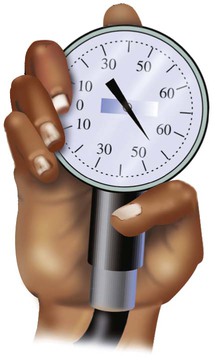
This same concept underlies the simple mechanical manometers used to measure blood or airway pressure at the bedside (Figure 6-17). However, rather than the pressure acting externally on the sealed chamber, the inside is connected to the pressure source. In this manner, the flexible chamber wall expands and contracts as pressure increases or decreases.
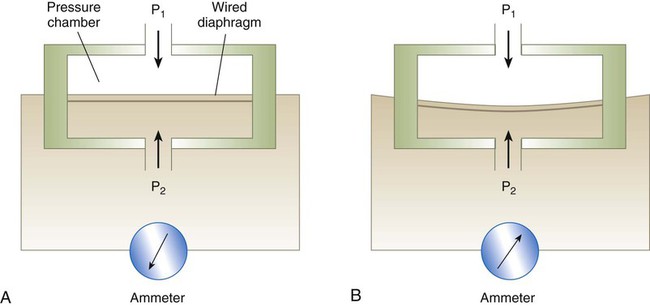
A flexible chamber can also be used to measure pressure electronically. These devices are called strain-gauge pressure transducers. In these devices, pressure changes expand and contract a flexible metal diaphragm connected to electrical wires (Figure 6-18). The physical strain on the diaphragm changes the amount of electricity flowing through the wires. By measuring this change in electrical flow, we are indirectly measuring changes in pressure.
 Rule of Thumb
Partial Pressures (Dalton’s Law)
Dalton’s law describes the relationship between the partial pressure and the total pressure in a gas mixture. According to this law, the total pressure of a mixture of gases must equal the sum of the partial pressures of all component gases. The principle states that the partial pressure of a component gas must be proportional to its percentage in the mixture.8


 Problem

In contrast, high atmospheric pressures increase the partial pressure of inspired oxygen (PiO2) in an air mixture. Pressures above atmospheric are called hyperbaric pressures.9 Hyperbaric pressures commonly occur only in underwater diving and in special hyperbaric chambers.9 For example, at a depth of 66 feet under the sea, water exerts a pressure of 3 atm, or 2280 mm Hg (3 × 760). At this depth, the oxygen in an air mixture breathed by a diver exerts a PO2 of 0.21 × 2280, or approximately 479 mm Hg. This is nearly three times the PO2 at sea level.
The same conditions can be created on dry land in a hyperbaric chamber. The U.S. Navy uses hyperbaric chambers for controlled depressurization of deep-sea divers and to treat certain types of diving accidents. Clinically, hyperbaric chambers and oxygen are used together to treat various conditions, including carbon monoxide poisoning and gangrene. Chapter 38 provides more details on this use of high-pressure oxygen.
 Problem
Gas Behavior under Changing Conditions
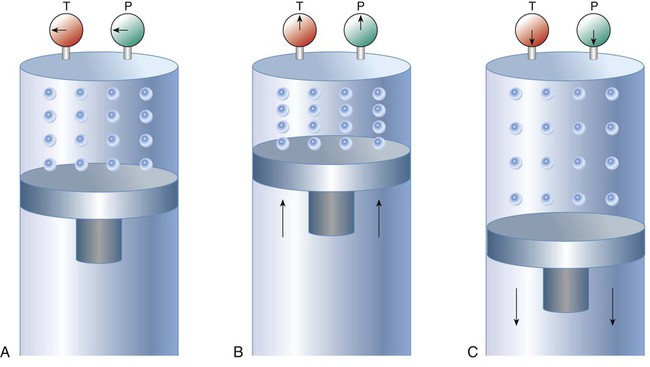
Gases, with large distances between their molecules, are easily compressed and expanded. When a gas is pressurized, the molecules are squeezed closer together. If a gas-filled container could be enlarged, the gas would expand to occupy the new volume. Figure 6-19 illustrates the concepts of gas compression and expansion.
Gas Laws
Several laws help define the relationship among gas pressure, temperature, mass, and volume (Table 6-4). Using these laws, the behavior of gases under changing conditions can be predicted. Underlying all these laws are three basic assumptions: (1) No energy is lost during molecular collisions, (2) the volume of the molecules themselves is negligible, and (3) no forces of mutual attraction exist between these molecules. These three assumptions describe the behavior of an “ideal gas.” Under normal conditions, most gases exhibit ideal behavior.
TABLE 6-4
Laws Describing Gas Behavior Under Changing Conditions
| Gas Law | Basic Relationship | Constants | Description | Working Formula* | Clinical Applications |
| Boyle’s law | P × V = k | Temperature, mass | Volume of a gas varies inversely with its pressure | P1V1 = P2V2 | Ventilation (see Chapter 10) |
| Body plethysmography (see Chapter 19) | |||||
| Compressed volume (see Chapter 38) | |||||
| Charles’ law |  |
Pressure, mass | Volume of gas varies directly with changes in its temperature (° K) |  |
ATPS to BTPS corrections (see this chapter) |
| Gay-Lussac’s law |  |
Volume, mass | Pressure exerted by a gas varies directly with its absolute temperature |  |
Cylinder pressures (see Chapter 37) |
| Combined gas law | PV = nRT | — | Interaction of above (none held constant) |  |
Complex interactions of variables |

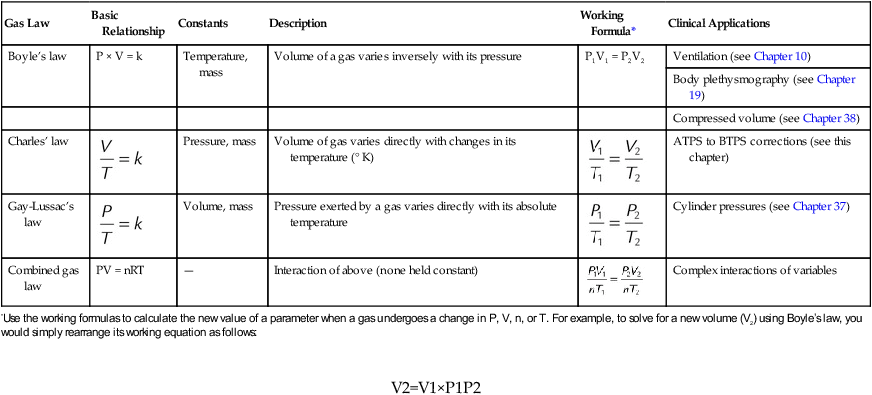
*Use the working formulas to calculate the new value of a parameter when a gas undergoes a change in P, V, n, or T. For example, to solve for a new volume (V2) using Boyle’s law, you would simply rearrange its working equation as follows:
Effect of Water Vapor
Corrected Pressure Computations
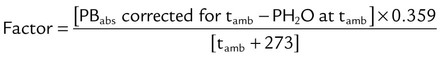
PC is the corrected gas pressure, Fgas is the fractional concentration of the gas in the gas mixture, PT is the total gas pressure of the mixture, and  is the water vapor pressure at the given temperature (see Table 6-3). If only a single gas is present, Fgas equals 1, and the formula can be simplified:
For example, in the presence of water vapor, Boyle’s law would have to be modified as follows:
Correction Factors
1. Correction from ambient temperature and pressure saturated (ATPS) to body temperature and pressure saturated (BTPS)
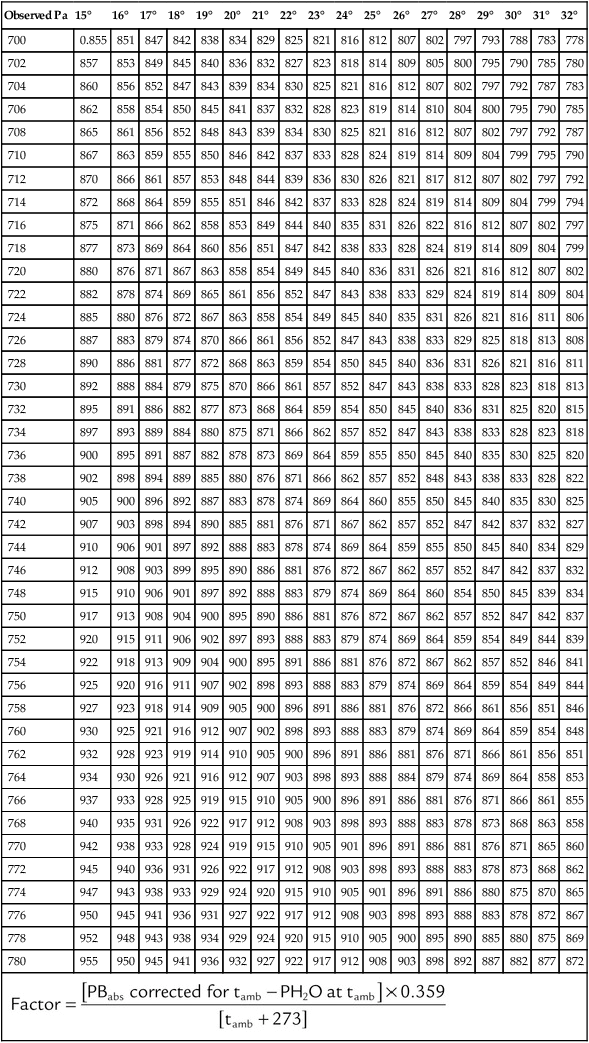
The values in the third column of Table 6-3, when multiplied by V1, convert a gas volume from ATPS to BTPS. Table 6-5 provides the factors needed to convert a gas volume from ATPS to STPD. To use Table 6-5, simply multiply the ATPS volume by the factor corresponding to the specified temperature and uncorrected barometric pressure. Finally, Table 6-6 provides the factors needed to correct volumes from STPD to BTPS. To use Table 6-6, simply multiply the STPD volume by the factor corresponding to the ambient pressure.
TABLE 6-5
Factors to Convert Gas Volumes from STPD to BTPS at Given Barometric Pressures
| Pressure | Factor | Pressure | Factor |
| 740 | 1.245 | 760 | 1.211 |
| 742 | 1.241 | 762 | 1.208 |
| 744 | 1.238 | 764 | 1.203 |
| 746 | 1.235 | 766 | 1.200 |
| 748 | 1.232 | 768 | 1.196 |
| 750 | 1.227 | 770 | 1.193 |
| 752 | 1.224 | 772 | 1.190 |
| 754 | 1.221 | 774 | 1.188 |
| 756 | 1.217 | 776 | 1.183 |
| 758 | 1.214 | 778 | 1.181 |
 |
|||
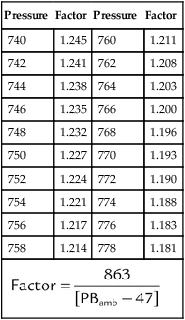
TABLE 6-6
Factors to Convert Gas Volumes from ATPS to STPD
| Observed Pa | 15° | 16° | 17° | 18° | 19° | 20° | 21° | 22° | 23° | 24° | 25° | 26° | 27° | 28° | 29° | 30° | 31° | 32° |
| 700 | 0.855 | 851 | 847 | 842 | 838 | 834 | 829 | 825 | 821 | 816 | 812 | 807 | 802 | 797 | 793 | 788 | 783 | 778 |
| 702 | 857 | 853 | 849 | 845 | 840 | 836 | 832 | 827 | 823 | 818 | 814 | 809 | 805 | 800 | 795 | 790 | 785 | 780 |
| 704 | 860 | 856 | 852 | 847 | 843 | 839 | 834 | 830 | 825 | 821 | 816 | 812 | 807 | 802 | 797 | 792 | 787 | 783 |
| 706 | 862 | 858 | 854 | 850 | 845 | 841 | 837 | 832 | 828 | 823 | 819 | 814 | 810 | 804 | 800 | 795 | 790 | 785 |
| 708 | 865 | 861 | 856 | 852 | 848 | 843 | 839 | 834 | 830 | 825 | 821 | 816 | 812 | 807 | 802 | 797 | 792 | 787 |
| 710 | 867 | 863 | 859 | 855 | 850 | 846 | 842 | 837 | 833 | 828 | 824 | 819 | 814 | 809 | 804 | 799 | 795 | 790 |
| 712 | 870 | 866 | 861 | 857 | 853 | 848 | 844 | 839 | 836 | 830 | 826 | 821 | 817 | 812 | 807 | 802 | 797 | 792 |
| 714 | 872 | 868 | 864 | 859 | 855 | 851 | 846 | 842 | 837 | 833 | 828 | 824 | 819 | 814 | 809 | 804 | 799 | 794 |
| 716 | 875 | 871 | 866 | 862 | 858 | 853 | 849 | 844 | 840 | 835 | 831 | 826 | 822 | 816 | 812 | 807 | 802 | 797 |
| 718 | 877 | 873 | 869 | 864 | 860 | 856 | 851 | 847 | 842 | 838 | 833 | 828 | 824 | 819 | 814 | 809 | 804 | 799 |
| 720 | 880 | 876 | 871 | 867 | 863 | 858 | 854 | 849 | 845 | 840 | 836 | 831 | 826 | 821 | 816 | 812 | 807 | 802 |
| 722 | 882 | 878 | 874 | 869 | 865 | 861 | 856 | 852 | 847 | 843 | 838 | 833 | 829 | 824 | 819 | 814 | 809 | 804 |
| 724 | 885 | 880 | 876 | 872 | 867 | 863 | 858 | 854 | 849 | 845 | 840 | 835 | 831 | 826 | 821 | 816 | 811 | 806 |
| 726 | 887 | 883 | 879 | 874 | 870 | 866 | 861 | 856 | 852 | 847 | 843 | 838 | 833 | 829 | 825 | 818 | 813 | 808 |
| 728 | 890 | 886 | 881 | 877 | 872 | 868 | 863 | 859 | 854 | 850 | 845 | 840 | 836 | 831 | 826 | 821 | 816 | 811 |
| 730 | 892 | 888 | 884 | 879 | 875 | 870 | 866 | 861 | 857 | 852 | 847 | 843 | 838 | 833 | 828 | 823 | 818 | 813 |
| 732 | 895 | 891 | 886 | 882 | 877 | 873 | 868 | 864 | 859 | 854 | 850 | 845 | 840 | 836 | 831 | 825 | 820 | 815 |
| 734 | 897 | 893 | 889 | 884 | 880 | 875 | 871 | 866 | 862 | 857 | 852 | 847 | 843 | 838 | 833 | 828 | 823 | 818 |
| 736 | 900 | 895 | 891 | 887 | 882 | 878 | 873 | 869 | 864 | 859 | 855 | 850 | 845 | 840 | 835 | 830 | 825 | 820 |
| 738 | 902 | 898 | 894 | 889 | 885 | 880 | 876 | 871 | 866 | 862 | 857 | 852 | 848 | 843 | 838 | 833 | 828 | 822 |
| 740 | 905 | 900 | 896 | 892 | 887 | 883 | 878 | 874 | 869 | 864 | 860 | 855 | 850 | 845 | 840 | 835 | 830 | 825 |
| 742 | 907 | 903 | 898 | 894 | 890 | 885 | 881 | 876 | 871 | 867 | 862 | 857 | 852 | 847 | 842 | 837 | 832 | 827 |
| 744 | 910 | 906 | 901 | 897 | 892 | 888 | 883 | 878 | 874 | 869 | 864 | 859 | 855 | 850 | 845 | 840 | 834 | 829 |
| 746 | 912 | 908 | 903 | 899 | 895 | 890 | 886 | 881 | 876 | 872 | 867 | 862 | 857 | 852 | 847 | 842 | 837 | 832 |
| 748 | 915 | 910 | 906 | 901 | 897 | 892 | 888 | 883 | 879 | 874 | 869 | 864 | 860 | 854 | 850 | 845 | 839 | 834 |
| 750 | 917 | 913 | 908 | 904 | 900 | 895 | 890 | 886 | 881 | 876 | 872 | 867 | 862 | 857 | 852 | 847 | 842 | 837 |
| 752 | 920 | 915 | 911 | 906 | 902 | 897 | 893 | 888 | 883 | 879 | 874 | 869 | 864 | 859 | 854 | 849 | 844 | 839 |
| 754 | 922 | 918 | 913 | 909 | 904 | 900 | 895 | 891 | 886 | 881 | 876 | 872 | 867 | 862 | 857 | 852 | 846 | 841 |
| 756 | 925 | 920 | 916 | 911 | 907 | 902 | 898 | 893 | 888 | 883 | 879 | 874 | 869 | 864 | 859 | 854 | 849 | 844 |
| 758 | 927 | 923 | 918 | 914 | 909 | 905 | 900 | 896 | 891 | 886 | 881 | 876 | 872 | 866 | 861 | 856 | 851 | 846 |
| 760 | 930 | 925 | 921 | 916 | 912 | 907 | 902 | 898 | 893 | 888 | 883 | 879 | 874 | 869 | 864 | 859 | 854 | 848 |
| 762 | 932 | 928 | 923 | 919 | 914 | 910 | 905 | 900 | 896 | 891 | 886 | 881 | 876 | 871 | 866 | 861 | 856 | 851 |
| 764 | 934 | 930 | 926 | 921 | 916 | 912 | 907 | 903 | 898 | 893 | 888 | 884 | 879 | 874 | 869 | 864 | 858 | 853 |
| 766 | 937 | 933 | 928 | 925 | 919 | 915 | 910 | 905 | 900 | 896 | 891 | 886 | 881 | 876 | 871 | 866 | 861 | 855 |
| 768 | 940 | 935 | 931 | 926 | 922 | 917 | 912 | 908 | 903 | 898 | 893 | 888 | 883 | 878 | 873 | 868 | 863 | 858 |
| 770 | 942 | 938 | 933 | 928 | 924 | 919 | 915 | 910 | 905 | 901 | 896 | 891 | 886 | 881 | 876 | 871 | 865 | 860 |
| 772 | 945 | 940 | 936 | 931 | 926 | 922 | 917 | 912 | 908 | 903 | 898 | 893 | 888 | 883 | 878 | 873 | 868 | 862 |
| 774 | 947 | 943 | 938 | 933 | 929 | 924 | 920 | 915 | 910 | 905 | 901 | 896 | 891 | 886 | 880 | 875 | 870 | 865 |
| 776 | 950 | 945 | 941 | 936 | 931 | 927 | 922 | 917 | 912 | 908 | 903 | 898 | 893 | 888 | 883 | 878 | 872 | 867 |
| 778 | 952 | 948 | 943 | 938 | 934 | 929 | 924 | 920 | 915 | 910 | 905 | 900 | 895 | 890 | 885 | 880 | 875 | 869 |
| 780 | 955 | 950 | 945 | 941 | 936 | 932 | 927 | 922 | 917 | 912 | 908 | 903 | 898 | 892 | 887 | 882 | 877 | 872 |
 |
||||||||||||||||||
Critical Temperature and Pressure
Compared with liquids, gases have much lower critical points. Table 6-7 lists the critical points of four gases used in clinical practice: oxygen, helium, CO2, and nitrous oxide (N2O). The critical temperatures of oxygen and helium are well below the normal room temperature of 20° C (68° F), whereas the critical temperatures of CO2 and N2O are above room temperature.
TABLE 6-7
Critical Points of Three Gases
| Gas | ° C | ° F | Atmosphere |
| Helium (He) | −267.9 | −450.2 | 2.3 |
| Oxygen (O2) | −118.8 | −181.1 | 49.7 |
| Carbon dioxide (CO2) | 31.1 | 87.9 | 73.0 |
| Nitrous oxide (N2O) | 36.5 | 97.7 | 71.8 |
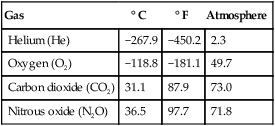
According to these principles, any gas with a critical temperature above ambient should be able to be liquefied simply by having pressure applied. Both CO2 and N2O have critical temperatures above normal room temperature (see Table 6-7). Both gases can be liquefied by simple compression and stored as liquids at room temperature without cooling. However, both liquefied gases still need to be stored under pressure, usually in strong metal cylinders.
Fluid Dynamics
Pressures in Flowing Fluids
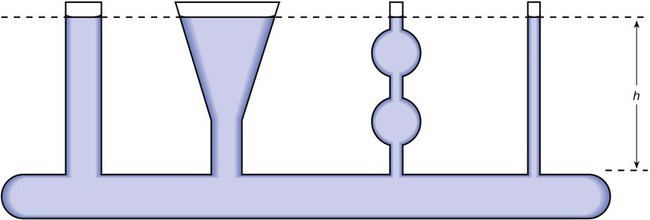
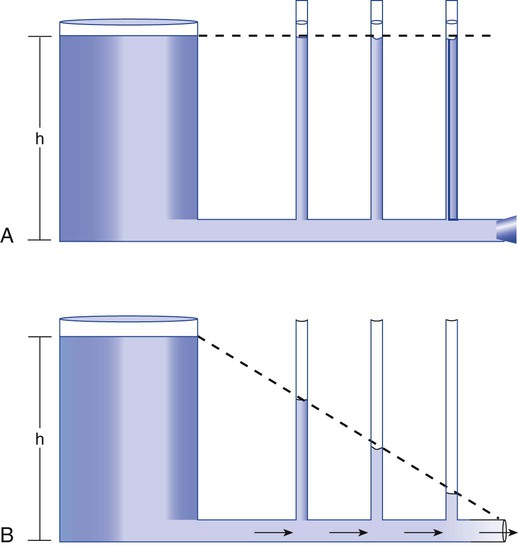
As we have seen, the pressure of a static liquid depends solely on the depth and density of the fluid. In contrast, the pressure exerted by a liquid in motion depends on the nature of the flow itself. As shown in Figure 6-20, A, the pressure exerted by a static fluid is the same at all points along a horizontal tube, depending only on the height (h) of the liquid column. However, when the fluid flows out through the bottom tube, the pressure progressively decreases all along the tube length (see Figure 6-20, B). In addition, the decrease in pressure between each of the equally spaced vertical tubes is the same.
 is the flow (volume per unit time). This formula has wide application in pulmonary physiology and respiratory care. The accompanying Mini Clini provides a good example of such application.
Patterns of Flow
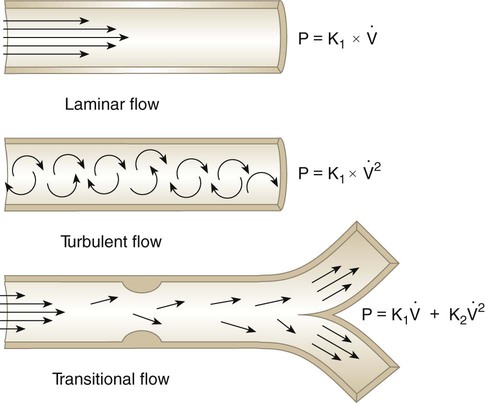
The pressure difference that results from flow also varies with the pattern of flow. There are three primary patterns of flow through tubes: laminar, turbulent, and transitional (Figure 6-21).

 is the fluid flow, r is the tube radius, and π and 8 are constants.
Turbulent Flow
Under certain conditions, the pattern of flow through a tube changes significantly, with a loss of regular streamlines. Instead, fluid molecules form irregular eddy currents in a chaotic pattern called turbulent flow (see Figure 6-21). This changeover from laminar to turbulent flow depends on several factors, including fluid density (d), viscosity (h), linear velocity (v), and tube radius (r). In combination, these factors determine Reynold’s number (NR).
Mini Clini
Differential Pressure Pneumotachometer
 Problem
Flow through a tube with constant resistance is directly proportional to the pressure difference across the tube. By measuring this pressure difference (using a strain-gauge transducer, such as described in Figure 6-18), we can measure flow. To ensure linearity between pressure and flow, the flow pattern through the tube must remain laminar.

 is the fluid flow.
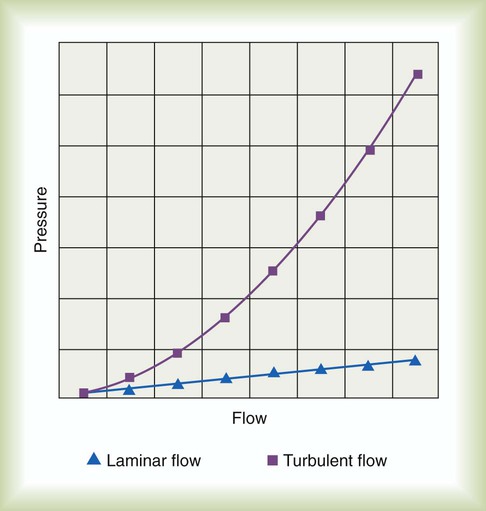
Figure 6-22 compares the relationship between pressure and flow under laminar and turbulent conditions. As can be seen, when flow is laminar (Poiseuille’s law), the relationship between driving pressure and flow is linear. However, when flow becomes turbulent, driving pressure varies with the square of the flow ( ). To double flow under laminar conditions, we need only double the driving pressure. To double flow under turbulent conditions, we would have to increase the driving pressure fourfold.
Flow, Velocity, and Cross-Sectional Area
Although fluid flow and velocity are different measures, the two concepts are closely related. The key factor relating velocity to flow is the cross-sectional area of the conducting system. Figure 6-23 shows this relationship.
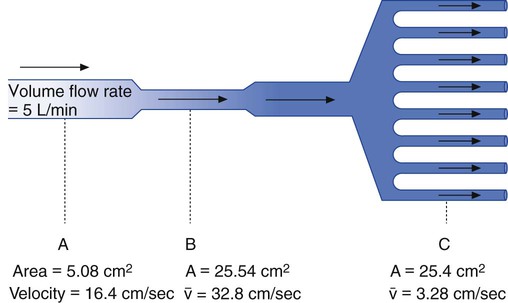

Although the principle holds true only for incompressible liquids, the qualitative features are similar for gas flow. This principle also underlies the application of nozzles or jets in fluid streams. Nozzles and jets are simply narrow passages in a tube designed to increase fluid velocity. A garden-hose nozzle is a good example of this principle in action. Clinically, jets are used in many types of respiratory care equipment, including pneumatic nebulizers (see Chapter 36) and gas entrainment or mixing devices (see Chapter 38).
Bernoulli Effect
When a fluid flows through a tube of uniform diameter, pressure decreases progressively over the tube length.11 The first three water columns in Figure 6-24 show this continuous pressure decrease. However, when the fluid passes through a constriction, the decrease in pressure is much greater. This large pressure decrease can be observed in the fourth water column in Figure 6-24. The eighteenth-century scientist Bernoulli was the first to study this effect carefully, which now bears his name. Bernoulli explained the pressure decrease depicted in Figure 6-24 by showing how the potential, kinetic, and pressure energies of a fluid interact.
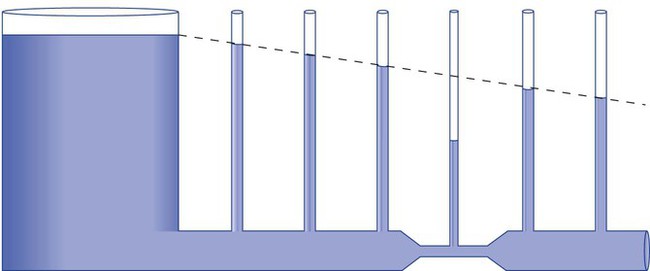
Figure 6-25 shows this relationship. Fluid is flowing through a tube at a point with a certain velocity (va) and a lateral pressure (Pa). According to the law of continuity, as the fluid moves into the narrow or constricted portion of the tube, its velocity must increase (vb > va). According to the Bernoulli theorem, the higher velocity at point b should result in a lower lateral pressure at that point (Pb < Pa). As a fluid flows through the constriction, its velocity increases, and its lateral pressure decreases.
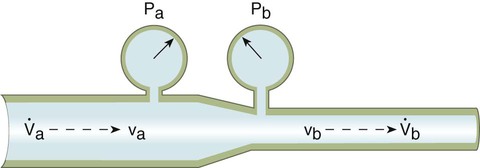
 , flow in tube “a”; va, velocity in tube “a”; vb, velocity in tube “b”;
  , flow in tube “b”; Pa, lateral wall pressure in tube “a”; Pb, lateral wall pressure after restriction (see text).
Fluid Entrainment
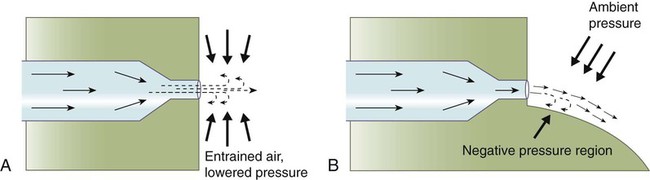
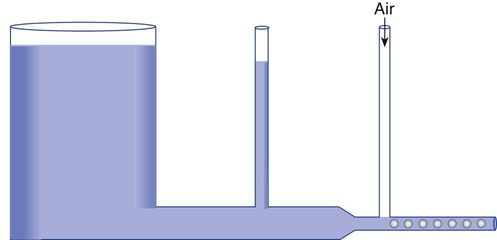
If an open tube is placed distal to such a constriction, this negative pressure can pull another fluid into the primary flow stream (Figure 6-26). This effect is called fluid entrainment. In Figure 6-26, air is the entrained fluid. This use is common in the home where faucet aerators mix air into the water stream. In the laboratory, a similar faucet attachment, called a water aspirator, is used to create negative pressure or vacuum.
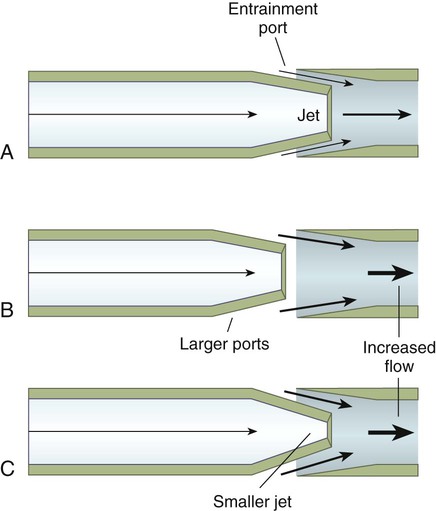
The amount of air entrained depends on both the diameter of the jet orifice and the size of the air entrainment ports (Figure 6-27). For a fixed jet size, the larger the entrainment ports, the greater the volume of air entrained and the higher the total flow (see Figure 6-27, B). The entrained volume can still be altered, with fixed entrainment ports, by changing the jet diameter (see Figure 6-27, C). A large jet results in a lower gas velocity and less entrainment, whereas a small jet boosts velocity, entrained volume, and total flow.
Venturi and Pitot Tubes
A Venturi tube is a modified entrainment device, developed approximately 200 years ago by Venturi.12 A Venturi tube widens just after its jet or nozzle (Figure 6-28). As long as the angle of dilation is less than 15 degrees, this widening helps restore fluid pressure back toward prejet levels.
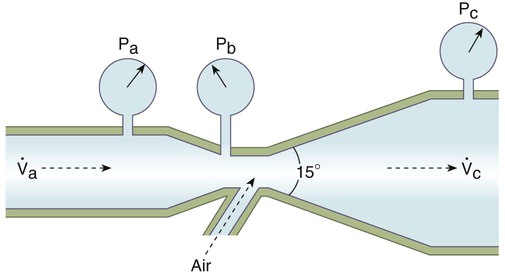
 , flow before restriction;
  , flow from entrainment plus driving flow.
Fluidics and Coanda Effect
The primary principle underlying most fluidic circuitry is a phenomenon called wall attachment, or the Coanda effect. This effect is observed mainly when a fluid flows through a small orifice with properly contoured downstream surfaces.13
Based on the Bernoulli effect, we know that the negative pressure created at a jet or nozzle entrains any surrounding fluid, such as air, into the primary flow stream (Figure 6-29, A). If a carefully contoured curved wall is added to one side of the jet (see Figure 6-29, B), the pressure near the wall becomes negative relative to atmospheric. The atmospheric pressure on the other side of the gas stream pushes it against the wall, where it remains “locked” until interrupted by some counterforce. By carefully extending the wall contour, we can deflect the fluid stream through a full 180-degree turn.