Chapter 7 Pharmacology of Pediatric Anesthesia
Developmental pharmacology
Developmental changes profoundly affect the clinical response to medicines. Dr. Abraham Jacobi, a founder of American pediatrics, recognized more than a century ago that children are not “miniature men and women, with reduced doses and the same class of disease in smaller bodies,” that pediatrics “has its own independent range and horizon,” and that age-appropriate pharmacotherapy was important (Kearns et al., 2003). More recently, as the immaturity of renal and metabolic systems has been recognized, the pharmacologic uniqueness of babies and infants has been specifically recognized (Anderson and Holford, 2008). Physical growth, development, organ maturation, physiologic changes, and coexisting disease that occur throughout the spectrum of development—from preterm newborn to adolescence and adulthood—profoundly influence drug pharmacokinetics and pharmacodynamics, and ultimately the panoply of both desirable and undesirable clinical responses. This chapter presents the basic pharmacologic principles relevant to understanding basic pediatric pharmacology in general, and that of pediatric anesthetic pharmacology in particular.
Medications that are commonly used in children are not regularly tested in children, and drug labeling often consists exclusively of adult data. Of the 140 new molecular entities of potential use in pediatrics, only 38% were labeled for use in children when they were initially approved (Tod et al., 2008). Much use of drugs in pediatrics, particularly in newborns and infants, is off-label use. About one third of drugs prescribed in office-based pediatric practice, two thirds of those prescribed in hospitals, and 90% of drugs used in pediatric intensive care units are used for indications other than those for which they have been approved (Tod et al., 2008). When data were submitted to the U.S. Food and Drug Administration (FDA) to support labeling changes intended to guide pediatric drug use, on average, only 2.2 pediatric studies were represented (Abdel-Rahman et al., 2007). A considerable amount of pediatric drug use is based on “extrapolation” (or worse) from adult dosing and use guidelines. A major address of pediatric pharmacology research in the past decade has focused on the challenge of characterizing developmental changes in pharmacokinetics and pharmacodynamics, as well as determining proper pediatric dosing guidelines, particularly the downward scaling of adult doses to children.
Physiology and Development
Growth and maturation are seminal features of pediatric development, and it is important to understand that they vary independently (Anderson and Holford, 2008; Rhodin et al., 2009; Sumpter and Anderson, 2009). Growth is an increase in size, often characterized by changes in weight. Maturation is a time-dependent phenomenon, often characterized by age. Traditionally, the common metric of maturation was postnatal age (PNA), the time since birth. With the superiority of neonatal intensive care and the survival of neonates as small as 500 g and 24 weeks’ gestation, who have clearly immature and widely variant degrees of development at birth, it is now well established that PNA is an inadequate metric of organ maturation, which actually begins before birth. Postconceptual age (PCA), the sum of gestational age (the period between conception and birth) and PNA, is a superior metric. Because of the inexactitude in determining the date of conception, the alternate metric of postmenstrual age (PMA) is often used instead. Particularly for infants and very small children, use of PCA or PMA rather than PNA is important in pediatric pharmacology and therapeutics.
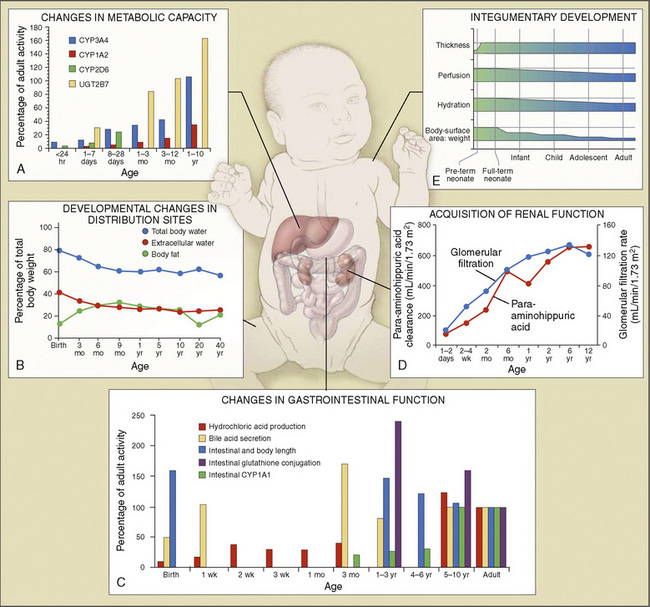
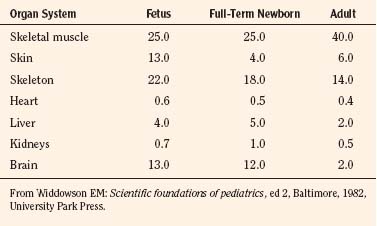
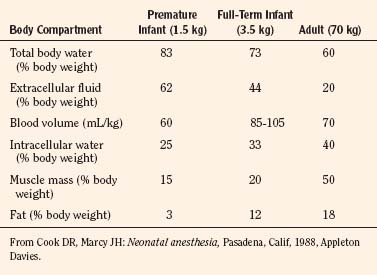
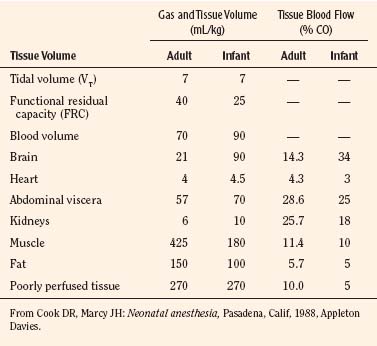
Body composition changes dramatically during growth and development (Anderson and Holford, 2008). Simply stated, compared with adults, infants have big heads, large torsos, and short, stumpy legs. Figure 7-1 depicts developmental changes in pediatric physiology that can affect drug disposition. Table 7-1 describes the changes in organ weight that occur during growth. The most significant changes with age are in total body water, the intracellular vs. extracellular distribution of body water, and muscle and fat mass (Tables 7-2 and 7-3). Total body water content constitutes 75% of body weight in the full-term newborn and 80% to 85% of body weight in the preterm neonate. This decreases to about 60% at 5 months and remains relatively constant until puberty. Extracellular water redistributes intracellularly during the first year of life. Extracellular fluid is 45% to 50% of body weight in premature and newborn infants, decreasing to 26% at 1 year and 18% in adults. In contrast, body fat increases with age, from 3% in premature neonates and 12% in full-term newborns, to 30% at 1 year of age. “Baby fat” is shed when toddlers start walking and drops to adult levels of about 18%, concomitant with an increase in muscle mass. A major consequence of body-composition changes may be differences in drug volume of distribution, with neonates and infants having larger volumes of water-soluble drugs, as described below.

where Y is the biological characteristic, W is the body mass, and a and b are empirically derived constants. For physiologic functions such as cardiac output, metabolic rate, oxygen consumption, glomerular filtration rate (GFR), and pharmacologic functions such as drug clearance, the power exponent b is 0.75. For physiologic volumes such as blood volume, lung volume, tidal volume, and stroke volume, and pharmacologic volumes such as the volume of distribution, the power exponent is 1. For time-based physiologic functions such as circulation time, heart rate, and respiratory rate, and pharmacologic functions such as drug elimination half-life, the exponent is 0.25 (Johnson and Thomson, 2008). This allometric model may then be used to scale metabolic processes across size:

Pharmacokinetic Parameters
Volume of Distribution
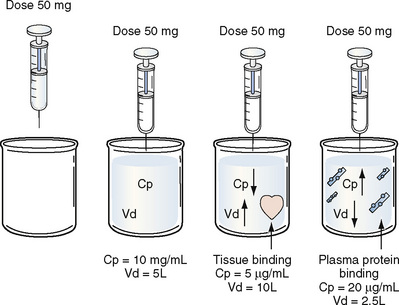
Volume of distribution (Vd) is a theoretic concept that relates the amount of drug in the body (dose) to the concentration (C) of drug that is measured (in blood, plasma, and unbound in tissue water). Volume of distribution is the volume of fluid “apparently” required to contain the total-body amount of drug homogeneously at a concentration equal to that in plasma (or blood) (Fig. 7-2):

Clearance


Renal Clearance
The kidney is the most important organ for elimination of water-soluble drugs and metabolites. This is particularly true for infants and small children, in whom hepatic metabolism is underdeveloped, and in whom age-dependent renal clearance is a major determinant of age-appropriate drug dosing (Kearns et al., 2003). Maturation of renal function, which occurs independently of PNA, is a dynamic process. Nephrogenesis begins between about weeks 5 and 9 of gestation and is complete by week 36, after which there are changes in renal blood flow (Kearns et al., 2003; Rhodin et al., 2009). GFR is approximately 5 mL/min in full-term neonates, but about one fifth that in preterm neonates. GFR increases with PMA, at a rate described as a maturation function (MF), based on the sigmoidal hyperbolic Hill equation, where PMA50γ is the maturation half-time, and γ is the Hill coefficient:

The rate of GFR maturation is nonlinear and maximum at about 48 weeks’ PMA. It varies with prematurity, with preterm neonates (33 to 34 weeks’ PMA) having a slower increase (14 mL/min per 1.73 m2 per week PMA) in the first few weeks of life than full-term neonates (39 to 41 weeks’ PMA; 94 mL/min per 1.73 m2 per week PMA). In general, healthy newborns’ GFR is about 30% of adult GFR and reaches adult values at about 8 to 12 months of age. Renal tubular function matures more slowly, reaching adult levels at about 12 to 18 months of age. For example, the dosing interval for tobramycin, which is eliminated renally, is 24 hours in full-term newborns but 36 to 48 hours in preterm newborns (Kearns et al., 2003).
Hepatic Clearance
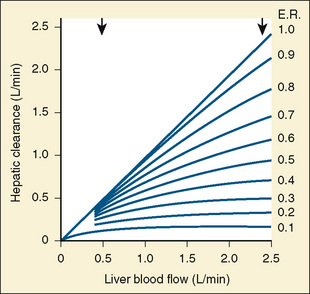
For many drugs, including several used in anesthesia (e.g., sedative hypnotics, benzodiazepines, opioids, and neuromuscular blockers), hepatic clearance (CLH in the following formulas) is a major route of elimination (Wilkinson, 1987). Hepatic clearance is the product of liver blood flow (QH) and the hepatic extraction ratio (EH) of a drug.


Since only an unbound drug is considered diffusible into liver cells (although in reality a simplification), EH also depends on the fraction of unbound drug in the blood (fu) (Baker and Parton, 2007). Therefore the three theoretic primary determinants of hepatic drug clearance are liver blood flow, intrinsic clearance (biotransformation), and plasma protein binding.
In reality, the important determinants of hepatic clearance are liver blood flow and the extraction ratio (Fig. 7-3). For drugs with a high extraction ratio (e.g., lidocaine, fentanyl, sufentanil, and propofol), hepatic clearance depends primarily on hepatic blood flow (because intrinsic clearance is so efficient, drug delivery to the liver becomes rate limiting). For low-extraction drugs (e.g., methadone, diazepam, and alfentanil), hepatic clearance is independent of hepatic blood flow and depends primarily on intrinsic clearance (metabolism).
Absorption
Although the predominant route of drug administration in pediatric anesthesiology is intravenous, the oral route is the most commonly used in children. Changes in physiologic processes that accompany normal growth and development can affect drug absorption (Kearns et al., 2003; Abdel-Rahman et al., 2007). In general, neonates and small children absorb drugs more slowly than older children and adults, resulting in delayed and lower peak drug concentrations. Neonatal gastric pH is relatively high (greater than 4) compared with older children and adults, thus acid-labile drugs (such as penicillin G) are more efficiently absorbed and have greater bioavailability. Conversely, weak acids (such as phenobarbital) may require larger doses because of reduced bioavailability. In the first few months of life, gastric emptying, intestinal motility, and intestinal drug transport increase.
Distribution
Plasma protein binding can exhibit developmental differences, although the clinical significance of protein binding in pharmacokinetics and pharmacodynamics remains unresolved (Benet and Hoener, 2002; Trainor, 2007). The primary binding proteins are albumin (for acidic drugs) and α1-acid glycoprotein (for basic drugs). Decreased plasma albumin and α1-acid glycoprotein concentrations in neonates may result in increased unbound (free) drug concentrations and hence pharmacologic effect.
Metabolism
Metabolism of a drug can result in bioactivation of an inactive prodrug, formation of an active or inactive metabolite, or occasionally a toxic metabolite. The liver is the primary site of drug metabolism, although the intestine can metabolize oral drugs before they reach the systemic circulation and extrahepatic metabolism (e.g., renal, blood, and other tissues) may be important for certain drugs (i.e., remifentanil and propofol). Phase I reactions (oxidation, reduction, and hydrolysis) chemically modify the drug structure to add, form, or uncover a functional group and render the molecule more water soluble. Phase II reactions (glucuronidation, sulphation, and glutathione conjugation) add an endogenous molecule to the drug or metabolite to render it even more water soluble for elimination. Typical pathways of drug metabolism are provided in Table 7-4.
| Reaction | Examples |
| Phase I | |
| Oxidation reactions | Thiopental, methohexital |
| Aliphatic hydroxylation | Pentazocine, meperidine, glutethimide, doxapram, ketamine, chlorpromazine, fentanyl, propranolol |
| Aromatic | Lidocaine, bupivacaine, mepivacaine |
| Expoxidation | Phenytoin |
| O-Dealkylation | Pancuronium, vecuronium, codeine, phenacetin, methoxyflurane |
| N-Dealkylation | Morphine, meperidine, fentanyl, diazepam, amide local anesthetics, ketamine, codeine, atropine, methadone |
| N-Oxidation | Meperidine, normeperidine, morphine, tetracaine |
| S-Oxidation | Chlorpromazine |
| Oxidative deamination | Amphetamine, epinephrine |
| Desulfuration | Thiopental |
| Dehalogenation | Halogenated anesthetics |
| Dehydrogenation | Ethanol |
| Reduction Reactions | |
| Axo reduction | Fazadinium |
| Nitroreduction | Nitrazepam, dantrolene |
| Carbonyl reduction | Prednisolone |
| Alcohol dehydrogenation | Ethanol, chloral hydrate |
| Hydrolysis Reactions | |
| Ester hydrolysis | Ester local anesthetics, succinylcholine, acetylsalicyclic acid, propanidid amide local anesthetics |
| Phase II: Conjugation Reactions | |
| Glucuronamide | Oxazepam, lorazepam, morphine, nalorphine, codeine, fentanyl, naloxone |
| Sulfate | Acetaminophen, morphine, isoproterenol, cimetidine |
| Methylation | Norepinephrine |
| Acetylation | Procainamide |
| Amino acid | Salicyclic acid |
| Mercapturic acid | Sulfobromophthalein |
| Glutathione | Acetaminophen |
Modified from Tucker GT: Drug metabolism, Br J Anaesth 51:603, 1979.
Comprehensive reviews of human drug metabolism are available, but a generalized overview is instructive for understanding developmental changes in biotransformation (Kramer and Testa, 2008; Pelkonen et al., 2008; Zanger et al., 2008). Cytochrome P450 (CYP) is the main oxidative (phase I) metabolizing enzyme system, and more than 50 human P450s have been identified, although only a small fraction are responsible for the majority of drug metabolism (Fig. 7-4) (Paine et al., 2006; Zanger et al., 2008). Individual CYPs are classified by their sequence evolution and amino-acid similarities (Ingelman-Sundberg et al., 2007; Zanger et al., 2008). Those with greater than 40% sequence homology are grouped in a family (designated by an Arabic number, e.g., CYP3); those with more than 55% homology are in a subfamily (designated by a letter, e.g., CYP3A), and individual CYPs are identified by a third number (e.g., CYP3A4). The majority of drugs in humans are metabolized by CYPs 1, 2, and 3 (particularly CYPs 1A2, 2B6, 2C8, 2C9, 2C19, 2D6 and 3A4, 3A5, and 3A7). CYPs can have numerous genetic variants, and there are several highly polymorphic CYPs. Allelic CYP variants are designated by an asterisk and number (e.g., CYP3A5*3, where the “wild-type” is always *1) (Ingelman-Sundberg et al., 2007; Zanger et al., 2008). CYPs can have varying degrees of substrate specificity, and some are very accommodating, like CYP3A, which metabolizes approximately one third to one half of all therapeutically used drugs.
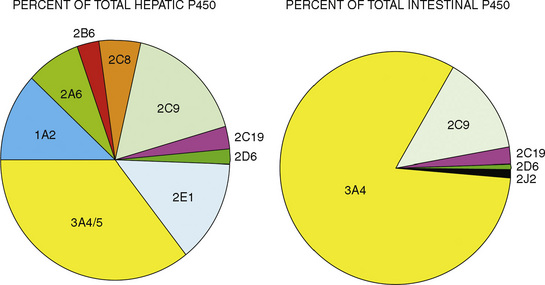
FIGURE 7-4 Cytochrome P450 isoform content in human liver and intestine.
(Data from Rowland-Yeo K et al.: Abundance of cytochromes P450 in human liver: a metaanalysis, Br J Clin Pharmacol 57:687, 2004; Paine et al.: The human intestinal cytochrome P450 “pie,” Drug Metab Dispos 34:880, 2006.)
The developmental pattern of biotransformation activity generally follows a hyperbolic curve with age that begins in fetal development, with hepatic drug metabolism and very low clearance before and during the first month. It reaches near adult levels at approximately 1 year, becomes maximum before puberty, and declines slightly into adulthood (Johnson and Thomson, 2008). There are, however, enzyme and isoform-specific patterns of developmental maturation of drug-metabolizing enzymes (Blake et al., 2005; Hines, 2008). Several pertinent examples are in the following paragraphs.
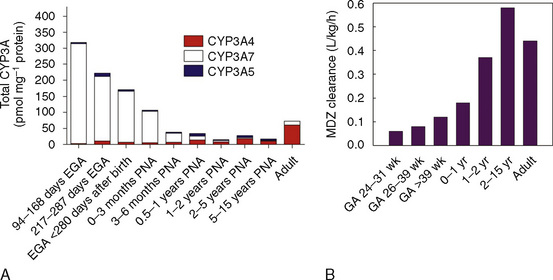
The CYP3A family is the most important drug-metabolizing enzyme. The important isoforms are CYP3A4 (the major CYP present in the adult liver and the intestine), CYP3A5 (which metabolizes very many of the CYP3A4 substrates with equal or diminished activity and is polymorphically expressed), and CYP3A7 (a fetal form that is usually less active than 3A4 or 3A5). CYP3A undergoes a “developmental switch” with CYP3A7, the predominant CYP3A expressed in fetal liver (Stevens, 2006; Hines, 2008). Indeed it is the most abundant of any CYP and is thought to be important in fetal steroid metabolism and homeostasis (Fig. 7-5, A). CYP3A7 expression decreases during gestation, declines further after birth, and is typically undetectable after the first year. CYP3A4 expression is low during development and then increases after the first 6 months of age. CYP3A metabolizes many drugs of importance in anesthesiology, including all of the fentanyl series opioids (except remifentanil), most benzodiazepines, and local anesthetics. Although high in abundance, CYP3A7 has low activity toward many drugs (1% to 3% of the activity of CYP3A4 towards midazolam and alfentanil) (Björkman, 2006). Therefore, CYP3A-catalyzed drug metabolism and clearance increases with age. For example, the hepatic extraction of midazolam is only 0.04 in neonates, compared with 0.38 in adults (Björkman, 2006). Midazolam clearance is similarly very low in neonates, particularly in preterm infants. The age-dependent maturation of midazolam clearance is shown in Figure 7-5, B.
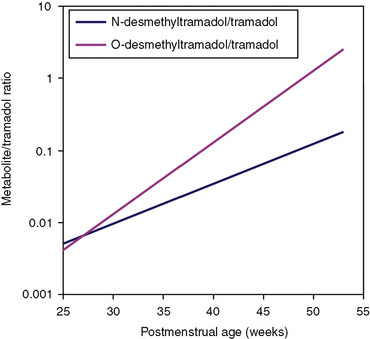
Other hepatic CYP isoforms also demonstrate maturation of expression. CYPs 1A2, 2C9, 2C19, 2D6, and 2E1 are expressed minimally or not at all in the fetus, but substantial increases occur after birth. CYP2D6 metabolizes about one fourth of all drugs, including antidepressants, antipsychotics, β-blockers, and numerous orally administered opioids, most notably catalyzing bioactivation of the inactive prodrugs codeine and tramadol (to the pharmacologically active metabolites morphine and O-desmethyltramadol, respectively) (Ingelman-Sundberg et al., 2007; Madadi and Koren, 2008). Isoform-dependent maturation of CYP enzymes in infants is exemplified by the development of tramadol metabolism and disposition, which shows that CYP2D6-catalyzed O-demethylation matures faster than CYP3A-catalyzed N-demethylation (Fig. 7-6). CYP1A2 metabolizes caffeine and theophylline, two methylxanthines that are commonly used in pediatrics. CYP1A2 is essentially absent in fetal liver and minimally active in neonates, such that 85% of caffeine is eliminated unchanged renally in neonates (Cazeneuve et al., 1994). CYP1A2 activity matures rapidly thereafter, reaching adult values by age 6 months, and caffeine clearance in these children reflects primarily hepatic demethylation (Kearns et al., 2003).
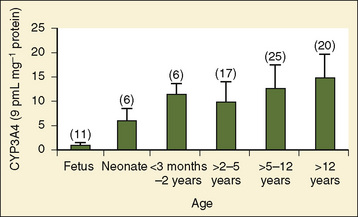
Compared with hepatic CYP enzymes, the ontogeny of CYPs in the intestine is far less understood. CYPs 3A4, 3A5, and 2C9 are the predominant intestinal isoforms, accounting for approximately 80% (3As) and 15% (2C9) of the total, respectively, with the remainder comprising CYPs 1A1, 1A2, 2C19, 2J2, and 2D6 (Paine et al., 2006). CYP3A expression declines from the proximal to distal intestine, with 75% occurring in the duodenum and jejunum (Paine et al., 1997). In the intestine, like in the liver, CYP3A4 is the predominant CYP3A isoform, and CYP3A5 is polymorphically expressed in 20% to 70% of adults (Paine et al., 1997). In otherwise histologically normal duodenal biopsies from a population of 74 children, CYP3A4 protein expression increased steadily with age (Fig. 7-7) (Johnson and Thomson, 2008). In fetal duodenum it was essentially absent, and in neonates it was expressed at about half the level seen in mature children. Intestinal CYP3A enzyme activity followed the same pattern as enzyme expression (Johnson and Thomson, 2008).
Other phase I enzymes are important in drug metabolism. Ester hydrolysis is a ubiquitous reaction catalyzed by a diverse array of esterases in blood and tissue. Esterase activity is important in the hydrolysis of remifentanil to an inactive metabolite, resulting in termination of clinical effect. Remifentanil is hydrolyzed by nonspecific esterases in plasma and (more so) tissue, but not by plasma cholinesterase (Manullang and Egan, 1999). In contrast, and unlike most ester drugs, red-cell rather than plasma esterases metabolize esmolol. Whereas CYPs mostly mature in the first months to year of life, esterase activity in neonates is already at levels nearly equivalent to those in adults (Allegaert et al., 2008). For example, remifentanil clearance in children from the ages of 1 month to 9 years old resembles that in adults (Sumpter and Anderson, 2009).
Phase II drug-metabolizing enzymes include glucuronosyltransferases (UGTs), sulfotransferases (SULTs), acetyltransferases, and glutathione transferases, all catalyzing conjugation reactions with multiple isoforms of each enzyme, often with isoform-dependent ontogeny (Blake et al., 2005; Hines, 2008). The two main UGT families are UGT1 and UGT2. UGT1A1, the major enzyme responsible for bilirubin conjugation, is not detectable in fetal liver, increases immediately after birth, and reaches adult levels by 3 to 6 months of age. UGT2B7 is of particular interest, because it conjugates morphine. UGT2B7 activity in fetal liver is present at 10% to 20% of adult values and increases in neonates to reach adult values by 2 to 3 months after birth. Morphine clearance is very low in premature infants and increases substantially over the first year of life. SULT ontogeny is isoform-specific, with SULT1E1 activity highest in the fetus and declining thereafter, SULT2A1 activity is barely detectable in neonates and increases in neonates, whereas SULT1A1 activity is constant from fetal age to adulthood.
Elimination
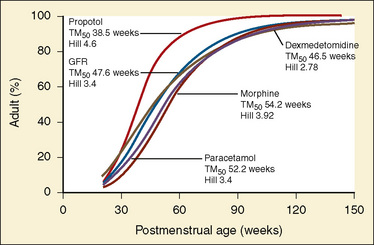
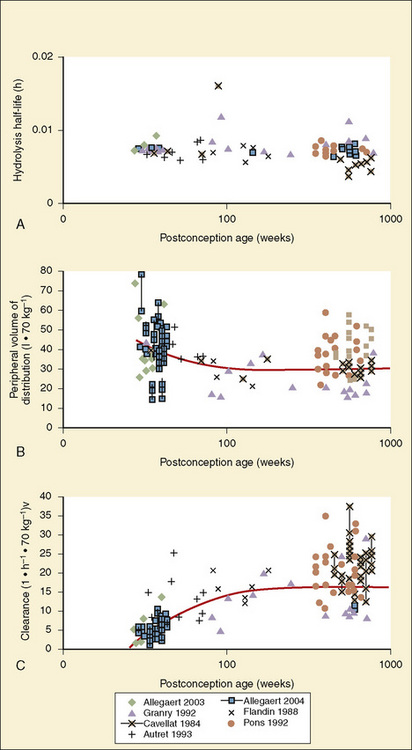
Elimination refers to all processes that remove a drug from the body, including drug metabolism (biotransformation) and excretion. Returning to the concept of drug elimination in general, it is now appreciated that several elements affect the development of drug elimination from fetus to adult, including patient size, organ maturation, organ function, and coexisting disease. Developmental patterns of drug clearance are shown for several drugs in Figure 7-8. For drugs in which renal elimination largely determines systemic clearance, the age-dependence of such clearance approximates that of GFR. In contrast, when hepatic metabolism predominates, the pattern differs.
The complexity of developmental pharmacokinetics can be appreciated using a drug such as propacetamol. Propacetamol is an N, N-diethylglycine ester prodrug of acetaminophen (paracetamol), which is hydrolyzed by plasma esterases after intravenous administration to the active metabolite acetaminophen. Acetaminophen in turn undergoes both phase I, and more so phase II metabolism, to glucuronic acid, sulfate, cysteine, and glutathione conjugates. Figure 7-9 shows the developmental aspects of propacetamol pharmacokinetics (Anderson et al., 2005). Consistent with the relative age invariance of esterase expression, ester hydrolysis to the active metabolite, acetaminophen, was also age invariant. The central compartment volume of distribution was also age invariant, whereas the peripheral compartment volume was somewhat decreased in neonates. Clearance increased markedly with age in the first year, from 12% of adult values at 27 weeks’ PCA to 84% of its mature value by 1 year. Importantly, PCA was more important than PNA, as described above.
Scaling Pediatric Dosing
Ideal clinical practice would be informed by age-specific clinical pharmacokinetic data for every drug used in children. As this remains an unattained ideal, considerable effort has been expended to establish pharmacokinetic models to predict age-dependent dosing based on adult data (Anderson and Holford, 2008; Johnson, 2008 Tod et al., 2008; Sumpter and Anderson, 2009). Several principles are now apparent, some of which have been described previously in this chapter. Loading doses depend on concentration and central volume of distribution. For central volumes, allometric modeling (p. 195) suggests that the volume of distribution scales with a power of 1, such that

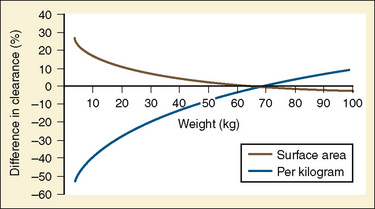
Figure 7-10 compares the accuracy of the linear per-kilogram, the body-surface area, and the allometric three-fourths power models.
Clearance, however, depends on not just growth (size), but also on maturation of organ clearance processes (i.e., PCA). It is also influenced by concomitant diseases and potentially by drug interactions, which can influence organ function. While allometry alone provides reasonable estimates of clearance in older children using adult data, it alone is insufficient to predict clearance in infants and young children (Sumpter and Anderson, 2009). Therefore, the most parsimonious model for prediction drug clearance is as follows:
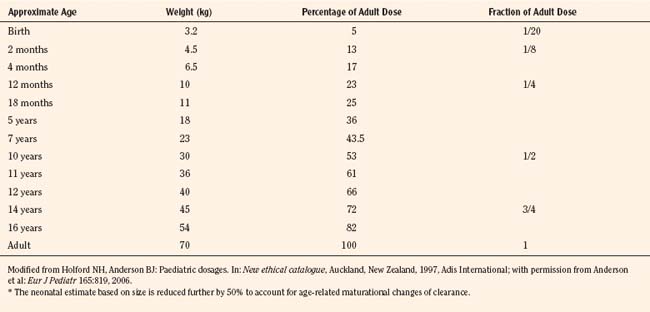
For practical purposes, size models have been simplified for clinical use. This is also influenced by regulatory considerations, which sort children into the categories of neonates (younger than 1 month), infants (1 month to 2 years), children (2 to 12 years), and adolescents (12 to 18 years). Table 7-5 presents age-specific dose adjustments. An even simpler method suggests 1 month, 1 year, 7 years, and 12 years, respectively for doses that are one eighth, one fourth, one half, and three fourths of the adult doses (Anderson and Holford, 2008). It is important to remember that these dose adjustments are for drug disposition only, and they do not take into account any age-dependent differences in pharmacodynamic response.
Pharmacodynamics
True age-related pharmacodynamic changes may be qualitative or quantitative, and they may apply to both therapeutic and adverse effects (Stephenson, 2005). One example of quantitative differences in therapeutic response is the effect of warfarin in prepubertal, pubertal, and adult patients. Despite equivalent plasma drug concentrations, warfarin effects on prothrombin fragments 1 and 2 and on the international normalized ratio (INR) were higher in prepubertal patients than in adults. Similarly, augmented response was observed with cyclosporine, in which peripheral blood monocytes from infants had twofold lower proliferation and sevenfold lower interleukin-2 expression compared with older subjects. Examples of age-dependent adverse effects occurring only in children include chloramphenicol toxicity (“gray baby syndrome”), limb deformation from thalidomide during embryogenesis, tetracycline staining of dental enamel, and valproic acid hepatotoxicity, which is increased in young children. Generalized factors leading to age-dependent drug responses include physiology, pathology, host response to disease, and adverse drug reactions, as well as pharmacodynamics (Stephenson, 2005).
For drugs used in anesthesia, the best information on developmental pharmacodynamics has been obtained for inhaled anesthetics, and to a lesser extent, certain intravenous anesthetics. The potency of inhaled anesthetics is significantly affected by developmental age. The principal metric of inhaled anesthetic potency (the median effective concentration, or EC50), has been called the minimum alveolar concentration (MAC) and defined as the “minimum alveolar concentration of anesthetic at 1 atmosphere that produces immobility in 50% of those patients or animals exposed to a noxious stimulus,” where the stimulus is usually an incision (Mapleson, 1996). Other endpoints have been analogously defined, such as MACAWAKE endpoint, which defines loss (or return) of consciousness. The quantal EC50 of all inhaled anesthetics is similarly influenced by age, with a common log-linear negative slope (for age older than 1 year) (Mapleson, 1996). For decreasing ages younger than 40 years, EC50 (MAC) increases 6% per decade. Thus, the MAC for sevoflurane is conceptually 20% greater at age 10 and 27% greater at age 1 (i.e., 2.16% and 2.29% at ages 10 and 1, respectively, for a MAC of 1.8% at age 40 (Mapleson, 1996). A clinical study found the MAC of sevoflurane to be 2.5% in children between 1 and 12 years old and 3.2% in infants 6 to 12 months old, compared with 2% at age 40 (Lerman et al., 1994; Mapleson, 1996). The MACAWAKE endpoint for sevoflurane was 0.43%, 0.45%, and 0.66% in children 8 to 12 years old, 5 to younger than 8 years, and 2 to younger than 5 years, respectively (Davidson et al., 2008c). The ratio between the MACAWAKE endpoint and MAC did not differ with age.
Measures of the age-dependent change in apparent anesthetic potency may be influenced by the clinical drug effect used as the index of response. For example, various electroencephalogram (EEG)-derived parameters (e.g., spectral edge frequency, bispectrum, and bispectral index [BIS]) have been used to measure volatile anesthetic effects in children (Wodey et al., 2005; Tirel et al., 2006; Davidson et al., 2008b). Although there were age-dependent effects of volatile anesthetics on various EEG parameters, the EEG itself was found to be highly age-dependent. Specifically, EEG was fundamentally different in infants between 0 and 6 months old, and caution was suggested in the use of BIS to determine volatile anesthetic pharmacodynamics in children (Wodey et al., 2005; Davidson et al., 2008b). Similar results were obtained when EEG-derived parameters were used to evaluate age and propofol effects, and EEG results in children younger than 1 year old were considered inaccurate (Jeleazcov et al., 2007).
Compared with inhaled anesthetics, much less is known about developmental aspects of intravenous drug pharmacodynamics. In part, this reflects the ease, lack of expense, ubiquity, and real-time availability of measuring end-tidal inhaled anesthetic concentrations, compared with measuring plasma concentrations of intravenous anesthetics. Limited data are available for propofol, which suggests slightly lower sensitivity (diminished potency) in children. Plasma propofol concentration-effect (BIS) curves analyzed in children (mean age of 10 years, range of 6 to 13 years) and adults (mean age of 18 years, range of 14 to 32 years) found graded EC50 means values of 4 vs. 3.3 mcg/mL, respectively. When propofol infusions were targeted to maintain a steady-state BIS of 50, measured mean plasma concentrations were 4.3 ± 1.1 and 3.4 ± 1.2 mcg/mL, respectively (Rigouzzo et al., 2008). Somewhat lower propofol potency was also reported by others (Jeleazcov et al., 2008). In contrast, one study found no difference in propofol EC50 in adults and children, however, predicted rather than measured plasma concentrations were used in the analysis, which is a limitation of such studies (Munoz et al., 2006). Increased propofol EC50 in children is consistent with diminished EC50 in older adults (Schnider et al., 1999). No data are available regarding propofol pharmacodynamics in neonates.
Nonlinear Pharmacokinetics
The nonlinear pharmacokinetics may also be seen in low-clearance drugs for which elimination is significantly influenced by the binding of the drug to plasma proteins. In this scenario, after increasing the dose of the drug, a less-than-expected increase in Css and AUC occurs. This would suggest that the plasma protein-binding sites have been saturated and that the free fraction of low-clearance drug has increased. The latter would result with increased clearance and a less-than-expected increase Css occurs. However, if measured, the free fraction of the low-clearance drug increases proportionally. Both valproic acid and disopyramide follow this type of nonlinear pharmacokinetics (Bowdle et al., 1980; Lima et al., 1991).
Compartment Models

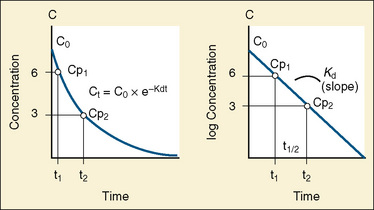
The elimination rate constant (Kd) can be also thought of as the fraction of the volume of distribution that is effectively cleared of drug per unit of time. Because the drug plasma concentration diminishes monoexponentially, a graph plot of the logarithm of the plasma concentrations vs. time yields a straight line. The elimination rate constant defines the slope of this curve, and two plasma concentrations measured during the decay or elimination phase can be used to calculate the Kd (Fig. 7-11):


The half-life is a variable that determines the following factors:
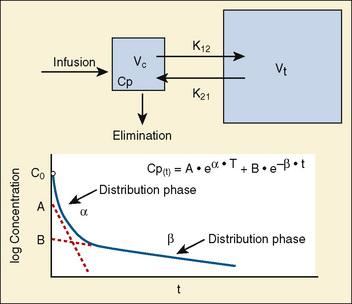
Most of the drugs used in anesthesia do not follow the simple, one-compartment pharmacokinetics but rather behave like a two- or even three-compartment model. Distribution of anesthetic drugs into and out of peripheral tissues determines the pharmacokinetic profile and the time course of the anesthetic drug’s effect. For the two-compartment model, the central compartment includes the blood and organs or tissues that have high blood flow and can be thought of as a rapidly equilibrating volume. The second compartment has a volume (Vt) that equilibrates at a much slower pace. After bolus administration of a drug that follows the two-compartment model, the two distinct phases of distribution and terminal elimination can be distinguished, and the decay of plasma concentration over time is defined by the biexponential equation (Fig. 7-13). Changes in plasma and the site-of-action concentrations would depend on drug elimination and on the equilibrium between central and peripheral tissue compartments.
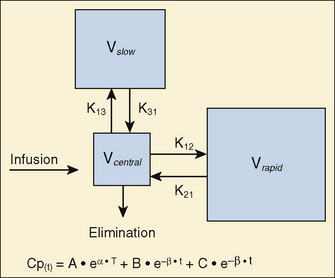
For many anesthetic drugs, three phases can be distinguished after intravenous bolus administration. This three-compartment model is composed of the central compartment and two additional compartments that include the respective rapid and slow equilibrating tissues and organs (Fig. 7-14). Likewise, the three-compartment model is characterized by the triexponential plasma concentration equation, three volumes of distribution, and five rate constants of distribution and terminal elimination (K12, K21, K13, K31, and K10).
Context-Sensitive Half-Time
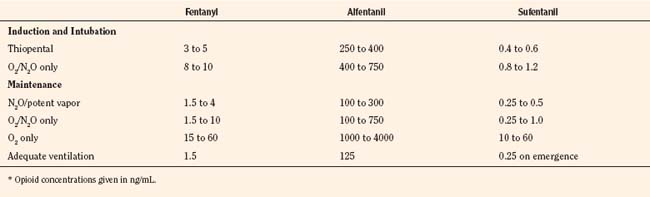
For the anesthesiologist, pharmacokinetic factors are often used for the routine selection and use of various intravenous anesthetic agents. Drugs with short elimination half-lives are commonly selected for brief procedures, whereas drugs with longer half-lives are selected for lengthier procedures. Drugs with small volumes of distribution tend to decrease the time required for recovery after intravenous infusion, and agents with decreased plasma clearances may increase the time for recovery. In general, formulas for the calculation of continuous infusions incorporate knowledge of these pharmacokinetics. For bolus administration of drug, the volume of distribution and the desired plasma concentration are needed. Table 7-6 lists plasma concentrations in adults for some of the opioids. The bolus dose is calculated as the product of the volume of distribution and the desired plasma concentration (Cp):
TABLE 7-6 Opioid Concentrations that Ablate Responsiveness to Intraoperative Noxious Stimuli and Permit Adequate Ventilation on Emergence*


Although these formulas work well, Shafer and Varvel (1991) and Hughes et al. (1992) have demonstrated the complex interactions that occur with prolonged infusions, especially in drugs that are lipid soluble.
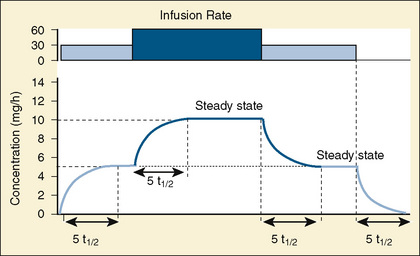
The offset of drug effect depends on reduction of the plasma concentrations and the withdrawal of drug from the site of action; that is, for anesthetic from the receptor site in the CNS. If steady state is achieved and all compartments are saturated, then the half-life of elimination phase, which is a function of the first-order processes of elimination, correlates with a decrease in the site-of-action drug concentrations and with the offset of drug action. However, after infusion of a highly lipophilic anesthetic agent, when steady state is not achieved and not all compartments are saturated, the decline in concentrations (i.e., the offset of action and recovery from anesthesia) depends on complex interactions between the duration of the infusion and initial distribution, redistribution, and metabolic and elimination first-order processes. The classic descriptors of a drug’s pharmacokinetics and offset of action (terminal half-time) are of little help to anesthesiologists in predicting the offset of action and recovery from anesthesia for the intravenous anesthetic drugs. Fortunately, with the help of pharmacokinetic and pharmacodynamic simulation models, new predictors of offset of drug effects have evolved (Shafer and Varvel, 1991; Hughes et al., 1992; Youngs and Shafer, 1994).
Using pharmacokinetic and pharmacodynamic models and basic pharmacokinetic profiles of commonly used synthetic opioid analogs, Shafer and Varvel (1991) were the first to construct the offset of action (recovery) curves as a function of the duration of infusion for fentanyl, alfentanil, and sufentanil (Fig. 7-15). Hughes et al. (1992) introduced the term context- sensitive half-time (context refers to the duration of infusion) as a time required for a drug concentration to decrease to half of its value after drug infusion of a given duration. Of importance is that for any given drug, its context-sensitive half-time varies with the duration of the drug infusion. Because for most intravenous anesthetic drugs the 50% fall in concentration is not sufficient for recovery from anesthesia, other decrement times have been introduced (Youngs and Shafer, 1994), for example, 80% and 90% decrements.
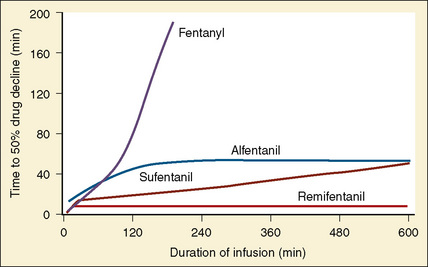
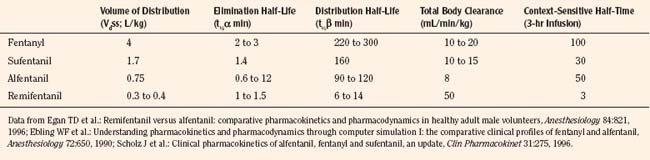
After a short intravenous infusion (0 to 15 minutes), fentanyl and other synthetic opioid analogs have similar context-sensitive half-times (Fig. 7-15). However, after prolonged infusion (longer than 1 hour), there is a marked difference among four synthetic opioid analogs (fentanyl, sufentanil, alfentanil, and remifentanil), and these differences do not correlate with their classic pharmacokinetic parameters (Table 7-7). In contrast to its older congeners, remifentanil has a short and steady context-sensitive half-life of 3 minutes, which does not change with the increasing duration of infusion (Egan et al., 1996). This contrasts with alfentanil, which has a context-sensitive half-time that increases to 1 hour after a 4-hour infusion (Ebling et al., 1990; Scholz et al., 1996). This difference is because of the unique pharmacokinetic profile of remifentanil. It is a highly liposoluble (volume of distribution at steady state [Vdss] of 30 L) opioid analog that undergoes widespread metabolism (deesterification), including metabolism in the circulation. Unlike other opioids, the termination of action of remifentanil does not depend on redistribution but rather on extremely rapid metabolic clearance. Kapila et al. (1995) demonstrated that the context-sensitive half-times of remifentanil (3 minutes) and alfentanil (50 to 55 minutes) derived from computer modeling are similar to measured context-sensitive half-times (3.2 and 47 minutes for remifentanil and alfentanil, respectively), and both correlate with measured pharmacodynamic offset (recovery of minute ventilation). The latter confirms the value and clinical applicability of this new pharmacokinetic-pharmacodynamic parameter in predicting the offset of anesthetic drugs.
TABLE 7-7 Pharmacokinetic Parameters of Synthetic Opioids after Single Intravenous Bolus Administration
The context-sensitive half-time curves provide a better, clinically more relevant comparison of the pharmacokinetic profiles of anesthetic drugs than the traditional pharmacokinetic parameters (Fig. 7-16). After a single intravenous dose, commonly used anesthetic and hypnotic drugs have a short duration of action. However, after prolonged infusions the context-sensitive half-times and duration of action increase. For some drugs (e.g., propofol and ketamine), this increase is modest, whereas for others (e.g., diazepam and thiopental), it is quite dramatic. In the case of midazolam, the rapid increase in its context-sensitive half-time with prolonged duration of infusion occurs in the presence of a relatively short elimination half-life (t½β), and this is most likely because of the low clearance of midazolam.
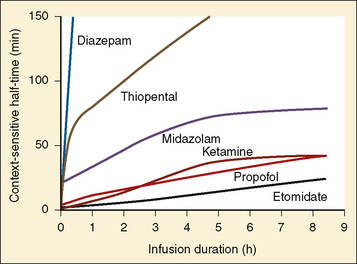
FIGURE 7-16 Context-sensitive half-time for commonly used general anesthetics.
(From Reves JG et al.: Nonbarbiturate intravenous anesthetics. In Miller RD, editor: Anesthesia, ed 5, New York, 2000, Churchill Livingstone.)
The data regarding the context-sensitive half-times and other decrement times of anesthetic agents in the pediatric population are limited, at best. In children aged 3 to 11 years, longer context-sensitive half-times than in adults were reported for propofol. After a 1-hour infusion in children and adults, the context-sensitive half-times for propofol are 10.4 and 6.6 minutes, respectively, and after a 4-hour infusion, they are 19.6 and 9.5 minutes, respectively (McFarlan et al., 1999). This is probably due to the altered compartment volumes and may lead to slower recovery from a propofol infusion in children than in adults (Short et al., 1994). In contrast, the shorter context-sensitive half-time of fentanyl was determined in pediatric population (2 to 11 years old) compared with published data in adults (Ginsberg et al., 1996).
Population Pharmacokinetics
Pharmacokinetics and pharmacodynamics of drugs in the pediatric population and in adults are different. Furthermore, neonates, infants, children, and adolescents have distinct differences in physiologic development, and the pediatric population is quite heterogeneous with regard to pharmacokinetics and pharmacodynamics of drugs across different age groups. These differences justify studying pharmacokinetics and pharmacodynamics in children of various ages. However, the testing of medications in children presents a dilemma: while society wants to spare children from the potential risk involved in research, children may be harmed if they are given medications that have been inadequately studied (Steinbrook, 2002).
PPK is an area of clinical pharmacology that studies the sources and the correlates of variability in drug-plasma concentration parameters among individuals in the target population of patients who are receiving clinically effective doses of a drug (Shen and Lu, 2007). PPK is focused on the quantitative assessment of the typical pharmacokinetic parameters, as well as the within- and between-individual and residual variability in drug absorption, distribution, metabolism, and excretion (Steiner, 1992; Ette and Williams, 2004). The population approaches use mathematic and statistic modeling to investigate the dose-concentration-effect relationship and to quantitatively and qualitatively assess factors that may explain interindividual variability (Sheiner et al., 1979). In the early 1980s, Sheiner and Beal introduced the new PPK data analysis approach (i.e., the population approach) and demonstrated that estimates of PPK parameters could be obtained even if only two or three samples are collected per patient (Sheiner and Beal, 1980, 1981, 1982). They also introduced a new software program (the Nonlinear Mixed Effects Model, or NONMEM) that was capable of performing the new type of analysis, and this is now the most commonly used population modeling program (Sheiner and Beal, 1980; Sheiner et al., 1979).
The PPK approach allows not only major contributions to variability of key pharmacokinetic parameters to be established, but it also goes one step further and allows the relative contributions of different factors to be determined. In this regard, size, age, and renal function are major contributors to vancomycin clearance variability in neonates. Using the PPK and NONMEM modeling, Anderson and colleagues (2002a) have shown that size explains 49.8%, age accounts for 18.2%, and renal function explains 14.1% of clearance variability of vancomycin in neonates. The small unexplained percentage (18%) is residual variability in clearance and suggests that target concentration intervention is unnecessary if size, age, and renal function are used to predict the dose (Anderson et al., 2002a).
Body Size and Maturation Adjustments
In adults, to account for impact of body size, pharmacokinetic parameters are traditionally adjusted to body weight or body surface area. However, these empirical approaches, although appropriate when adjusting for dose, clearance, or volume of distribution in adults, may be inappropriate for scaling small children to adults (Holford, 1996). The body-weight adjustments may underpredict clearance, whereas the body surface area model may overpredict clearance in children (and the error increases with decreasing weight) (Mitchell et al., 1971; Holford, 1996; Anderson et al., 2006). Measurement of body surface area, which can be calculated from height and weight by DuBois formula:
where BSA represents body surface area, W is weight, and H is height. It may also be calculated by using several very similar formulas; however, all formulas may be inaccurate, especially in younger pediatric patients (Holford, 1996; Anderson et al., 2006). Infants are not morphologically similar to adults (they have short legs, relatively big heads, and large body trunks), and direct photometric measurement has been suggested to be an inaccurate prediction of body surface area in children younger than 12 years old, or BSA greater than 1.3 m2 (Mitchell et al., 1971).
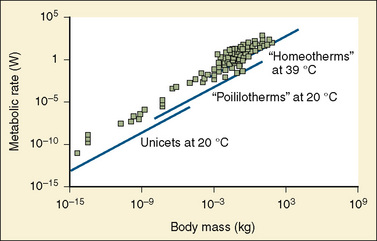
A method for body-size adjustment that has begun to be used regularly in PPK studies in children is allometric size adjustment. Allometry is a methodology used to relate morphology and body function to the size of an organism. This methodology had found wide application in drug development to predict pharmacokinetic parameters in humans based on data from different animal species. Gillooly and colleagues (2001) have shown that in almost all species, including humans, when the log of the basal metabolic rate is plotted against the log of body weight, a straight line with a slope of 0.75 is produced (Fig. 7-17).

The allometric “0.25 power” model can be used to predict the pharmacokinetic estimates in children with PWRs of 0.75, 0.25, and 1 for clearance, half-life, and volume of distribution, respectively (West et al., 1997, 1999; Anderson et al., 2006). Using the fixed power exponent allows investigators to delineate secondary covariate effects from the effects of size. The allometric scaling also allows direct comparison of pediatric and adult pharmacokinetic estimates and can be used to predict the pediatric dose based on the adult dose (Table 7-5).
Age is used as a covariate to describe the maturation process in the pediatric population. Several quantitative models that describe the maturation of clearance have been developed, and they vary depending on age group studied (Allegaert et al., 2006; Anderson et al., 2000). Rhodin and colleagues (2009) have studied the effects of size and maturation on GFR in 923 individuals from eight studies, from 22 weeks’ PMA to 31 years of age. They demonstrated that PMA is a better descriptor of maturation changes than PNA and that a sigmoid hyperbolic model describes the nonlinear relationship between GFR and PMA. Half of the adult values are reached at 48 weeks PMA, and at 1 year PNA the predicted GFR is 90% of the adult GFR (Rhodin et al., 2009).
Neurotoxicity
One of the most active areas of investigation in the past several years involves the potentially toxic effects of sedative and anesthetic agents on the developing nervous system. Newborn animal model studies have reported apoptosis in multiple areas in the CNS during the period of rapid synaptogenesis, when exposure to agents that work via N-methyl-d-aspartate (NMDA) antagonists or γ-aminobutyric acid (GABA) agonist pathways occurs (Ikonomidu, 1999; Jevtovic-Todorovic et al., 2003; Mellon et al., 2007). Although this effect was originally shown in newborn rodent models, recent work has demonstrated the same histologic changes in nonhuman primates (Wang and Slikker, 2008). Ketamine, isoflurane, and sevoflurane have all been shown to produce apoptosis in the brains of developing rodents in a dose-dependent manner (Ikonomidu et al., 1999; Jevtovic-Todorovic et al., 2003; Fredriksson et al., 2007; Loepke et al., 2009; Satomoto et al., 2009; Stratmann et al., 2009). Apoptosis has also been demonstrated in the spinal cord (Sanders et al., 2008). The period of vulnerability is thought to coincide with the period of synaptogenesis, which is at about day 7 in rats and from late pregnancy through early toddlerhood in humans. Concern and interest increased with the demonstration of long-term learning deficits at early maturity in rats when they were exposed to an “anesthetic cocktail” of midazolam, nitrous oxide, and isoflurane for 6 hours on postnatal day 7 (Jevtovic-Todorovic et al., 2003). Combinations of nitrous oxide, midazolam, and isoflurane may cause more apoptosis than single agents (Jevtovic-Todorovic et al., 2003; Fredriksson et al., 2007). In monkeys, ketamine produced apoptosis when given for 24 hours in late gestation or to 5-day-old monkeys but not to 30-day-old monkeys (Slikker et al., 2007). Also a shorter administration period of ketamine did not produce apoptosis in 5-day-old monkeys. There is mixed evidence for long-term measurable changes in cognitive function or behavior in rodents exposed to anesthesia in the neonatal period (Jevtovic-Todorovic et al., 2003; Fredriksson et al., 2007; Loepke et al., 2009; Stratmann et al., 2009). No data have been presented that examine long-term effects in primates. The application of these findings to human neonates and infants has many unknown elements, including the window of vulnerability, the duration of exposure, and the dose of agent necessary to affect long-term neurodevelopment. The mechanism that triggers apoptosis is not clear, but there is some evidence that apoptosis may be triggered as a result of decreased release of trophic factors from the axon (Head et al., 2009). The possibility that GABA receptors may be involved is complicated by the observation that the morphology of GABA receptors changes during this period, as do their downstream actions, and that the addition of a GABA agonist does not completely reverse the apoptotic effect of GABA antagonists. In addition to apoptosis, there is also increasing evidence that anesthetics can cause a change in dendritic morphology. This may also be to the result of anesthesia causing relative inactivity of neurons and a decrease in relevant trophic factors. A series of articles in Anesthesia & Analgesia in June 2008 presented the data and controversies well. Editorials in Anesthesiology in November 2008 through January 2009 presented several approaches to investigating the presence and extent of such a neurotoxic effect in human infants and young children who are exposed to anesthetic agents (Cattano et al., 2008; Davidson et al., 2008a; Jevtovic-Todorovic et al., 2008; Loepke et al., 2008; Loepke and Soriano, 2008; McGowen and Davis, 2008; Sanders et al., 2008; Sun et al., 2008, Wang and Slikker, 2008; Hansen and Flick, 2009). Great efforts will be ongoing in the near future to further delineate the mechanisms, to investigate the extent of the problem in humans, and to study possible therapeutic options to minimize such toxicity. An FDA advisory panel held in April 2007 concluded “there was no scientific basis to recommend changes in clinical practice” with the current data (the meeting transcript can be found at www.fda.gov/ohrms/dockets/ac/2007-4285t1.pdf).
Intravenous agents
Sedative Hypnotics and Barbiturates
On a milligram-per-kilogram basis, barbiturates are more lethal to newborns than to more mature animals (Carmichael, 1947; Weatherall, 1960; Goldenthal, 1971). The sleeping times of newborn animals are markedly prolonged at sublethal doses given on an equal milligram-per-kilogram basis (Weatherall, 1960). Greater penetration of the blood-brain barrier by barbiturates has been found in neonates compared with older animals (Domek et al., 1960).
Neonates have a decreased ability to metabolize barbiturates (Mirkin, 1975). The longer-acting barbiturates, which are in part excreted unmetabolized in the urine, would be expected to have prolonged or elevated blood levels (Knauer et al., 1973; Boreus et al., 1975). Glucuronic acid conjugation of barbiturates develops rapidly and increases 30-fold during the first 3 weeks of life (Brown et al., 1958).
Short-acting barbiturates (e.g., methohexital, thiamylal, and thiopental) can be used to induce anesthesia in infants and children. These agents produce rapid induction of hypnosis with minimal relaxation or analgesia. The pharmacokinetics of short-acting barbiturates in infants, children, and adults were studied extensively by Brodie (1952), Dundee and Barron (1962), Mark (1963), Saidman and Eger (1966), and Lindsay and Shepherd (1969). Because of the child’s proportionately greater amount of vessel-rich tissue, the uptake of short-acting barbiturates should be more rapid; the effect more quickly achieved; and metabolism, excretion, and recovery more prompt unless retarded by supplementary agents (Eger, 1974). These agents are used less commonly now than in the past in many centers where other short-acting sedatives have supplanted the short-acting barbiturates.
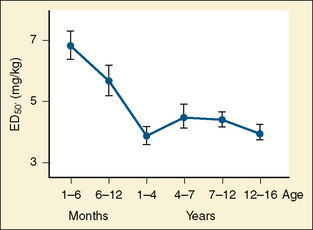
Thiopental
Thiopental is an ultra short-acting barbiturate used as an intravenous induction agent in anesthesia. It has been also used in critical care settings as a continuous infusion for the treatment of intracranial hypertension and status epilepticus. Hiccoughs, sneezing, and other respiratory irregularities are rarely seen on induction, and there is no excitement or extrapyramidal activity associated with its use. It decreases cerebrospinal fluid pressure, making it useful for diagnostic and operative neurologic procedures (Dawson et al., 1971). Intraocular pressure also is decreased. Awakening is quiet, occasionally interrupted by shivering, and associated with a low incidence of nausea (Smith et al., 1955). Porphyria, seldom encountered in the United States, is a specific contraindication to barbiturates (Dundee and Barron, 1962). Thiopental requirements for induction of anesthesia reveal an inverse relation with age. Jonmarker et al. (1987) reported that the ED50 of thiopental in infants is significantly greater (7 mg/kg) than that in adults (4 mg/kg) (Fig. 7-18). Westrin et al. (1989) determined the dose of thiopental needed for satisfactory induction of 10 healthy, unpremedicated neonates who were 0 to 14 days old and 20 infants who were between 1 and 6 months old. In this study, the ED50 for thiopental induction was 3.4 ± 0.2 mg/kg in neonates and 6.3 ± 0.7 mg/kg in infants aged 1 to 6 months. In an in-vitro study in which the free fraction of thiopental was measured in the serum of neonates and adult volunteers, Kingston et al. (1990) noted that neonates had a free drug fraction that was 1.5 to two times greater than that of adults. The increased free fraction of thiopental may explain the decreased induction dose required by the neonate. Sorbo et al. (1984) studied the pharmacokinetics of thiopental in 24 surgical patients aged 5 months to 13 years. The volume of distribution of the central compartment ranged from 0.3 to 0.4 L/kg. The steady-state volume of distribution was approximately 2 L/kg and did not differ statistically from values previously measured in adults. The elimination half-time and clearance of thiopental in these infants and children were 6.1 ± 3.3 hours and 6.6 ± 2.2 mL/kg per minute, respectively. These values were significantly different from the values of 12 ± 6 hours and 3.1 ± 0.5 mL/kg per minute, respectively, observed in adults. After a single intravenous dose, clinical effect is mainly terminated by redistribution. When repetitive or larger doses are used, redistribution becomes less effective and metabolism plays a more important role, explaining the shorter recovery times in children when compared with adults.
Methohexital
Methohexital, a methylated oxybarbiturate, is more potent than thiopental by a ratio of about 3:1, is more rapidly eliminated, and produces more undesirable side effects (Clarke et al., 1968). Greater speed of recovery provides its principal indication, especially for outpatient care or for situations where very brief effect is wanted, such as for cardioversion or electroconvulsive therapy. The incidence of involuntary muscular movement, hiccoughs, and respiratory irregularity during induction is definitely greater with methohexital than with thiopental. Although methohexital has been used via the intramuscular or rectal route without tissue damage, some studies suggest that the high concentration of rectal methohexital can cause mucosal damage (Miller et al., 1961). Administration of 10% methohexital to rats via the rectal route produces minor, self-limited lesions in the rectal mucosa (Hinkle and Weinlander, 1989). The recommended dose for intravenous use is 1 to 2 mg/kg, and in children younger than 5 years, 25 to 30 mg/kg can be administered rectally.
In a study of 85 children, Khalil et al. (1990) compared 25 mg/kg of rectal methohexital in a 10% and a 1% concentration. In this study, 1% was associated with a better success rate, faster onset time, high plasma concentration, and longer recovery time than the 10% concentration. In addition, they noted that the length of the rectal catheter had no effect on the pharmacodynamics of the drug. A 10% solution of methohexital at a dose of 25 mg/kg usually produced sleep in 6 to 10 minutes, which coincided with peak serum levels (Goresky and Steward, 1979; Letty et al., 1985).
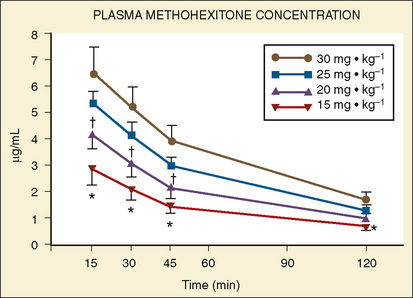
Forbes et al. (1989a) reported on the plasma concentrations of 60 children after doses of 15, 20, 25, or 30 mg/kg of rectal methohexital (Fig. 7-19). The dose of 30 mg/kg resulted in significantly higher plasma concentrations for up to 20 minutes. In addition, in a separate study of 12 patients who were premedicated with 25 mg/kg of 2% rectal methohexital, Forbes et al. (1989b), using pulsed Doppler and two-dimensional echocardiography, noted a significant increase in heart rate but no change in cardiac index, stroke volume, ejection fraction, or blood pressure.
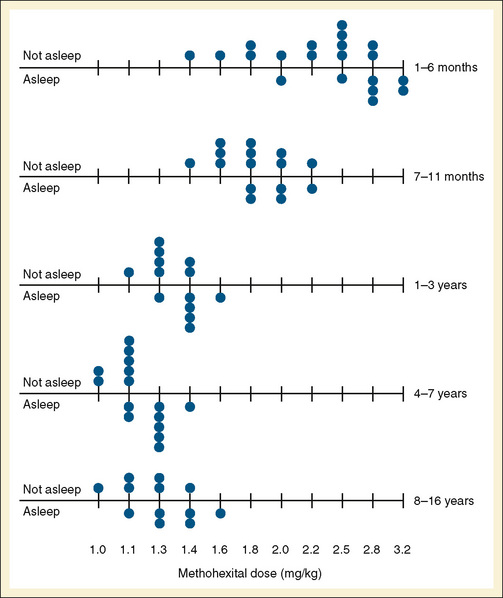
Audenaert et al. (1995) prospectively reviewed the effects of rectal methohexital in 648 patients. They noted that after a 30 mg/kg dose of 10% methohexital, children fell asleep 85% of the time. Sleep usually occurred in 6 minutes. Sleep was less likely to occur in patients with myelomeningocele or in patients receiving phenobarbital or phenytoin therapy. Side effects of defecation after administration occurred in 10% of patients, and hiccoughs occurred in 13% (Audenaert et al., 1995). The intravenous dose for induction using methohexital dissolved in a lipid emulsion was determined by Westrin (1992), who noted that the dose (adjusted by body weight) needed for induction in infants younger than 5 months was almost twice that for older children (Fig. 7-20).
Beskow et al. (1995) compared intravenous induction of methohexital (3 mg/kg) and thiopental (7.3 mg/kg) in 41 infants aged 1 month to 1 year. In this study of short surgical procedures, recovery as measured by spontaneous eye opening after methohexital was significantly shorter than it was for thiopental.
Benzodiazepines and Antagonists
Diazepam
Diazepam produces relatively pleasant sedation or hypnosis with few side effects and prompt recovery. Its action is caused by depression of the amygdala of the limbic system and spinal internuncial neurons. It is a specific treatment of seizure disorders in children (Lombroso, 1966; Carter and Gold, 1977). Intravenous administration of 0.2 to 0.3 mg/kg usually induces hypnosis, but the requirement varies widely. Diazepam appears to cause less cardiac depression than do barbiturates (Muenster et al., 1967; Abel and Reis, 1971).
Diazepam is metabolized by the CYP-linked monooxygenase system. In adults, the metabolite, desmethyldiazepam, is eliminated more slowly (t½ = 150 hours) than the parent compound (t½ = 20 to 30 hours) (Meberg et al., 1978).
The plasma half-life of diazepam and the nature of the diazepam metabolites formed vary with maturity (Morselli et al., 1974). The premature infant and the mature infant at term eliminate diazepam at a slower rate than older infants, children, and adults. In premature infants, a demethylated derivative of diazepam, N-desmethyldiazepam, could not be measured in plasma until 4 hours after injection, in comparison with older infants and children, in whom N-desmethyldiazepam was measured in the plasma by 1 hour and had peaked by 24 hours. In adults, 71% of diazepam or its metabolites was excreted in the urine, and about 10% was excreted in the feces. As an oral premedicant or intravenous induction agent, the recommended dose of diazepam is 0.1 to 0.2 mg/kg. The local pain on injection intravenously has decreased its current use, along with the availability of other short-acting benzodiazepines (e.g., midazolam).
Midazolam
Midazolam is metabolized in the liver; less than 1% is excreted unchanged in the urine. Midazolam undergoes extensive metabolism (involving CYP3A4, CYP3A5, and CYP3A7) to a major hydroxylated form, 1-OH-midazolam. The protein binding of midazolam is extensive, with a free fraction of only 3% to 6%. Midazolam has an intermediate rate of absorption (0.5 to 1.5 hours) and a bioavailability of 30% to 50%. The terminal elimination phase ranges from 1 to 4 hours (Smith et al., 1981).
In children, the pharmacokinetics of midazolam have been reported. Payne et al. (1989) noted that in healthy children, midazolam administered at 0.15 mg/kg intravenously, the volume of distribution at steady state, the elimination half-life, and the clearance were 1.29 L/kg, 70 minutes, and 9.1 mL/kg per minute, respectively. Jones et al. (1993) have also reported on the kinetics of intravenous midazolam (0.5 mg/kg) in 12 healthy children and noted that the kinetics were consistent with a three-compartment model with a volume of distribution of 1.9 L/kg, t½β of 107 minutes, and a clearance of 15.4 mL/kg per minute. However, because the drug exhibits dose-related changes in clearance, comparisons between studies become difficult (Salonen et al., 1987). The kinetics of midazolam have also been determined after intramuscular, rectal, and oral administration. Payne et al. (1989) noted that times for peak serum concentrations after intramuscular, rectal, and oral administration were 15, 30, and 53 minutes, respectively, whereas the drug clearance and bioavailability via these three different routes were 10.4, 50.8, and 33.4 mL/kg per minute and 87%, 18%, and 27%, respectively. The lower bioavailability after oral or rectal administration is consistent with the commonly used oral dose of 0.5 mg/kg, which is almost five times higher than intravenous dosing.
In a study involving pediatric patients aged 6 months to 16 years, Reed et al. (2001) characterized the pharmacokinetic profile of both oral and intravenous midazolam using noncompartmental models. After oral administration, midazolam absorption was rapid, with adolescents absorbing the drug at half the rate seen in children younger than 12 years old. In young children, the volumes of distribution were larger; the largest volume of distribution was observed in children, whereas adolescents had a slower clearance and longer half-life after intravenous administration. There was great variability between patients in oral bioavailability, which averaged 36% (with a range of 9% to 71%) and in metabolism. An oral dose of 0.2 to 0.3 mg/kg was suggested as adequate in most children for sedation. The authors emphasized the importance of titrating intravenous dosing in the individual patient (Reed et al., 2001).
The pharmacokinetics of rectally administered midazolam in children were reported by Saint-Maurice and colleagues (1986). In this study of 16 children who were administered midazolam at 0.3 mg/kg, the terminal half-life and clearance were 106 minutes and 42.5 mL/kg per minute, respectively. Differences in the plasma clearance rates between pharmacokinetic studies involving rectal, oral, and intramuscular forms of administration were probably related to changes in drug bioavailability. Decreases in bioavailability increase the apparent drug clearance.
Commercially prepared solutions for oral midazolam are available. Literature on the pharmacokinetics and pharmacodynamics of oral midazolam has been hindered by the fact that studies have used different vehicles for administering the drug. Different vehicles affect drug absorption and, consequently, onset time and drug bioavailability (Brosius and Bannister, 2003). In addition, concurrent antacid use and grapefruit juice may increase the onset time and drug bioavailability of midazolam (Goho, 2001; Lammers et al., 2002).
Population studies involving the pharmacokinetics of midazolam in neonates have been reported. Using NONMEM and a two-compartment model, 531 midazolam concentrations from 187 infants were analyzed. The clearance and the central volume were noted to be 70 ± 13 mL/kg per hour (or 1.02 mL/kg per minute) and 591 ± 65 mL/kg, respectively. Of interest was that the clearance was 1.6 times higher in full-term neonates with a gestational age of more than 39 weeks than in neonates of fewer than 39 weeks’ gestation (Burtin et al., 1994).
The pharmacokinetics of midazolam in premature infants after both oral and intravenous administration were described by de Wildt and colleagues (2001, 2002). In premature infants with 24 to 34 weeks’ gestational age and at 3 to 11 days of life, de Wildt et al. noted the apparent volume of distribution, clearance, and half-life were 1.1 L/kg, 1.8 mL/kg per minute, and 6.3 hours, respectively, after a single 0.1-mg/kg bolus dose. In addition, the metabolite 1-OH midazolam was markedly reduced compared with reports in older children. Also of note was that in those infants exposed to indomethacin, midazolam clearance was increased (Fig. 7-21) (de Wildt et al., 2001).
In a separate study of preterm infants who were administered oral midazolam, de Wildt et al. (2002) noted that midazolam clearance was markedly decreased and that the bioavailability was 0.4. The decrease in clearance was thought to mirror the pattern of CYP3A4 intestinal and hepatic activity (de Wildt et al., 2002). The kinetics of midazolam are affected by the use of extracorporeal membrane oxygenation (ECMO); Mulla et al. (2003) noted that the volume of distribution and half-life of midazolam are significantly increased in neonates requiring ECMO.
The cardiovascular and respiratory effects of midazolam have been reported in adults. Midazolam decreases systolic and diastolic blood pressures by 5% to 10%, decreases systemic vascular resistance by 15% to 30%, and increases heart rate by 20%. Right- and left-sided filling pressures are usually unaffected. Reeves et al. (1979) observed that 0.2 mg/kg midazolam was a safe agent for induction of anesthesia in patients with compromised myocardial function. In healthy patients, no significant difference was found in the hemodynamic effects of induction doses of 0.25 mg/kg midazolam and 4 mg/kg thiopental (Lebowitz et al., 1982).
Respiratory depression is commonly associated with midazolam administration, and this respiratory depression is poorly related to dose, not reversed by naloxone, and independent of the rate of administration of the drug (Forster et al., 1983; Alexander and Gross, 1988; Alexander et al., 1992).
As an intravenous induction agent in children, midazolam in doses as high as 0.6 mg/kg was not as reliable as thiopental (Salonen et al., 1987). The most common pediatric use for intravenous midazolam other than as an anesthetic adjunct has been its use as a sedative for intensive care patients. Rosen and Rosen (1991) demonstrated the usefulness of continuous midazolam in critically ill pediatric patients. In their retrospective report of patients sedated for 4 to 72 hours who received a slow intravenous bolus (0.25 mg/kg) followed by a continuous infusion at 0.4 to 4 mg/kg per hour, they noted that all of their patients were adequately sedated, their patients’ oxygen consumption was significantly reduced, and enteral feedings were successful in all of those in whom it was attempted. However, others have noted reversible neurologic abnormalities associated with prolonged intravenous midazolam infusions (Engstrom and Cohen, 1989; Sury et al., 1989; Bergman et al., 1991).
Even with the extensive experience of intravenous midazolam in adult patients and volunteers, most of the pediatric experience with midazolam is derived from its use as a preanesthetic medication delivered via the intramuscular, oral, rectal, intranasal, and sublingual routes of administration. More than 85% of anesthesiologists responding to a survey of premedication practices indicated that they prescribe midazolam (Kain et al., 1997). In children, midazolam has been shown to produce tranquil and calm sedation, reduce separation anxiety, facilitate induction of anesthesia, and enhance antegrade amnesia (Twersky et al., 1993). Kain et al. (2000) have shown that 0.5 mg/kg of oral midazolam can produce significant anterograde amnesia at 10 and 20 minutes and anxiolysis as early as 15 minutes after administration. Numerous studies have documented the efficacy of orally administered midazolam (Feld et al., 1990; Weldon et al., 1992; Levine et al., 1993b). The appropriate dose appears to range between 0.5 and 1 mg/kg. Its time of onset ranges from 15 to 30 minutes. Oral midazolam can also be safely administered to children with cyanotic heart disease without affecting oxygen saturation (Levine et al., 1993a). Serious side effects of midazolam are uncommon. However, several postoperative behavioral problems (fearfulness, nightmares, food rejection) were observed in children premedicated with oral midazolam (0.5 mg/kg) (McGraw, 1993). Postoperative dysphoria and crying can be very difficult for families when it occurs; a duration of 15 to 20 minutes sounds short but may seem very long for those caring for such a child. In addition, McMillan et al. (1992) have noted loss of balance, dysphoria, and blurred vision in some patients receiving 0.75 and 1 mg/kg orally. Hiccups have been associated with midazolam administration via the rectal, nasal, and oral routes (Marhofer et al., 1999). One major disadvantage of oral midazolam is its bitter taste. It should be administered in a flavored syrup or drink; however, a commercially available liquid preparation is now available. Almenrader et al. (2007) reported that 14% of children refused oral midazolam in a study comparing oral clonidine with oral midazolam premedication. They also reported a trend toward an increased incidence of emergence agitation in the midazolam group, with parental satisfaction favoring clonidine. Alternatively, Ko et al. (2001) in a study of 88 children having outpatient surgery, reported a lower incidence of emergence agitation after a sevoflurane/N2O/O2 anesthetic when oral midazolam 0.2 mg/kg was given.
Oral midazolam has been associated with prolonged recovery times in some studies, but others, using BIS and measured end-tidal gases, did not find this problem (Viitanen et al., 1999; Brosius and Bannister 2001, 2002).
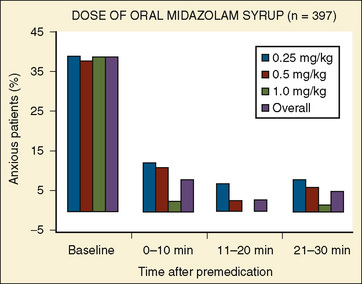
In a multicenter study involving 455 children, Coté et al. (2002) reported on the effectiveness of commercially prepared midazolam syrup. In this study, oral midazolam was effective for sedation and anxiolysis at a dose as low as 0.25 mg/kg. Doses as high as 1 mg/kg had minimal effects on respiration and oxygen saturation (Fig. 7-22).
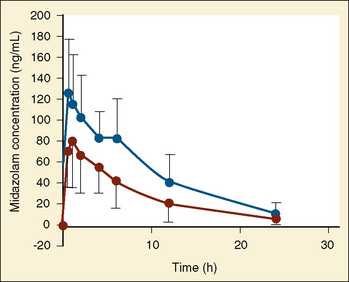
Rectal administration of midazolam has also been successfully used to sedate patients. Saint-Maurice et al. (1986) have shown that after a dose of 0.3 mg/kg, a maximum plasma concentration of 100 ng/mL was achieved with levels of sedation as judged by mask acceptance, with patient cooperation being satisfactory in all 16 patients. Coventry et al. (1991), in a double-blind study of pediatric patients requiring sedation for computed tomography evaluations, noted that 0.3 and 0.6 mg/kg of rectal midazolam was ineffective in providing satisfactory sedation. Spear et al. (1991) noted that the optimum dose of rectal midazolam was 1 mg/kg and that doses of 0.3 mg/kg resulted in patient struggling during anesthesia induction.
Nasal and sublingual transmucosal routes of administration have also been used for midazolam preanesthesia medications. Wilton et al. (1988) and Davis et al. (1995) demonstrated the usefulness of preanesthetic sedation of preschool children with 0.2 to 0.3 mg/kg of intranasal midazolam. Walbergh et al. (1991) determined plasma concentrations after administration of 0.1 mg/kg of intranasal midazolam. In these patients, peak plasma concentrations of midazolam occurred within 10 minutes after its administration, with peak plasma concentrations ranging from 43 to 106 ng/mL. In this study, plasma midazolam concentrations exceeded threshold sedation values for adults (40 ng/mL) as early as 3 minutes after its nasal administration and exceeded this level for as long as 30 minutes. Because intranasal midazolam can irritate the nasal mucosa, its use is limited by the volume of drug to be administered. The sublingual mucosa has a rich vascular supply and drugs are absorbed systemically, thereby eliminating hepatic first-pass metabolism. Karl et al. (1993), in a comparative study of intranasal and sublingual midazolam administration, demonstrated the two routes to be equally effective but that the sublingual route of administration had better patient acceptance.
Pandit et al. (2001) demonstrated that when aliquots of midazolam dissolved in strawberry syrup were placed on the anterosuperior aspect of the child’s tongue, 0.2 mg of midazolam was effective in 95% of patients for parental separation. When midazolam was administered sublingually, Khalil et al. (1998) noted that in children aged 12 to 129 months who received either placebo or 1 of 3 doses of midazolam (with none of these children receiving placebo), 28% of those receiving 0.25 mg/kg, 52% of those receiving 0.5 mg/kg, and 64% of those receiving 0.75 mg/kg of midazolam showed satisfactory sedation (drowsy) 15 minutes after drug administration. Children receiving the two higher doses of midazolam (0.5 and 0.75 mg/kg) accepted mask induction willingly, whereas the group receiving 0.25 mg/kg resembled the placebo group.
Flumazenil
Flumazenil blocks the effects of benzodiazepines on the GABAergic inhibition pathway in the CNS. Flumazenil does not have significant agonist activity of its own and does not appear to reverse the effects of opioids. Flumazenil has a short duration of action. Its plasma half-life is between 0.7 and 1.3 hours. It is metabolized and cleared by the liver and excreted in the urine (Rocari et al., 1986). Adverse effects of flumazenil include nausea, vomiting, blurred vision, sweating, anxiety, and emotional lability. Serious adverse effects include seizures and cardiac dysrhythmias; these events have been associated with patients physically dependent on benzodiazepines, patients with epilepsy, and patients having taken multiple drug ingestions or overdoses. Clinical trials in adults suggest a use of flumazenil in reversing the effects of conscious sedation, general anesthesia in benzodiazepine overdose, and hepatic encephalopathy.
Use of flumazenil in pediatric patients has been related to clinical situations requiring benzodiazepine reversal in anesthesia and for the treatment of benzodiazepine overdose (Roald and Dohl, 1989; Jones et al., 1991). Doses of flumazenil varied between 0.005 and 0.1 mg/kg, with 0.01 mg/kg being the most commonly used dose. In a study of 107 children undergoing procedural sedation, Shannon et al. (1997) noted that a mean dose of 0.017 mg/kg of flumazenil was used to reverse a mean midazolam dose of 0.18 mg/kg. Because of its short half-life relative to the half-life of most benzodiazepines, resedation is a common finding after flumazenil use. Consequently, repeat administrations and careful patient observations are necessary (Jones et al., 1993).
Other Sedative Agents
Etomidate
Etomidate is metabolized in the liver. Only 2% of the drug appears unchanged in the urine. Etomidate causes little change in cardiovascular function in either healthy or compromised patients (Guldner et al., 2003). In a study of children with atrial septal defects (ASDs) undergoing cardiac catheterization, Sarkar et al. (2005) noted that induction doses of intravenous etomidate had no significant effect on the hemodynamics or on the shunt fraction. Myoclonic movements that are not associated with epileptiform electroencephalographic activity occur in 30% to 75% of patients after induction with etomidate (Ghonheim and Yamanda, 1977). Pain at the injection site is a common side effect. A new formulation of etomidate dissolved in a fat emulsion of medium and long-chain triglycerides is available. A study in children using this formulation reported a low incidence (5%) of pain at injection; however, a higher incidence of myoclonic movements (85%) is reported as well (Nyman et al., 2006).
Etomidate has both anticonvulsant and proconvulsant qualities. In patients with known seizure disorders, etomidate can produce epileptiform activity (Ebrahim et al., 1986; Modica et al., 1990). A major side effect limiting etomidate use is its suppression of adrenal steroid synthesis and reports of increased mortality after its use (Ledingham and Watt, 1983). Etomidate blocks adrenal steroid synthesis through inhibition of two mitochondrial enzymes dependent on CYP: cholesterol side-chain cleavage enzyme and 11β-hydroxylase (Wagner et al., 1984). The inhibition of steroid synthesis occurs with both prolonged continuous infusions and with single induction doses (Longnecker, 1984; Wagner and White, 1984). Dönmez et al. (1998) noted in a randomized prospective study of 30 children undergoing cardiopulmonary bypass that when etomidate (0.3 mg/kg) was used as an induction agent, it significantly suppressed the increased cortisol levels associated with the stress responses of surgery and cardiopulmonary bypass. In critically ill children a single bolus dose has shown impaired adrenal function associated with increased mortality (den Brinker et al., 2008). In adult trauma patients, single-dose etomidate administration for rapid-sequence intubation was associated with chemical evidence of adrenal suppression, increased length of stay in the intensive care unit (ICU), and an increased number of days using a ventilator (Hildreth et al., 2008). However, other studies of adults suggest that for ICU patients receiving etomidate for induction, their clinical outcome and therapy were no different from patients induced with other sedative hypnotic agents (Ray and McKeown, 2007). For induction of anesthesia, the recommended intravenous dose is 0.3 to 0.4 mg/kg. Recent studies by Cotton et al. (2009) with an etomidate analog suggests that the analog undergoes ultra rapid metabolism, maintains the drug’s sedative properties, and has no adrenal suppression. It is probably best to avoid etomidate use in patients with adrenally suppressed states.
Propofol
Propofol is an alkylphenol that is formulated in 10% soybean oil, 2.25% glycerol, and 12% purified egg phosphatide. This form of reconstitution is used because of anaphylactic reactions that occurred when propofol was reconstituted with polyethoxylated castor oil (Cremophor-EL). The rapid redistribution and metabolism of propofol result in a short duration of action and allow for the drug to be administered via repeated injections or continuous infusions with minimal accumulation. Kinetic studies in both adults and children reveal a drug with a large steady-state volume of distribution, a slow elimination half-life, and a rapid clearance. Glucuronidation of propofol is a major route of elimination. Uridine 5-diphosphate-glucuronosyltransferases (UGTs) are the drug metabolizing enzymes for phase II. Extrahepatic metabolism of propofol occurs, and at these extrahepatic sites, conjugation is governed by different exons than in the liver (Takahashi, 2008). Mutations in these locations can markedly affect glucuronidation. In radiolabeled isotope studies, 88% of the radioactivity is excreted in the urine, 2% is excreted in the feces, and the remainder is excreted as 1- and 4-glucuronides and 4-sulfate conjugates. In patients with hepatic and renal impairments, no statistically significant alterations occur in the pharmacokinetics. Because the clearance of the drug exceeds the capacity of the liver blood supply, extrahepatic sites of metabolism appear to be involved with the clearance of propofol. These extrahepatic sites of metabolism were suggested in studies of patients undergoing liver transplantation where metabolic products of propofol metabolism were produced when propofol was administered only during the anhepatic phase of the operation. The effect of fentanyl on propofol clearance is not clear. In studies by Cockshott et al. (1987), fentanyl decreased propofol clearance, whereas in other studies, no effect was noted (Saint-Maurice et al., 1989; Gill et al., 1990).
The pharmacokinetics of propofol in children have been described by numerous investigators (Saint-Maurice et al., 1989; Jones et al., 1990; Marsh et al., 1991; Kataria et al., 1994; Knibbe et al., 2002; Zuppa et al., 2003). In computer-controlled infusions of propofol in children younger than 10 years, Marsh et al. (1991) noted the volume of the central compartment to be 0.34 L/kg and the clearance of the drug to be 34.3 mL/kg per minute. Kataria et al. (1994) using three different pharmacokinetic modeling approaches, analyzed the kinetics of single-bolus and continuous infusions of propofol in children. In all three models, the pharmacokinetics were well described by a three-compartment model with a central compartment of 0.52 L/kg and a clearance of 34 mL/kg per minute.
The pharmacokinetics of propofol were studied in a small number of children after cardiac surgery. When propofol was used to provide sedation for 6 hours, Knibbe et al. (2002), using population kinetics, reported propofol to fit a two-compartment model with a clearance of 35 mL/kg per minute and a central compartment of 0.78 L/kg. In addition, the authors suggested that children may have a lower pharmacodynamic sensitivity to propofol in that higher plasma concentrations were needed to maintain sedation than those reported in adults.
The pharmacodynamics of propofol have been well described and reviewed (Shafer, 1993). Because of the pharmacokinetic properties of propofol, infusions allow for more rapid decreases in plasma concentrations and faster patient recoveries from anesthesia (Fig. 7-23) (Mirakhur, 1988; Borgeat et al., 1990; Watcha et al., 1991; Larsson et al., 1992; Lebovic et al., 1992; Nightingale and Lewis, 1992; Reimer et al., 1993; Shafer, 1993). One of the newer pharmacokinetic terms is context-sensitive half-life, used to describe the time to decrease drug concentration by 50% after variable infusion durations. Such values can show how long a drug’s effects may persists after discontinuing infusions, based on how long it has been infused. McFarlan et al. (1999) reported a propofol infusion simulation to keep blood concentration of propofol at 3 mcg/mL in children aged 3 to 11 years. After a bolus of 2.5 mg/kg, infusions rates were 250 mcg/kg per minute for 15 minutes, then 216 mcg/kg per minute for 15 minutes, 183 mcg/kg per minute for 30 minutes, 166 mcg/kg per minute for 1 hour, and 150 mcg/kg per minute for the second and fourth hours. The predicted context-sensitive half-life in children was 10.4 minutes (for a 1-hour infusion) to 19.6 minutes (4-hour infusion), compared with values of 6.7 to 9.5 minutes in adults. Engelhardt et al. (2008) prospectively used this changing infusion schema to reach predicted propofol concentrations in 17 healthy children between 1 and 6 years of age. They found concentrations were higher than predicted in the first 30 minutes (7.1 mcg/mL vs. 6.6 mcg/mL) but the differences at 30, 50, and 70 minutes were not significant and no child needed rescue doses of propofol.
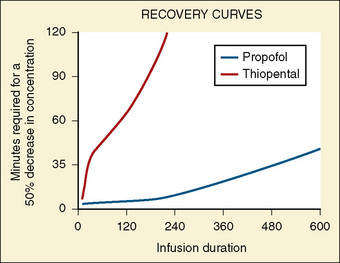
In general, with induction doses of propofol, blood pressure decreases, as does systemic vascular resistance. Changes in heart rate are variable, and cardiac output decreases slightly. In studies evaluating propofol requirements for induction of anesthesia in children, Manschot et al. (1992) noted that in children aged 3 to 15 years receiving 5 mcg/kg of alfentanil to reduce the pain of propofol injection, age-related differences in propofol requirements were demonstrated. In children aged 10 to 15 years, 1.5 mg/kg of propofol was sufficient to induce sleep, whereas in children aged 3 to 9 years, a dose of 2.5 mg/kg was needed. In a study by Hannallah et al. (1991) in which alfentanil was not administered, the ED50 and ED95 for loss of eyelash reflex were 1.3 and 2 mg/kg, whereas the ED50 and ED95 for induction of anesthesia were 1.5 and 2.3 mg/kg, respectively. Westrin (1991), in a study of infants aged 1 to 6 months and children aged 10 to 16 years, noted that the ED50 of propofol was 3 mg/kg for infants and 2.4 mg/kg for the older children. In all three of these studies, propofol was administered over 10 to 30 seconds. However, as with most hypnotic agents, propofol also demonstrates a rate-dependent induction. Stokes and Hutton (1991) demonstrated that with the use of slower infusion rates, induction time for anesthesia increases but smaller doses could be used.
Peeters et al., (2006) studied propofol pharmacokinetics and pharmacodynamics in unventilated infants after craniofacial surgery. Twenty-two infants, aged 1 month to 2 years, received propofol at 33 to 66 mcg/kg per minute in the ICU, based on Comfort-B scores and bispectral index (BIS) monitoring. Population kinetic analysis using NONMEM showed propofol kinetics was best described by a two-compartment model. Body weight was a significant covariate (i.e., use of body weight made the model fit the measured concentrations more closely). Clearance was 0.169 L/min (or 77 mL/min per kilogram), steady-state volume of distribution 144 L (or 16.1 L/kg) and central volume 20.3 L (or 2.3 L/kg). These values are much higher than those reported in children receiving ventilation. The importance of dose titration was emphasized by the great interpatient variability in propofol effect on Comfort-B scores or BIS readings.
In patients with congenital heart disease, Gozal et al. (2001) demonstrated that despite lower systemic and pulmonary pressures, propofol did not modify the characteristics of the patient’s underlying intracardiac shunts.
In normal children aged 1 to 6 years, Karsli et al. (2002), using transcranial Doppler, noted that propofol decreases cerebral blood flow velocity and that there is a relationship between cerebral blood flow velocity and propofol dosing. In addition, Wilson-Smith et al. (2003) noted that in healthy children who were given propofol for their elective surgery, the effects of nitrous oxide on cerebral blood flow velocity were preserved.
In addition to its anesthetic action, propofol appears to have antiemetic properties. In adult patients, Borgeat et al. (1992) demonstrated that 10 mg of propofol administered in the recovery room was effective in reducing the incidence of nausea and vomiting. Watcha et al. (1991) noted that in pediatric patients undergoing strabismus surgery, propofol alone effectively decreased the incidence of postoperative emesis (23%) compared with a similar group of patients anesthetized with halothane and nitrous oxide and supplemented with prophylactic droperidol (50%). However, in patients who received propofol and nitrous oxide, Watcha et al. (1991) noted that the incidence of emesis increased significantly (60%). Weil et al. (1993) also noted the antiemetic effect in pediatric patients with strabismus who were anesthetized with propofol and nitrous oxide compared with patients anesthetized with halothane and nitrous oxide. This antiemetic effect of propofol was even more pronounced in patients who received no opioids. Reimer et al. (1993) noted no difference in the incidence of emesis between pediatric patients undergoing strabismus repair who were anesthetized with halothane and nitrous oxide and those receiving propofol in oxygen or propofol with nitrous oxide. Differences between studies with regard to the antiemetic effect of propofol may be a function of the basic design of each study. Variations in premedications, opioid administration, and postoperative fluid intake may be factors that make comparisons of the studies difficult.
The antiemetic effects of propofol have also been demonstrated in pediatric patients undergoing short ear, nose, and throat surgical procedures and ambulatory surgical procedures (Borgeat et al., 1990; Martin et al., 1993).
In patients undergoing radiofrequency ablation, a procedure that is associated with an incidence of emesis as high as 60%, Erb et al. (2002) noted that propofol-based anesthesia was associated with a markedly decreased incidence of nausea (21%) and emesis (6%) compared with rates of nausea and vomiting of 63% and 55%, respectively, in children anesthetized with isoflurane.
Side effects from propofol include tolerance to the drug, pain on injection, spontaneous excitatory movements, and anaphylactic reactions. Tolerance has been reported in a pediatric patient undergoing numerous exposures for radiation therapy (Deer and Rich, 1992). Pain from injection is a common problem with propofol administration and may be related to the size of the vein in which it is administered. Westrin (1991) noted that pain during the injection occurred more often in the infants (50%) than in the older children (18%). The addition of 5 to 15 mcg/kg of alfentanil, 1% lidocaine (1 mg), or 0.1 mg/kg lidocaine can markedly attenuate the pain on injection (Valtonen et al., 1989; Manschot et al., 1992; Kwak et al., 2009). The addition of thiopental and the use of inhaled nitrous oxide also have been shown to attenuate the pain on injection (Beh et al., 2002; Cox, 2002).
Involuntary motor movements have been associated with propofol, and these spontaneous movement disorders appear to occur in the absence of epileptic form activity on electroencephalography (Borgeat et al., 1993; Reynolds and Koh, 1993). Anaphylactic reactions have also been reported. Initial studies with propofol using 10% polyethoxylated castor oil as a solubilizing agent had reported instances of anaphylactic reactions (Briggs et al., 1982). Laxenaire et al. (1992) have reported on 14 patients with life-threatening reactions within minutes after receiving propofol in its current preparation. In some patients, these anaphylactic reactions occurred during the patient’s first exposure to propofol.
Because of its lipid base, propofol has been associated with bacterial growth and patient infection if strict aseptic techniques during handling are not observed. Because of patient safety concerns, 0.005% ethylenediaminetetraacetate (EDTA) or metabisulfite was added to the formulation by different manufacturers. In a study comparing propofol with and without EDTA, Cohen et al. (2001) noted no differences in clinical profiles between the two drugs and noted that both formulations lower ionized calcium without any apparent clinical effect.
A major concern with propofol administration is the development of the propofol infusion syndrome (PRIS). PRIS has been defined as arrhythmias during the infusion plus one or more of the following: lipemic plasma, hepatomegaly, metabolic acidosis with or without an increase in serum lactate, or rhabdomyolysis with myoglobinuria. The occurrence of deaths in infants, children, and adults has raised concerns regarding the safety of propofol infusions for ICU-patient sedations. The pathogenesis of PRIS is unclear. Proposed mechanisms include enzyme block steps in mitochondrial fatty acid oxidation and inhibition of β-adrenergic receptors and calcium channel function. The rare occurrence of PRIS suggests a genetic susceptibility. PRIS is associated with concomitant catecholamine and steroid administration and high-dose infusion. Although monitoring of biochemical markers has been proposed to detect the development of PRIS, it may result in a false sense of security (Veldhoen et al., 2009).
Ketamine
Ketamine is a racemic, nonbarbiturate cyclohexamine derivative that produces dissociation of the cerebral cortex from the limbic system. Ketamine appears to block afferent impulses in the diencephalon and associated pathways of the cortex, sparing the reticular formation of the brain stem. This may be the mechanism of its action. It may also act on the brain stem (Domino et al., 1965). There is often electroencephalographic seizure activity, particularly in the limbic system and cortex, without clinical manifestations (Schwartz et al., 1974). Clinically, a ketamine anesthetic produces effective sedation and analgesia, but patients may keep their eyes open. Many reflexes are preserved. Preservation of gag reflex, laryngeal irritability, and continued muscle tension occur. Intravenous doses of 2 mg/kg produce a highly predictable response in children. On a milligram-per-kilogram basis, the amount of ketamine required to prevent gross movements is four times greater in infants younger than 6 months than in 6-year-old children (Lockhart and Nelson, 1974).
White et al. (1980) compared both the l- and d-isomers of ketamine in adult surgical patients with respect to the efficacy and side effects of these isomers. In this study, they noted that the d-isomer produced the most satisfactory anesthetic state and the lowest incidence of negative emergence reactions, whereas the l-isomer produced the least satisfactory anesthesia and the highest incidence of emergence reactions.
The pharmacokinetics of ketamine in patients of different ages were determined (Table 7-8). In infants younger than 3 months old, the volume of distribution was similar to that in older infants but the elimination half-life was prolonged. Clearance was reduced in the younger infants; reduced metabolism and renal excretion in the young infant are the likely causes. Ketamine is metabolized in the liver, and its major metabolite is norketamine. Norketamine has about 30% of the clinical activity of ketamine.
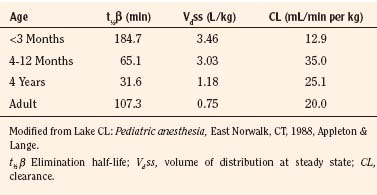
In the anesthetic state associated with ketamine, respiration and blood pressure are usually well maintained. The use of ketamine in infants, particularly at the high doses required for lack of movement, has been associated with respiratory depression and apnea (Eng et al., 1975). Generalized extensor spasm with opisthotonos also has been seen in infants (Radney and Badola, 1973). In addition, acute increases in pulmonary artery pressure have occasionally occurred in infants with congenital heart disease during ketamine anesthesia for cardiac catheterization. Studies suggest that pulmonary vascular resistance is not changed by ketamine in infants with either normal or elevated pulmonary vascular resistance, as long as the airway and ventilation are maintained (Hickey et al., 1984; Morray et al., 1984). In a study of 60 children with congenital heart disease randomized to receive propofol infusion or propofol with ketamine 0.5 mg/kg during cardiac catheterization, Akin et al. (2005) reported that hypotension and bradycardia were higher in the group that received propofol alone. Williams et al. (2007) studied ketamine 2 mg/kg bolus over 5 minutes followed by infusion at 10 mcg/kg per minute in 15 children with pulmonary hypertension having cardiac catheterization with sevoflurane (1 MAC decreased to 0.5 MAC after ketamine) and spontaneous ventilation. No changes in pulmonary artery pressure or resistance index were found.
The mechanism of cardiorespiratory stimulation has not been entirely clarified. Dowdy and Kaya (1968), Traber et al. (1970), and other groups have shown that there is a direct negative inotropic action on the denervated heart. In the presence of intact sympathetic and autonomic nervous systems, however, a pressor effect causes increased blood pressure, heart rate, and cardiac output, a response present in all ages. This serves as a most valuable adjunct in the management of poor-risk patients but is a contraindication in the presence of hypertension or tachycardia. In their investigation of ketamine, Dowdy and Kaya (1968) also found evidence of antiarrhythmic activity.
Ketamine increases cerebrospinal fluid pressure significantly for 5 to 15 minutes, but as shown by Dawson et al. (1971), the increase may be held within acceptable limits by pretreatment with thiopental (Gardner et al., 1971; Lockhart and Jenkins, 1972). Elevation of intraocular pressure also occurs after ketamine administration. In a group of 15 children, Yoshikawa and Murai (1971) noted an average increase of 30% that was maximum within 15 minutes after administration of ketamine and evident for approximately 30 minutes. In addition to the elevation of intraocular pressure, nystagmus limits its usefulness in eye surgery.
A major drawback to ketamine administration in older children is the high incidence of hallucinations and bad dreams. In adults, this occurs in 30% to 50% of patients, and in prepubescent children, the incidence is noted at 5% to 10%. Hallucinations were uncommon in children, but the awakening phase may entail considerable excitement (Wilson et al., 1970).
Ketamine can be administered orally, and part of its effect is secondary to its metabolite norketamine. Gutstein and colleagues (1992) compared oral premedication with ketamine at either 3 or 6 mg/kg. With 3 mg/kg, 73% of the children were sedated within 30 minutes. At the 6 mg/kg dose, 100% of the patients were sedated, and 67% tolerated intravenous cannulation. Onset times for the 3- and 6-mg/kg dose groups were 19.6 and 11.2 minutes, respectively (Gutstein et al., 1992).
Use of low-dose ketamine as an analgesic adjunct has emerged in select populations in recent work. Aouad et al. (2008) conducted a prospective randomized double-blind comparison of propofol alone (1 mg/kg) to propofol and ketamine (0.5 mg/kg of each) in 63 children undergoing anesthesia for oncologic procedures. The combination group had fewer patients needing rescue propofol (83% vs. 100%) or fentanyl (43% vs. 75%) and showed more stable hemodynamics. However, 40% of the combination group had agitation during recovery (vs. 6% with propofol alone). Slavik and Zed (2007) reviewed studies of ketamine and propofol for procedural sedation and anesthesia using MEDLINE, EMBASE, and the Cochrane databases and found eight clinical trials to include. They found that the ideal ratio of ketamine to propofol was unclear; better clinical efficacy of the combination over propofol alone was not shown; better hemodynamic and respiratory status was demonstrated in some studies; and at higher ketamine doses, greater adverse effects were apparent (Slavik and Zed, 2007).
Several investigators have studied low dose-ketamine given intravenously or into the tonsillar bed in children undergoing tonsillectomy with conflicting results (O’Flaherty et al., 2003; Conceicao et al., 2006; Batra et al., 2007; Dal et al., 2007; Erk et al., 2007; Abu-Shahwan, 2008; Honarmand et al., 2008). Most studies involved 60 to 100 children and compared the perioperative course looking at pain scores, rescue analgesics, and side effects compared with patients in a control group (receiving saline). Ketamine at doses less than 0.25 mg/kg were ineffective, and at 0.5 mg/kg results were positive in some studies and negative in others. The addition of low-dose ketamine infusions in 11 children with advanced cancer and pain that was inadequately treated with high doses of opiates (0.1 to 0.2 mg/kg per hour titrated up to 0.5 mg/kg per hour in 3 of 11 patients) improved pain control and allowed decreases in opiate pain medications in 8 (Finkel et al., 2007).
Clonidine
Clonidine is an α2-adrenergic agonist that has been used as a premedication, anesthetic adjunct, extender for postoperative analgesic duration, and to prolong the analgesia associated with regional anesthetic blocks. In one prospective, randomized, blinded study, 60 children (aged 5 to 11 years) received placebo, 2 mcg/kg or 4 mcg/kg oral clonidine 100 minutes before inhalation induction of anesthesia with halothane/N2O/O2 (Nishina et al., 1996). Sedation, separation from family, and tolerance to mask application were better in the 4 mcg/kg clonidine group. Halothane was titrated to maintain blood pressure and heart rate within 20% of baseline, and the 4-mcg/kg group used 45% less halothane. No delay in transfer to ward postoperatively was found (15 to 17 minutes). Heart rates were slower in the group receiving 4 mcg/kg, but bradycardia did not occur, although all children received atropine 30 mcg/kg with the premedication.
Bergendahl et al., (2006) reviewed clonidine use in pediatric anesthesia both as premedication and for intraoperative use. Rectal absorption is rapid, and clonidine shows high bioavailability. Some studies included in this review found improved postoperative analgesia with oral clonidine, decreased vomiting, and shivering. Postoperative confusion and agitation in young children receiving clonidine compared with children receiving placebo or midazolam was reported by some. Persistence of postoperative sedation (or calmness) is a desirable feature to some assessors.
Potts et al. (2007) recently reported a population analysis of clonidine in children using NONMEM and reporting their results using allometric scaling (to a standard of 70 kg). Published data from four studies (two intravenous, one rectal, and one epidural clonidine) were combined with an open-label group of children who received clonidine 1 to 2 mcg/kg after cardiac surgery (380 observations). The mean age was 4 years, and the mean weight was 17.8 kg. Clearance was 14.6 L/hr per 70 kg, central volume was 62.5 L/70 kg, and peripheral volume was 119 L/70 kg with the distribution half-life of 12 minutes and elimination half-life of 9 hours. At birth, clearance was low at 3.8 L/hr per 70 kg, reaching 82% of adult values by age 1 year. Absorption was slower from epidural sites than the rectum (Fig. 7-24; Table 7-9). Simulations showed context-sensitive half-lives increased with infusion duration (1, 3, 6, and 10 hours) and decreased with increasing age (Table 7-10). The relatively long elimination half-life and importance of intact renal function for clearance may be features explaining the current preference for the newer α2-agonist dexmedetomidine.
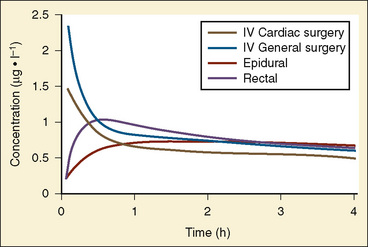
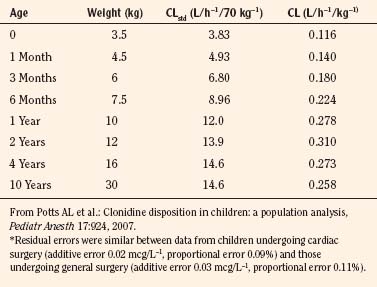
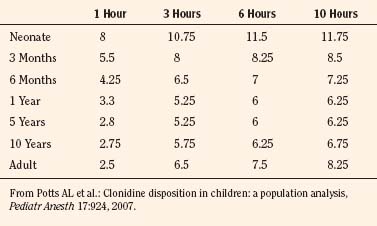
Dexmedetomidine
One of the newer additions to the list of intravenous sedative and anesthetic drugs is dexmedetomidine. It is a selective α2-agonist with sedative and analgesic properties. Dexmedetomidine is more selective for the α2-adrenoreceptor with a reported ratio of α2 to α1 of 1600:1, which is seven to eight times higher than that reported for clonidine. Its sedative effect is attributed to hyperpolarization of noradrenergic neurons in the locus coeruleus (Carollo et al., 2008). This suppression of locus coeruleus neurons is similar to normal sleep. It provides respiratory stability, with no ventilatory depression accompanying its sedative, anxiolytic, and analgesic effects in adults. Mahmoud et al. (2009) have shown dexmedetomidine to be a useful anesthetic agent for magnetic resonance imaging (MRI) evaluations of airways in children with obstructive sleep apnea (OSA). Although hemodynamic effects of hypotension or bradycardia are less commonly seen than with clonidine, they have been reported. Dexmedetomidine has also been suggested as a novel treatment for atrial and junctional tachyarrhythmias (Chrysostomou et al., 2008). Tobias and Berkenbosch (2004) reported early experience with dexmedetomidine infusions in 30 ventilated infants and children, comparing it with midazolam. Decreases in morphine use were found in the high-dose dexmedetomidine group (0.5 mcg/kg per hour) compared with those receiving midazolam (0.1 mg/kg per hour). Heart rates were slower in the dexmedetomidine group, but hypotension was not seen. In pediatric cardiac surgical patients, Chrysostomou et al. (2009) suggest that higher doses may be needed in the younger patients.
In neurosurgeries requiring an intraoperative “awake” period to assess patient responses during deep brain stimulation for Parkinson’s disease, or in surgeries near speech areas, or in surgery for epilepsy, dexmedetomidine has proved very useful to allow anesthesia without intubation (Mack et al., 2004).
Koroguli et al. (2005) noted that in children aged 1 to 7 years undergoing MRI that dexmedetomidine was superior to midazolam. However, in a separate study, Koroguli et al. (2006), also noted that dexmedetomidine has slower recovery and discharge compared with propofol. The slower recovery times with dexmedetomidine compared with propofol have also been observed by Heard and others (2008).
Hammer and colleagues (2008) reported dexmedetomidine effects on cardiac electrophysiology in 12 children (aged 5 to 17 years). One mcg/kg administered over 10 minutes and then 0.7 mcg/kg per hour for 10 minutes led to decreased heart rates, increased blood pressure, and depressed sinus and atrioventricular (AV) node function. Respiratory rate and end-tidal CO2 during spontaneous ventilation were unchanged (Hammer et al., 2008). Caution in dexmedetomidine use for patients who are poorly tolerant of bradycardia or at risk for AV nodal block was emphasized. Jooste and others (2010) demonstrated in post-cardiac transplant patients that a rapid IV bolus dose had a transient increase in systemic and pulmonary pressures, as well as a decrease in heart rate. These transient changes were more pronounced in the systemic system as opposed to the pulmonary circulation.
Because dexmedetomidine has pharmacolytic properties that simulate normal sleep, Mahmoud et al. (2009) have demonstrated its usefulness in patients with sleep apnea.
Pharmacokinetics for dexmedetomidine in adults demonstrate desirable characteristics for use as titrated intravenous infusions for sedation and anxiolysis. Its elimination half-life is 2 hours (8 hour for clonidine), and its distribution half-life is 6 minutes (Carollo et al., 2008). Several groups have reported pharmacokinetics in children of dexmedetomidine. Petroz et al. (2006) studied 36 children, 18 from Canada and 18 from South Africa, in an open-label study. Blood was sampled for 24 hours after 10-minute infusions of 2, 4, or 6 mcg/kg per hour and analyzed by NONMEM. Concentrations were below detection after 6 hours; a two-compartment model central volume of distribution of 0.8 L/kg was constructed with a systemic clearance of 0.013 L/kg per minute and an elimination half-life of 110 minutes. Table 7-11 lists the pharmacokinetic values from this and other studies; a puzzling finding was dexmedetomidine concentrations that were consistently 30% higher in Canadian children, which was thought to have occurred because of a handling problem with specimens. Context-sensitive decrement times did not increase after 90- to 120-minute infusions with the context-sensitive half-life, plateauing at about 70 minutes and the 80% decrement time at about 220 minutes. Heart rate and blood pressure decreased over the hour after the infusion and decreased with higher infusion doses, whereas respiration and oximetry were stable. Sedation lasted less than 1 hour. Vilo et al. (2008) studied eight children (aged 2 to 11 years) and eight infants (aged 1 to 23 months) after receiving dexmedetomidine at 1 mcg/kg. Analysis of blood samples used noncompartmental methods. Data are summarized in Table 7-11. Clearance was similar in the two age groups, but volume of distribution (steady state) was larger in the younger group, making the half-life longer. Interindividual variation was large, especially in the infants. All were sedated by the dexmedetomidine but easily aroused, and five of the eight children needed extra sedation during MRIs. Based on the volume at steady state, younger children would be predicted to need larger initial dexmedetomidine doses with similar maintenance rates to older children or adults.
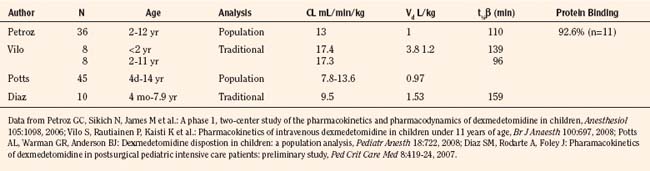
Potts et al. (2008) looked at population pharmacokinetics in 45 children after cardiac surgery aged 4 days to 14 years (mean age of 3.4 years). Population parameter estimates for a two-compartment model using NONMEM were reported using allometric scaling to 70 kg. In Table 7-11 the results are corrected for comparison with others’ work. Clearance increased from 15.5 L/hour per 70 kg at birth to reach 72% adult values at 6 months and 87% by 1 year (Table 7-12). Clearance in children at 39.2 L/hour per 70 kg is slightly less than adult values of 44.8 to 52.5 L/hour per 70 kg. Volumes of distribution were 103.5 to 126 L/70 kg, and half-lives were 12 minutes (α, distribution) and 2.3 hours (β, elimination), similar to adult reports. Context-sensitive half-lives after infusions of 1, 3, and 10 hours were longer in neonates (1.24 for 1 hour to 2.07 for 10 hours) than at age 1 year (0.49 to 1.09 hours) or in adults (0.49 to 1.45 hours). Large intersubject variability was attributed to age and size differences (Fig. 7-25).
TABLE 7-12 Age-Related Dexmedetomidine Clearances Described Using Both the Allometric “¾ Power” Model (per 70 kg) and the Linear per Kilogram Model (per kg)
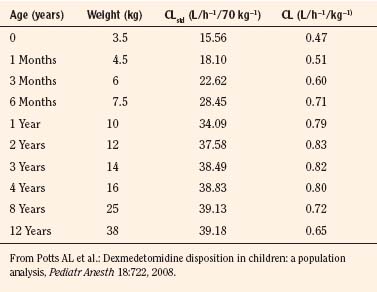
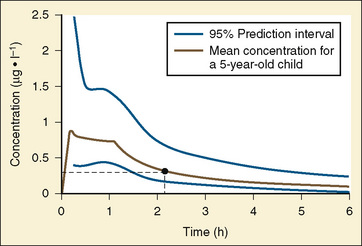
In addition to intravenous administration, dexmedetomidine can also be administered intramuscularly and intranasally. Dyck et al. (1993) demonstrated a 73% bioavailability after intramuscular administration in adult volunteers and that intramuscular injection did not result in the biphasic hemodynamic response observed with intravenous administration. Intranasal doses of 1 to 2 mcg/kg have been shown to induce sedation in children (Yuen et al., 2007, 2008; Talon et al., 2009). Transmucosal dexmedetomidine has a bioavailability of 80% (Anttila et al., 2003).
In addition to its use as a sedative agent, dexmedetomidine has been demonstrated to decrease the incidence of postoperative emergence agitation and effectively treat postemergence shivering. Ibacache et al. (2004) noted that a single dose of dexmedetomidine (0.3 mcg/kg) markedly attenuated the incidence of sevoflurane-associated emergence agitation, while Easley et al. (2007) reported that 0.5 mcg/kg of dexmedetomidine effectively stopped postoperative shivering in children within 5 minutes.
Opioids
To avoid the major adverse hemodynamic effects caused by potent inhalation anesthetic agents, the use of narcotic anesthesia has reemerged. Relative potencies of the various narcotics are listed in Table 7-13. Initially, meperidine (0.5 to 1 mg/kg) and morphine (0.05 to 0.1 mg/kg) were used to reinforce nitrous oxide anesthesia in the neonate. However, concerns regarding the toxicity and increased sensitivity of neonates to narcotics were raised. Way et al. (1965) demonstrated that morphine depresses newborn respiration more than meperidine and that these decreases in ventilatory response to increased CO2 concentrations occur at a dose one third (on a milligram-per-kilogram basis) of that administered to adults (Fig. 7-26). In laboratory animals, narcotics are more toxic to newborn animals than to older animals (Goldenthal, 1971). For morphine and dihydromorphine, the blood-brain barrier is more permeable in newborn animals than in older animals. The brain concentration of morphine several hours after injection was two to four times greater in brains of younger rats despite equal blood concentration (Fig. 7-27). This finding may be related to greater perfusion, to greater permeability, or to both in the newborn. Whereas increased permeability of the blood-brain barrier (BBB) to morphine occurs in neonatal nonhuman primates (1 to 3 days after birth), the adult BBB permeability is achieved by two months of age (Lynn et al., 1991). Such developmentally increased permeability is not seen with meperidine; this is not surprising because the lipid solubility of meperidine is quite high (Kupferberg and Way, 1963).
| Drug | Potency |
| Morphine | 1 |
| Methadone | 1 |
| Meperidine | 0.1 |
| Alfentanil | 40 |
| Fentanyl | 150 |
| Sufentanil | 1500 |
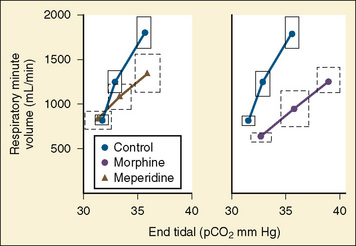
FIGURE 7-26 CO2 response curves in infants after intramuscular injection of morphine or meperidine.
(From Way et al.: Respiratory sensitivity of the newborn infant to meperidine and morphine, Clin Pharmacol Ther 6:454, 1965.)
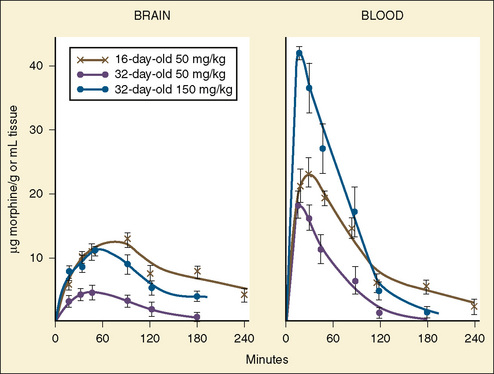
Studies involving opiate receptor-binding sites in rats have suggested that changes in receptor ontogeny also may be responsible for the respiratory depressant and analgesic effects observed in newborns. Zhang and Pasternak (1981) have shown that both low-affinity and high-affinity opiate receptors are present in rats. Low-affinity receptors are associated with respiratory depression, whereas high-affinity receptors are associated with analgesia. In the rat model, low-affinity receptors are present in large numbers at birth, and the number remains constant through 18 days of life. By contrast, high-affinity receptors are scarce at birth and do not reach significant proportions (50% of the adult value) until 15 days of life. Respiratory depression in infants may be a function not only of the lipophilicity of opioids but also of the maturational changes in the opiate receptor pool. In addition to age-related changes in opioid receptor pools, genetic factors may affect the μ-opioid receptor (OPRM1). Single nucleotide polymorphisms (SNPs) resulting in a single amino-acid change can have effects on opioid side effects and analgesia. Individuals homozygous for the G allele of the 118 A > G polymorphism seem to require higher doses of intravenous and oral morphine to achieve adequate levels of analgesia (Matthes et al., 1996; Klepstad et al., 2004; Romberg et al., 2004, 2005; Chou et al., 2006).
Clinical studies on opioid sensitivity have been conflicting. Early reports by Kupferberg and Way (1963) suggested neonates had more respiratory depression after opioid administration than did adults. However, Lynn et al. (1993) evaluated the respiratory depressant effects of intravenous morphine infusions in 30 postoperative patients aged 2 to 570 days and noted no evidence of a relationship of any given morphine concentration with respiratory depression and age. Infants who had a morphine Css over 20 ng/mL, 67% of subjects, had elevated levels of arterial Pco2 during spontaneous ventilation (six of nine infants), perhaps showing evidence of a threshold concentration.
Nichols et al. (1993) studied the extent and duration of respiratory depression after intrathecal administration of 0.02 mg/kg of morphine to 10 patients aged 4 months to 15 years. Although intrathecal morphine depresses ventilation for at least 18 hours, there was no relationship of age and ventilatory depression.
Age-related sensitivities have also been studied after intravenous fentanyl administration. Hertzka et al. (1989) determined that fentanyl-induced ventilatory depression as assessed by skin surface Pco2 and ventilatory patterns was not greater in infants (older than 3 months) than in children or adults. In addition to age sensitivities, Zhou et al. (1993) demonstrated ethnic differences in the disposition and effects of morphine. In a study in Chinese and Caucasian adult volunteers, they found that Chinese subjects had an increased morphine clearance with decreased respiratory and hemodynamic depressant effects. Interestingly, the decreased respiratory and hemodynamic susceptibility did not correlate with the gastrointestinal effects, with Chinese subjects experiencing more nausea and vomiting than Caucasians. The complexities of opioid actions, both related to analgesia and to side-effect profiles, are still incompletely studied for “old” agents like morphine, as well as newer ones like the fentanyl derivatives.
Morphine
The pharmacology of morphine has been studied in both adults and children. In adults, morphine is 30% to 35% protein bound, whereas in neonates, it is 18% to 22% bound (Bhat et al., 1990, McRorie et al., 1992). Morphine is a drug with a high hepatic extraction coefficient; consequently, morphine clearance is determined by hepatic blood flow. Increases in hepatic blood flow can further increase morphine clearance, whereas decreases in hepatic blood flow can lower drug clearance. Morphine is inactivated by N-demethylation and glucuronidation. The two major metabolic products are morphine 6-glucuronide and morphine 3-glucuronide, which are mainly excreted by the kidneys. In adults, sulfate metabolism accounts for 5% to 10% of the drug’s metabolism. In neonates the enzymes for glucuronide metabolism are immature, and the role of sulfation in morphine metabolism may be more pronounced. McRorie et al. (1992) demonstrated that in the neonate, sulfation contribution to morphine metabolism is proportionately higher, because glucuronidation is deficient. This effect diminishes by 4 to 6 months of age as glucuronidation reaches adult values.
As with other drugs, morphine appears to undergo age-related changes in its pharmacokinetic profile (Table 7-14). The presence of age-related changes in the neonatal period appears somewhat controversial. Bhat et al. (1990) studied the pharmacokinetics in 20 newborn infants younger than 5 days of age after a single bolus administration of intravenous morphine. In this study, they concluded that with increasing gestational age, drug clearance increases by 0.9 mL/kg per minute per week of gestation and that with increasing gestational age, both distribution and elimination half-life also decreased. Compared with term infants, Bhat et al. noted that in infants with fewer than 30 weeks’ gestation, morphine had a longer elimination half-life (10 ± 3.7 h) and slower clearances (3.4 vs. 15 mL/kg per minute). However, Chay et al. (1992) reported no difference in the pharmacokinetics of continuous morphine infusions in preterm and term infants. There was no reported correlation of gestational age or conceptual age with drug clearance or elimination half-life. In addition, these investigators noted that a plasma concentration of 125 ng/mL was necessary to provide adequate sedation in 50% of the neonates. These values are quite high compared with the analgesic values of 12 ng/mL needed after cardiac surgery (Lynn et al., 1984). How much of this difference is related to the desired effect (sedation during mechanical ventilation vs. postoperative analgesia) is not clear.
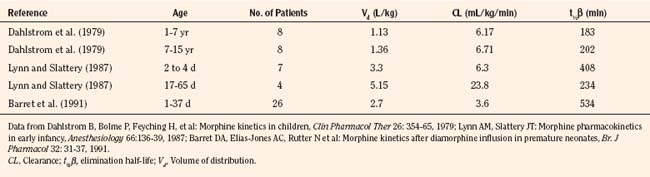
Most studies of morphine pharmacokinetics in infants and children have reported large interindividual variability, as shown in Fig. 7-28. This makes predicting effect and duration of action in an individual problematic. The same variability has been seen with meperidine and even with fentanyl (Pokela et al.,1992).
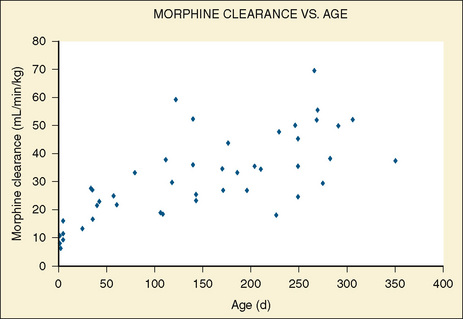
FIGURE 7-28 Morphine clearance (mL/min−1 per kg−1) vs. age (days) in infants receiving morphine.
(From Lynn AM et al.: Intravenous morphine in postoperative infants: intermittent bolus dosing versus targeted continuous infusions, Pain 88[1]:89, 2000.)
Bouwmeester et al. (2004) using an allometric model standardized to a 70-kg person, described a total-body clearance for morphine of 80% of that of adults at 6 months of age and 96% of that predicted in adults by 1 year of age; these findings correlate with the ones previously described by McRorie et al. (1992) (Table 7-15). It was also estimated that the formation of M3G in 1-year old infants accounts for 86% of morphine elimination, compared with 55% in adults, and that the morphine volume of distribution increased exponentially from 83 L per 70 kg at birth to 136 L per 70 kg at 6 months of age. Interestingly, Anand et al. (2008), using the same allometric model, found higher volumes of distribution (190 L per 70 kg) in preterm neonates (23 to 32 weeks’ gestation) than the ones described by Bouwmeester et al. (2004).
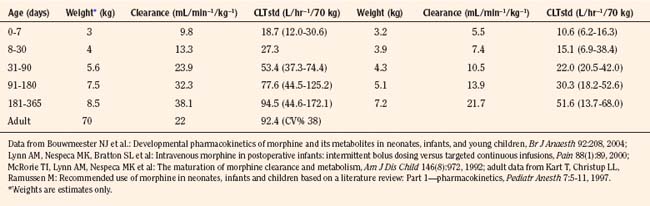
In addition to age, morphine pharmacokinetics can be influenced by disease. Patients with renal failure were reported to be sensitive to narcotic intoxication after morphine administration. Chauvin et al. (1987b) studied the pharmacokinetics of morphine in adult patients with renal insufficiency. For morphine, they found that morphine in patients with chronic renal failure has similar rates of clearance and half-lives but significantly smaller steady-state volumes of distribution compared with morphine in age- and weight-matched control patients. Although chronic renal failure did not alter the elimination of unchanged morphine, metabolites of morphine accumulated at higher plasma levels for longer periods of time in the patients with chronic renal failure. In studies of patients with renal failure, Osbourne et al. (1993) noted that morphine metabolism is impaired and that the metabolites of morphine (morphine 3-glucuronide and morphine 6-glucuronide) accumulate in the plasma (Fig. 7-29). Hanna et al. (1993) have also demonstrated abnormal kinetics of morphine metabolites in patients with renal failure. Patients with renal failure had a prolonged elimination half-life and decreased clearance in the pharmacokinetic profile of morphine 6-glucuronide. In patients with renal impairment, the increased opioid sensitivity may be a function of decreased morphine metabolism coupled with impaired clearance of the metabolites, which have analgesic and respiratory activity.
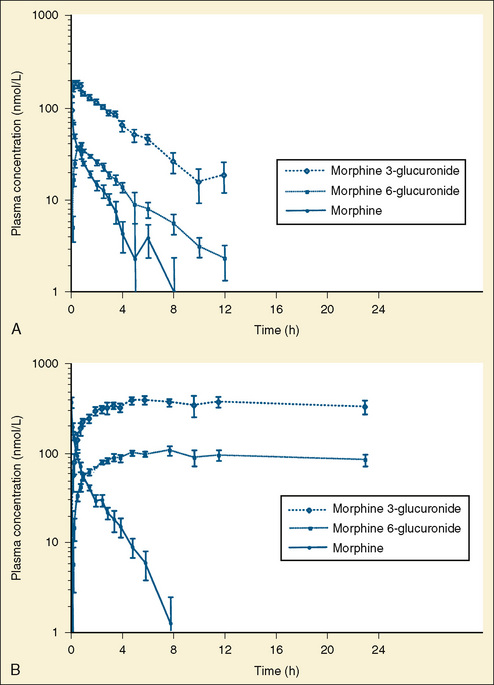
In patients with liver disease, the effects of disease can be unpredictable. Patwardhan et al. (1981) described the effects of liver disease on morphine kinetics in adult patients with cirrhosis and in healthy adult volunteers. Compared with healthy subjects, patients with moderate-to-severe cirrhosis had a normal elimination and disposition of morphine but a prolonged elimination half-life and decreased clearance of indocyanine. (Indocyanine is taken up and excreted solely by the hepatocytes, making it a reliable indicator of liver disease). Because morphine is a highly extracted drug and its clearance depends on hepatic blood flow, the investigators postulated that morphine has extrahepatic sites of metabolism in the gastrointestinal tract and kidneys.
In a limited study of 21 children aged 6 months to 10 years who underwent cardiopulmonary bypass for repair of their underlying heart defects, Dagan et al. (1993) noted that in the postbypass period, for patients requiring inotropic support, morphine clearance was 50% less than that reported for other children. Similarly Lynn et al. (1998) reported increased morphine clearance in infants after noncardiac surgery than in age-matched infants receiving morphine after cardiac procedures.
Geiduschek et al. (1997) described a morphine clearance of 11.7 ± 9.3 mL/kg/min in neonates supported by ECMO. Peters et al. (2005), using an allometric model, described an initial reduced morphine clearance at the start of ECMO (2.2 L/hr per 70 kg) that rapidly normalizes after 2 weeks of therapy.
In addition to intravenous infusions, intraspinal axis administration of opioids has been studied. Nordberg et al. (1984) noted that in adults, after 0.5 mg of intrathecally administered morphine (L2-4), the cerebrospinal fluid kinetics revealed a terminal half-life of 175 minutes, a volume of cerebrospinal fluid distribution of 0.88 mL/kg, and a clearance of 2.8 mL/kg per minute. In pediatric patients undergoing craniofacial surgical repairs, Nichols et al. (1993) noted that the cerebrospinal fluid concentrations at 6, 12, and 18 hours after 0.02 mg/kg of intrathecal administration were 2860, 640, and 220 ng/mL, respectively. These children had good analgesia, but all were mechanically ventilated, so respiratory effects were not assessed.
In children, Attia et al. (1986) demonstrated that the pharmacokinetics of epidural morphine were similar to values reported in adults. After a 50-mcg/kg epidural bolus, the volume of distribution was 7.9 L/kg, the elimination half-life was 74 minutes, and the clearance was 28 mL/kg per minute. In addition to morphine pharmacokinetics, Attia et al. (1986) noted that the onset and duration of analgesia were 30 minutes and 19 hours, respectively, and that respiratory depression as evidenced by changes in the slope of the ventilatory response to CO2 was impaired for 22 hours after epidural administration.
Intranasal use of morphine has been reported in adults. Fitzgibbon et al. (2003) after an intranasal dose of 40 mg of morphine in adults receiving opioids (i.e., not naïve to opioid effects) found an absolute bioavailability of 22% and a relative (to oral) bioavailability of 226%, with a Cmax of 62 ± 22.8 ng/mL and a t½ of 2 ± 0.7 hours. In a clinical trial, Stoker et al. (2007) found that reduced intranasal morphine doses (7.5 mg and 15 mg) are effective for moderate to severe pain as well. There are no reported studies in children.
Meperidine
Meperidine, like morphine, is an agonist at the µ-opioid receptor that shows great interindividual variability. In infants and neonates, the pharmacokinetics varied greatly between subjects, with a t½β of 10.7 hours (range of 3.3 to 59.4 hours), median clearance of 8 mL/kg per minute (range of 1.8 to 34.9 mL/kg per minute), and a median steady-state volume of distribution of 7.2 L/kg (range of 3.3 to 11) (Pokela et al.,1992). Normeperidine, its active metabolite, has a half-life that is dependent on renal function and can accumulate with high doses or in patients with decreased renal function; normeperidine may precipitate tremors or seizures (Saneto et al., 1996; Kussman and Sethna, 1998). Meperidine also has local anesthetic activity because of its interactions with sodium ion channels. It has been used as a local anesthetic after tonsillectomy and adenoidectomy procedures in children with mixed results (Elhakim et al., 1997; Nikandish et al., 2008). Its routine use in many pediatric centers has become very uncommon because of the undesirable effects of accumulating normeperidine and because there are a host of other agents available. However, meperidine in small doses can be used to treat postoperative shivering.
Fentanyl
Fentanyl is a synthetic opiate with a clinical potency 50 to 100 times that of morphine. It is metabolized by dealkylation, hydroxylation, and amide hydrolysis to inactive metabolites. It has a high hepatic extraction coefficient and a high pulmonary uptake (Roerig et al., 1987). Heberer noted that cirrhosis in adults had no effect on fentanyl kinetics. Fentanyl has relatively minimal hemodynamic effects and is used both as an adjunct to nitrous oxide anesthesia and as a sole anesthetic agent. Bradycardia and chest-wall rigidity are potential problematic features of high-dose fentanyl anesthesia. The cardiovascular effects of fentanyl at doses of 30 to 75 mcg/kg fentanyl (with pancuronium) are minimal (Hickey et al., 1984). Modest decreases in mean arterial pressure and systemic vascular resistance index were noted by Hickey and colleagues (1985).
In neonates, Murat et al. (1988) have shown that although baroreceptor control of heart rate is present, fentanyl anesthesia (10 mcg/kg) can significantly depress the baroreceptor response to both hypotension and hypertension. In comparative studies of opioid-induced respiratory depression with sufentanil and fentanyl administration in adults, Bailey et al. (1990) noted that ventilatory depression (both magnitude and duration) was less after sufentanil administration. In addition, although the two drugs have similar half-lives, analgesia lasted longer after sufentanil administration. The dose of fentanyl needed to ensure satisfactory anesthesia for infants varies with the surgical stress and disease comorbidity. Hickey and Retzack (1993) have shown that in a pediatric patient with reactive pulmonary vasculature, 25 mcg/kg of fentanyl was needed to prevent an acute episode of right ventricular failure secondary to pulmonary hypertension in the patient who was undergoing upper airway instrumentation and manipulation. Ellis and Steward (1990) have shown that in children undergoing hypothermic cardiopulmonary bypass or profound hypothermia with circulatory arrest who were anesthetized with fentanyl, a dose of at least 50 mcg/kg of fentanyl was needed to blunt the hyperglycemic response to hypothermia and circulatory arrest. Yaster (1987) noted that in neonates anesthetized with fentanyl, metocurine, and oxygen who were undergoing a wide variety of surgical procedures, fentanyl (10 to 12.5 mcg/kg) provided reliable hemodynamic stability for 75 minutes.
In a study of children aged 6 months to 6 years undergoing cardiac surgery with cardiopulmonary bypass, Pirat et al. (2002) compared three groups of patients. One group received intravenous fentanyl, the second group received intrathecal fentanyl, and the third group received both intravenous and intrathecal fentanyl. In this study, intrathecal fentanyl offered no advantage over intravenous fentanyl with regard to hemodynamic stability or suppression of the biochemical stress response. However, the combination of intrathecal and intravenous fentanyl was associated with better hemodynamic stability in the prebypass period compared with either group alone.
Duncan et al. (2000) reported a dose-ranging study of 40 pediatric patients undergoing cardiac surgery using one of five intravenous fentanyl doses: 2, 25, 50, 100, and 150 mcg/kg. In this study, patients in the 2 mcg/kg group had significant rises in prebypass glucose, prebypass and postbypass cortisol, and prebypass and postbypass norepinephrine. No significant rises occurred in glucose, cortisol, and catecholamines in any of the higher dosage groups. Patients in the group receiving 2 mcg/kg had significantly higher mean systolic blood pressures and heart rates. Higher doses of fentanyl (100 and 150 mcg/kg) offered little advantage over 50 mcg/kg in controlling these neuroendocrine stress responses.
Age-related differences in the kinetics and sensitivity to fentanyl and changes in kinetics associated with pathophysiologic conditions and types of surgery create variability and make generalizations difficult (Johnson et al., 1984; Koren et al., 1984; Collins et al., 1985; Koehntop et al., 1986; Singleton et al., 1987). In the neonate, fentanyl clearance seems comparable with that of the older child or adult, whereas in the premature infant, fentanyl clearance is markedly reduced. In premature infants, fentanyl half-life was reported as 6 to 32 hours (Collins et al., 1985). In infants and children, fentanyl plasma concentrations were less than those in adults after similarly administered intravenous doses (milligrams per kilogram) (Fig. 7-30) (Singleton et al., 1987). These marked variations in kinetics reflect age differences and perhaps differences in anesthetics, surgeries, or duration of sampling.
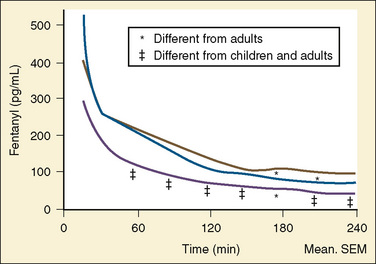
Fentanyl pharmacokinetics after continuous infusions for fewer than 24 hours in critically ill children have demonstrated increased steady-state volume of distribution (15.2 L/kg), prolonged terminal elimination half-life (24 hours), and normal clearances (Katz and Kelly, 1993). The pharmacokinetics after 48 hours of continuous fentanyl infusion in newborns were reported for 12 neonates. In these infants (mean gestational age, 32 weeks; mean weight, 1.88 kg; mean PNA, 6 ± 9 days), the volume of distribution was noted as 17 ± 9 L/kg, total body clearance was 1154 mL/kg per hour, and the half-life was 9.5 ± 2.6 hours (Santeiro et al., 1997). In addition, the relatively high total body clearance was noted to correlate with PNA, suggesting that hepatic blood flow increases with age. Gauntlett et al. (1988) found that fentanyl clearance increased with PNA, with most of the increase occurring by 2 weeks of age.
In a study of neonates who were not undergoing surgery, Saarenmaa et al. (2000) studied the fentanyl clearance in the first few days of life of 38 infants who were at 26 to 42 weeks’ gestation and had birth weights of 835 to 3550 g. This study reported a correlation of fentanyl clearances with gestational age and birth weight (Fig. 7-31).
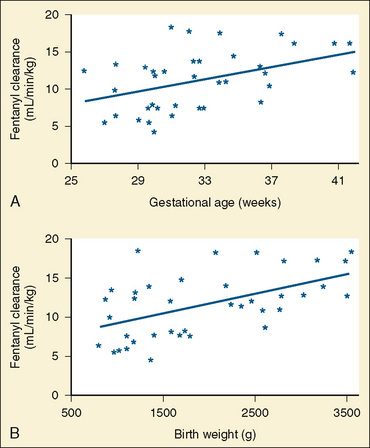
FIGURE 7-31 Plasma clearance of fentanyl correlates with gestational age and birth weight.
(From Saarenmaa E et al.: Gestational age and birth weight effects on plasma clearance of fentanyl in newborn infants, J Pediatr 136:767, 2000.)
Prolonged fentanyl infusions, however, were associated with tolerance. In this context, tolerance is defined as the need to increase drug doses to maintain a stable drug effect (e.g., an increased dose of fentanyl to achieve pain relief on day 7 vs. day 1 of use). In neonates sedated with fentanyl via continuous infusion while undergoing ECMO, Arnold et al. (1991) noted that the daily infusion rates and plasma concentrations required to keep the infant sedated increased over time. Although prolonged continuous infusions of fentanyl may increase the volume of distribution, prolong the elimination half-life of the drug, and consequently prolong recovery on discontinuation, the development of tolerance may minimize this pharmacologic consequence.
In addition to intravenous administration, fentanyl has been administered transmucosally as a means of providing sedation to children. The pharmacokinetics and bioavailability of oral transmucosal fentanyl citrate (OTFC) were studied by Streisand et al. (1991) using adult volunteers studied on three separate occasions (Fig. 7-32). Plasma levels of fentanyl were determined after intravenous, transmucosal, or gastrointestinal (oral) administration. Regardless of the mode of administration, the terminal elimination half-life was similar in all three groups (425 to 469 minutes). Compared with the oral group, peak plasma concentrations of fentanyl occurred earlier (22 vs.101 minutes) and were higher (30 vs. 1.6 ng/mL) in the OTFC groups. The bioavailability of OTFC was 50%, compared with 30% in the oral group. This difference in the bioavailability probably relates to the first-pass (hepatic extraction) effect observed with orally administered drugs (Streisand et al., 1991). In children, Dsida et al. (1998) and Wheeler et al. (2002) found less bioavailability of OTFC, with levels similar to the ones achieved by adults after oral administration (33% and 36% ± 1%). In a subsequent study comparing pharmacokinetic parameters of oral administration of the intravenous formulation of fentanyl and OTFC, Wheeler et al. (2004) found similar pharmacokinetic parameters. However, there was a high interpatient variability, especially in the early hours after oral administration of intravenous fentanyl; the pharmacokinetic variables for the orally administered intravenous formulation were peak plasma concentrations (Cmax: 1.83 ng/mL, standard deviation [SD] 1.19 ng/mL), time to Cmax (1.74 hours, SD 1.54 hours), apparent volume of distribution at steady state (17.5 L/kg, SD 7.20 L/kg), and apparent oral fentanyl clearance (3.33 L/kg, SD 2.25 L/kg−1 per hour−1). Therefore, as stated by the authors, this method of administration should be used with caution until further data are available.
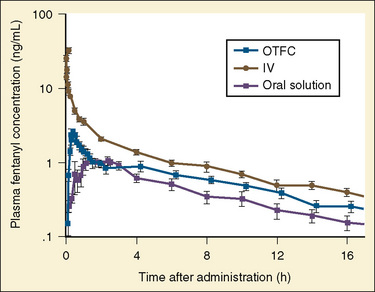
FIGURE 7-32 Plasma concentrations of fentanyl after oral transmucosal, intravenous, and oral administration.
(From Streisand JB et al.: Absorption and bioavailability of oral transmucosal fentanyl citrate, Anesthesiology 75:226, 1991.)
Intranasal administration of fentanyl has also been used to provide postoperative analgesia for pediatric patients (Galinkin et al., 2000; Manjushree et al., 2002). After 2 mcg/kg of intranasal fentanyl, Galinkin et al. (2000) noted the mean fentanyl concentrations at 10 and 34 minutes were 0.8 and 0.6 ng/mL, respectively. In a study comparing intranasal fentanyl with intravenous fentanyl, Manjushree et al. (2002) noted that onset time to analgesia after 1 mcg/kg of fentanyl was slower (13 minutes) for the intranasal route than for the intravenous route of administration (8 minutes).
Darwish and collaborators (2007), using a fentanyl buccal tablet of 400 mcg in healthy adult volunteers, have found predictable pharmacokinetics after single- and multiple-dose administration. In 2008, the FDA posted a safety alert for this formulation. This formulation is intended only for management of breakthrough pain in adult patients with cancer who are tolerant to opioid therapy. In pediatrics, the applicability for this formulation is unlikely given its high dose.
Sufentanil
Pharmacokinetic and pharmacodynamic studies of sufentanil were conducted in infants, children, and adults. In adults, compared with fentanyl, the smaller volume of distribution (2.48 L/kg) and high clearance rate (11.3 mL/kg per minute) of sufentanil contribute to its short terminal elimination half-life (149 minutes). Meuldermans et al. (1982) demonstrated that sufentanil is more protein bound (92%) than fentanyl (84%), and that pH affects protein binding. Decreasing pH from 7.4 to 7 increased protein binding by 28%; conversely, increasing pH from 7.4 to 7.8 decreased protein binding by 28%.
Clinical studies assessing the hemodynamic and endocrine stress response of sufentanil have been done in adults undergoing cardiopulmonary bypass (deLange et al., 1982; Sebel and Bovill, 1982). Sufentanil appears to block some of the stress responses to cardiac surgery. Stress-induced increases in antidiuretic hormone and growth hormone appear to be blocked before, during, and after cardiopulmonary bypass, whereas the catecholamines (norepinephrine, epinephrine, and dopamine) show a large surge during the bypass and postbypass periods (deLange et al., 1982; Bovill et al., 1983). In a double-blind study, Rosow et al. (1984) found the drugs fentanyl and sufentanil to be comparable with regard to hemodynamic stability.
The pharmacokinetic and pharmacodynamic effects of sufentanil in children have been studied. Hickey et al. (1984) compared the hemodynamic response of 5 and 10 mcg/kg of sufentanil to 50 to 75 mcg/kg of fentanyl in patients with complex congenital heart disease. Although heart rate and blood pressure changed slightly, they noted marked improvement in the patient’s oxygenation with both fentanyl and sufentanil. They concluded that both sufentanil and fentanyl were safe anesthetics in high doses, and that both agents favorably decreased pulmonary vascular resistance and thereby increased pulmonary blood flow and systemic oxygenation in patients with cyanotic heart disease. Davis et al. (1987) examined both the pharmacodynamics and pharmacokinetics of high-dose sufentanil (15 mcg/kg) and oxygen in infants and children undergoing cardiac surgery. Sufentanil provided marked hemodynamic stability after an infusion and during the stress periods of incision and sternotomy (Table 7-16). The hemodynamic responses to sufentanil were similar to those noted by Hickey et al. (1984) but differed from the increases in blood pressure and heart rate occurring after intubation, sternotomy, and incision observed in older children undergoing repair of their congenital heart defect (Moore et al., 1985).
TABLE 7-16 Hemodynamics during Sufentanil Anesthesia in Infants and Children Undergoing Open-Heart Surgery
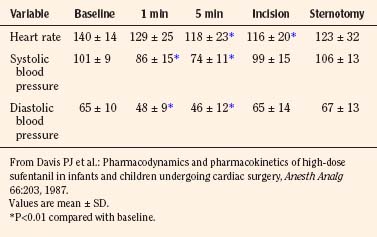
Greeley et al. (1987) investigated age-related changes in the pharmacokinetics of sufentanil in pediatric patients undergoing cardiothoracic surgery. They noted that sufentanil best fit a three-compartment model and that neonates had significantly smaller clearance rates, larger volumes of distribution at steady state, and longer elimination half-lives than infants, children, and adolescents (Table 7-17). The developmental pharmacokinetic changes of improved clearance and elimination for sufentanil were further substantiated in another report in which infants were studied within the first 8 days of life and then again at 3 to 4 weeks of age (Greeley and de Bruijn, 1988).
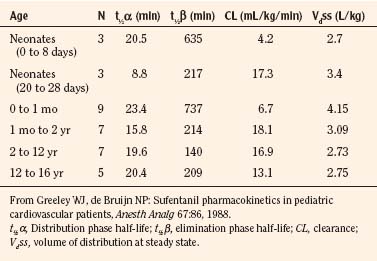
Guay et al. (1992) studied the pharmacokinetics of sufentanil in 20 healthy pediatric patients aged 2 to 8 years. After intravenous administration of 1 to 3 mcg/kg of sufentanil, the elimination half-life was 97 ± 42 minutes, the volume of distribution at steady state was 2.9 ± 0.6 L/kg, and the plasma clearance was 30.5 ± 8.8 mL/kg−1 per minute−1. It is unclear whether the doubling of the plasma clearance value in healthy children was a function of the study design or the patient’s underlying disease. A similar effect was noted for morphine in infants with and without cardiac disease (Lynn et al., 1998).
In addition to its use as an anesthetic agent, sufentanil has been used as a preanesthetic medication in children. Pharmacokinetic studies in adults after intravenous and intranasal administration show that the area under the curve from 0 to 120 minutes after intranasal dosing was 78% of that after intravenous injection (Helmers et al., 1989). By 30 minutes after drug administration, plasma sufentanil concentrations were identical for the two routes of administration.
The role of the kidneys in sufentanil elimination and metabolism has not been well defined. The effects of renal failure in sufentanil kinetics were assessed in adolescent patients with chronic renal failure (Davis et al., 1988). There was no statistical difference in apparent volume of distribution, elimination, and clearance between patients with renal failure and patients in a control group. However, there was a large amount of variability in both groups of patients. In patients with renal failure, sufentanil must be administered carefully on the basis of responses elicited in individual patients.
The pharmacodynamics of sufentanil were also evaluated in neurosurgical patients. The effects of opioids on intracranial pressure (ICP) and cerebral perfusion pressure have been controversial. In intubated patients with severe head injuries (less than 8 on the Glasgow Coma Scale), sufentanil administration was associated with an increase in ICP, a decrease in mean arterial blood pressure, and a decrease in cerebral perfusion pressure (Albanese et al., 1993). The effects of sufentanil in the EEGs of premature infants were reported by Nguyen and colleagues (2003). Bolus injection and continuous infusion increased EEG discontinuity, decreased burst suppression, and increased interburst intervals.
In adult patients undergoing nonintracranial neurosurgical procedures, Trindle et al. (1993) noted that cerebral blood flow velocity (as assessed by transcranial Doppler) increased after sufentanil infusion. This increase in velocity was similar for equipotent doses of fentanyl (Trindle et al., 1993).
In a study of adult patients with head trauma, Scholz et al. (1994) noted that sufentanil bolus (2 mcg/kg), combined with a sufentanil continuous infusion (150 mcg/hr) and midazolam continuous infusion (9 mg/hr), resulted in decreases in both ICP and mean arterial pressure. Perfusion pressure was noted to be stable.
Alfentanil
Alfentanil, a potent, short-acting analog of fentanyl, is rapidly distributed to the brain and central organs and then rapidly redistributed to more remote sites. It is about one fourth as potent as fentanyl and has one third the duration of action. After a single bolus injection, the drug’s decreased volume of distribution results in a significantly shorter elimination half-life. Its low lipid solubility allows less penetration of the blood-brain barrier. The concentration in brain tissue is markedly less than that in plasma. The duration of narcotic effect appears to be governed by redistribution and elimination. The redistribution principle is most important after a small single-dose infusion, whereas elimination determines the effect of a large single bolus, multiple small-bolus infusions, or a continuous infusion. Alfentanil is metabolized in the liver by oxidative N-dealkylation and O-demethylation in the CYP3A4 system (Yun et al., 1992). The pharmacologically inactive metabolites are excreted in the urine, with the major metabolite being noralfentanil (Camu et al., 1982). Alfentanil metabolism is catalyzed by CYP3A3/4 and CYP3A5 (Klees et al., 2005). Interindividual differences in the expression of this cytochrome and its susceptibility to inducers and inhibitors may account for the clinical variability in alfentanil kinetics and dynamics (Kharasch and Thummel, 1993). Although gender differences in CYP activity can affect drug metabolism, Kharasch et al. (1997a), in a study of young women, could find no differences in alfentanil clearance on different days of the menstrual cycle. Differences in CYP activity can markedly influence the pharmacokinetics of alfentanil, specifically its context-sensitive half-time. Using normal, low, and high CYP3A4 activity, Kharasch et al. (1997b) have postulated through computer simulations that alfentanil can behave similarly to remifentanil (high CYP3A4 activity) or fentanyl (low CYP3A4 activity) (Fig. 7-33).
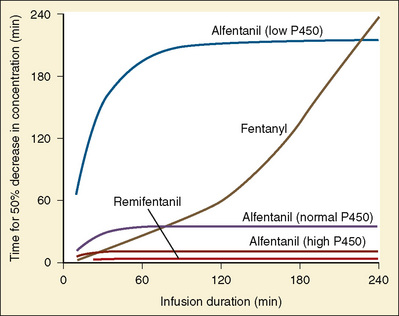
Protein binding has a significant influence on the pharmacokinetics of alfentanil. Alfentanil is 88% to 95% protein bound in the plasma and is independent of concentration and blood pH. The plasma protein most responsible for binding of alfentanil is α1-acid glycoprotein. In adults, changes in the binding and in the pharmacokinetics of alfentanil occur during and after cardiopulmonary bypass (Hug, 1984). Disease states, including end-stage kidney or liver failure, can alter protein binding of opioids in children. Davis et al. (1989b) studied the effects of liver disease and kidney disease on the binding characteristics of alfentanil. Compared with healthy children, patients with kidney disease had a significant decrease in protein binding (89.2% ± 5.4% vs. 93.1% ± 3.2%), an increase in α1-acid glycoprotein concentration (108.8 ± 44.3 vs. 71.8 ± 30.7 mg/dL), and no change in albumin concentration (3910 ± 754 vs. 4555 ± 524 mg/dL), whereas patients with liver disease had a significant decrease in protein binding (85.9% ± 6.2% vs. 93.1% ± 3.2%), no change in a 1-acid glycoprotein concentration (65.8 ± 31.8 vs. 71.8 ± 30.7 mg/dL), and a decrease in albumin concentration (3045 ± 1255 vs. 4555 ± 524 mg/dL). Alfentanil binding has been studied in adult burn patients and noted to be increased from 90% to 94% protein bound (Macfie et al., 1992). Because alfentanil is highly protein bound, even small changes in the drug’s free fraction could have marked pharmacodynamic effects in patients with kidney or liver failure.
The pharmacokinetics of alfentanil have been studied in both adults and children, but limited information is available for children of different ages. The limited, age-related, developmental pharmacokinetic data for alfentanil are presented in Table 7-18. In a study by Meistelman et al. (1987), children aged 5 (± 1.1 years) had significantly smaller volumes of distribution and shorter elimination half-lives but similar clearance values compared with those young adult patients aged 31 (± 4 years). Goreskey et al. (1987) noted no differences in volume of distribution, elimination half-life, or clearance in infants aged 3 to 12 months compared with children aged 1 to 14 years. On the other hand, Roure et al. (1987) noted that children aged 33 (± 18) months had faster clearance rates and elimination half-lives but similar volumes of distribution compared with those of adults. As Maitre et al. (1987) noted in population studies of alfentanil pharmacokinetics in adults, differences in the pharmacokinetic profiles among the pediatric studies may be related to the large interpatient variability of alfentanil. Davis et al. (1989a) have studied the pharmacokinetics of a single bolus of alfentanil in newborn premature infants and older children. In their study, newborn premature infants had considerably longer elimination half-lives (525 ± 305 vs. 60 ± 11 minutes), slower clearance rates (2.2 ± 2.4 vs. 5.6 ± 2.4 mL/kg per minute), and larger volumes of distribution (1 ± 0.39 vs. 0.48 ± 0.19 L/kg) than those observed in the older children (Fig. 7-34).
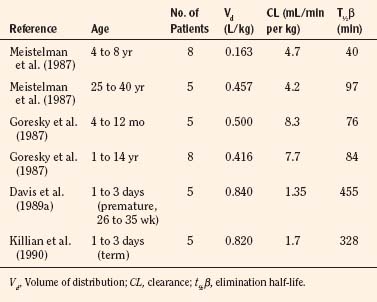
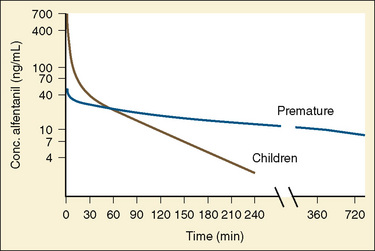
In a report on the influence of gestational age on the pharmacokinetics of alfentanil in neonates, Killian et al. (1990) noted no changes in alfentanil kinetics between preterm and term infants. Wiest et al. (1991) studied the kinetics of alfentanil in neonates after a loading dose and variable continuous infusion route. Noncompartmental analysis revealed a clearance rate of 3.24 mL/kg per minute, a volume of distribution of 0.54 L/kg, and an elimination half-life of 4.1 hours. However, they noted an effect of alfentanil plasma concentration on plasma clearance, suggesting dose-dependent pharmacokinetics in these ill neonates.
The effects of renal failure and cirrhosis on alfentanil kinetics were studied in adult and in pediatric patients. Chauvin et al. (1987a) have studied the pharmacokinetics of alfentanil in adult patients with chronic renal failure. The clearance and half-life values for alfentanil were similar in patients with renal failure and in control patients, but the steady-state volumes of distribution of alfentanil were significantly greater in patients with renal disease than in control patients. However, when the kinetic values for alfentanil were corrected for protein binding, the steady-state volumes of distribution and rates of clearance of unbound drug were similar in both groups of patients.
The effects of cirrhosis on alfentanil pharmacokinetics in adults were demonstrated by Ferrier et al. in 1985. Patients with cirrhosis have lower total plasma clearance (1.60 vs. 3.06 mL/kg per minute) and prolonged terminal elimination half-life (219 vs. 97 minutes) but a similar volume of distribution (0.390 vs. 0.355 L/kg) as those values of patients in a control group.
In contrast to the studies in adults, the pharmacokinetics of alfentanil in children with cholestatic hepatitis or end-stage kidney disease who are about to undergo either liver or kidney transplantation appear to be unaffected by the disease process (Davis et al., 1989b). Whether this difference is related to age or to the underlying pathophysiology of the disease states remains unanswered.
As do other opiates, alfentanil produces a shift to the right in the ventilatory response curve. Although this shift is dose dependent, the ventilatory depressant effects dissipate by 30 to 50 minutes after the dose is given (Kay and Pleuvry, 1980; Kay and Stephenson, 1980).
Goldberg et al. (1992) noted that in healthy adult patients, prolonged alfentanil administration sometimes resulted in arterial oxygen desaturation and depression of the hypercapneic respiratory drive even though the patients were easily arousable. Muscle rigidity can occur with rapid-acting opiates such as fentanyl, sufentanil, and alfentanil. Pokela et al. (1992) have reported that rigidity, which requires changes in ventilator settings, occurs in neonates after alfentanil administration.
The cardiovascular effects of alfentanil were assessed during both low- and high-dose infusions (Kay and Pleuvry, 1980; Kay and Stephenson, 1980). At doses of 150 mcg/kg, heart rate, mean arterial pressure, and systemic vascular resistance were noted to decrease. Pulmonary capillary wedge pressure, pulmonary vascular resistance, right atrial pressure, and pulmonary artery pressure increased slightly (Kramer et al., 1983).
The neuroendocrine stress response with alfentanil has been studied in adults. Alfentanil incompletely suppresses the stress response. High-dose alfentanil can blunt the growth hormone, antidiuretic hormone, and cortisol responses to bypass. Epinephrine and norepinephrine concentrations are increased with the onset of bypass (deLange et al., 1982; Stanley et al., 1983).
Meretoja and Rautiainen (1990) noted that in children aged 1 month to 2 years, oral flunitrazepam premedication and alfentanil bolus of 20 mcg/kg followed by a continuous infusion of 0.5 mcg/kg per minute provided adequate sedation for patients spontaneously breathing room air who were undergoing cardiac catheterization. In these patients, hemodynamic variables changed less than 11%.
In adults, Ausems et al. (1986) have defined the Cp50 values of alfentanil for various surgical and anesthetic stimulations (Fig. 7-35). Using these adult Cp50 plasma values, initial bolus and infusion rates can be estimated for children.
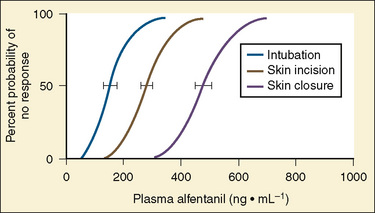
Remifentanil
Remifentanil is the hydrochloride salt of 3-[4-methoxycarbonyl]-4-[(1-oxopropyl)phenylamino]-1-piperidine] propanoic acid methyl ester. Because of its ester linkage, remifentanil is susceptible to metabolism by blood and tissue esterases. Its primary metabolic pathway is through de-esterification to form a carboxylic acid metabolite, which is only one 300th to one 1000th the potency of the parent compound. In adult studies, the pharmacokinetic profile of remifentanil is best described by a biexponential decay curve, with a small volume of distribution (0.39 L/kg), a rapid distribution phase (0.94 minute), and an extremely short elimination half-life (10 minutes) (Egan et al., 1993; Glass et al., 1993; Westmoreland et al., 1993).
For opioids, which undergo organ elimination, the neonatal profile of opioids demonstrates prolonged clearances, large volumes of distribution, and markedly prolonged half-lives. However, in neonates remifentanil has a rapid clearance, a large volume of distribution, and a half-life that does not change with age. In an age-related study of remifentanil pharmacokinetics, Ross et al. (2001) noted that the volume of distribution was largest in the infants younger than 2 months (mean value of 452 mL/kg) and decreased to mean values of 223 to 308 mL/kg in the older patients. There was a more rapid clearance in the infants younger than 2 months (90 mL/kg per minute) and infants aged 2 months to 2 years (92 mL/kg per minute) than in the other groups (mean of 46 to 76 mL/kg per minute). The half-life was similar in all age groups, with mean values of 3.4 to 5.7 minutes. Because the redistribution phase and elimination half-life are so rapid, a bolus injection before a continuous infusion of remifentanil is usually unnecessary.
Another unique feature of remifentanil kinetics in children is that its pharmacokinetic profile is unchanged by cardiopulmonary bypass. For opioids, which undergo organ elimination, cardiopulmonary bypass prolongs drug clearance, increases volume of distribution, and increases half-life. The pharmacokinetic profile of remifentanil appears to be unaffected by cardiopulmonary bypass (Fig. 7-36) (Davis et al., 1999).
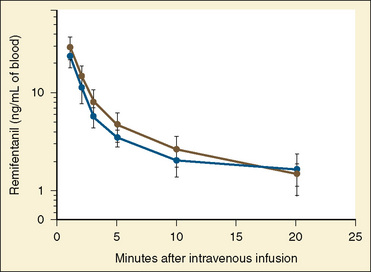
The pharmacodynamics of remifentanil were studied in children and infants. Multiple case reports of remifentanil use in neonates and infants suggest its usefulness (Wee and Stokes, 1999; Chiaretti et al., 2000; German et al., 2000; Dönmez et al., 2001; Foubert et al., 2002). In a multicenter trial of infants younger than 2 months who were undergoing pyloromyotomy, Galinkin et al. (2001) and Davis et al. (2001) noted that remifentanil provides stable hemodynamic conditions and that new onset of postoperative apnea, as detected by pneumograms, did not occur with remifentanil.
Pharmacodynamic studies suggest that the short duration of remifentanil in older children can be used to promote faster emergence times (Davis et al., 1997, 2000). As with other opioids, the issue of tolerance is a concern with remifentanil. In a systematic review of randomized controlled trials comparing remifentanil with other opioids in adult patients, Komatsu et al. (2007) found a 40% additional need for postoperative analgesics (RR 1.36, 95%; CI 1.21-1.53); confirming earlier studies by Guignard et al. (2000) and Vinik and Kissin (1998). In pediatrics Crawford et al. (2006) demonstrated increased cumulative morphine consumption during the first 24 hours after spine instrumentation, in patients who had remifentanil infusion when compared with patients who received morphine intraoperatively. In a study done on cultured rat dorsal horn neurons exposed to different levels of remifentanil comparable with the ones used in clinical practice, Zhao and Joo (2008) found an increase in NMDA responses that is consistent with remifentanil-induced hyperalgesia and tolerance.
The incidence of postoperative nausea and vomiting appears to be similar to the incidence seen with other opioids (Eltzschig et al., 2002; Komatusu et al., 2007). A higher incidence of postoperative shivering is described in patients receiving remifentanil (RR 2.15, 95%; CI 1.73-2.69) when compared with alfentanil, fentanyl, and sulfentanil (Komatsu et al., 2007).
Methadone
Methadone is a synthetic opioid analgesic. It is a racemic mixture with the l-isomer that is 10 to 50 times more potent than the d-isomer. Methadone has an oral bioavailability of 80% with a range of 41% to 99%. It is 60% to 90% protein bound, and α1-acid glycoprotein is the main determinant of the free fraction of methadone. After an intravenous dose in adults, the pharmacokinetic profile fits a two-compartment model with a distribution half-life of 6 minutes and an elimination half-life of 35 hours (Gourlay et al., 1982). Findings of the pharmacokinetics of methadone in children suggest that it has a large volume of distribution (7.1 L/kg), a high plasma clearance (5.4 mL/kg per minute), and a long half-life (19.2 hours) (Berde et al., 1991).
Methadone metabolism clearance and disposition have been thought to be governed by hepatic CYP3A4 activity. However, Kharasch et al. (2009), in a set of studies with adult volunteers, have shown that methadone disposition and clearance are unchanged despite profound inhibition of the CYP3A4 and that oral absorption and bioavailability are not affected by glycoprotein transporter activity. Little information is available with respect to methadone’s pharmacokinetic profile in end-stage liver or kidney failure. Urinary pH is another important determinant of the elimination half-life of methadone. Acidifying the urine markedly decreases the half-life of methadone and increases its renal clearance (Bellward et al., 1977).
Although methadone has become a cornerstone therapy for opiate dependence and the management of chronic neuropathic and cancer pain, clinical use in children is somewhat limited. In a randomized, double-blind study of morphine and methadone, Berde et al. (1991) noted that the children receiving methadone perioperatively had significantly less opioid requirements in the immediate postoperative period and better pain scores in the entire postoperative period than did children receiving equipotent doses of morphine. However, no differences in opioid requirements were found after the immediate postoperative period. Also, no differences in sedation scores were described; however, the maximum time of methadone administration was 48 hours. Recommended doses of perioperative methadone include a loading dose of 0.1 to 0.2 mg/kg with 0.05 mg/kg supplemental dose every 4 to 12 hours for a maximum of 2 to 3 days to avoid the possibility of excessive sedation secondary to drug accumulation as a result of the prolonged elimination half-life of methadone.
Among opioid analgesics, methadone is unique as a potent blocker of the delayed rectifier potassium ion channel. This results in QT prolongation and can produce torsade de pointes ventricular tachycardia in susceptible individuals and may explain the sudden death associated with its use (Andrews et al., 2009). The effects of methadone on the QT interval may be enhanced by hypokalemia, drugs that increase the QT interval such as erythromycin and ondansetron, or by CYP 3A4 inhibitors such as fluoxetine, fluconazole, valproate, and clarithromycin (Ehret et al., 2006).
Tramadol
Tramadol is a centrally acting agent with two distinct mechanisms of action: opioid and nonopioid. Tramadol acts as an opioid agonist. Tramadol also acts on monoamine systems to inhibit the reuptake of norepinephrine and serotonin. Tramadol is structurally related to codeine. It is metabolized by liver CYP2D6; about 0.8% of the white population is deficient in this enzyme. Its metabolite, O-demethyl metabolic intermediate, has some analgesic effect. Tramadol is a stereoisomer. The pharmacokinetic profile of the stereoisomer was reported by Bressolle et al. in 2009. The (+)-stereoisomer form provides similar analgesia as the racemic form. The bioavailability of tramadol in adults is 68%, and it is 20% protein bound. Tramadol is metabolized by the 2D6, 2B6, and 3A4 P450 cytochromes. It has an active metabolite with more affinity for the μ receptor than the parent compound. In 14 children aged 1 to 12 years, the intravenous tramadol pharmacokinetic profile demonstrated a volume of distribution, clearance, and half-life of 3.1 L/kg, 6.1 mL/kg per minute, and 6.4 hours, respectively. In the same study, the kinetics of tramadol after caudal administration revealed a volume of distribution, clearance, and half-life of 2.06 L/kg, 6.6 mL/kg per minute, and 3.7 hours, respectively. Of note was that the ratio of caudal and intravenous AUC was 0.83, suggesting there is extensive systemic absorption of caudal tramadol (Murthy et al., 2000) (Fig. 7-37).
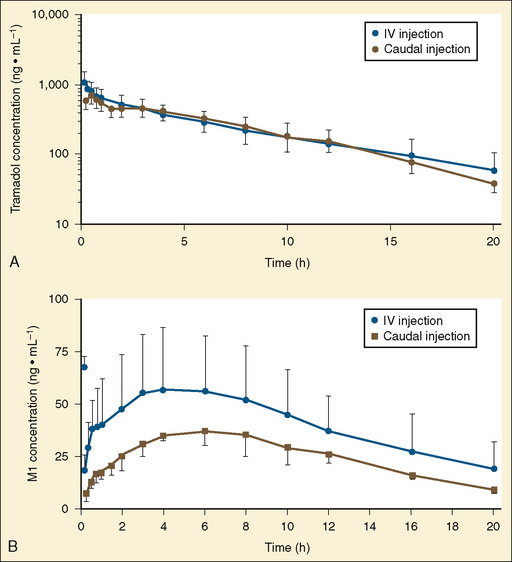
The clinical efficacy of tramadol has been reviewed in adults and children by Scott and Perry (2000); in summary, the overall efficacy of tramadol is comparable with equianalgesic doses of parenteral opioids. In children, tramadol has been administered orally, intravenously, intramuscularly, and caudally. Its major advantage is its lack of respiratory depression after its administration (Scott and Perry, 2000; Ozcengiz et al., 2001; Viitanen and Annila, 2001; Finkel et al., 2002; Engelhardt et al., 2003; Rose et al., 2003). Doses are presented in Box 7-1.
Hydrocodone
In a report comparing oxycodone with hydrocodone in 67 patients older than 12 years of age, with a mean age of 35 years, who were treated in an emergency department after acute fractures, oxycodone 5 mg and hydrocodone 5 mg both combined with acetaminophen gave equivalent pain relief at 30 and 60 minutes after medication. Side effects were similar, except the hydrocodone group showed a higher incidence of constipation (Marco et al., 2005). Litkowski (2005) compared analgesia from oxycodone with ibuprofen, oxycodone with acetaminophen, and hydrocodone with acetaminophen with placebo after third molar extraction in a multicenter trial. There were 249 patients with a mean age of 19 years, and pain relief was equivalent in the acetaminophen groups but less than in the group that received oxycodone with ibuprofen. Onset of pain relief was also faster in the group that received oxycodone with ibuprofen.
The only study of hydrocodone use in children found in several online searches compared 60 children (of a planned 94) receiving either rofecoxib or hydrocodone with acetaminophen (dosed for 0.2 mg/kg hydrocodone every 6 hours) after elective tonsillectomy. Pain was assessed at 6-hour intervals initially by recovery staff and then by parents. Pain at rest was similar between the two groups (3 to 5 on a 10-point scale), but with swallowing, the group that received rofecoxib had scores that were lower (2 to 4 vs. 4 to 6 in hydrocodone group). Side effects were not compared, because the number of patients was insufficient when the study was stopped early because of a recall of rofecoxib (Bean-Lijewski et al., 2007).
Hydrocodone has been used in the past in cough-suppressant medications because of its strong antitussive effects, but now it is rarely used, partially because reports about adverse effects, including death, have been published (Morrow and Faris, 1987).
Oxycodone
Oxycodone is a semisynthetic opioid analgesic (6-deoxy-7, 8-dihydro-14-hydroxy-3-O-methyl-6-oxomorphine) that was introduced into clinical practice in 1917. It is well absorbed after oral administration, and its bioavailability ranges between 60% to 80%, three times higher than morphine (with an oral bioavailability of 20%). N-demethylation to noroxycodone is the major metabolic pathway. A smaller fraction is metabolized by O-demethylation to oxymorphone. A fraction of both noroxycodone and oxymorphone are further metabolized to noroxymorphone (Kalso, 2005).
Metabolites show variable pharmacologic activity. Oxymorphone is an active metabolite with higher μ-opioid affinity than the parent compound. However, its low plasma concentration suggests a minor role in the analgesic response to oxycodone. Both noroxycodone and noroxymorphone are inactive metabolites. Excretion is mainly by renal elimination. Ten percent is eliminated as unchanged oxycodone; 50% is eliminated as noroxycodone and oxymorphone; and 18% is eliminated as noroxymorphone (Olkkola and Hagelberg, 2009).
In adults, after intravenous administration, the maximum concentration is reached after 25 minutes with a t½ of 2 to 3 hours and clearance values between 15 and 18 mL/min−1 per kg−1 (Pöhyiä et al., 1991). In children aged 2 to 10 years, mean clearance is similar to adult values at 15.2 (with a range of 8.5 to 21.2) mL/min−1 per kg−1 (Olkkola et al., 1994). For infants younger than 1 week of age, clearance values are lower, with a median value of 9.9 (and a range of 2.3 to 17.2) mL/min−1 per kg−1. Clearance increases with age, reaching adult values by age 2 to 6 months (Pokela et al., 2005). However, high interindividual variability in clearance is described.
Other forms of administration have been used in children. Kokki et al. (2004) studied the pharmacokinetic parameters of 0.1 mg kg−1 oxycodone administered intramuscularly, orally, and transmucosally and compared them with the intravenous form of administration. The mean (SD) t½ß were similar between groups: 163 (26) min for IV administration, 150 (39) min for IM, 150 (44) min for mucosal and 147 (61) for oral administration. Oral and mucosal administration showed greater interindividual variability (Kokki et al., 2004). In a subsequent study, Kokki et al. (2006) used a higher dose of 0.2 mg/kg that was given transmucosally and reported better bioavailability than previously described. However, the median noroxycodone-to-oxycodone AUC ratio reported was 0.78, showing significant hepatic metabolism and suggesting that children probably swallowed some of the oxycodone at the time of administration (Kokki et al., 2006). The recommended dose for intravenous, oral, and intramuscular administration in children is 0.1 mg kg−1 (Kokki et al., 2004). For transmucosal administration a dose of 0.2 mg kg−1 is suggested, but it is still not clear if part of the increase in availability is because of oral absorption.
Controlled-release (CR) oxycodone is recommended for chronic pain treatment in adults. There are no pharmacokinetic studies on CR oxycodone in children. From adult studies it is known that CR oxycodone is absorbed in a biexponential way with a rapid phase that has a mean half-life of 37 minutes and a slow phase with a mean half-life of 6.2 hours (Mandema et al., 1996). The most significant difference from the normal-release form is the time for maximum concentration, which is reported as 3.2 (SD 2.2) hours for the CR form and 1.4 (SD 0.7) hours for the normal-release form (Reder et al., 1996; Benzinger et al., 1997). Czarnecki and colleagues (2004) studied the use of CR oxycodone for postoperative pain treatment after spinal fusion in children 10 to 19 years of age. In this study, the mean initial dose used was 1.24 mg/kg−1 per day−1 and the average use 13.3 days. Even though the authors did not report any adverse events and suggested that CR oxycodone is a plausible analgesic choice, there are no studies in children and it is not recommended (per manufacturer) for use in pediatrics. Additionally, there is increasing concern about the abuse of CR oxycodone, especially in adolescents (Cicero et al., 2005; Rogers and Copley, 2009).
Oxycodone is a μ-opioid receptor agonist with equianalgesic potency to intravenous morphine, despite the fact that its affinity to the μ-opioid receptor is over 20 times less than morphine. It has been suggested that oxycodone’s potency is explained by higher CNS concentration caused by active transport across the BBB (Boström et al., 2006). In adult studies oxycodone showed a similar analgesic profile and incidence of side effects when compared with morphine, except for smaller changes in blood pressure and less sedation (Kalso et al., 1991; Silvasti et al., 1998). Also, in adults it has been shown that side effects are caused by the parent compound and not to metabolites (Lalovic et al., 2006). There is only one study in children that looks at the ventilatory effects of intravenous oxycodone. In this study Olkkola et al. (1994) suggested that oxycodone produced greater ventilatory depression than morphine. Other authors believe it has the same ventilatory effects as morphine in this population (Kalso, 1995).
In patients with renal and hepatic dysfunction, some extra considerations should be taken. Patients with severe hepatic dysfunction show impaired oxycodone elimination with 75% decreased plasma clearance, 50% increased volume of distribution, and an increased elimination half-life of from 3 to 14 hours (Tallgren, 1997). Patients with renal dysfunction show an increased volume of distribution and a prolonged elimination half-life as a result of reduced clearance (Kirvelä et al., 1996).
Codeine
Codeine (7,8-didehydro-4,5-epoxy-3-methoxy-17-methyl-morphinan-6 alpha-ol phosphate) is considered a weak opioid according to the World Health Organization’s three-step analgesic ladder and is recommended for the treatment of mild to moderate pain. In children, codeine has been administered by oral, rectal, and intramuscular routes. It is not used in the intravenous form because of reported cases of severe hypotension (Parke et al., 1992). The recommended dose is 1 mg/kg to a maximum dose of 3 mg/kg per day. It is often used in combination with other analgesics such as acetaminophen, aspirin, and nonsteroidal antiinflammatory drugs.
Despite the widespread use of codeine in children, there are very few studies related to codeine pharmacokinetics in this age population. In adults, after oral administration codeine peak plasma concentration is reached after 60 minutes, compared with only 30 minutes after intramuscular administration. Terminal half-life is 3 to 3.5 hours, the volume of distribution is 3.6 l kg−1, and the clearance rate 0.85 L/min−1 (Williams et al., 2001). In healthy adult volunteers, rectal and oral administration show good systemic bioavailability with reported values of 90% (Moolenaar et al., 1983). However, when administered in the postoperative period, values after rectal administration are less predictable, with systemic availability reported between 12% and 84% (Persson et al., 1992).
McEwan (2000) studied children between 3 months and 12 years of age and reported peak plasma values at 30 minutes after intramuscular and oral administration of codeine. Additionally, higher peak levels are described after intramuscular administration, which seem to correlate with better analgesia at 30 minutes. However, this effect is not persistent, and both routes showed similar performances after 1 hour. Codeine is metabolized in the liver by three different pathways: glucuronidation to codeine 6-glucuronide (the principal route), N-demethylation to norcodeine (10% to 20%) and O-demethylation to morphine (5% to 15%). Five to 15% of codeine is excreted unchanged in urine (Williams et al., 2001).
In a study of infants (0 to 10 months of age) and young children (3 to 4 years of age), Quiding et al. (1992) found that after administration of rectal codeine, the terminal half-life of codeine and morphine is 2.5 hours in infants; in children, the half-lives are 2.5 hours for codeine and 1.6 hours for morphine. Additionally, they found that AUC of morphine as a percentage of AUC of codeine ranged from 0% to 0.3%, similar to those previously described in adults; the authors concluded that infants at 6 months of age already have O-demethylation activity similar to that of adults (Quiding et al., 1986).
It is generally accepted that codeine’s analgesic efficacy is explained by its conversion to morphine (Desmeules et al., 1991; Poulsen et al., 1996). O-demethylation to morphine is dependent on the enzyme cytochrome P450 (CYP2D6). The CYP2D6 gene is highly polymorphic, explaining wide levels of enzyme activity between individuals. There are four described phenotype levels of activity: poor metabolizers (PMs), intermediate metabolizers (IMs), extensive metabolizers (EMs), and ultrarapid metabolizers (UMs). The clinical implication of this variability is the unpredictability of analgesia and side effects of this medication. PMs show no analgesic effect, whereas UMs can show profound levels of analgesia with marked and potentially dangerous side effects (Poulsen et al., 1996; Ciszkowski et al., 2009). An example of this is found in a report by Voronov and colleagues (2007) on apnea and subsequent brain injury after administration of oral codeine in a child (of African origin) who was subsequently found to be an UM. The estimated incidence of UMs varies among racial and ethnic groups. It can be as low as 1% in the European, Caucasian, and Chinese populations, or up to 29% in Ethiopians (De Leon, 2008, Stamer and Stuber, 2008).
Additionally, reports of randomized clinical trials in children evidenced lower analgesic efficacy of codeine when compared with oxycodone and higher failure rates when combined with acetaminophen and compared with ibuprofen (Charney et al., 2008; Drendel et al., 2009). There are two systematic reviews in adults that show only a small benefit of adding codeine to acetaminophen (de Craen et al., 1996; Moore et al., 1997). These reports, plus the potential development of severe side effects in UMs, question the use of codeine when more predictable medications are available.
Opioid Agonist-Antagonists
Nalbuphine
Nalbuphine is a phenanthrene opioid derivative, structurally similar to oxymorphone and naloxone. It has an analgesic potency equivalent to morphine with a respiratory depressant and analgesic ceiling effect between 150 and 300 mcg/kg (Beaver and Feise, 1978; Romagnoli and Keats., 1980; Gal and DiFazio, 1982; Julien, 1982). After intravenous administration in adults, it has an elimination half-life of 135.5 ± 55.4 minutes with a clearance of 217.6 mL/min (Sears et al., 1987). After intramuscular and subcutaneous administration, bioavailability is high, with mean values of 83% and 79%, respectively. Absorption is rapid with a Cmax of 59.96 ± 9.52 ng/mL and 56.14 ± 14.48 ng/mL after intramuscular and subcutaneous injection of 20 mg in adults (Lo et al., 1987). After oral administration the bioavailability is low at 11.8% because of the high clearance rate (Aitkenhead et al., 1988). In children the distribution is similar to adults, but the elimination half-life is shorter (57 ± 14 minutes) (Jaillon et al., 1989). In a study in children receiving 0.3 mg/kg of nalbuphine rectally, the maximum plasma concentration achieved was 24 ± 15 ng/mL in a mean time of 25 ± 11 minutes with an elimination half-life of 162 ± 42 minutes (Bessard et al., 1997).
Nalbuphine has been used for treatment of opioid-induced pruritus. In adults, studies show similar effects to naloxone (Penning et al., 1988; Kendrick et al., 1996). However, one study in pediatrics did not have a similar finding, suggesting that nalbuphine may not be as effective in treating opioid-induced pruritus in children (Nakatsuka et al., 2006). Nalbuphine has also been used to decrease the incidence of emergence delirium after general anesthesia with sevoflurane as the sole agent for nonpainful procedures in children. Dalens et al. (2006) report that administration of a single dose of 0.1 mg/kg of nalbuphine before extubation decreases by 30% the development of emergence delirium without prolonging the postanesthesia recovery time when compared with placebo. The use of nalbuphine as a sole agent for postoperative pain treatment is scarce. There are two studies describing its use with positive reports after tonsillectomy and adenoidectomy procedures (Habre and McLeod, 1997; Van den Berg et al., 1999). However, the ceiling analgesic effect makes its use difficult for moderate to severe pain treatment.