Pediatric and Geriatric Hematology
After completion of this chapter, the reader will be able to:
1. Describe the major differences in normal complete blood count values, reticulocytes, and nucleated red blood cells (NRBCs) in preterm newborns, full-term newborns, infants, children, adults, and elderly adults.
2. Explain the cause of physiologic anemia of infancy and the time frame in which it is expected.
3. Describe normal RBC morphology in neonates.
4. Compare the RBC survival in preterm and full-term infants with that in adults.
5. Recognize and list factors affecting sample collection that can have an impact on the interpretation of hematology values in newborns.
6. Compare and contrast the morphology of lymphocytes in children and in adults and indicate reasons for differences.
7. Describe the general association between age and hemoglobin levels in the elderly.
8. Explain the clinical significance of anemia in the elderly.
9. Name the two most common anemias seen in the elderly and their common causes in this age group.
10. List other anemias affecting elderly individuals.
11. Compare the frequency of acute lymphoblastic leukemias and chronic lymphocytic leukemias in children and the elderly.
12. Compare the hemostatic systems of newborns, children, adults, and the elderly, including the risk of bleeding and thrombosis.
13. Name malignancies of hematologic cells that are more common in the elderly than in other age groups.
Case Study
After studying this chapter, the reader should be able to respond to the following case study:
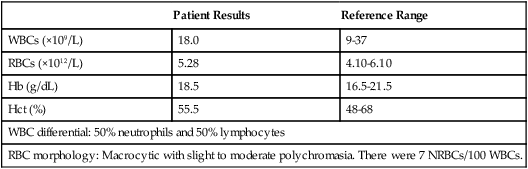
| Patient Results | Reference Range | |
| WBCs (×109/L) | 18.0 | 9-37 |
| RBCs (×1012/L) | 5.28 | 4.10-6.10 |
| Hb (g/dL) | 18.5 | 16.5-21.5 |
| Hct (%) | 55.5 | 48-68 |
| WBC differential: 50% neutrophils and 50% lymphocytes | ||
| RBC morphology: Macrocytic with slight to moderate polychromasia. There were 7 NRBCs/100 WBCs. | ||
Pediatric Hematology
Dramatic changes occur in the blood and bone marrow of the newborn infant during the first hours and days after birth, and there are rapid fluctuations in the quantities of all hematologic elements. Significant hematologic differences are seen between term and preterm infants and among newborns, infants, young children, and older children. This chapter reviews neonatal hematopoiesis, which is discussed in detail in Chapter 7, as a prerequisite to understanding the changes in pediatric hematologic reference ranges, morphologic features, and age-specific physiology.
Prenatal Hematopoiesis
Hematopoiesis, the formation and development of blood cells from stem cells, begins in the first weeks of embryonic development and proceeds systematically through three phases of development: mesoblastic (yolk sac), hepatic (liver), and myeloid (bone marrow). The first cells produced in the developing embryo are primitive erythroblasts formed in the yolk sac. These cells are particularly interesting because they do not develop into mature erythrocytes. They are erythropoietin insensitive and have the ability to differentiate into other cell lines upon exposure to appropriate growth factors.1–6
By the second month of gestation, hematopoiesis ceases in the yolk sac, and the liver becomes the center for hematopoiesis, reaching its peak activity during the third and fourth gestational months. Leukocytes of each cell type systematically make their appearance. In week 9 of gestation, lymphocytes can be detected in the region of the thymus. They are subsequently found in the spleen and lymph nodes. During the fourth and fifth gestational months, the bone marrow emerges as a major site of blood cell production, and it becomes the primary site by birth (see Chapter 7).1–6
Hematopoiesis of the Newborn
Hematopoietically active bone marrow is referred to as red marrow, as opposed to inactive yellow (fatty) marrow. At the time of birth, the bone marrow is fully active and extremely cellular, with all hematopoietic cell lineages undergoing cellular differentiation and amplification. In addition to the mature cells in fetal blood, there are significant numbers of circulating progenitor cells in cord blood.7,8
In a full-term infant, hepatic hematopoiesis has ceased except in widely scattered small foci that become inactive soon after birth.1–6 Postembryonic extramedullary hematopoiesis is abnormal in a full-term infant. In a premature infant, foci of hematopoiesis are frequently seen in the liver and occasionally observed in the spleen, lymph nodes, or thymus.1–10
Gestational Age and Birth Weight
Hematologic values obtained from full-term infants generally do not apply to preterm infants, and laboratory values for low-birth-weight preterm infants differ from ranges for extremely-low-birth-weight “micropreemies” (24 to 26 weeks’ gestation).11 A full-term infant is defined as an infant who has completed 37 to 42 weeks of gestation. Infants born before 37 weeks’ gestation are referred to as premature or preterm, whereas infants delivered after 42 weeks are considered postterm.11,12 Infants can be subcategorized further by birth weight as (1) appropriate size for gestational age; (2) small for gestational age, including low-birth-weight infants (2500 g or less); (3) very-low-birth-weight infants (1500 g or less); (4) extremely-low-birth-weight micropreemies (500 g or less); and (5) large for gestational age (more than 4000 g).11
Red Blood Cell Values at Birth
Neonatal hematologic values are affected by the gestational age of the infant, the age in hours after delivery, the presence of illness, and the level of support required. Other important variables to be considered when evaluating laboratory data include site of sampling and technique (capillary versus venous puncture, warm or unwarmed extremity), timing of sampling, and conditions such as the course of labor and the treatment of the umbilical vessels.11,13,14 The presence of fetal hemoglobin (Hb F), bilirubin, and lipids in newborns can also interfere with hematology laboratory testing.5–17 As with all laboratory testing, each laboratory should establish reference intervals based on its instrumentation, methods, and patient population (see Chapter 5).
Red Blood Cell Count
Refer to the inside front cover of this book for red blood cell (RBC) reference ranges. The RBC count increases during the first 24 hours of life, remains at this plateau for about 2 weeks, and then slowly declines. This “polycythemia of the newborn”18 may be explained by in utero hypoxia, which becomes more pronounced as the fetus grows. Hypoxia, the trigger for increased secretion of erythropoietin, stimulates erythropoiesis.19 At birth, the physiologic environment changes, and the fetus makes the transition from its placenta-dependent oxygenation to the increased tissue oxygenation of the lungs. This increased oxygen tension suppresses erythropoietin production, which is followed by a decrease in RBC and hemoglobin production. Studies show that erythropoietin levels before birth are equal to or greater than adult levels with a gradual drop to near zero a few weeks after birth.20–23 This decline corresponds to the physiologic anemia seen at 5 to 8 weeks of life, with the RBCs reaching their lowest count at 7 weeks of age and hemoglobin reaching its lowest concentration at 9 weeks of age.19
Erythrocyte Morphology of the Neonate
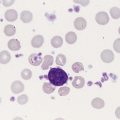
Early normoblasts are megaloblastic, hypochromic, and irregularly shaped. During hepatic hematopoiesis, normoblasts are smaller than the megaloblasts of the yolk sac but are still macrocytic. Erythrocytes remains macrocytic from the first 11 weeks of gestation until day 5 of postnatal life (Figure 38-1).*
The macrocytic RBC morphology gradually changes to the characteristic normocytic, normochromic morphology. Orthochromic normoblasts frequently are observed in the full-term infant on the first day of life but disappear within postnatal days 3 to 5. These nucleated RBCs (NRBCs) may persist longer than a week in immature infants. The average number of NRBCs ranges from 3 to 10 per 100 white blood cells (WBCs) in a normal full-term infant to 25 NRBCs per 100 WBCs in a premature infant. The presence of NRBCs for more than 5 days suggests hemolysis, hypoxic stress, or acute infection.*
The erythrocytes of newborns show additional morphologic differences. The number of biconcave discs relative to stomatocytes is reduced in neonates (43% discs, 40% stomatocytes) compared with adults (78% discs, 18% stomatocytes).27 In addition, increased numbers of pitted cells, echinocytes, spherocytes, and other abnormally shaped erythrocytes are seen in neonates. The number of these “dysmorphic” cells is even higher in premature infants. Zipursky et al found 40% discs, 30% stomatocytes, and 27% additional poikilocytes in premature infants.27
Reticulocyte Count
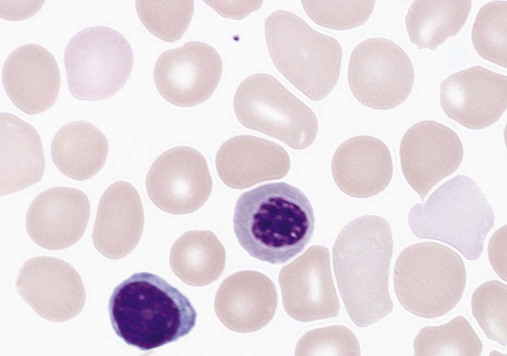
An apparent reticulocytosis exists during gestation, decreasing from 90% reticulocytes at 12 weeks’ gestation, to 15% at 6 months’ gestation, and ultimately to 4% to 6% at birth. Reticulocytosis persists for about 3 days after birth, then declines abruptly to 0.8% reticulocytes on postnatal day 4 to 7. At 2 months, the number of reticulocytes increases slightly, followed by a slight decline from 3 months to 2 years, when adult levels of 0.5% to 1.5% are attained.† The reticulocyte count of premature infants is typically higher than that of term infants; however, the count can vary dramatically depending upon how ill the newborn is. Significant polychromasia seen on a Wright-stained blood film is indicative of postnatal reticulocytosis (Figure 38-2).
Hemoglobin
Full-Term Infants
Hemoglobin synthesis results from an orderly evolution of a series of embryonic, fetal, and adult hemoglobins. At birth Hb F constitutes 70% to 80% of the total hemoglobin.28 Hb F declines from 90% to 95% at 30 weeks’ gestation to approximately 7% at 12 weeks after birth and stabilizes at 3.2 ± 2.1% at 16 to 20 weeks after birth.29 The switch from Hb F to Hb A is genetically controlled and determined by gestational age; it does not appear to be influenced by the age at which birth occurs.30 Chapter 10 provides an in-depth discussion of the ontogeny, structure, and types of hemoglobin.
The concentration of hemoglobin fluctuates dramatically in the weeks and months after birth as a result of physiologic changes, and various factors must be considered when analyzing pediatric hematologic values. The site of sampling, gestational age, and time interval between delivery and clamping of the umbilical cord can influence the hemoglobin level in newborn infants.* In addition, there are significant differences between capillary and venous blood hemoglobin levels. Capillary samples in newborns generally have a higher hemoglobin concentration than venous samples, which can be attributed to circulatory factors.† Racial differences must also be considered when evaluating hemoglobin levels in children. African American children have hemoglobin levels averaging 0.5 g/dL lower than those in white children.31
The average hemoglobin for a full-term infant at birth is 16.5 to 21.5 g/dL; levels less than 14 g/dL are considered abnormal.20,21 The average hemoglobin value for a preterm infant who is small for gestational age is 17.1 g/dL, lower than that for a full-term infant; hemoglobin values less than 13.7 g/dL are considered abnormal in preterm infants.21
Physiologic Anemia of the Neonate
The hemoglobin concentration of term infants decreases during the first 5 to 8 weeks of life, a condition known as physiologic anemia of infancy. Infants born prematurely also experience a decrease in hemoglobin concentration, which is termed physiologic anemia of prematurity.1,32–34 Along with a decrease in hemoglobin, there is a reduction in the number of RBCs, a decrease in the reticulocyte percentages (Table 38-1), and undetectable levels of erythropoietin associated with the transition from the placenta to the lungs as a source of oxygen. When the hemoglobin concentration decreases to approximately 11 g/dL, erythropoietic activity increases until it reaches its adult levels by 14 years of age.11,18,35–40 Also contributing to the physiologic anemia is the shortened life span of the fetal RBC. Studies of chromium-labeled newborn RBCs estimate a survival time of 60 to 70 days with correction for the elution rate of chromium from newborn cells.1 The life span of RBCs in premature infants is about 35 to 50 days.1 The more immature the infant, the greater the degree of reduction.1,21–23,26,41 The reasons for the shortened life span of the erythrocytes are unclear. This physiologic anemia is not known to be associated with any abnormalities in the infant. Hemodilution related to the increased blood volume that accompanies the rapid weight gain seen in the first few months of life is not thought to play a key role in the anemia.1
TABLE 38-1
Hematologic Values for Very-Low-Birth-Weight Infants During the First 6 Weeks of Life
| AGE OF INFANT (DAYS) | ||||
| Hematologic Value | 3 | 12-14 | 24-26 | 40-42 |
| Hemoglobin (g/dL) | 15.6 | 14.4 | 12.4 | 10.6 |
| Hematocrit (%) | 47 | 44 | 39 | 33 |
| Red blood cells (×1012/L) | 4.2 | 4.1 | 3.8 | 3.4 |
| Reticulocytes (%) | 7.1 | 1.7 | 1.5 | 1.8 |
| Platelets (×109/L) | 203.5 | 318 | 338 | 357 |
| White blood cells (×109/L) | 9.5 | 12.3 | 10.4 | 9.1 |
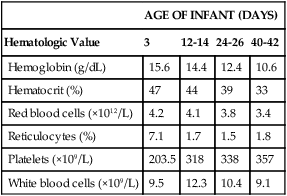
Modified from Obladen M, Diepold K, Maier RF, et al: Venous and arterial hematologic profiles of very low birth weight infants, Pediatrics 106:707-711, 2000.
The hemoglobin levels of premature infants are typically 1 g/dL or more below the values of full-term infants. Thereafter, a gradual recovery occurs, which results in values approximating those of normal full-term infants by about 1 year of age.* Very-low-birth-weight infants (less than 1500 g) show a progressive decline in hemoglobin, RBC count, mean cell volume (MCV), mean cell hemoglobin (MCH), and mean cell hemoglobin concentration (MCHC), and have a slower recovery than other preterm and term infants.
Hematocrit
The average hematocrit (Hct) at birth for full-term infants is 53% (range, 48% to 68%).42 Frequently, newborns with increased hematocrits, especially values greater than 65%, experience hyperviscosity of the blood. This can cause problems in producing a high-quality peripheral blood film.
Very-low-birth-weight preterm infants are frequently anemic at birth (see Table 38-1). Many require transfusions or erythropoietin injections or both.
Red Blood Cell Indices
The RBC indices and RBC distribution width (RDW) provide a means for assessing and defining anemia (see Chapter 18).
Mean Cell Volume
The erythrocytes of newborn infants are markedly macrocytic at birth. The average MCV for full-term infants is 110 ± 15 fL; however, a sharp decrease occurs during the first 24 hours of life. The MCV continues to decrease to 90 ± 12 fL in 3 to 4 months.18,37 The more premature the infant, the higher the MCV. A newborn with an MCV of less than 94 fL should be evaluated for α-thalassemia or iron deficiency.1,43
Anemia in Infants and Children
Nutritional deficiencies in infants and children can result in iron deficiency anemia and, rarely, in megaloblastic anemia (see Chapter 20), particularly in low-birth-weight and premature infants. These anemias are associated with abnormal psychomotor development; however, they can easily be treated with dietary fortification.44–48
Iron Deficiency Anemia
Iron deficiency anemia is the most common pediatric hematologic disorder and the most frequent cause of anemia in childood.49 The occurrence of iron deficiency anemia in infants has decreased in the United States due to iron fortification of infant formula and increased rates of breastfeeding.50 However, the prevalence is still 2% in toddlers 1 to 2 years of age and 3% in children 3 to 5 years of age51 and is related to early introduction and excessive intake of whole cow’s milk.44,52 Refer to Chapter 19 for an in-depth discussion of iron deficiency anemia.
Ancillary Tests for Anemia in Infants and Children
The differential diagnosis of anemia in infants and children relies on a variety of ancillary tests. The reference ranges for a number of these tests differ from those for adults. Haptoglobin levels are so low as to be undetectable in neonates, which makes it unreliable as a marker of infant hemolysis.53 Transferrin levels are also lower in neonates, increasing rapidly after birth and reaching adult values at 6 months.53 Both serum ferritin and serum iron are high at birth, rise during the first month, drop to their lowest level between 6 months and 4 years of age, and remain low throughout childhood.54–56 Consideration of these differences is important when interpreting hematology laboratory results for infants and children.
White Blood Cell Values in the Newborn
Fluctuations in the number of WBCs are common at all ages but are greatest in infants (Table 38-2). Leukocytosis is typical at birth for full-term and preterm infants, with a wide range of normal.57 There is an excess of segmented neutrophils and bands, and an occasional metamyelocyte, with no evidence of disease. The neutrophilic leukocyte count rises within the first 12 hours following birth, decreases between 1 month and 1 year, then gradually increases to stabilize at 4.4 × 10⁹/L at about 4 years of age.57
TABLE 38-2
| TOTAL LEUKOCYTES | NEUTROPHILS† | LYMPHOCYTES | MONOCYTES | EOSINOPHILS | ||||||||
| Age | Mean | Range | Mean | Range | % | Mean | Range | % | Mean | % | Mean | % |
| Birth | —‡ | — | 4.0 | 2.0-6.0 | — | 4.2 | 2.0-7.3 | — | 0.6 | — | 0.1 | — |
| 12 hr | — | — | 11.0 | 7.8-14.5 | — | 4.2 | 2.0-7.3 | — | 0.6 | — | 0.1 | — |
| 24 hr | — | — | 9.0 | 7.0-12.0 | — | 4.2 | 2.0-7.3 | — | 0.6 | — | 0.1 | — |
| 1-4 wk | — | — | 3.6 | 1.8-5.4 | — | 5.6 | 2.9-9.1 | — | 0.7 | — | 0.2 | — |
| 6 mo | 11.9 | 6.0-17.5 | 3.8 | 1.0-8.5 | 32 | 7.3 | 4.0-13.5 | 61 | 0.6 | 5 | 0.3 | 3 |
| 1 yr | 11.4 | 6.0-17.5 | 3.5 | 1.5-8.5 | 31 | 7.0 | 4.0-10.5 | 61 | 0.6 | 5 | 0.3 | 3 |
| 2 yr | 10.6 | 6.0-17.0 | 3.5 | 1.5-8.5 | 33 | 6.3 | 3.0-9.5 | 59 | 0.5 | 5 | 0.3 | 3 |
| 4 yr | 9.1 | 5.5-15.5 | 3.8 | 1.5-8.5 | 42 | 4.5 | 2.0-8.0 | 50 | 0.5 | 5 | 0.3 | 3 |
| 6 yr | 8.5 | 5.0-14.5 | 4.3 | 1.5-8.0 | 51 | 3.5 | 1.5-7.0 | 42 | 0.4 | 5 | 0.2 | 3 |
| 8 yr | 8.3 | 4.5-13.5 | 4.4 | 1.5-8.0 | 53 | 3.3 | 1.5-6.8 | 39 | 0.4 | 4 | 0.2 | 2 |
| 10 yr | 8.1 | 4.5-13.5 | 4.4 | 1.8-8.0 | 54 | 3.1 | 1.5-6.5 | 38 | 0.4 | 4 | 0.2 | 2 |
| 16 yr | 7.8 | 4.5-13.0 | 4.4 | 1.8-8.0 | 57 | 2.8 | 1.2-5.2 | 35 | 0.4 | 5 | 0.2 | 3 |
| 21 yr | 7.4 | 4.5-11.0 | 4.4 | 1.8-7.7 | 59 | 2.5 | 1.0-4.8 | 34 | 0.3 | 4 | 0.2 | 3 |
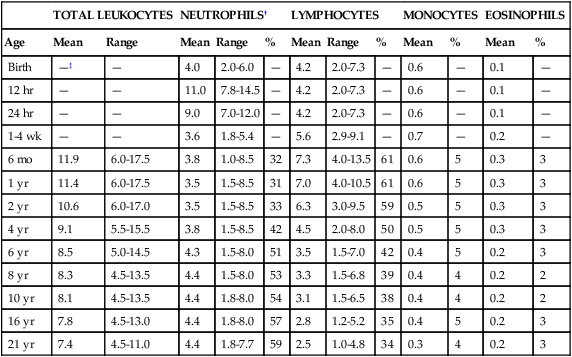
*Numbers of leukocytes are × 109/L (or thousands per microliter), ranges are estimates of 95% confidence limits, and percentages refer to differential counts.
†Neutrophils include band cells at all ages and a small number of metamyelocytes and myelocytes in the first few days of life.
‡Dashes indicate insufficient data for a reliable estimate.
From Cairo MS, Bracho F: White blood cells. In Rudolph CD, Rudolph AM, Hostetter MK, et al, editors: Rudolph’s pediatrics, ed 21, New York, 2003, McGraw-Hill, p 1548.
Neutrophilic Leukocytes
Refer to Table 38-2 and the inside front cover for the leukocyte reference ranges for full-term infants. Term and premature infants show a greater absolute neutrophil count than that found in older children, who characteristically maintain a predominance of lymphocytes. Band forms are also higher for the first 3 to 4 days after birth (Table 38-3). Newborn females have neutrophil counts averaging 2000 cells/mcL higher than those of males; neonates whose mothers have undergone labor have higher counts than neonates delivered by cesarean section with no preceding maternal labor.58,59 There is some evidence that absolute neutrophil counts are lower in healthy black children than in white children.60
TABLE 38-3
Neutrophil and Band Counts for Newborns during the First 2 Days of Life*
| Age | Absolute Neutrophil Count (× 109/L) | Absolute Band Count (× 109/L) |
| Birth | 3.5-6.0 | 1.3 |
| 12 hr | 8.0-15.0 | 1.3 |
| 24 hr | 7.0-13.0 | 1.3 |
| 36 hr | 5.0-9.0 | 0.7 |
| 48 hr | 3.5-5.2 | 0.7 |
*Normal values were obtained from the assessment of 3100 separate white blood cell counts obtained from 965 infants; 513 counts were from infants considered to be completely normal at the time the count was obtained and for the preceding and subsequent 48 hours. There was no difference in the normal ranges when values were stratified by infant birth weight or gestational age.
Modified from Luchtman-Jones L, Schwartz AL, Wilson DB: Hematologic problems in the fetus and neonate. In Martin RJ, Fanaroff AA, Walsh MC, editors: Fanaroff and Martin’s neonatal-perinatal medicine, ed 8, Philadelphia, 2006, Mosby Elsevier, p 1310.
Premature Infants
At birth, preterm infants exhibit a left shift, with promyelocytes and myelocytes frequently observed. The trend to lymphocyte predominance occurs later than in full-term infants. The neutrophil counts in premature infants are similar to or slightly lower than the neutrophil counts in full-term infants during the first 5 days of life; however, the count gradually declines to 2.5 × 10⁹/L (1.1 to 6.0 × 10⁹/L) at 4 weeks.61 There is no significant difference in the neutrophil count of infants by birth weight or gestational age; however, very-low-birth-weight infants have a significantly lower limit (1 × 10⁹/L) compared with larger infants.61–63
Neutropenia
Neutropenia is defined as a reduction in the number of circulating neutrophils to less than 1.5 × 10⁹/L. Neutropenia accompanied by bands and metamyelocytes is often associated with infection, particularly in preterm neonates. Neutropenia represents a decrease in neutrophil production or an increase in consumption.64
Lymphocytes
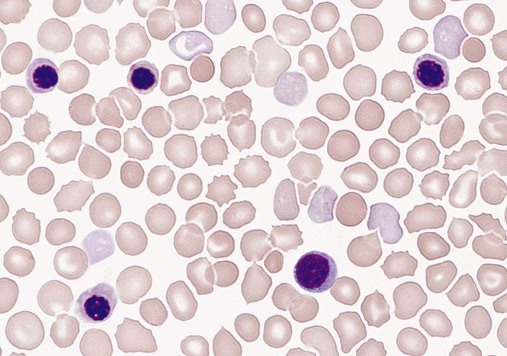
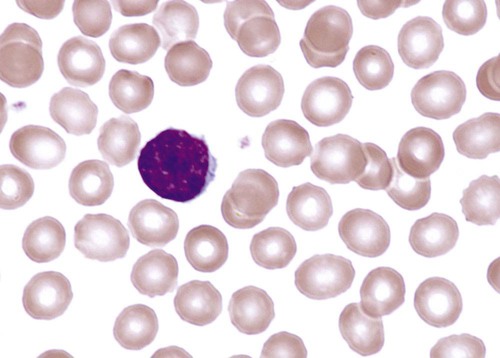
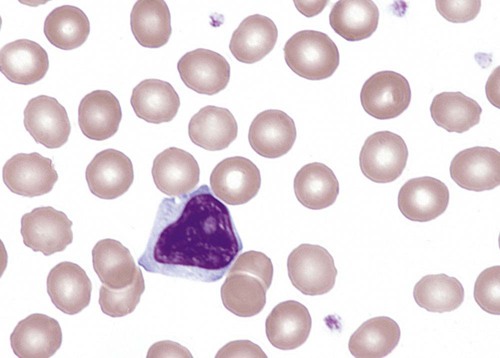
Lymphocytes constitute about 30% of the leukocytes at birth and increase to 60% at 4 to 6 months. They decrease to 50% by 4 years, to 40% by 6 years, and to 30% by 8 years.13,14,20,24 Benign immature B cells (hematogones), although predominantly found in the bone marrow, can sometimes be seen in the peripheral blood of newborns. These lymphocytes are primarily mid-stage B cells66,67 and are frequently referred to as “baby” or “kiddie” lymphocytes. They vary in size from 10 to 20 µm, have scant cytoplasm and condensed but homogeneous nuclear chromatin, and may have small, indistinct nucleoli (Figures 38-3 and 38-4).68–70 Although these lymphocytes may be similar in appearance to the malignant cells seen in childhood acute lymphoblastic leukemia (ALL), these benign cells lack the asynchronous or aberrant antigen expression seen in ALL and thus can be differentiated from the lymphocytes of infant ALL by immunophenotyping (see Chapter 33).71,72
Monocytes
Neonatal Hematologic Response to Infection
Sepsis in neonates is a common cause of morbidity, particularly in premature and low-birth-weight infants.73–77 Defective B-cell response against polysaccharide agents as well as abnormal cytokine release by neutrophils and monocytes has been implicated.78–81 Because of the transient neutrophilia that occurs during the first 24 hours after birth, followed by a rapid decline, the neutrophil count is not a satisfactory index of infection in the newborn.82 Newborns with bacterial infections frequently have normal or below normal neutrophil counts with a shift to the left. Thus, many practitioners depend upon the band count and its derived immature-to-total neutrophil ratio as an indicator of sepsis in neonates,83 although CD64, C-reactive protein, and procalcitonin levels have been suggested as more sensitive markers of sepsis in infants and children.83,84
Platelet Values in the Newborn
The platelet count usually ranges from 150 to 400 × 109/L for full-term and preterm infants, comparable to adult values (Table 38-4).85,86 Platelet counts generally increase in both term and preterm infants in the first few months of life, as evidenced by increased mean platelet volume the first month of life. Thrombocytopenia of fewer than 100 × 109 platelets/L may be seen in high-risk infants with sepsis or respiratory distress and neonates with trisomy syndromes, and investigation should be undertaken for underlying pathology.87,88 Platelets of a newborn infant show great variation in size and shape. Neonatal thrombocytopenia is discussed in Chapter 43.
TABLE 38-4
Normal Platelet Counts for Full-Term and Preterm Infants
| Age | Platelet Count (× 109/L; mean ± 1 SD) |
| Preterm infants, 27-31 wk | 275.0 ± 60.0 |
| Preterm infants, 32-36 wk | 290.0 ± 70.0 |
| Term infants | 310.0 ± 68.0 |
| Normal child/adult | 300.0 ± 50.0 |
Adapted from Oski FA, Naiman JL: Normal blood values in the newborn period. In Hematologic problems in the newborn, Philadelphia, 1982, WB Saunders.
Neonatal Hemostasis
The physiology of the hemostatic system in infants and children is different from that in adults (see Chapter 40). The vitamin K–dependent coagulation factors (factors II, VII, IX, and X) are at about 30% of adult values at birth; they reach adult values after 2 to 6 months, although the mean values remain lower in children than in adults. Levels of factor XI, factor XII, prekallikrein, and high-molecular-weight kininogen are between 35% and 55% of adult values at birth, reaching adult values after 4 to 6 months. In contrast, the levels of fibrinogen, factor VIII, and von Willebrand factor are similar to adult values throughout childhood.89,90 Factor V decreases during childhood, with lower levels during the teen years as compared with adults. The physiologic anticoagulants and inhibitors of coagulation—protein C, protein S, antithrombin, and a disintegrin-like and metalloprotease domain with thrombospondin type 1 motifs 13 (ADAMTS 13)—are reduced to about 30% to 40% at birth. Antithrombin reaches adult values by 3 months, whereas protein C does not normalize until after 6 months.89 In the fibrinolytic system, levels of plasminogen and α2-antiplasmin are similar to adult levels at birth, whereas levels of tissue plasminogen activator are low and levels of plasminogen activator inhibitor (PAI) are increased (Table 38-5).90 The hemostatic components are not only changing in concentration over the first few weeks to months of life, but their values are also dependent upon the gestational age of the child, and premature infants have different values at birth than term infants (Table 38-6).
TABLE 38-5
| Day 1 | Day 5 | Day 30 | Day 90 | Day 180 | Adult | |
| Screening Tests | ||||||
| PT (Sec) | 10.1-15.9 | 10.0-15.3 | 10.0-14.3 | 10.0-14.2 | 10.7-13.9 | 10.8-13.9 |
| PT (INR) | 0.53-1.62 | 0.53-1.48 | 0.53-1.26 | 0.53-1.26 | 0.61-1.17 | 0.64-1.17 |
| PTT (Sec) | 31.3-54.3 | 25.4-59.8 | 32.0-55.2 | 29.0-50.1 | 28.1-42.9 | 26.6-40.3 |
| TCT (Sec) | 19.0-28.3 | 18.0-29.2 | 19.4-29.2 | 20.5-29.7 | 19.8-31.2 | 19.7-30.3 |
| Factor Assays | ||||||
| Fibrinogen (mg/dL) | 167-399 | 162-462 | 162-378 | 150-379 | 150-387 | 156-400 |
| II (%) | 26-70 | 33-93 | 34-102 | 45-105 | 60-116 | 70-146 |
| V (%) | 34-108 | 45-145 | 62-134 | 48-132 | 55-127 | 62-150 |
| VII (%) | 28-104 | 35-143 | 42-138 | 39-143 | 47-127 | 67-143 |
| VIII (%) | 50-178 | 50-154 | 50-157 | 50-125 | 50-109 | 50-149 |
| VWF (%) | 50-287 | 50-254 | 50-246 | 50-206 | 50-197 | 50-158 |
| IX (%) | 15-91 | 15-91 | 21-81 | 21-113 | 36-136 | 55-163 |
| X (%) | 12-68 | 19-79 | 31-87 | 35-107 | 38-118 | 70-152 |
| XI (%) | 10-66 | 23-87 | 27-79 | 41-97 | 49-134 | 67-127 |
| XII (%) | 13-93 | 11-83 | 17-81 | 25-109 | 39-115 | 52-164 |
| PK (Fletcher, %) | 18-69 | 20-76 | 23-91 | 41-105 | 56-116 | 62-162 |
| HMWK (Fitzgerald, %) | 6-102 | 16-132 | 33-121 | 30-146 | 36-128 | 50-136 |
| XIIIa (%) | 27-131 | 44-144 | 39-147 | 36-172 | 46-162 | 55-155 |
| XIIIb (%) | 30-122 | 32-180 | 39-173 | 48-184 | 20-170 | 57-137 |
| Control Proteins | ||||||
| Antithrombin (%) | 39-87 | 41-93 | 48-108 | 73-121 | 84-124 | 79-131 |
| α2-Macroglobulin (%) | 95-183 | 98-198 | 106-194 | 126-226 | 149-233 | 52-120 |
| C1 lnhibitor (%) | 36-108 | 60-120 | 47-131 | 71-159 | 89-193 | 71-131 |
| α1-Antitrypsin (%) | 49-137 | 49-129 | 36-88 | 42-102 | 47-107 | 55-131 |
| Heparin Cofactor II (%) | 10-93 | 0-96 | 10-87 | 10-146 | 50-190 | 66-126 |
| Protein C (%) | 17-53 | 20-64 | 21-65 | 28-80 | 37-81 | 64-128 |
| Protein S (%) | 12-60 | 22-78 | 33-93 | 54-118 | 55-119 | 60-124 |
| Fibrinolytic Proteins | ||||||
| Plasminogen (%) | 125-265 | 141-293 | 126-270 | 174-322 | 221-381 | 248-424 |
| Tissue Plasminogen Activator (ng/mL) | 5.0-18.9 | 4.0-10.0 | 1.0-6.0 | 1.0-5.0 | 1.0-6.0 | 1.4-8.4 |
| α2-Antiplasmin (%) | 55-115 | 70-130 | 76-124 | 76-140 | 83-139 | 68-136 |
| Plasminogen Activator Inhibitor 1 (%) | 20-151 | 0-81 | 0-88 | 10-153 | 60-130 | 0-110 |
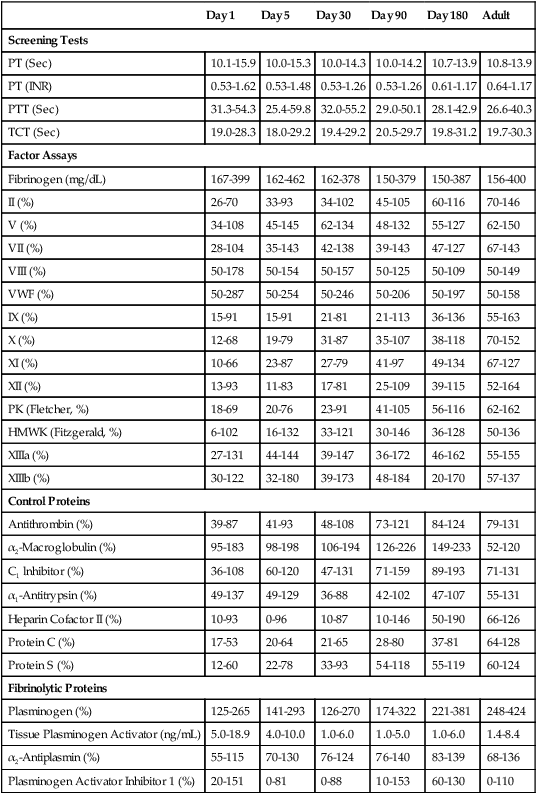
From Andrew M, Paes B, Johnston M: Development of the hemostatic system in the neonate and young infant, Am J Pediatr Hematol Oncol 12(1):95-104, 1990.
TABLE 38-6
| Day 1 | Day 5 | Day 30 | Day 90 | Day 180 | Adult | |
| Screening Tests | ||||||
| PT (Sec) | 10.6-16.2 | 10.0-15.3 | 10.0-13.6 | 10.0-14.6 | 10.0-15.0 | 10.8-13.9 |
| PT (INR) | 0.61-1.70 | 0.53-1.48 | 0.53-1.11 | 0.53-1.32 | 0.05-1.48 | 0.64-1.17 |
| PTT (Sec) | 27.5-79.4 | 26.9-74.1 | 26.9-62.5 | 28.3-50.7 | 27.2-53.3 | 26.6-40.3 |
| TCT (Sec) | 19.2-30.4 | 18.8-29.4 | 18.8-29.9 | 19.4-30.8 | 18.9-31.5 | 19.7-30.3 |
| Factor Assays | ||||||
| Fibrinogen (mg/dL) | 150-373 | 160-418 | 150-414 | 150-352 | 150-360 | 156-400 |
| II (%) | 20-77 | 29-85 | 36-95 | 30-106 | 51-123 | 70-146 |
| V (%) | 41-144 | 46-154 | 48-156 | 59-139 | 58-146 | 62-150 |
| VII (%) | 21-113 | 30-138 | 21-145 | 31-143 | 47-151 | 67-143 |
| VIII (%) | 50-213 | 53-205 | 50-199 | 58-188 | 50-187 | 50-149 |
| VWF (%) | 78-210 | 72-219 | 66-216 | 75-184 | 54-158 | 50-158 |
| IX (%) | 19-65 | 14-74 | 13-80 | 25-93 | 50-120 | 55-163 |
| X (%) | 11-71 | 19-83 | 20-92 | 35-99 | 35-119 | 70-152 |
| XI (%) | 8-52 | 13-69 | 15-71 | 25-93 | 46-110 | 67-127 |
| XII (%) | 10-66 | 9-69 | 11-75 | 15-107 | 22-142 | 52-164 |
| PK (Fletcher, %) | 9-57 | 25-75 | 31-87 | 37-121 | 40-116 | 62-162 |
| HMWK (Fitzgerald, %) | 9-89 | 24-100 | 16-112 | 32-124 | 41-125 | 50-136 |
| XIIIa (%) | 32-108 | 57-145 | 39-147 | 71-155 | 65-161 | 55-155 |
| XIIIb (%) | 35-127 | 68-158 | 57-157 | 75-167 | 67-163 | 57-137 |
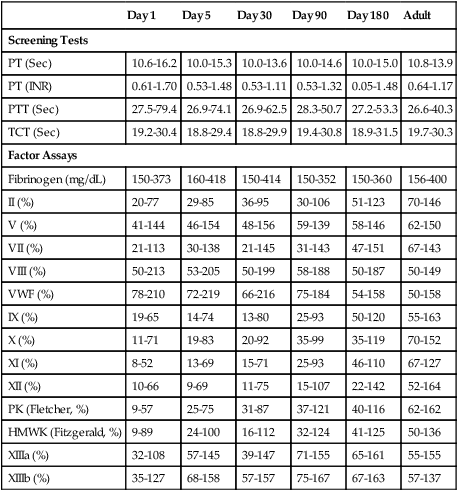
From Andrew M, Paes B, Milner R, et al: Development of the human coagulation system in the healthy premature infant, Blood 72(5):1651-1657, 1988.
Bleeding and Thrombosis
The reference ranges for the prothrombin time and partial thromboplastin time for neonates extend higher than those for adults; however, these values normalize by 6 months (see Table 38-5). The risk of bleeding is not increased in a healthy newborn despite the decreased levels of the vitamin K–dependent coagulation factors, which is primarily related to the reduced levels of the physiologic anticoagulants protein C and protein S.91
The risk of thrombosis is considerably less in neonates and children than in adults. However, two age-related peaks in frequency occur—the first in the neonatal period and the second in postpuberty adolescence.92 The presence of central venous catheters, cancer, and chemotherapy are the most common risk factors in both of these groups.93–96 Hemorrhagic and thrombotic disorders are discussed in Chapters 41 and 42, respectively.
Geriatric Hematology
The life expectancy and quality of life of the elderly have improved dramatically in recent decades. Americans are living longer than ever before. Life expectancies at both age 65 and age 85 have increased. Under current conditions, people who survive to age 65 can expect to live an average of 18.6 more years—almost 7 years longer than people aged 65 in 1900. The life expectancy of people who survive to age 85 today is 7.2 years for women and 6.1 years for men.97 The U.S. Census Bureau projects that in 2020 about 1 in 6 Americans will be elderly (age 65 and over) and 6.5 million persons will be age 85 and older.98 Global aging is also occurring at a record-breaking rate. The World Health Organization (WHO) reports that by 2050, one fifth of the global population will be adults aged 65 years and older, and the number of centenarians will reach 1.1 million.97
The elderly can be roughly divided into three age categories: (1) the “young-old,” aged 65 to 74; (2) the “old-old,” aged 74 to 84; and (3) the “very old,” aged 85 and older.99 The 85 and older age group is the fastest growing segment of the elderly population.
Geriatric medicine is a rapidly growing branch of medicine. The use of inappropriate reference values may lead to unnecessary testing and investigations or, more importantly, result in failure to detect a critical underlying disease. The growing concern about the interpretation of hematologic data in reference to age is due partly to the tremendous heterogeneity in the aging process and partly to the difficulty in separating the effects of age from the effects of occult diseases that accompany aging.100 This section focuses on hematologic changes in the elderly and discusses hematologic reference ranges for various geriatric age groups as well as hematopathologic conditions seen in the geriatric population.
Aging and Hematopoiesis
The aging process is associated with the functional decline of several organ systems, such as cardiovascular, renal, musculoskeletal, pulmonary, and bone marrow reserve. Certain cells lose their ability to divide (e.g., nervous tissue, muscles), whereas others, such as bone marrow and the gastrointestinal mucosa, remain mitotic. Marrow cellularity begins at 80% to 100% in infancy and decreases to about 50% after 30 years, followed by a decline to 30% after age 65.101–103 These changes may be due to a reduction in the volume of cancellous (spongy) bone along with an increase in fat, rather than to a decrease in hematopoietic tissue.103 Telomere shortening, which determines the number of divisions a cell undergoes, has not been definitively related to age-related bone marrow stem cell exhaustion in humans104; however, it is speculated to be associated with hematopoietic stem cell differentiation.105
Assessment of Hematologic Parameters in Healthy Elderly Adults
Red Blood Cells
Most RBC parameters (e.g., RBC count and indices and RDW) for normal healthy elderly do not show significant deviations from those for younger adults. There is a gradual decline in hemoglobin starting at middle age, with the mean level decreasing by about 1 g/dL during the sixth through eighth decades.106 Men older than 60 years have average hemoglobin levels of 12.4 to 15.3 g/dL, whereas men aged 96 to 106 years have a mean hemoglobin level of 12.4 g/dL.107,108 The hemoglobin levels in women may increase slightly with age or remain unchanged. Elderly women have hemoglobin concentrations ranging from 11.7 to 13.8 g/dL. Males characteristically have higher hemoglobin levels than females, owing to the stimulating effect of androgens on erythropoiesis; however, the difference narrows as androgen levels decrease in elderly men and estrogen levels decrease in older women.109,110 Characteristically, the lowest hemoglobin levels are found in the oldest patients (Table 38-7).
TABLE 38-7
Hematologic Values in Ambulatory Healthy Adults*
| 84-98 yr | 30-50 yr | |
| Red blood cells (× 1012/L) | ||
| Males | 4.8 ± 0.4 | 5.1 ± 0.2 |
| Females | 4.5 ± 0.3 | 4.6 ± 0.3 |
| Hemoglobin (g/dL) | ||
| Males | 14.8 ± 1.1 | 15.6 ± 0.7 |
| Females | 13.6 ± 1.0 | 14.0 ± 0.8 |
| Hematocrit (%) | ||
| Males | 43.8 ± 3.3 | 45.3 ± 2.2 |
| Females | 40.7 ± 2.9 | 41.6 ± 2.3 |
| Mean cell volume (fL) | ||
| Males | 91.3 ± 5.4 | 87.8 ± 2.8 |
| Females | 90.5 ± 4.1 | 90.5 ± 5.0 |
| Mean cell hemoglobin (pg) | ||
| Males | 31.0 ± 2.0 | 30.1 ± 1.6 |
| Females | 30.2 ± 1.2 | 30.3 ± 2.1 |
| Mean cell hemoglobin concentration (g/dL) | ||
| Males | 33.7 ± 1.5 | 34.2 ± 1.5 |
| Females | 33.4 ± 1.2 | 33.5 ± 1.5 |
| White blood cells (×109/L) | 7.6 ± 0.5 | 8.8 ± 0.4 |
| Platelets (×109/L) | 277 ± 2.1 | 361.0 ± 38.0 |
| Neutrophils (×109/L) | 4.5 ± 0.3 | 5.9 ± 0.3 |
| Lymphocytes (×109/L) | 1.9 ± 0.3 | 1.9 ± 0.8 |
*Mean values ± 1 standard deviation.
Adapted from Zauber NP, Zauber AG: Hematologic data of healthy very old people, JAMA 357:2181-2184, 1987; and Chatta GS, Lipschitz DA: Aging of the hematopoietic system. In Hazzard WR, Blass JP, Ettinger WH, et al: Principles of geriatric medicine and gerontology, ed 4, New York, 1999, McGraw-Hill, p 894.
Leukocytes
In the absence of any underlying pathologic condition, there are no statistically significant differences between the total leukocyte count and WBC differential for the young-old and old-old and those for middle-aged adults.108 Some investigators, however, have reported a lower leukocyte count, 3.1 to 8.5 × 10⁹/L, in individuals older than age 65, owing primarily to a decrease in the lymphocyte count. Others have reported a decrease in the lymphocyte and the neutrophil counts in women, but not in men, older than age 50.109
Immune Response in the Elderly
Infectious diseases are an important cause of morbidity and mortality in the elderly. Aged adults are more susceptible to infection, take longer to recover from infection, and are often less responsive to vaccination.111 The adverse changes that occur in the function of the immune system with age are called immunosenescence.112 Although all components of immunity are affected, T cells appear to be the most susceptible.113 The thymus disappears by early middle age, and adults must then depend on their T-lymphocyte pool in the secondary tissues to mediate T cell–dependent immune responses.114,115 The number of naive T cells decreases in the elderly, which increases the dependence on memory T cells. T cells of the elderly have impaired responsiveness to mitogens and antigens as a result of decreased expression of costimulator CD28. There is also an alteration of T-cell signaling with aging.116–118 B-lymphocyte function depends on T-cell interaction. Thus, the decreased ability to generate antibody responses, especially to primary antigens, may be the result of T-cell changes rather than intrinsic defects in B lymphocytes.114,115,119,120
Many neutrophil functions are decreased in the elderly, including chemotaxis, phagocytosis of microorganisms, and generation of superoxide. Studies indicate that these defects may be associated with changes to the cell membrane and/or to receptor signalling.111
Monocytes and Macrophages
The aging process does not significantly affect the number of monocytes. Information on the effects of aging on monocyte and macrophage function is limited and often conflicting.111 Recent studies provide evidence for defects in the toll-like receptor (TLR) function in monocytes and macrophages in older individuals.111 The TLRs play a crucial role in the immune response.121
Platelets
The platelet count is not significantly changed with age. There have been reports of increased levels of β-thromboglobulin and platelet factor 4 in the α-granules and increased platelet phospholipid content.122,123 Thrombocytopenia may be drug induced or secondary to marrow infiltration of metastatic cancer, lymphoma, or leukemia. Thrombocytosis can be categorized into primary and secondary. Essential thrombocytosis is a myeloproliferative neoplasm characterized by sustained proliferation of megakaryocytes resulting in platelet counts of 450 × 109/L or greater (see Chapter 34).124 Primary thrombocytosis can also be seen in chronic myelogenous leukemia. Secondary thrombocytosis, or reactive thrombocytosis, is associated with infections, rheumatoid arthritis, chronic inflammatory bowel disease, iron deficiency anemia, sickle cell anemia, and splenectomy.125–127
Anemia and the Elderly
Anemia is common in the elderly and its prevalence increases with age; however, anemia should not be viewed as an inevitable consequence of aging.128,129 Although anemia in the elderly is typically mild, it has been associated with substantial morbidity and mortality.130,131 WHO defines anemia as hemoglobin less than 13 g/dL in males and less than 12 g/dL in females. Using the WHO definition of anemia, the Third National Health and Nutrition Examination Survey (NHANES III), a national study that samples clinical specimens, found the prevalence of anemia in the United States in individuals over the age of 65 to be 11.0% in men and 10.2% in women.132 However, studies of the prevalence of anemia in the elderly show great variability in the definitions of anemia used as well as differences in sample sizes, patient populations studied, countries in which the study was conducted, and study design. Thus, estimates of the prevalence of anemia vary from 2.9% to 61% in elderly men and from 3.3% to 41% in elderly women.133
Ineffective erythropoiesis and hypoproliferation may also be seen in the elderly. Ineffective erythropoiesis is associated with vitamin B12 or folate deficiency, sideroblastic anemia, and thalassemia in the elderly. Hypoproliferative anemia often occurs secondary to iron deficiency, vitamin B12 or folate deficiency, renal failure, hypothyroidism, chronic inflammation, or endocrine disease.134 To a lesser extent, the elderly are prone to anemias such as aplastic anemia, hemolytic anemia, myelophthisic anemia, and anemia due to protein-calorie malnutrition.
The initial laboratory evaluation of anemia should include a complete blood count (CBC), a reticulocyte count, peripheral blood film review, and chemistry panel, along with other diagnostic tools including iron studies (with ferritin), vitamin B12 and folate levels, and free erythrocyte protoporphyrin (Table 38-8). In addition, assessment for signs of gastrointestinal blood loss, hemolysis, nutritional deficiencies, malignancy, chronic infection, renal or hepatic disease, or other chronic disease can provide important information for the evaluation of anemia in the elderly.
TABLE 38-8
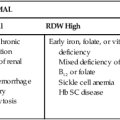
| MCV | RDW | Anemia |
| Normal | Normal | Anemia of chronic inflammation (some) Hemorrhagic anemia Leukemia-associated anemia |
| Normal | High | Early iron deficiency anemia Mixed deficiency anemia (e.g., vitamin B12 and iron) Sideroblastic anemia |
| Low | Normal | Anemia of chronic inflammation (some) |
| Low | High | Iron deficiency anemia |
| High | Normal | Anemia associated with myelodysplastic syndrome |
| High | High | Vitamin B12 deficiency anemia Folate deficiency anemia Hemolytic anemia |
Anemia of Chronic Inflammation
Anemia of chronic inflammation, also known as anemia of chronic disease, frequently occurs with inflammatory disorders (e.g., rheumatoid arthritis, renal failure, liver disease), chronic infections, bedsores, collagen vascular disease, protein malnutrition, endocrine disorders, vitamin C deficiency, and neoplastic disorders.134–142 This hypoproliferative anemia is the most common form of anemia in the hospitalized geriatric population.143 The severity of the anemia generally correlates with the severity of the underlying disease.144 An impaired erythropoietin-dependent erythropoiesis triggered by proinflammatory cytokines, impaired iron mobilization, and shortened RBC survival is involved in the pathogenesis of anemia of chronic inflammation.145 Chapter 19 discusses anemia of chronic inflammation.
Iron Deficiency Anemia
Iron deficiency anemia is common in the elderly. Iron deficiency affects not only erythrocytes, but also the metabolic pathways of iron-dependent tissue enzymes.139 Hemoglobin synthesis is reduced, and even a minimal decrease can cause profound functional disabilities in an elderly patient. The serum iron level decreases progressively with each decade of life, particularly in females. Nevertheless, healthy elderly adults usually have normal serum iron levels.
Iron deficiency anemia in the elderly is rarely due to dietary deficiency in industrialized nations because of the prevalence of iron fortification of grains as well as a diet that includes meats containing heme iron. Iron deficiency in the elderly most frequently results from conditions leading to chronic gastrointestinal blood loss, including long-term use of nonsteroidal antiinflammatory medications, gastritis, peptic ulcer disease, gastroesophageal reflux disease with esophagitis, colon cancer, and angiodysplasia.146–148 It also may be due to poor diet in an elderly individual who has lost the taste or desire for food or is unable to prepare nutritious meals. Chapter 19 discusses iron disorders in detail.
Ineffective Erythropoiesis
Ineffective erythropoiesis has been attributed not only to maturation disorders such as vitamin B12 and folic acid deficiency, but also to sideroblastic anemia and thalassemia. Sideroblastic anemias are characterized by impaired heme synthesis, and abnormal globin synthesis occurs in the thalassemias (see Chapter 27). Megaloblastic anemia results from defective synthesis of deoxyribonucleic acid (DNA) (see Chapter 20) with compromised cell division, but normal cytoplasmic development (i.e., asynchrony).149–151 These megaloblastic cells are more prone to destruction in the bone marrow, which results in “ineffective” erythropoiesis. Two causes of megaloblastic anemia are deficiency of vitamin B12 and folate deficiency.
Vitamin B12 Deficiency
Vitamin B12 (cobalamin) deficiency causes a megaloblastic disorder in 5% to 10% of the elderly.134 It may be difficult to detect, because anemia is present in only about 60% of patients.152 Neurologic complications are found in 75% to 90% of individuals with clinically apparent vitamin B12 deficiency.153,154 In the absence of anemia, neurologic symptoms may be the only indication. Even when anemia is present, it does not always manifest with the classic macrocytic and megaloblastic picture but may be normocytic or microcytic.
Vitamin B12 deficiency in the elderly has been attributed to inadequate intestinal absorption of food-bound vitamin B12 and pernicious anemia rather than inadequate intake.155 Many elderly individuals have atrophic gastritis resulting in decreased gastric production of acid. In this condition there is low vitamin B12 absorption because protein-bound vitamin B12 is not dissociated and cannot bind to intrinsic factor. In addition, the loss of gastric acid can result in bacterial overgrowth, particularly with Helicobacter pylori, which also interferes with vitamin B12 absorption.156,157 Inadequate vitamin B12 absorption in the elderly has also been reported in other infrequent conditions such as small bowel disorder, gastric resection, pancreatic insufficiency, resection of the terminal ileum, blind loop syndrome, and tropical sprue.158 Pernicious anemia develops slowly and insidiously in patients when autoimmune antibodies to intrinsic factor or to parietal cells destroy their parietal cells so that they are left without intrinsic factor.159 Given the high risk of vitamin B12 deficiency in the aged and the risks of the condition, some authors have proposed that all elderly adults be screened periodically for vitamin B12 deficiency.160–162 Chapter 20 discusses megaloblastic anemias.
Folate Deficiency
A second megaloblastic anemia that may be seen in the elderly results from folate deficiency. In contrast to vitamin B12 deficiency, folic acid deficiency usually develops from inadequate dietary intake, because the body stores little folate.110,163 However, the incidence of low serum and RBC folate levels has declined in all age groups, including the elderly, since countries began to fortify their grains with folic acid in the 1990s.164 Alcoholic elderly patients are particularly prone to folic acid deficiency, because alcohol interferes with folate absorption, enterohepatic recycling, metabolism, breakdown, and excretion (see Chapter 20).165,166
Hemolytic Anemia
Hemolytic anemias are characterized by a shortened RBC survival time. There are three major types of hemolytic anemias: (1) those caused by immunologic mechanisms; (2) those due to intrinsic defects, such as an RBC membrane defect, abnormal hemoglobins, or RBC enzyme defects; and (3) those resulting from extrinsic factors, such as mechanical or lytic processes.135,167 The elderly are at risk for drug-induced anemia because they may take multiple medications. Drug-induced hemolytic anemia has been associated with high doses of antibiotics (penicillin, chloramphenicol, cephalosporins), several nonsteroidal antiinflammatory drugs, quinidine, phenacetin, and others. Hemolytic anemias in the elderly also can result from collagen vascular diseases, infections, and chronic lymphocytic leukemia. The hemolytic anemias are discussed in Chapters 24 and 25.
Hematologic Neoplasia in Older Individuals
Chronic Myeloid Neoplasms
Myelodysplastic Syndrome
Myelodysplastic syndrome represents a heterogeneous group of clonal bone marrow disorders that may affect multiple cell lineages. Myelodysplasia is the most common hematologic malignancy in the elderly.168 The incidence of myelodysplastic syndrome increases from 8.9 cases per 100,000 for individuals aged 60 to 69 to 26.2 per 100,000 for those aged 70 to 79, and is 47.6 per 100,000 for those aged 80 and older.169 See Chapter 35 for a complete discussion of myelodysplastic syndrome.
Myeloproliferative Neoplasms
Myeloproliferative neoplasms are monoclonal proliferations of hematopoietic stem cells with overaccumulation of RBCs, WBCs, or platelets in various combinations. Myeloproliferative disorders include chronic myelogenous leukemia, polycythemia vera, essential thrombocythemia, primary myelofibrosis, myeloid neoplasms with eosinophilia and tyrosine kinase mutations, chronic eosinophilic leukemia not otherwise classified, mast cell disease, chronic neutrophilic leukemia, and unclassifiable myeloproliferative neoplasms. The incidence of myeloproliferative neoplasms increases from 6.3 per 100,000 for individuals aged 60 to 69, to 11.6 per 100,000 for those aged 70 to 79, and to 13.8 per 100,000 for those 80 years of age and older.169 Chapter 34 discusses the myeloproliferative neoplasms.
Leukemia
Leukemia is a neoplastic disease characterized by a malignant proliferation of hematopoietic stem cells in the bone marrow, peripheral blood, and often other organs. Leukemia is broadly classified on the basis of the cell type involved (lymphoid or myeloid) and the stage of maturity of the leukemic cells (acute or chronic). Although the overall incidence of leukemia has decreased in the past 5 decades, there has been a disproportionately greater incidence in leukemia in the elderly (Table 38-9). The peaks in leukemia incidence seem to occur in the very young (age 1 to 4 years) and the very old (age 70 or older, especially men). Chronic myelogenous leukemia (see Chapter 34) and chronic lymphocytic leukemia (see Chapter 37) show the most dramatic age-related increase in incidence.
TABLE 38-9
SEER Incidence of Leukemia in the Elderly in the United States per 100,000 (2002-2007)*
| Age at Diagnosis | All Leukemias | ALL | CLL | AML | CML |
| 65-69 yr | 34.9 | 1.4 | 16.0 | 9.5 | 4.1 |
| 70-74 yr | 47.3 | 1.5 | 20.9 | 14.0 | 5.6 |
| 75-79 yr | 62.7 | 1.6 | 27.5 | 18.7 | 7.5 |
| 80-84 yr | 74.4 | 1.5 | 30.7 | 23.0 | 9.2 |
| ≥85 yr | 79.8 | 1.7 | 33.2 | 21.2 | 9.2 |
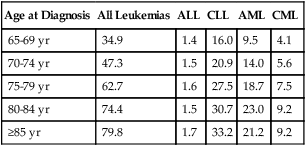
*Surveillance, Epidemiology, and End Results (SEER) rates are age adjusted to the 2000 U.S. standard population census.
Adapted from Altekruse SF, Kosary CL, Krapcho M, et al, editors: SEER cancer statistics review, 1975-2007, Bethesda, Md, 2010, National Cancer Institute. Based on November 2009 SEER data submission, posted to the SEER website in 2010. Available at: http://seer.cancer.gov/csr/1975_2007/. Accessed July 10, 2010.
Approximately 13% of patients with acute leukemia have had previous hematologic disorders, such as myelodysplastic syndrome, hypoplastic bone marrow, polycythemia, or myelofibrosis. Geriatric patients are more likely than younger patients to die due to the toxicity of, or resistance to, chemotherapy.169–171
Geriatric Hemostasis
Age-related changes occur in the vascular and hemostatic systems, including alterations in platelets, coagulation, and fibrinolytic factors. These changes are thought to contribute to the increased incidence of thrombosis in the elderly. The rate of venous thromboembolism, for example, increases from 1 per 10,000 in the young (under 40 years of age) to 1 per 1000 in the elderly (older than 75 years).172
Fibrinogen, factor V, factor VII, factor VIII, factor IX, factor XIII, high-molecular-weight kininogen, and prekallikrein increase in healthy individuals as they age.173 Fibrinogen, which has been implicated as a primary risk factor for thrombotic disorders, increases approximately 10 mg/dL per decade in the elderly (65 to 79 years),174 from 280 mg/dL to over 300 mg/dL. Elevated levels of factor VIII also have been associated with increased risk of venous thrombosis.175 Studies of the association between factor VII and venous thrombosis have yielded conflicting findings.173
PAI-1, the major inhibitor of fibrinolysis, increases with aging. PAI-1 has been shown to promote age-dependent thrombosis in animal models and could play an important role in causing hypercoagulability in the elderly.176–178
Platelets increase in activity with age, as evidenced by a decrease in bleeding time as males age from 11 to 70 years179 and an increase in markers of platelet activation, platelet β-thromboglobulin and platelet factor 4.180 Increased platelet activity with aging is also associated with increased platelet phospholipids, which suggests an age-related increase in platelet transmembrane signalling.181
Summary
• The newborn infant, preadolescent child, and elderly adult exhibit profound hematologic differences from one another.
• Hematologic parameters continue to change and evolve over the first few days, weeks, and months of life. Data must be assessed in light of gestational age, birth weight, and developmental differences between newborns and older infants.
• The erythrocytes of newborn infants are markedly macrocytic at birth. A condition known as physiologic anemia of infancy occurs after the first weeks of life. Infants born prematurely also experience a decrease in hemoglobin concentration, which is termed physiologic anemia of prematurity.
• Iron deficiency is the most frequent cause of anemia in children.
• Fluctuations in the number of WBCs are common at all ages but are greatest in infants. Leukocytosis is typical at birth for full-term and preterm infants, with a mean of 22 × 109 cells/L (range, 9 to 30 × 109 cells/L) at 12 hours of life. There is an excess of segmented neutrophils, bands, and occasional metamyelocytes with no evidence of disease.
• Sepsis in neonates is a common cause of morbidity, particularly in premature and low-birth-weight infants. Defective B-cell response against polysaccharide agents as well as abnormal cytokine release by neutrophils and monocytes has been implicated.
• Although hemostatic values are different in infants and children from those in adults, this population is not at increased risk of bleeding or thrombosis.
• There is a gradual decline in hemoglobin starting at middle age, and the mean level decreases by about 1 g/dL during the sixth through eighth decades.
• Although anemia is common in elderly patients, it is not a normal occurrence in the aging process. The cause of anemia may be multifactorial in elderly patients.
• Anemia of chronic inflammation and iron deficiency anemia are the most common anemias seen in the elderly.
• Vitamin B12 deficiency and folate deficiency are other causes of anemia in the elderly.
• Immunosenescence refers to the adverse changes in the immune system associated with aging.
• The elderly experience an increased frequency of many neoplastic and malignant disorders, such as acute and chronic leukemia, myelodysplastic syndromes, and myeloproliferative neoplasms.
• The elderly are at an increased risk of thrombosis associated with age-related changes in the vascular and hemostatic systems.
Review Questions
1. The CBC results for children (age 3 to 12 years) differ from those of adults chiefly in what respect?
2. Physiologic anemia of infancy results from:
a. Iron deficiency caused by a milk-only diet during the early neonatal period
b. Increased oxygenation of blood and decreased erythropoietin
3. The CBC report on a 3-day-old neonate who was born 6 weeks prematurely shows a decrease in hemoglobin compared with the value obtained 2 days earlier. Which of the following should be considered as an explanation for this result when no apparent source of hemolysis or bleeding is evident?
a. The sample was collected from a vein at the time that an intravenous line was inserted.
b. The sample was collected by heel puncture rather than finger puncture because of the infant’s small size.
c. The umbilical cord was clamped quickly to begin appropriate treatment for a preterm infant.
4. Morphologically, the hematogones in newborns are:
5. The most frequent cause of anemia in childhood is:
6. As age increases, the hemoglobin level of elderly adults:
a. Remains unchanged from that of middle-aged adults
b. Increases due to diminished respiration and poor tissue oxygenation
7. Which of the following are the most common anemias in the elderly population?
a. Megaloblastic anemia and iron deficiency anemia
b. Sideroblastic anemia and megaloblastic anemia
c. Myelophthisic anemia and anemia of chronic inflammation
d. Iron deficiency anemia and anemia of chronic inflammation
8. When iron deficiency is recognized in an elderly individual, the cause is usually:
9. Which of the following conditions is least likely in an elderly individual?
10. The multiple medications used by the elderly makes this population more prone to: