Chapter 14 Pathobiology Clinical Features, And Management Of Sickle Cell Disease
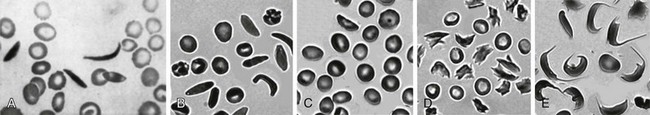
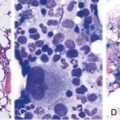
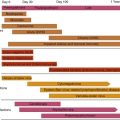
Figure 14-1 SICKLE RED BLOOD CELL (RBC) MORPHOLOGIES.
(B to E from Obata K, Mattiello J, Asakura K, et al: Exposure of blood from patients with sickle cell disease to air changes the morphological, oxygen-binding, and sickling properties of sickled erythrocytes. Am J Hematol 81:26, 2006. A from Herrick JB. Peculiar elongated and sickle-shaped red blood corpuscles in a case of severe anemia. Arch Intern Med 5:517, 1910.)
Figure 14-2 SICKLE GENE AND MALARIA.
(Adapted from Friedman MJ, Trager W: The biochemistry of resistance to malaria. Sci Am 244:154, 1981 and from Nagel RL, Steinberg MH: Genetics of the βS gene: Origins, epidemiology, and epistasis in sickle cell anemia. In Steinberg MH: Forget BG, Higgs DR, Nagel RL, eds: Disorders of hemoglobin: Genetics, pathophysiology, and clinical management, Cambridge, 2001, Cambridge University Press, p 711.)
Relationship of HbS Molecular Behaviors to Disease Features
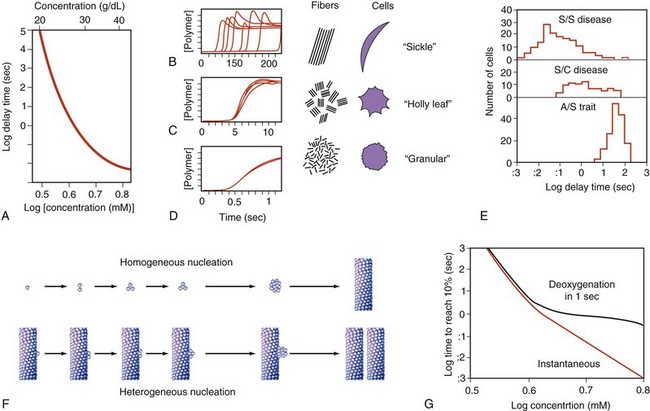
Figure 14-3 KINETICS OF HEMOGLOBIN S POLYMERIZATION, STUDIED BY NEAR-INSTANTANEOUS AND COMPLETE DEOXYGENATION.
A, Extreme dependence of delay time on hemoglobin concentration. B to D, Kinetic progress curves for polymer formation show that long delay times are highly variable (B), but very short delay times are highly reproducible (D). To the right is a representation of domains and corresponding red blood cell morphology postulated to result from these different scales of polymerization rate (see Fig. 14-1, B to E). E, Delay times for individual red blood cells are influenced by substituent hemoglobins. F, A double nucleation process is hypothesized to underlie polymer formation. G, Physiologically, the finite rate of deoxygenation effectively caps the polymerization rate and eliminates the relevance of delay times that are short relative to deoxygenation rate (<1 sec).
(A to E, Data from Eaton WA, Hofrichter J: Hemoglobin S gelation and sickle cell disease. Blood 70:1245, 1987; F adapted from Ferrone FA, Hofrichter J, Eaton WA: Kinetics of sickle hemoglobin polymerization II. A double nucleation mechanism. J Mol Biol 183:611, 1985; G, Data from Ferrone FA: Oxygen transits and transports. In Embury S, Hebbel RP, Mohandas N, Steinberg MH, eds: Sickle cell disease: basic principles and clinical practice, New York, 1994, Raven Press.)
Major Sickle RBC Membrane Defects
Enhanced mechanosensitivity → ↑ deformability responses →
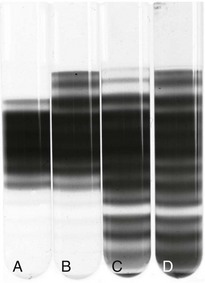
Figure 14-4 MARKED HETEROGENEITY IN SICKLE RED BLOOD CELL (RBC) HYDRATION.
(From Embury SH, Clark MR, Monroy G, Mohandas N: Concurrent sickle cell anemia and a-thalassemia. J Clin Invest 73:116, 1984.)
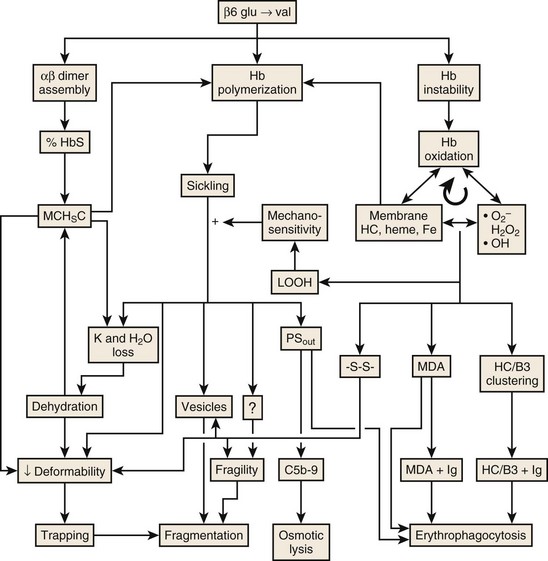
Figure 14-5 MECHANISMS LEADING TO HEMOLYSIS IN SICKLE CELL DISEASE.
(Modified with permission from The American Journal of Hematology from Hebbel RP: Reconstructing sickle cell disease: A data-based analysis of the “hyperhemolysis paradigm” for pulmonary hypertension from the perspective of evidence-based medicine. Am J Hematol 86:123-154, 2011.)
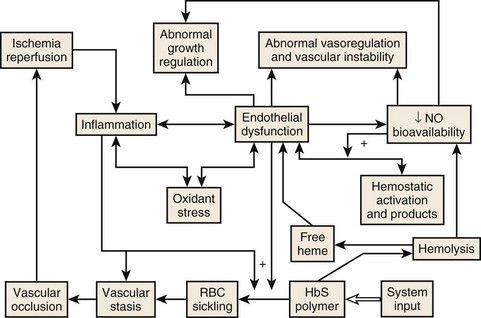
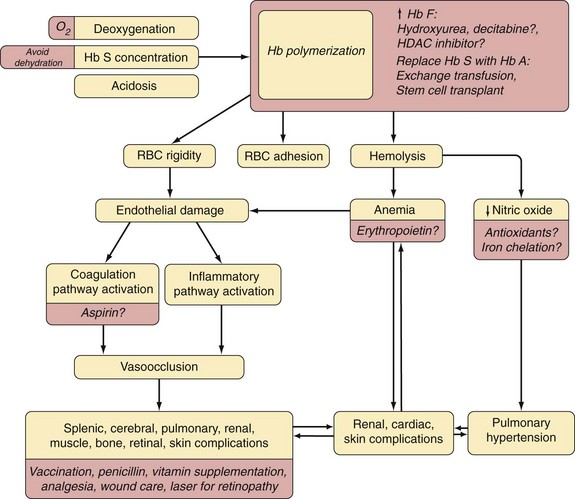
Figure 14-6 THE CENTRALITY OF ENDOTHELIAL DYSFUNCTION IN SICKLE CELL DISEASE.
(Modified from Hebbel RP: Reconstructing sickle cell disease: A data-based analysis of the “hyperhemolysis paradigm” for pulmonary hypertension from the perspective of evidence-based medicine. Am J Hematol 86:123, 2011.)
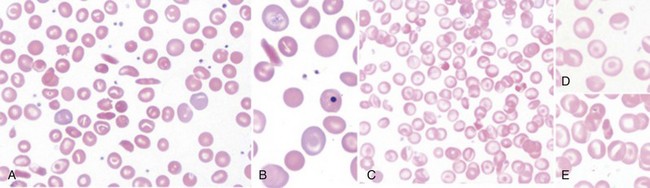
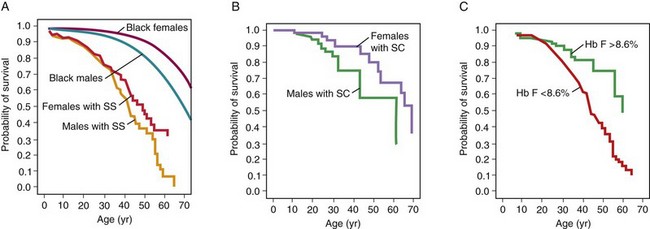
Figure 14-8 Life expectancy in patients with sickle cell disease for patients with Hb SS disease (A), Hb SC disease (B), and with different levels of fetal hemoglobin (Hb F) (C).
(From Platt OS, Brambilla DJ, Rosse WF, et al: Mortality in sickle cell disease. Life expectancy and risk factors for early death. N Engl J Med 330:1639, 1994.)
| Tests | |
|---|---|
| Blood tests | CBC with differential |
| Reticulocyte count | |
| Hemoglobin electrophoresis | |
| LDH | |
| Renal function tests | |
| Liver function tests | |
| Mineral panel | |
| Serum iron, ferritin, TIBC | |
| Hepatitis B sAg | |
| Hepatitis C antibody | |
| RBC alloantibody screen | |
| RBC typing | |
| D-dimer* | |
| C-reactive protein* | |
| Brain natriuretic peptide | |
| Urine and kidney tests | Urinalysis |
| Renal ultrasonography† | |
| Radiology | MRI or MRA brain (adults)‡ or transcranial Doppler ultrasonography starting at age 2 years (children) |
| Chest radiography§ | |
| Hip or shoulder radiograph or MRI (or both)‡ | |
| Bone density in teenagers and adults | |
| Cardiology and pulmonary | Echocardiogram |
| Neurocognitive | Neurocognitive testing§ |
LDH, Lactate dehydrogenase; MRA, magnetic resonance angiography; MRI, magnetic resonance imaging; RBC, red blood cell; sAg, surface antigen; TIBC, total iron-binding capacity.
*Consider following as surrogate markers after initiation of disease-modifying intervention.
†If hematuria with red blood cells in urine.
§If the patient has poor school performance, an abnormal memory, or abnormal MRI findings.
Table 14-2 Disease-Modifying Treatments to Consider
| Robust clinical data | Penicillin prophylaxis |
| Streptococcus pneumoniae vaccination | |
| Hydroxyurea | |
| Chronic exchange transfusion | |
| Iron chelation for chronic iron overload* | |
| Limited clinical data | Folate supplementation† |
| Haemophilus influenzae vaccination | |
| Influenza vaccination | |
| Erythropoietin | |
| Phlebotomy | |
| Experimental | Hb F reactivation with decitabine, histone deacetylase inhibitors, or imids |
| Erythropoietin for chronic relative reticulocytopenia | |
| Nutritional supplements and antioxidants (e.g., glutamine, zinc, multivitamins) | |
| N-acetylcysteine |
Hb F, Fetal hemoglobin.
*Best data from thalassemia patient experience.
†Risks minimal (however, can mask vitamin B12 deficiency). Therefore, it is generally done.
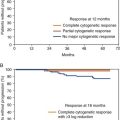
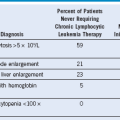
Table 14-3 Clinical Effects of Hydroxyurea Therapy
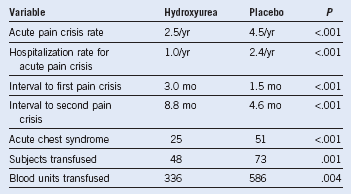
Adapted from data in Charache S, Barton FB, Moore RD, et al: Hydroxyurea and sickle cell anemia. Clinical utility of a myelosuppressive “switching” agent. The Multicenter Study of Hydroxyurea in Sickle Cell Anemia. Medicine (Baltimore) 75:300, 1996.
Table 14-4 Transfusion Formulas
| Dilutional effects of transfusion on Hb S: PRBC volume (PRBCV) (mL) = (Hctd − Hcti) × TBV × HctrpB |
| Manual partial-exchange transfusion:* Hb Sf = 1 − (PRBCV × Hctrp)(TBV × Hcti) + (PRBCV × Hctrp) × Hb SiC |
| Automated exchange transfusion: Exchange volume (mL) = (Hctd − Hcti) × TBVHctrp − (Hcti + Hctd)2D |
| RBC volume (mL) = Hcti × TBV |
Hctd, desired hematocrit; Hcti, initial hematocrit; Hctrp, hematocrit of replacement cells (usually 0.75); Hb Si, initial Hb S; Hb Sf, final Hb S; PRBC, packed red blood cells; TBV, estimated total blood volume in milliliters (children, 80 mL/kg; adults, 65 mL/kg; nomograms are available).
*In these formulas, Hct and Hb S are fractions (e.g., 40% = 0.4).
From Nieburg and Stockman, with permission. Copyright 1977, American Medical Association and Linderkamp et al, with permission. Copyright 1977, Springer-Verlag.
Table 14-5 Recommended Dose and Interval of Analgesics Necessary to Obtain Adequate Pain Control in Patients With Sickle Cell Disease
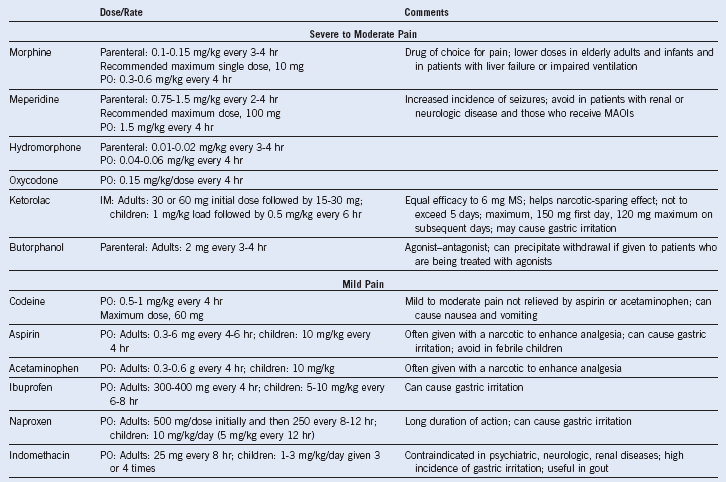
IM, Intramuscular; MAOI, monoamine oxidase inhibitor; MS, morphine sulphate; PO, oral.
Adapted from Charache S, Terrin ML, Moore RD, et al. Effect of hydroxyurea on the frequency of painful crises in sickle cell anemia. Investigators of the Multicenter Study of Hydroxyurea in Sickle Cell Anemia. N Engl J Med 332:1317, 1995.
Table 14-6 Bacteria and Viruses That Most Frequently Cause Serious Infection in Patients With Sickle Cell Disease
| Microorganism | Type of Infection | Comments |
|---|---|---|
| Streptococcus pneumoniae | Septicemia | Common despite prophylactic penicillin and pneumococcal vaccine |
| Meningitis | Less frequent than in years past | |
| Pneumonia | Rarely documented except in infants and young children | |
| Septic arthritis | Uncommon | |
| Haemophilus influenzae type b | Septicemia | |
| Meningitis | ||
| Pneumonia | Much less common in recent years because of immunization with conjugate vaccine | |
| Salmonella species | Osteomyelitis | |
| Septicemia | Most common cause of bone and joint infection | |
| Escherichia coli and other gram-negative enteric pathogens | Septicemia | |
| Urinary tract infection | ||
| Osteomyelitis | Focus sometimes inapparent | |
| Staphylococcus aureus | Osteomyelitis | Uncommon |
| Mycoplasma pneumoniae | Pneumonia | Pleural effusions; multilobe involvement |
| Chlamydia pneumoniae | Pneumonia | |
| Parvovirus B19 | Bone marrow suppression (aplastic crisis) | High fever common; rash and other organ involvement infrequent |
| Hepatitis viruses (A, B, and C) | Hepatitis | Marked hyperbilirubinemia |
Data from Buchanan GR, Glader BE: Benign course of extreme hyperbilirubinemia in sickle cell anemia: Analysis of six cases. J Pediatr 91:21, 1977.
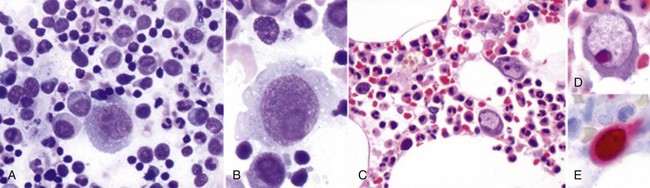
Table 14-7 Organ-Related Infection in Sickle Cell Disease
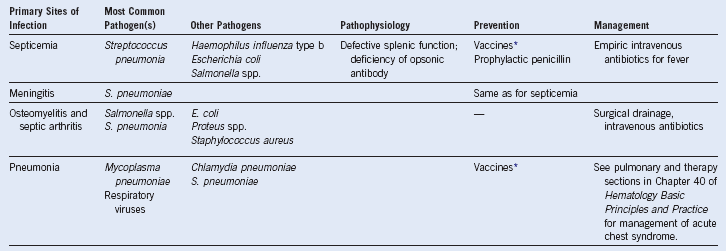
* Against Streptococcus pneumoniae and Haemophilus influenzae type b.
Data from Buchanan GR, Glader BE: Benign course of extreme hyperbilirubinemia in sickle cell anemia: Analysis of six cases. J Pediatr 91:21, 1977.
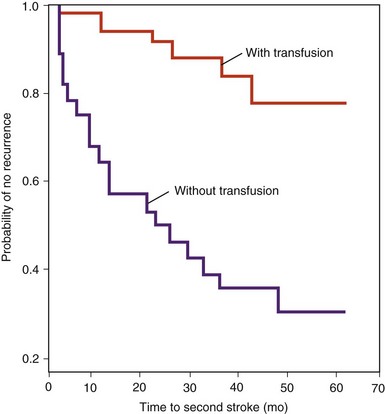
Figure 14-11 COMPARISON OF STROKE RECURRENCE OVER 62 MONTHS IN A TRANSFUSED GROUP AND IN UNTRANSFUSED HISTORICAL CONTROL GROUPS.
(Adapted with permission from Pegelow CH, Adams RJ, McKie V, et al: Risk of recurrent stroke in patients with sickle cell disease treated with erythrocyte transfusions. J Pediatr 126:896, 1995.)
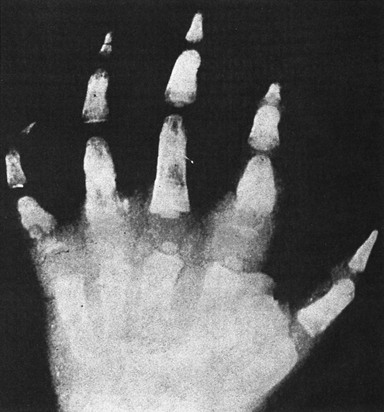
Figure 14-12 RADIOGRAM SHOWING THE BONE INFARCTIONS IN THE HANDS OF A CHILD WITH THE “HAND–FOOT SYNDROME” DACTYLITIs.
(Courtesy W.C. Mentzer.)
Table 14-8 Hematologic Variables Associated With Sickle Cell Anemia and the Different Sickle Cell–β-Thalassemia Syndromes
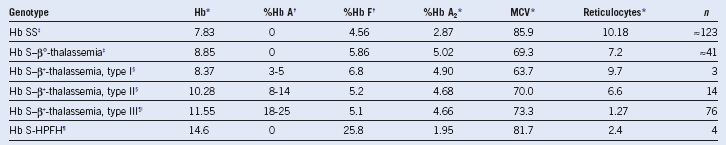
Hb, Hemoglobin; HPFH, persistence of fetal hemoglobin; MCV, mean corpuscular volume.