Optical Coherence Tomography
Carlos Alexandre de Amorim Garcia Filho, Zohar Yehoshua, Giovanni Gregori, Carmen A. Puliafito and Philip J. Rosenfeld
Physical principles of optical coherence tomography
During the past two decades, optical coherence tomography (OCT) has become an essential tool in ophthalmology. Its ability to image detailed ocular structures noninvasively in vivo with high resolution has revolutionized patient care.1,2 OCT technology is based on the principle of low-coherence interferometry, where a low-coherence (high-bandwidth) light beam is directed on to the target tissue and the scattered back-reflected light is combined with a second beam (reference beam), which was split off from the original light beam. The resulting interference patterns are used to reconstruct an axial A-scan, which represents the scattering properties of the tissue along the beam path. Moving the beam of light along the tissue in a line results in a compilation of A-scans with each A-scan having a different incidence point. From all these A-scans, a two-dimensional cross-sectional image of the target tissue can be reconstructed and this is known as a B-scan.
Typically OCT instruments use an infrared light source centered at a wavelength of about 840 nm. For a given wavelength, the axial resolution is dictated by the bandwidth of the light source. The latest commercial instruments typically have an axial resolution of approximately 5 µm, while research instruments have been built with a resolution as high as approximately 2 µm.1 The lateral resolution is limited by the diffraction caused by the pupil and it is normally about 20 µm. For clinical purposes, the image acquisition time is limited by the patient’s ability to avoid eye movements, i.e., less than 2 seconds in the typical patient. The instrument’s scanning speed (number of A-scans acquired per second) is then the crucial parameter determining the amount of data available for a single OCT dataset.
The early OCT instruments, known as time domain OCT (TD-OCT), used a single photo detector, and an A-scan was created by moving a mirror to change the optical path of the reference beam in order to match different axial depths in the target tissue. This setup limited the scanning speed to a few thousand A-scans per second. A newer technique, known as spectral domain OCT (SD-OCT), Fourier domain OCT (FD-OCT), or high-definition OCT (HD-OCT), is able to acquire an entire A-scan by using an array of detectors instead of using multiple reference beams from a moving mirror. Scanning speeds with SD-OCT instruments can exceed 100 000 A-scans per second, about 200 times faster than TD-OCT. Currently available SD-OCT commercial systems operate at a scanning rate of approximately 27 000 A-scans per second.1
The scanning pattern with the commercial TD-OCT instrument (Stratus OCT, Carl Zeiss Meditec, Dublin, CA) incorporated six radial, concentric, 6-mm-long B-scans centered on the fovea. With the recent development of high-speed SD-OCT systems, several novel and important imaging strategies have been introduced based on acquiring three-dimensional datasets and B-scan averaging (Fig. 3.1).
Three-dimensional datasets are obtained using a dense two-dimensional raster array over a relatively large retinal region. The resulting datasets can be rendered as a volume image in three dimensions and can be analyzed by showing two-dimensional slices (i.e., sequences of parallel B-scans). Three-dimensional datasets give detailed information about the retinal structure over large areas. In addition, it is possible to generate en face fundus-like images directly from the OCT datasets. These OCT fundus images (OFIs) provide an accurate spatial colocalization of retinal features observed on the en face and cross-sectional images. Therefore, exact correlations can be achieved between the retinal cross-sectional geometry seen on the OCT B-scans and the retinal landmarks seen on en face images, known as the OFI. The potential exists for registration between several SD-OCT datasets of the same eye and images obtained using other imaging modalities, such as color fundus photography, fluorescein angiography, and fundus autofluorescence imaging. This holds the promise for an unprecedented ability to describe and monitor changes in the local geometry of the retina.3 In addition to the OFI generated by a full OCT dataset, partial OFIs (or slabs) can be generated to produce en face renderings that correspond to particular retinal layers or features.4 These slabs can be very useful to visualize and quantify specific pathologies (Fig. 3.2).
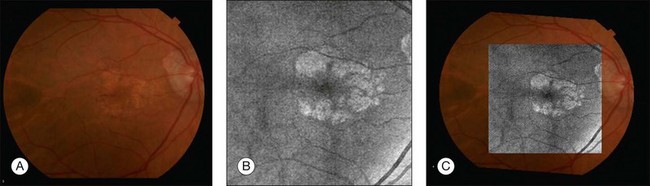
Fig. 3.2 (A) Color fundus image of a patient with geographic atrophy secondary to age-related macular degeneration. (B) Optical coherence tomography (OCT) fundus image, which is the en face image from the reflected light from each A-scan, of the same patient obtained with a scan pattern of 200 × 200 A-scans in the Cirrus high-definition OCT instrument. (C) Registration of the color fundus image with the OCT fundus image. Since the area of the OCT fundus image is known to be 6 × 6 mm, it is possible to quantify lesion area and calibrate the fundus camera to use this technique.
The scanning speed of SD-OCT can also be used to produce very high-quality individual B-scan images through a combination of high sampling density and image averaging. One of the main factors affecting the perceived quality of OCT images is noise, in particular the speckle noise which is responsible for the characteristic “granular” appearance of OCT. Noise can be reduced through the acquisition, registration, and averaging of a number of B-scans at approximately the same retinal position (Fig. 3.3).
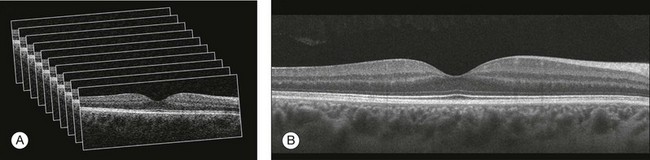
Fig. 3.3 Averaging process. (A) Multiple B-scans acquired through the foveal center of a normal patient. (B) The registration and averaging of these B-scans can reduce the speckled noise and improve the image quality. In these examples the image was averaged 20 times using the Cirrus high-definition optical coherence tomograph.
Recently, different companies have invested in research in the field of retinal imaging, especially in the development and improvement of SD-OCT. It is not an objective of this section to discuss the differences between each of the currently available instruments since these instruments are continuously evolving. Table 3.1 lists currently available instruments.
Table 3.1
Commercially available spectral domain optical coherence tomography (OCT) instruments
| Device (manufacturer) | Axial resolution; scanning rate | Special characteristics |
| 3D-OCT 2000 (Topcon, Tokyo, Japan) |
5 µm; 27 kHz | Fundus camera |
| Bioptigen SD-OCT (Bioptigen, Research Triangle Park, NC) |
4 µm; 20 kHz | Designed for research applications |
| Cirrus HD-OCT (Carl Zeiss Meditec, Dublin, CA) |
5 µm; 27 kHz | |
| RTVue-100 (Optovue, Fremont, CA) |
5 µm; 26 kHz | |
| SOCT Copernicus (Optopol, Zawiercie, Poland) |
6 µm; 27 kHz | |
| Spectral OCT SLO (Opko, Miami, FL) |
6 µm; 27 kHz | Microperimetry |
| Spectralis OCT (Heidelberg Engineering, Heidelberg, Germany) |
8 µm; 40 kHz | Eye-tracking, fluorescein angiography, ICG angiography, autofluorescence |
Quantitative analysis of OCT datasets
Several commercially available SD-OCT instruments offer some level of quantitative analysis using different, proprietary segmentation algorithms. The various segmentation algorithms make different design choices and have been shown to have very different performance profiles in terms of accuracy, reproducibility, and robustness.5–8 Care should be exercised when comparing measurements obtained from different OCT instruments.
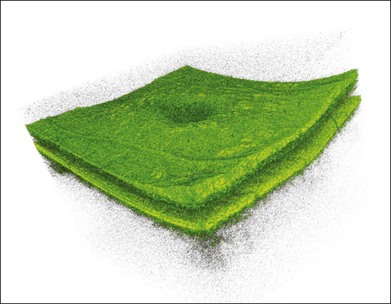
The most commonly used quantitative parameter derived from OCT datasets is retinal thickness, obtained by segmenting the internal limiting membrane (ILM) and a boundary representing the retinal pigment epithelium (RPE). This information can be used to generate surface maps of the ILM and the RPE as well as two-dimensional and three-dimensional retinal thickness maps. These maps can be very useful in identifying and describing deviations from the normal anatomy and changes over time. Registering OCT datasets acquired over time can give very precise information about the dynamics of disease progression and response to treatment based on changes in retinal anatomy (Fig. 3.4).
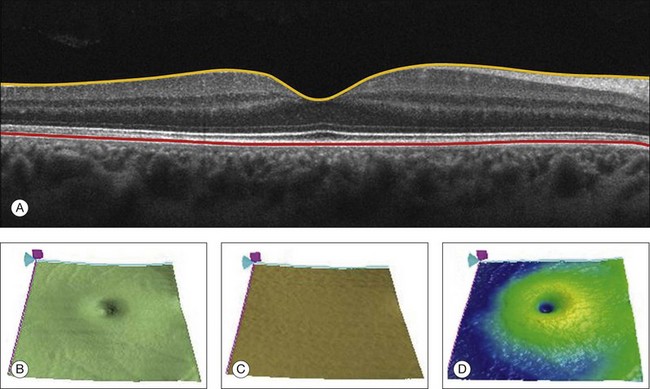
Fig. 3.4 Segmentation process. (A) B-scan through the foveal center of a normal patient with a yellow line identifying the internal limiting membrane (ILM) and a red line corresponding to the retinal pigment epithelium (RPE). Three-dimensional map of the ILM (B), RPE (C), and the retinal thickness map (D) acquired with a 200 × 200 scan pattern with the Cirrus high-definition optical coherence tomography instrument.
It is important to keep in mind that there is some confusion in the definition of the outer retinal boundary. In a normal eye, the bright reflective band at the external aspect of the retina, often referred to as the RPE complex, can be resolved in ultrahigh-resolution images, and occasionally in images acquired with a commercially available SD-OCT instrument, consisting of three individual layers.9 Different segmentation algorithms from different instruments tend to follow different edges and therefore result in different measurements. For example, the Spectralis SD-OCT instrument typically follows the posterior edge of the RPE complex, the Stratus TD-OCT instrument typically follows the inner segment–outer segment (IS/OS) junction, which is anterior to the RPE complex, and the Cirrus SD-OCT instrument typically follows the anterior edge of the RPE layer (Fig. 3.5). This situation becomes even more complicated and sometimes inconsistent when the normal retinal structure is deformed by the presence of pathology.10
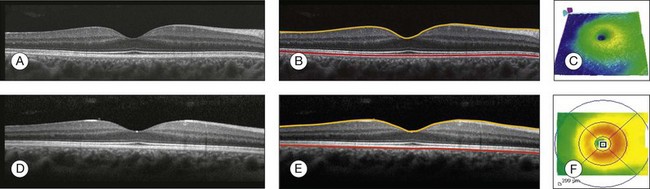
Fig. 3.5 Differences in segmentation and retinal thickness maps between instruments. The B-scan, the B-scan identifying the internal limiting membrane (yellow line), and the retinal pigment epithelium (red line), and the retinal thickness map acquired with the Cirrus high-definition optical coherence tomograph (A–C) and the Spectralis (D–F). Note that, using the Cirrus instrument, the segmentation algorithm identifies the actual retinal pigment epithelium (B) and using the Spectralis the segmentation algorithm identifies Bruch’s membrane. This subtle difference in the segmentation algorithm between each instrument can be responsible for different retinal thickness measurements.
In addition to total retinal thickness, a number of other quantitative parameters have been proposed. For example, it is possible to obtain measurements of particular retinal layers, such as the thickness of the ganglion cell layer or the thickness of the photoreceptors’ outer segments, as well as measurements of retinal lesions, like the area of geographic atrophy (GA).9,11,12
An area of particular promise is the measurement of RPE deformations associated with drusen.13,14 These measurements are obtained by comparing the actual RPE geometry with the geometry of a virtual RPE free of deformations. Parameters like drusen area and volume can be generated in a fully automated manner and have been shown to be quite robust and reproducible (Fig. 3.6).
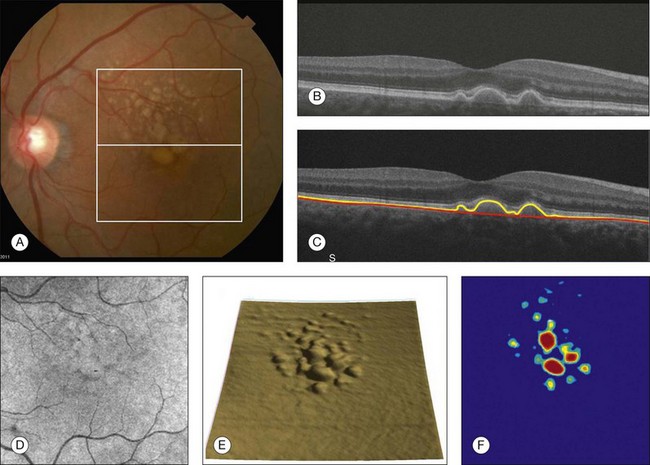
Fig. 3.6 Retinal pigment epithelium (RPE) deformation algorithm. (A) Color fundus image of a patient with drusen. A 6 × 6 mm white box was superimposed on the image to represent the scan area. (B) B-scan from the spectral domain optical coherence tomography dataset that corresponds to the central line on the color fundus image. (C) B-scan with a yellow line representing the RPE segmentation and a red line showing the RPE floor (virtual map of the RPE free of deformations). (D) En face image of the 6 × 6 mm scan pattern (optical coherence tomography fundus image). (E) Three-dimensional RPE map delineating the drusen conformation. (F) RPE elevation map with drusen area (1.41 mm2) and volume (0.08 mm3).
The amount of information provided by each dataset, together with the possibility for image registration and longitudinal studies, makes SD-OCT a very promising new tool for the quantitative study of retinal pathologies. These capabilities solve the biggest problems associated with the Stratus TD-OCT retinal thickness maps: the lack of precise correspondence between the B-scans and the retinal topography, the difficulties associated with eye movements, and the need for significant interpolation of the data due to undersampling of the retina. Despite the advantages of SD-OCT, segmentation algorithms can produce artifacts, particularly in the presence of macular disorders with complex morphology like neovascular age-related macular degeneration (AMD).15–19 Therefore, it is important to be vigilant and monitor the quality of the segmentation in order to eliminate artifacts arising from flawed segmentation and associated measurements.
Normal macular anatomy
The OCT image closely approximates the histological appearance of the macula and, for this reason, it has been referred to as an in vivo optical biopsy. With the increase in the axial resolution of the new SD-OCT instruments (5–8 µm) and the ultrahigh-resolution OCT (2 µm), it has become possible to correlate OCT images accurately with histological features of the retina.20 However, care must be taken when making assumptions about these correlations because histological sections require fixation and exogenous staining to produce contrast within tissue, and this can introduce artifacts, while OCT relies on intrinsic differences in tissue optical properties to produce image contrast.21 When light travels through the retinal tissue it can be reflected, scattered, or absorbed, and this creates the multilayered pattern of the retina. The angle of incidence of the light, motion artifacts, speckled noise, and image contrast can affect the axial resolution of retinal imaging. Therefore, one-to-one correspondence of histology with OCT images cannot be expected.2,21
Although the interpretation of features of the inner retina, which can be defined for our purpose to span from the ILM to the junction of the inner and outer segments of the photoreceptors, appears to correlate well with histology, the OCT features of the outer retina are less well understood and remain a topic of discussion (Fig. 3.7).9,22,23
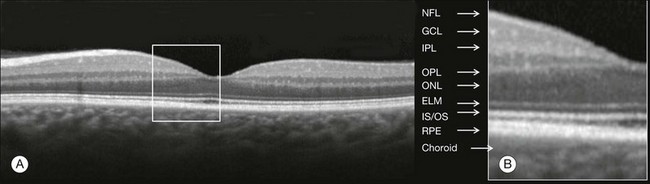
Fig. 3.7 Spectral domain optical coherence tomography (Spectralis, Heidelberg) image of a normal individual. The multilayered retinal architecture can be observed and each retinal layer can be identified. NFL, nerve fiber layer; GCL, ganglion cell layer; IPL, inner plexiform layer; OPL, outer plexiform layer; ONL, outer nuclear layer; ELM, external limiting membrane; IS/OS, junction of the inner and outer segments of the photoreceptors; RPE, retinal pigment epithelium.
The first detected layer in most OCT scans is the ILM that appears as a hyperreflective layer at the vitreoretinal interface. In some patients, the posterior hyaloid can be seen above the ILM as a hyperreflective layer. Within the retina, the retinal nerve fiber layer and the plexiform layers (both inner and outer) are seen as hyperreflective while the ganglion cell layer and the nuclear layers (both inner and outer) are hyporeflective. A recent study demonstrated that the incidence of the light beam could affect the appearance of Henle’s fiber layer by OCT, resulting in a thin hyperreflective layer corresponding to the photoreceptor synapses or a thicker hyperreflective layer corresponding to photoreceptor axonal extensions enveloped by the outer cytoplasm of Müller cells (Fig. 3.8).24 The retinal vessels may sometimes be seen on OCT images as circular hyperreflective structures located in the inner retina, with a vertical shadow or reduced reflectivity extending into deeper layers.
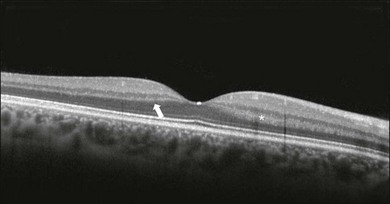
Fig. 3.8 Spectral domain optical coherence tomography of the same patient using a different light incidence. This results in a thin hyperreflective layer that corresponds to the photoreceptor synapses (white arrow) or a thicker hyperreflective layer corresponding to photoreceptor axonal extensions enveloped by the outer cytoplasm of Müller cells (white asterisk).
Outside the central fovea, commercially available SD-OCT instruments typically resolve four bands in the outer retina. There is discordance between different authors regarding which anatomical structure correlates with each band.20,21,25 The innermost band has been attributed to the external limiting membrane (ELM). This band is typically thinner and fainter than the others. The nomenclature for the middle two bands has much less supportive evidence. The second of the four bands has been commonly ascribed to the boundary between the IS/OS of the photoreceptors and the third band is referred to as either the OS tips or as Verhoeff’s membrane.9,26 A recent study suggested that the second band was the ellipsoid section of the photoreceptors (inner segment) instead of the IS/OS junction and that the third band appears to correspond to the contact cylinder between the RPE apical process and the external portion of the cone outer segment. This band typically merges with the fourth band in the central fovea and this is explained by a greater height of the contact cylinder of the cones and RPE outside the fovea.25 The fourth hyperreflective outer retinal band is attributed to the RPE, with potential contribution from Bruch’s membrane and choriocapillaris, with abundant experimental and clinical evidence supporting this designation.9,22,27
Although the current SD-OCT uses a short wavelength of approximately 840 nm, which results in light scattering at the level of the RPE and a lower signal from the deep choroidal tissue, it is also possible to image the choroid and extract quantitative information (Fig. 3.9).28–31 Choroidal thickness may be influenced by age, axial length, and perhaps refractive abnormalities. It also varies in different retinal regions within the same normal subject, being thickest beneath the fovea,31 or in the superior outer macula (Early Treatment Diabetic Retinopathy Study (ETDRS) subfield), with the thinnest choroid being located in the nasal outer ETDRS subfield.32 When centering the optic nerve head as a reference point, the choroid appears thin in the peripapillary region and increases in thickness with eccentricity in all directions, up to a certain point, except inferiorly.32 This is the embryonic location of the optic fissure closure and thus may be responsible for the localized thinning.32,33 High-penetration OCT uses a light source with a wavelength around 1050 nm that allows a better visualization of the posterior choroid and sclera than currently available SD-OCT instruments.30,33,34
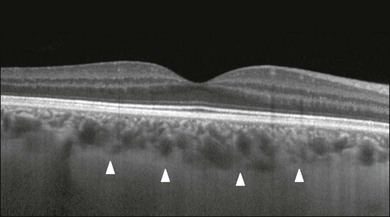
Fig. 3.9 Enhanced-depth spectral domain optical coherence tomography image (Spectralis, Heidelberg) of a normal subject showing the boundaries of the choroid (arrowheads).
The high axial resolution and the different scan patterns offered by SD-OCT provide comprehensive structural information that can be used to map retinal layer thicknesses and perform volumetric analyses. Using different SD-OCT instruments, several authors have reported an approximate central retinal thickness of 265 µm in normal subjects.35 However, caution is required, as errors in automated measurements may occur and are more often found in macular disorders with complex morphology like neovascular AMD, which alters the ability of segmentation algorithms to detect normal boundaries.15–19 Therefore, care must be taken that high-quality and artifact-free scans are obtained before running the retinal thickness algorithm.
SD-OCT in retinal disorders
Vitreoretinal interface disorders
Vitreomacular traction
VMT syndrome results from persistent vitreoretinal adhesions in the setting of a partial posterior vitreous detachment.36 In normal eyes, as the vitreous liquefies due to age, it detaches from the macula. This natural progression has been demonstrated using OCT.37 In some people, an unusually strong adhesion is present between the vitreous and macula, and as the vitreous detaches peripherally, it continues to pull on areas of the macula. The vitreoretinal adhesions transmit tractional forces to the retina from the vitreous body, having the potential to cause tensile deformation, foveal cavitations, cystoid macular edema (CME), limited macular detachment, or a macular hole.38,39 Patients can present with visual loss and metamorphopsia.
Diagnosis of VMT by biomicroscopy may be challenging, particularly when the area of vitreoretinal attachment is broad. OCT better defines the vitreoretinal relationships in eyes with VMT and also documents concomitant ERM and macular edema.40–44 With OCT imaging, the abnormal VMT bands from the prominent posterior hyaloid are well delineated as reflective lines from the perifoveal area into the vitreous cavity, distorting the macular contour with or without accumulation of intraretinal or subretinal fluid (Fig. 3.10).
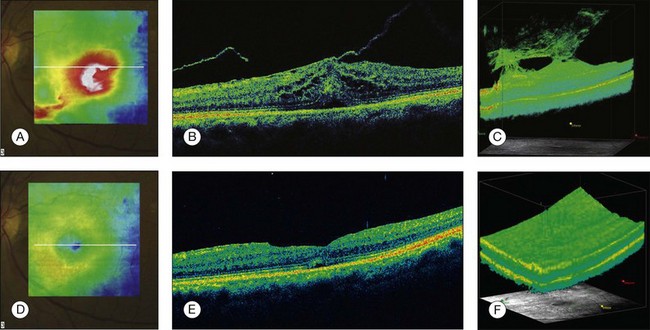
Fig. 3.10 Vitreomacular traction syndrome: color fundus image of the left eye of a 71-year-old woman superimposed with the retinal thickness map (A) showing an increase in the retinal thickness (red areas). The B-scan of the macular region shows an increase in the retinal thickness and the presence of subretinal fluid and intraretinal cysts due to vitreomacular traction and an epiretinal membrane (B). A three-dimensional spectral domain optical coherence tomography (courtesy of Cirrus, Carl Zeiss Meditec) is presented (C). The patient underwent surgery and, 2 months after pars plana vitrectomy, the retinal thickness decreased, with resolution of the intraretinal cysts (D–F).
In recent years OCT has been most beneficial in diagnosing VMT and subsequently directing treatment of this condition. In some cases, spontaneous resolution can occur with separation of the vitreous from the macula, leading to subsequent resolution of the intraretinal and subretinal fluid and restoration of normal vision.45,46 However, in most eyes, VMT persists and vitrectomy may be an effective treatment option for patients with symptomatic VMT.40,47,48 Consequently, OCT is useful in monitoring subtle changes in vitreoretinal adhesions and retinal architecture and assisting the treatment decision-making process.
Epiretinal membrane
ERM occurs in approximately 6% of patients over the age of 60, with incidence increasing with age.49,50 ERMs can be classified as idiopathic or secondary to an initiating event. Most idiopathic ERMs are thought to result from fibroglial proliferation on the inner surface of the retina secondary to a break in ILM occurring during posterior vitreous detachment.51,52 Secondary ERMs result from an already-existing ocular pathology such as central or branch retinal vein occlusion, diabetic retinopathy, uveitis, and retinal breaks with or without detachment.53 Glial cells, RPE cells, and myofibroblasts are shown to be mostly involved in ERM formation.51,52 ERM may lead to loss of normal retinal anatomy, with the patient experiencing metamorphopsia, micropsia, monocular diplopia, and decreased visual acuity. These symptoms vary in severity depending on the location, density, and contraction of the membrane.
On slit-lamp biomicroscopy, a mild ERM appears as a glistening layer on the retinal surface. Denser membranes may be seen as a gray sheet overlying the retina and causing distortion in the macular vascular architecture. Occasionally, ERMs can evolve into macular pseudoholes and ERMs are often seen in conjunction with idiopathic full-thickness macular holes.38 Fluorescein angiography may demonstrate macular leakage, which can be variable from case to case.
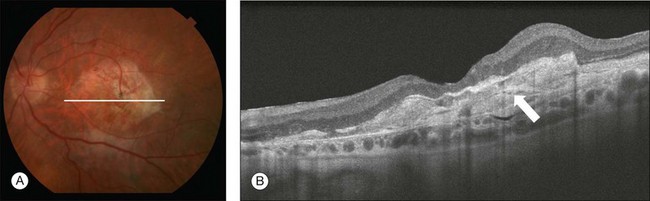
OCT provides qualitative and quantitative information about the retinal anatomy, which can identify factors contributing to vision loss in patients with ERM. On OCT, ERMs are seen as a highly reflective layer on the inner retinal surface (Fig. 3.11). In most eyes, the membrane is globally adherent to the retina but, in some cases, it can be separated from the inner aspect of the retina, which enhances its visibility by OCT. In this situation, it is usually distinguishable from a detached posterior hyaloid. Secondary effects of the membrane include loss of the normal foveal contour, increased retinal thickness, and the presence of cystoid changes, and these features may be observed in more advanced membranes. OCT is useful for monitoring changes in cases that are being observed and for documenting the response to treatment in patients undergoing pars plana vitrectomy with membrane peeling.
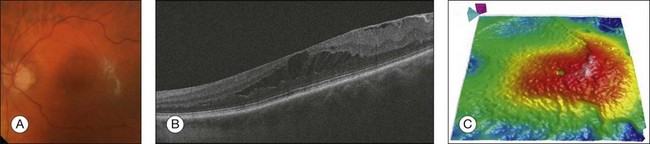
Fig. 3.11 Epiretinal membrane – color fundus image of the left eye of a 65-year-old man with grayish tissue over the retina (A). Cross-sectional optical coherence tomography image showing a hyperreflective tissue overlying the retina, resulting in increased retinal thickness and cysts in the retina (B and C).
Macular hole
Idiopathic macular holes typically occur in the sixth to seventh decade of life with a 2 : 1 female preponderance. Symptoms include decreased visual acuity, metamorphopsia, and central scotoma. Bilateral involvement occurs in 15–20% of patients.21
A full-thickness defect in the neural retina as seen with OCT can differentiate a true macular hole from a pseudohole seen clinically. Pseudoholes are seen in the presence of a dense sheet of ERM with a central defect that overlies the foveal center, giving the ophthalmoscopic appearance of a true macular hole.21,54
Gass described the stages of macular hole formation based on biomicroscopic findings.55 A stage 1 impending hole is characterized by a foveal detachment seen as a yellow spot (1A) or ring (1B) in the fovea (Fig. 3.12A). Spontaneous resolution will occur in approximately 50% of these cases. In stages 2–4, there is a full-thickness retinal defect, with a complete absence of neural retinal tissue overlying the foveal center. What differentiates these stages is the size of the retinal defect (<400 µm in stage 2 and >400 µm in stage 3) or the presence of a complete posterior vitreous detachment regardless of the hole size (stage 4) (Fig. 3.12B).
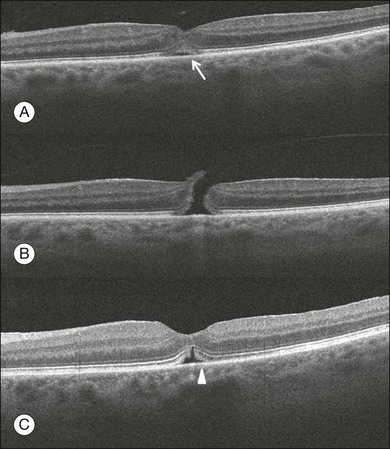
Fig. 3.12 Macular hole. (A) Stage 1 macular hole in a 63-year-old woman with a 3-month history of decreased visual acuity (20/60). An outer retinal defect can be observed in the B-scan (arrow). (B) A full-thickness retinal defect developed after 2 months of follow-up with worsening in the visual acuity (20/80). The posterior vitreous remains adhered to the edge of the macular hole. (C) One month after surgery, the macular hole was closed and the visual acuity improved to 20/50, but a persistent foveal outer defect could be observed (arrowhead).
OCT has enhanced our understanding of the pathogenesis of macular holes, the healing process after surgical repair, and helped in identifying pre- and postoperative features that are related to visual outcome. The anatomic changes identified on OCT have been correlated with the various stages of macular hole. In stage 1A, patients usually present with a localized foveolar detachment, which can resolve spontaneously after the posterior vitreous detachment with resolution of the yellow foveal spot, or it can progress to stage 1B with a development of a pseudocyst with loss of the outer retinal layers, and later develop into a full-thickness macular hole.56,57 Generally, the retinal defect is accompanied by a variable amount of intraretinal fluid appearing as cysts and a variable amount of subretinal fluid at the edge of the hole. The edge of the hole can appear elevated, as a result of the significant intraretinal fluid accumulation or due to persistent vitreofoveal traction. In a stage 4 macular hole, OCT can demonstrate the complete hyaloid separation and occasionally a retinal operculum can be seen floating above the foveal center.
Vitrectomy has become the standard treatment for macular hole with anatomical success rates of 85–100%.58,59 OCT can be used to confirm complete macular hole closure and restoration of the normal foveal contour.60–63 In cases with suboptimal postoperative visual outcomes, OCT can visualize persistent retinal abnormalities despite anatomically successful macular hole surgery (Fig. 3.12C). Restoration of the ELM and the so-called junction of the inner and outer segment of photoreceptors may reflect the morphologic and functional recovery of the photoreceptors in surgically closed macular holes.62–65 A residual small defect in the ELM is often still evident in closed holes, particularly in those that are spontaneously healed. The ability to perform OCT imaging in eyes filled with gas or silicone oil has also been useful as an adjunct to determine the extension of the face-down position in patients following vitrectomy for macular hole.66–68
Age-related macular degeneration
AMD is a common cause of irreversible vision loss among the elderly worldwide. It is estimated that approximately 30% of adults older than 75 years have some sign of AMD and that approximately 10% of these patients have advanced stages of the disease.69–72 AMD can be classified in two forms: non-neovascular (dry) and neovascular (wet or exudative). The non-neovascular form accounts for 80–90% of cases while the neovascular form accounts for 10–20% of cases, but was responsible for the majority of severe vision loss (80–90%) prior to the widespread use of vascular endothelial growth factor (VEGF) inhibitors.71,73
Non-neovascular AMD
Non-neovascular (dry) AMD is characterized by abnormalities of the RPE, Bruch’s membrane, and choriocapillaris. These abnormalities may be asymptomatic or accompanied by compromised vision, and are considered to be the precursors of GA and choroidal neovascularization (CNV).74,75
Early non-neovascular AMD: drusen and pigmentary changes: Drusen appear clinically as focal white–yellow excrescences deep to the retina. They vary in number, size, shape, and distribution. Several grading strategies have been developed to image drusen using color fundus imaging.76,77 Although color fundus imaging is useful for assessing the appearance of drusen, these images only provide two-dimensional area information on the geometry of the drusen and cannot be used to measure quantitative properties such as drusen volume. Until the advent of high-speed spectral domain technology, evaluation of drusen with OCT was often difficult as motion artifacts commonly resulted in apparent undulation of the RPE, mimicking the appearance of drusen.78,79 SD-OCT can provide a three-dimensional, geometric assessment of drusen.
The high-definition B-scans obtained with SD-OCT are useful to assess the ultrastructure of drusen and to evaluate for evidence of disruption of adjacent retinal layers. Drusen are seen as discrete areas of RPE elevation with variable reflectivity, which is consistent with the variable composition of the underlying material (Fig. 3.13).80,81 In larger drusen or drusenoid retinal pigment epithelial detachments (PEDs), the RPE has a greater elevation with a dome-shaped configuration.82 Larger drusen may often become confluent and can sometimes be accompanied by fluid accumulation under the retina in the absence of CNV (Fig. 3.14).80 Recognition of this feature may avoid unnecessary treatment with anti-VEGF drugs. SD-OCT imaging has the resolution to evaluate the retinal layers overlying drusen. A thinning in the photoreceptor layer can be observed in up to 97% of cases, with average photoreceptor layer thickness reduced by 27% compared to age-matched control eyes. The inner retinal layers usually remain unchanged. These findings demonstrate a degenerative process with photoreceptor loss leading to visual impairment.83
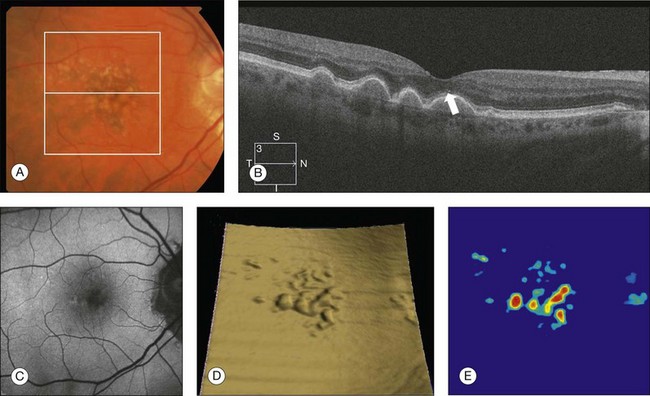
Fig. 3.13 Early non-neovascular age-related macular degeneration. (A) Color fundus image of the right eye of a 61-year-old man with drusen and pigmentary changes in the macula. (B) Foveal B-scan showing the drusen as elevations of the retinal pigment epithelium (RPE). The inner and outer segment junction of the photoreceptors adjacent to the drusen appears disrupted (arrow). (C) Fundus autofluorescence illustrating that drusen cannot be reliably identified by this imaging modality. (D) RPE segmentation map showing drusen in a unique three-dimensional perspective. (E) RPE elevation map providing the drusen area (1.37 mm2) and volume (0.063 mm3).
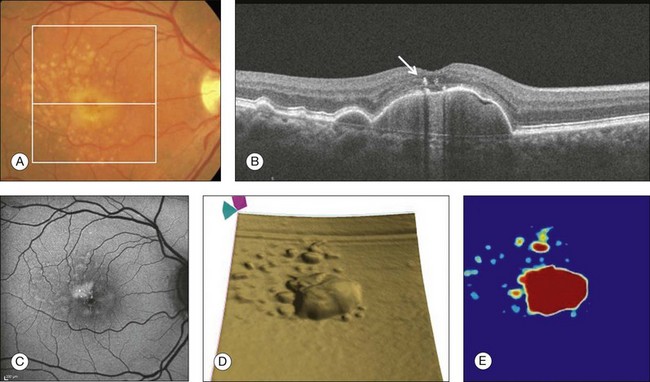
Fig. 3.14 Drusenoid retinal pigment epithelium detachment (DPED). (A) Color fundus image of the right eye of a 66-year-old man with a DPED and pigmentary changes in the macula. (B) Foveal B-scan showing the confluent drusenoid material as a large elevation of the retinal pigment epithelium (RPE). Intraretinal pigment migration can be observed (arrow). (C) Fundus autofluorescence image (Heidelberg retina angiograph, Heidelberg). (D) RPE segmentation map showing the DPED in a three-dimensional perspective. (E) RPE elevation map providing the DPED area (3.87 mm2) and volume (0.508 mm3).
The acquisition of dense raster scans comprised of a large number of lower-density B-scans combined with the use of segmentation algorithms results in the ability to generate maps of the RPE, which provides information on RPE geometry and therefore a unique perspective of drusen. A novel algorithm developed to identify RPE deformations such as drusen has been shown to be highly reproducible in the measurement of drusen area and volume.13 The algorithm creates a drusen map from a scan pattern of 40 000 uniformly spaced A-scans organized as 200 A-scans in each B-scan and 200 horizontal B-scans, covering an area of 6 × 6 mm centered in the fovea. The algorithm uses the actual RPE geometry and compares this RPE map to a virtual map of the RPE free of any deformations (RPE floor). The algorithm creates a difference map from these two maps, which permits reproducible measurements of drusen area and volume (Fig. 3.6). This algorithm was used to study the natural history of drusen in AMD.14 Drusen were shown to undergo three different growth patterns. In most eyes, drusen were found to increase in volume and area. Drusen could also remain stable or they could dramatically decrease over time. When these drusen decreased, they could evolve into GA or neovascular AMD, or they could decrease, resulting in no apparent residual anatomic defect in the macula.
The RPE cells are capable of hypertrophy and proliferation in response to different stimuli and in many cases an intraretinal pigment migration may occur (Fig. 3.14B). The Age-Related Eye Disease Study research group reported a severity scale defining large drusen (≥125 µm) and pigment abnormality in the macula as being a risk factor for disease progression in patients with intermediate AMD.84,85 This pigmentary abnormality can be observed on OCT imaging as small discrete hyperreflective lesions within the neurosensory retina, usually within the outer nuclear layer.86
Typical drusen in AMD are seen as deposits between the RPE and the inner collagenous layer of Bruch’s membrane. OCT imaging is also useful for the assessment of a variety of conditions characterized by variant forms of drusen. These deposits can also be seen on top of the RPE and are known as “subretinal drusenoid deposits.”87,88 They appear on OCT imaging as granular hyperreflective material between the RPE and the IS/OS junction and are also well visualized on blue-light reflectance imaging and autofluorescence imaging (Fig. 3.15).
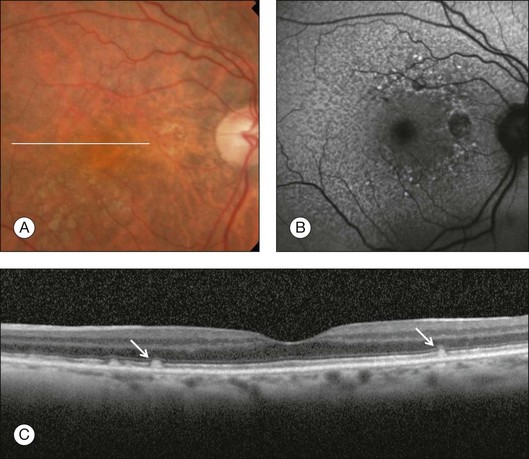
Fig. 3.15 Subretinal drusenoid deposits. (A) Color fundus image of a 76-year-old woman shows multiple yellowish, small, and round lesions. (B) Fundus autofluorescence clearly shows these deposits as small and multiple hyperautofluorescent spots. (C) On optical coherence tomography, these lesions appear as multiple areas of granular hyperreflectivity between the retinal pigment epithelium and the inner segment–outer segment junction (arrows).
Another form of drusen, known as “cuticular drusen,” appears as numerous, uniform, round, yellow-white punctuate accumulations under the RPE. Cuticular drusen are usually seen on OCT imaging as elevations of the RPE with occasional disruption of the overlying IS/OS junction and ELM.81 Although cuticular drusen, subretinal drusenoid deposits, and soft drusen are composed of common components, they are distinguishable by multimodal imaging because of differences in location, morphology, and the optical properties of the drusenoid material and the RPE.
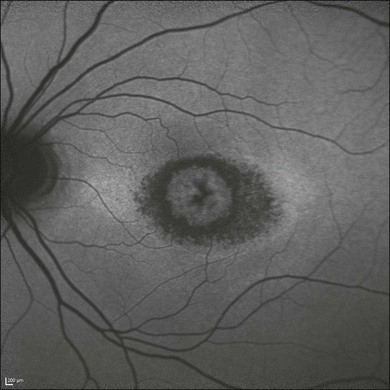
Late non-neovascular AMD: geographic atrophy: The natural history of GA has been described as a progressive condition that evolves through stages with loss of vision occurring over many years.89–91 Multiple imaging modalities have been used to document and quantify the area of GA. Until recently, color fundus photography was used as the standard method to image GA; however, the use of color photos can be challenging due to the reported difficulty in detecting and accurately delineating GA.91,92 Other imaging modalities such as fluorescein angiography, fundus autofluorescence, and SD-OCT imaging are now used to evaluate and quantify GA (Fig. 3.16). Although these imaging modalities provide different information, none has been shown to be superior to the other.
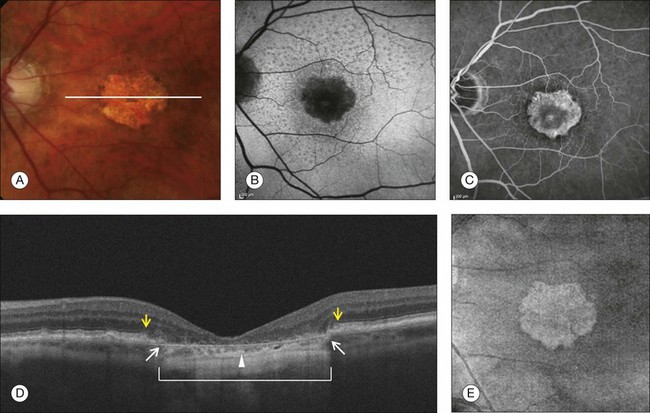
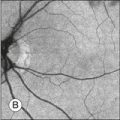
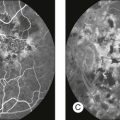
Fig. 3.16 Geographic atrophy (GA). (A) Color fundus image of the left eye of a 74-year-old male with central GA secondary to age-related macular degeneration. (B) Fundus autofluorescence (Spectralis, Heidelberg) showing a central area of hypoautofluorescence corresponding to the GA seen on the color image. (C) Late-phase fluorescein angiography showing a central window defect corresponding to the GA. (D) Horizontal B-scan through the foveal center demonstrating retinal thinning, loss of the retinal pigment epithelium (RPE), and photoreceptors. The loss of photoreceptors (yellow arrows) often extends beyond the margins of the RPE loss (white arrows). Observe the increased light penetration in the areas where the RPE is absent (bracket) and thin choroid (arrowhead). (E) Optical coherence tomography fundus image (courtesy of Cirrus, Carl Zeiss Meditec), showing the GA as a bright area.
GA is seen clinically as one or more well-demarcated areas of hypopigmentation or depigmentation due to the absence or severe attenuation of the underlying RPE. The larger, deeper choroidal vessels are more readily visualized through the atrophic areas, and are accompanied by varying degrees of photoreceptor and choriocapillaris loss. Associated retinal atrophy is seen as thinning or loss of the outer nuclear layer and the absence of ELM and IS/OS junctions.93,94 The loss of photoreceptors often extends beyond the margins of GA, with the ELM and IS/OS junctions disappearing while bridging across the GA margin.95 Evaluation of these junctional zones may provide information about the pathogenesis of GA, and the role of RPE, photoreceptor, and choriocapillaris loss in the initiation and propagation of this condition.95 SD-OCT has been shown to be useful in detecting some of these morphologic alterations (Fig. 3.16D).
With the use of SD-OCT enhanced depth imaging (EDI) protocols, it is now possible to visualize the structure of the choroid in greater detail.29 EDI demonstrated that subfoveal choroidal thickness decreases with age and axial length.31 In a subset of elderly patients complaining of unexplained vision loss, abnormal choroidal thinning was identified, and this condition was named “age-related choroidal atrophy.”96 Future studies are necessary to confirm if this represents a new clinical entity or a subtype of AMD. In contrast, the choroidal thickness appears to be unaffected in early non-neovascular AMD patients.97
SDOCT can also be used to quantify the areas of GA and monitor the progression of the disease. GA is currently imaged with SDOCT by using the OFI, which represents a virtual fundus image resulting from the en face summation of the reflected light from each A-scan. This en face OCT fundus image identifies GA as a bright area due to the increased penetration of light into the choroid where atrophy has occurred in the macula. The absence of the RPE and choriocapillaris is responsible for this increased penetration of light associated with GA. The OFI was shown to correlate well with the GA seen on clinical examination, color fundus imaging, and autofluorescence imaging (Fig. 3.16E).12,98,99 More recently, a newer algorithm provides an enhanced (partial) OFI, which is the summation of the reflected light from beneath the RPE (Fig. 3.17). In addition, this new algorithm is able to quantify the area of GA automatically. The enhanced OFI has advantages over the conventional OFI because the area of GA appears brighter than in the conventional OFI due to a better contrast at the boundaries of the lesions and there is less interference from other macular pathologies such as ERMs.
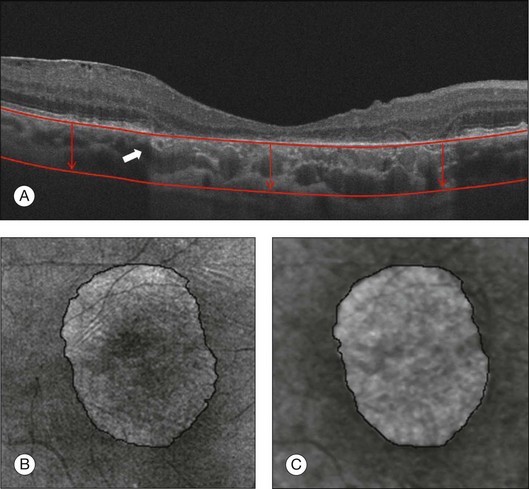
Fig. 3.17 Geographic atrophy (GA). (A) Horizontal B-scan through the foveal center of a 73-year-old man with GA showing increased light penetration in the areas where the retinal pigment epithelium (RPE) is absent. The white arrow shows the junction where the RPE is present and absent. (B) Optical coherence tomography (OCT) fundus image (OFI) represents a virtual fundus image resulting from the en face summation of the reflected light from each A-scan. GA lesions are identified as a bright area due to the increased penetration of light into the choroid where atrophy has occurred. (C) Enhanced OCT fundus image (courtesy of Cirrus, Carl Zeiss Meditec), which represents the summation of the reflected light from beneath the RPE (red lines and arrows on (A)).
Neovascular AMD: The neovascular (wet) form of AMD is characterized by the overproduction of VEGF and the growth of abnormal vessels in the macular region. These vessels may arise from the choroidal circulation and penetrate Bruch’s membrane to form a fibrovascular tissue beneath or above the RPE, or these vessels may arise primarily from the retinal circulation. In either case, the presence of VEGF and abnormal vessels leads to structural changes in the retina and choroid with the accumulation of fluid within the retina, in the subretinal space, or under the RPE. Furthermore, this neovascular invasion may lead to significant disorganization and remodeling of the retina, resulting in the loss of the RPE and photoreceptors with the formation of a disciform scar.100,101
Intraretinal and subretinal fluid
The growth of neovascularization is often accompanied by VEGF-dependent leakage from both the mature vessels and the growing immature vessels. Intraretinal edema can range from mild retinal thickening of the outer nuclear layer to large and diffuse cystoid edema, seen as round or oval hyporeflective areas (Fig. 3.18).21 Lipid exudation can also be present in patients with profuse intraretinal edema and appear as small hyperreflective dots in the outer retina. The fluid may also accumulate in the space between the RPE and the neurosensory retina. The subretinal fluid appears on OCT imaging as homogeneous hyporeflective spaces when the fluid exudation is serous, or may be separated by fibrinous membranes when profuse proteinaceous exudation is present.102 Usually neovascular lesions growing in the subretinal space are associated with a larger volume of subretinal fluid compared with sub-RPE lesions.103
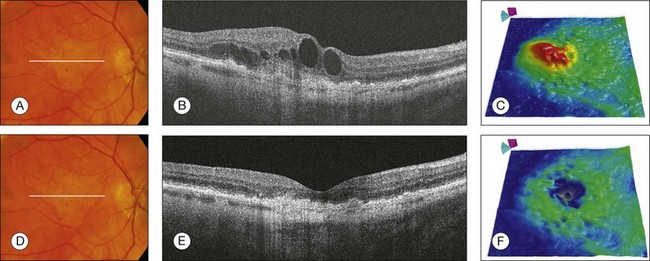
Fig. 3.18 Neovascular age-related macular degeneration. (A) Color fundus image of the right eye of an 81-year-old man with a 1-month history of vision loss. Visual acuity was 20/100. (B) Horizontal B-scan through the foveal center showing retinal thickening and the presence of intraretinal fluid with large cysts. (C) Retinal thickness map (courtesy of Cirrus, Carl Zeiss Meditec) showing the increase in retinal thickness (red areas). After three intravitreal injections of antivascular endothelial growth factor, the intraretinal fluid was reabsorbed (D). This is better observed in the B-scan and retinal thickness map (E, F).
Retinal pigment epithelium detachment
In wet AMD, a retinal PED is formed by the separation of the RPE from Bruch’s membrane due to the presence of sub-RPE fluid, blood, or fibrovascular tissue. A serous PED is defined as an area of smooth, sharply demarcated dome-shaped elevation of the RPE, often yellow–orange in color with a reddish halo of subretinal fluid. On fluorescein angiography, serous PEDs are associated with early hyperfluorescence with a well-defined border, which increases gradually throughout the study and classically demonstrates a pooling of dye rather than leakage.104,105 Serous PEDs can be categorized as vascular or avascular.106 On OCT imaging, serous PEDs appear as a dome-shaped elevation of the RPE typically seen overlying a homogeneously hyporeflective space, bound inferiorly by a visible Bruch’s membrane, which is seen as a thin hyperreflective line at the outer aspect of the PED (Fig. 3.19).107,108 The appearance of vascularized serous PEDs is similar. However, in some cases, the apparent fibrovascular proliferation can be seen adjacent to the PED and even adherent to the outer surface of the RPE.
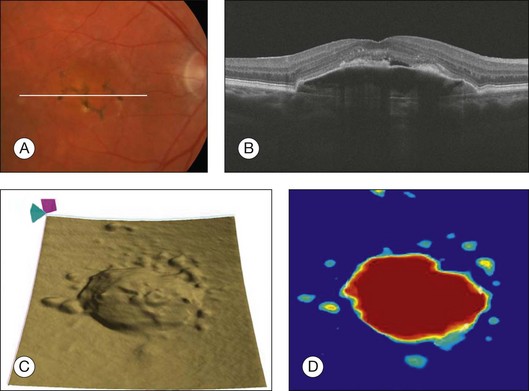
Fig. 3.19 Vascularized serous retinal pigmented epithelium detachment (PED). (A) Color fundus image of the left eye of a 77-year-old woman with pigmentary changes in the macula associated with an elevation of the macula. (B) Horizontal B-scan through the fovea showing a dome-shaped retinal pigment epithelium (RPE) elevation overlying a homogeneous hyporeflective space. Observe the presence of subretinal fluid above the PED. (C) RPE segmentation map showing a three-dimensional perspective of the PED. (D) RPE elevation map showing the area (5.84 mm2) and volume (0.83 mm3) measurements of the PED.
The fibrovascular PED usually produces an irregularly elevated lesion visible on clinical examination and can be associated with RPE hyperpigmentation, subretinal hemorrhage, subretinal lipid exudation, and intra- or subretinal fluid collection.109 The elevation is often low and the borders are ill defined. The detailed structural characteristics and precise mechanism of PED formation have not been completely resolved. Recent studies using SD-OCT imaging revealed that many of the fibrovascular PEDs appear to be filled with solid layers of material of medium reflectivity, separated by hyporeflective clefts (Fig. 3.20).110
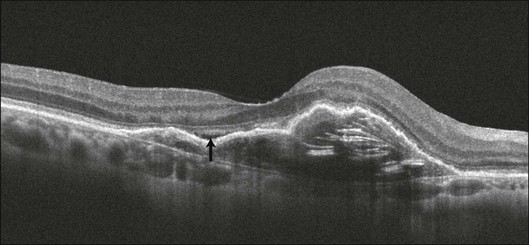
Fig. 3.20 Fibrovascular retinal pigmented epithelium detachment (PED). Cross-sectional B-scan of the right eye of an 87-year-old woman with a fibrovascular PED. The space below the retinal pigment epithelium is filled with solid layers of medium reflectivity separated by hyporeflective clefts. A small amount of subretinal fluid can be identified over the PED (arrow).
Hemorrhagic PEDs occur when a CNV membrane bleeds into the sub-RPE space or as a result of an RPE tear. The hemorrhage can invade the subretinal space, with the sub-RPE blood having a typically darker appearance than subretinal blood. OCT demonstrates a dome-shaped lesion, similar to serous PEDs, although the slope of the elevation is more acute and the blood under the RPE appears hyperreflective, attenuating the signal from deeper structures, with the loss of choroidal detail (Fig. 3.21).107,109,111
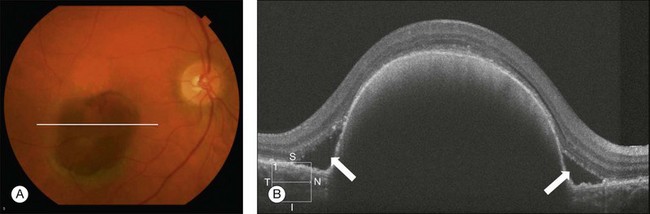
Fig. 3.21 Hemorrhagic retinal pigmented epithelium detachment (PED). (A) Color fundus image of the right eye of a 65-year-old woman with a large subretinal pigment epithelium (RPE) hemorrhage secondary to neovascular age-related macular degeneration. (B) Optical coherence tomography demonstrates a dome-shaped lesion, similar to serous PEDs. The blood under the RPE appears hyperreflective, attenuating the signal from deeper structures. Subretinal fluid can be observed as hyporeflective spaces above the RPE (arrows).
In addition, the same algorithm used to measure drusen can be used to measure PEDs, since both involve the deformation of the RPE. This algorithm is able to measure both the area and volume of PEDs (Fig. 3.19D). In addition, algorithms may be developed to characterize the internal architecture of the PEDs automatically.112 The qualitative appearance of the B-scans and the qualitative and quantitative changes in the retinal thickness maps and RPE elevation map can be used to appreciate better the natural history of the disease and to monitor the effect of anti-VEGF therapy in patients with PEDs associated with wet AMD.
Tear of the retinal pigment epithelium
RPE tears are most commonly seen in association with CNV secondary to AMD, especially when a PED is present.113,114 RPE tears may also be associated with central serous chorioretinopathy (CSC), trauma, as well as other causes of CNV.115,116 Although RPE tears can occur spontaneously in AMD patients, they have also been related temporally to various treatments for AMD, such as verteporfin photodynamic therapy and intravitreal injection of anti-VEGF agents.117–121 Hemodynamic factors play a role in the pathogenesis of the tear. The RPE layer is put on stretch as a result of accumulating sub-RPE fluid and this stress leads to a tear in the RPE. A sheet of RPE cells then contracts and scrolls up upon itself in a radial fashion, leaving an area of retina without underlying RPE.114,122 Subretinal and sub-RPE hemorrhages frequently accompany an RPE tear, which appears ophthalmoscopically as an area of well-demarcated hyperpigmentation immediately adjacent to an area of relative hypopigmentation.
On OCT imaging, an area of discontinuity in a large PED is often seen, with the free edge of the RPE often curled under the PED. Adjacent to the tear, there is increased reflectivity from the choroid vessels, due to the absence of the RPE. The overlying retina is typically intact, but may be separated from the area of atrophy by subretinal fluid.114 The tear tends to occur at the base of the PED, near or at the intersection of attached and detached retina (Fig. 3.22).113 During anti-VEGF therapy, the height of the PED and the irregular surface contour may help in predicting the risk for RPE tear, which may also occur without treatment as part of normal disease progression.123,124 The visual outcome in patients with RPE tears is generally poor when the fovea is involved.
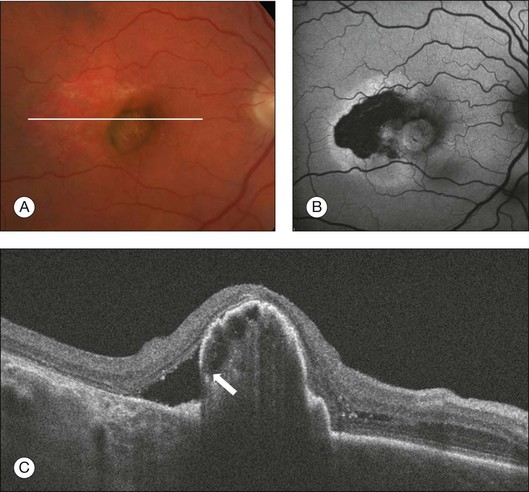
Fig. 3.22 Retinal pigment epithelium (RPE) tear. (A) Color image of the right eye of an 81-year-old man with an area of relative hypopigmentation that corresponds to the RPE tear. (B) Heidelberg fundus autofluorescence showing hypoautofluorescence in the area where the RPE is absent. (C) On the B-scan there is an area of discontinuity of the RPE near the base of the pigmented epithelium detachment with the free edge of the RPE curled under the pigmented epithelium detachment (arrow).
Disciform scarring
Disciform scarring and subretinal fibrosis mark the endstage of CNV. The vascular components of CNV typically regress as the lesion becomes less active, and the fibrous components typically increase, resulting in disciform scar formation. Clinically the scar appears as smooth, elevated white or gray tissue in the subretinal space and on OCT imaging the scar corresponds to a highly reflective outer retinal or subretinal lesion (Fig. 3.23).21 Scar formation may be associated with loss of the overlying photoreceptor layer and irreversible reduction in visual acuity. This may be observed on OCT imaging as a disruption of the IS/OS junction and ELM.125,126 In this stage of the disease, the OCT is very helpful in identifying the presence of subretinal fluid or intraretinal cysts that are associated with the neovascular activity of the lesion, and may help in making the retreatment decision.
Retinal angiomatous proliferation
The term “retinal angiomatous proliferation” was introduced by Yannuzzi and coworkers to describe a form of neovascularization in AMD patients, which arises from within the retina with possible formation of a retinochoroidal anastomosis as the disease progresses.127 Whether the development of the retinochoroidal anastomosis is a result of a primary intraretinal neovascularization or a sub-RPE lesion remains controversial.127,128 Recently, studies with SD-OCT imaging concluded that the initial neovascular process could originate from either the retinal or choroidal circulation; however, histopathological studies suggest that all the neovascularization is within the retina.129,130 On OCT imaging, the most common feature is the presence of a serous PED with CME overlying the PED (Fig. 3.24).129,131,132 An intraretinal hyperreflective angiomatous complex consistent with the intraretinal neovascularization and subretinal fluid may also be seen.127
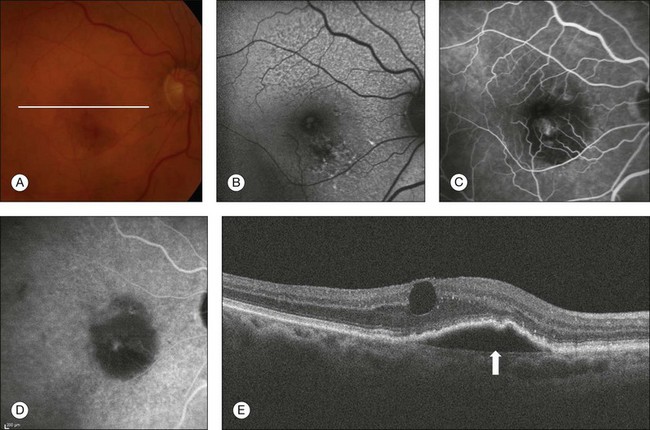
Fig. 3.24 Retinal angiomatous proliferation. (A) Color fundus image of the right eye of a 90-year-old woman with a history of blurred vision and metamorphopsia for 2 weeks. Visual acuity was 20/40. Fundus examination revealed multiple drusen, pigmentary changes, and hemorrhage inferior to the fovea with a subtle elevation of the retina. (B) Fundus autofluorescence demonstrates hypoautofluorescence in the area corresponding to the hemorrhage. (C) Fluorescein angiography demonstrates a focal area of leakage inferior to the fovea. (D) Late-phase indocyanine green angiography reveals a hot spot. (E) B-scan through the lesion reveals a retinal pigment epithelium detachment (arrow) with cystoid macular edema overlying the pigmented epithelium detachment.
Polypoidal choroidal vasculopathy
Polypoidal choroidal vasculopathy is considered a variant form of CNV characterized by the presence of multiple vascular sacular dilations (polyps) in the choroidal circulation that manifests clinically with variably sized serous and serosanguineous detachments of the neurosensory retina and RPE, usually around the optic nerve or in the central macula.133 Indocyanine green (ICG) angiography is particularly useful in imaging the polypoidal abnormalities seen in polypoidal choroidal vasculopathy, with a branching vascular network of vessels ending in polyp-like structures.134 SD-OCT images can demonstrate the polypoidal structure beneath the RPE, which remains adherent to the RPE, even with increased exudation. It is especially useful to detect the abnormalities surrounding the polypoidal lesions such as intraretinal, subretinal, and sub-RPE fluid.135,136
Choroidal neovascularization: response to treatment
The combination of clinical examination, fluorescein angiography, OCT images, and, less frequently, ICG angiography is usually required to diagnose neovascular AMD and exclude other macular conditions that can mimic the features of neovascular AMD.137 With the use of anti-VEGF drugs, the ideal strategy for following eyes with wet AMD has evolved from monthly injections to OCT imaging to determine whether the treatment is effective in resolving the macular fluid.138,139 Many alternative treatment regimens have used OCT-guided strategies, with good visual and anatomical results with fewer intravitreal injections compared with monthly dosing.140–144 The macular fluid can be identified by examining the B-scans and reviewing the retinal thickness maps, which calculate the retinal thickness between the ILM and the RPE segmentation maps. The effect of anti-VEGF therapy can then be assessed based on the qualitative appearance of the B-scans and the qualitative, as well as quantitative, changes in the retinal thickness maps (Figs 3.18 and 3.25). The presence or recurrence of intraretinal or subretinal fluid has to be differentiated from the appearance of “outer retinal tubulation”, since the latter represents a rearrangement of photoreceptors in response to injury and RPE loss and is usually present in patients with chronic and advanced neovascular AMD (Fig. 3.26). Importantly, this tubulation does not respond to anti-VEGF therapy.145 In patients with PEDs, the area and volume of the lesion can be assessed and used to monitor the effect of anti-VEGF therapy in patients with wet AMD associated with PEDs, and an increase in the area and volume of PEDs could be used to indicate when retreatment is necessary.
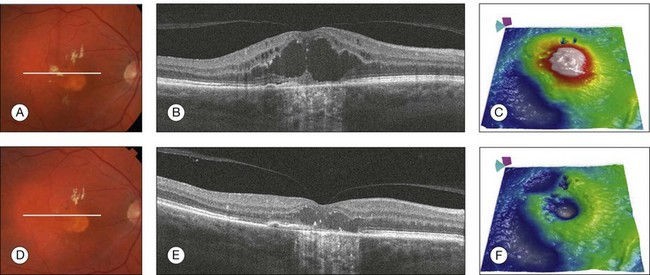
Fig. 3.25 Neovascular age-related macular degeneration (response to treatment). Color fundus image, horizontal B-scan, and retinal thickness map of the right eye of a 65-year-old man with wet age-related macular degeneration before (A–C) and after (D–F) a single treatment with intravitreal anti-vascular endothelial growth factor. Observe the improvement of the intraretinal fluid and cysts in the B-scans (B, E) and the decrease in retinal thickness (C, F).
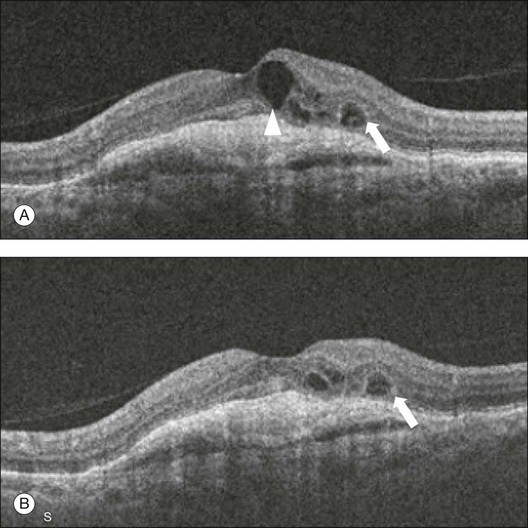
Fig. 3.26 Outer retinal tubulation: a 67-year-old woman with wet age-related macular degeneration who has received 13 intravitreal injections over the last 2 years. The foveal horizontal B-scans before (A) and after the last (B) treatment are presented. The larger intraretinal cyst present in the image before treatment (arrowhead) disappeared after treatment. The small cyst (arrow) showed no response to the intravitreal injection of anti-vascular endothelial growth factor. This smaller cyst corresponds to an outer retinal tubulation which is frequently present in patients with chronic and advanced neovascular age-related macular degeneration.
Central serous chorioretinopathy
CSC is an idiopathic syndrome that typically affects young to middle-aged males and is characterized by serous detachment of the neurosensory retina. Focal and multifocal areas of leakage secondary to increased permeability of the choroidal vessels and a barrier defect at the level of the RPE have been described in the pathogenesis of this disorder.146–148
Presenting symptoms include central vision loss, a decrease in vision that can be corrected with an increased hyperopic correction, metamorphopsia, central scotoma, and decreased color saturation. The symptoms are usually self-limited but can recur in the same or the opposite eye. In most cases, CSC resolves spontaneously within 6 months, with a good visual prognosis. However, prolonged and recurrent macular detachment in some cases may cause degenerative changes in the subfoveal RPE and neurosensory retina with poor visual outcome.149,150
The primary pathology of acute CSC is thought to begin with disruption of the choroidal circulation. The RPE then decompensates and exudation from the choroidal vasculature passes into the subretinal space. These hypotheses were based on fluorescein angiography and ICG angiography findings.147,151–154 The development of OCT imaging has provided a better understanding of CSC, especially the abnormalities in the RPE layer.155–159
There are two forms of the disease, acute and chronic. Acute CSC (Fig. 3.27) is classically unilateral and characterized by one or more focal leaks at the level of the RPE on fluorescein angiography. The chronic form (Fig. 3.28) is believed to be due to diffuse RPE disease and is usually bilateral. It presents with diffuse RPE atrophic changes, varying degree of subretinal fluid, RPE alterations, and RPE tracks. It is characterized by diffuse RPE leakage on fluorescein angiography.
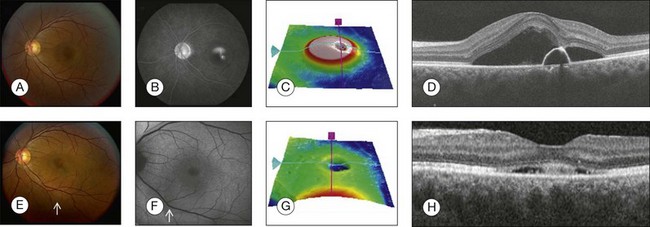
Fig. 3.27 Acute central serous chorioretinopathy. (A) Color photo shows a well-defined, circular area of retinal elevation. (B) Fluorescein angiography shows an area of hyperfluorescence with “smokestack” leakage. (C) Retinal thickness map shows elevation of the retina. (D) Spectral domain optical coherence tomography (OCT), horizontal, acquired through the fovea, shows serous detachment of the neurosensory retina above an optically clear, fluid-filled cavity, associated with a pigment epithelial detachment. The retinal pigment epithelium detachment corresponds to the area of hyperfluorescence seen on the angiogram. (E–H) Follow-up visit 1 month later. (E) Color photo shows resolution of the retinal elevation in the area of the fovea but illustrates a well-defined, circular area of retinal elevation inferior to the fovea (small arrow). (F) Fundus autofluorescence shows a well-defined, circular area of retinal elevation inferior to the fovea involving the inferior arcade (small arrow). (G) Retinal thickness map shows decrease in the thickness of the retina in the fovea. (H) Spectral domain OCT, horizontal B-scan acquired through the fovea, shows decrease in the amount of subretinal fluid.
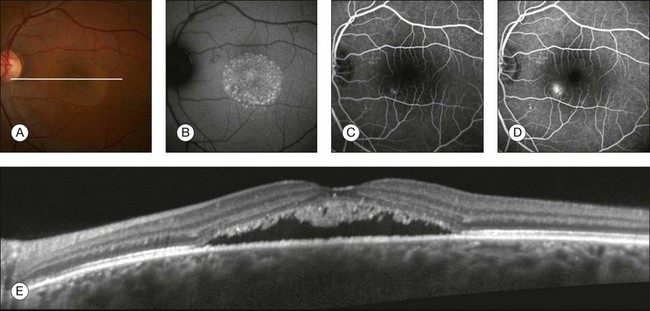
Fig. 3.28 Central serous chorioretinopathy. (A) Color photo shows a well-defined, circular area of retinal elevation; white line represents the location of the B-scan. (B) Fundus autofluorescence shows an area of hyperfluorescence. (C, D) Fluorescein angiography shows an inkblot appearance that leaks later. (E) Spectral domain optical coherence tomography shows serous detachment of the neurosensory retina associated with an irregular, granulated retinal pigment epithelial layer and sagging/dipping of the posterior layer of the neurosensory retina (asterisk).
OCT imaging is helpful in diagnosing and managing patients with CSC. OCT imaging can noninvasively identify the presence and extent of subretinal fluid and PEDs. OCT imaging is also useful for assessing the resolution of subretinal fluid and the morphological retinal changes during normal disease progression. OCT is more sensitive than clinical exam and fluorescein angiography in identifying small amounts of subretinal fluid.160 OCT is useful in predicting the recovery of visual acuity and explaining poor visual outcomes even after the resolution of the fluid. With SD-OCT imaging, topographic changes in CSC can be visualized with two- and three-dimensional reconstructions. SD-OCT also offers the ability of exact localization of the pathology and accurate volumetric measurements.161
OCT features of acute CSC include thickening of the neurosensory retina within the area of retinal detachment, PED, the presence of fibrinous exudates in the subretinal space, and the shaggy outer segments of the neurosensory retina above the leakage site. OCT features of the chronic form include foveal atrophy, retinal thinning, and cystoid degenerative changes.156,157,162–166 OCT can also visualize the subretinal yellow deposits as highly reflective material. Precipitates are not only on the posterior surface of the detached retina but also in the detached neurosensory retina. Photoreceptor segment morphologic changes along the detached retina show elongation of the photoreceptor outer segments and decreased thickness of the outer nuclear layer.167 Accumulation of abnormal outer segments in the neurosensory retina is related to clinical manifestation on OCT as a granulated shaggy profile of the outer surface of the detached retina.168
En face OCT imaging has been found to detect alterations of the RPE in the form of a PED or a small defect in the RPE. Most alterations of RPE are associated with choroidal abnormalities.159 OCT imaging has been found to detect morphologic changes at the point of dye leakage in eyes with CSC. Transverse images (C-scans) have shown serous retinal detachments and irregular lesions of the RPE. These findings, along with other findings on B-scans and segmentation maps, are consistent with location of lesions in areas of fluorescein angiographic leakage.169,170
Visual prognosis in patients with CSC can be linked to retinal morphological changes by OCT.171,172 Mastsumoto et al. correlated the visual outcome with the preservation of outer nuclear layer thickness and continuity of photoreceptor IS/OS in resolved CSC. The outer nuclear layer thickness was positively correlated with visual acuity. Discontinuity of the IS/OS line was prevalent in eyes with thinner outer nuclear layer and lower visual acuity.172 Ojima et al.171 reported that microstructural changes occur in the photoreceptor layer of the detached retina and the visualization of the ELM and the photoreceptor layer correlates with visual function. Foveal thickness can be a predictor of visual outcome in patients with CSC.163 Both foveal thickness and visual acuity have been observed to be proportional to the duration of symptoms, Foveal attenuation, and atrophy, which may be a consequence of prolonged absence of contact between photoreceptor and RPE cells.160
Enhanced depth imaging OCT in CSC
Conventional SD-OCT has a limited ability to image the choroid because of scattering by the pigment granules within the RPE and by the pigment and blood within the choroid, and because of a depth-dependent roll-off in sensitivity of SD-OCT instruments in general.29 A method to improve imaging of the choroid, known as EDI OCT, showed that eyes with CSC had a much thicker choroid compared with normal eyes (Fig. 3.29).173 Fellow eyes of patients with CSC were also found to have thicker choroids compared with age-matched normal eyes.174 Maruko et al. reported a thickened choroid in CSC and the association with choroidal vascular hyperpermeability on ICG angiography.175
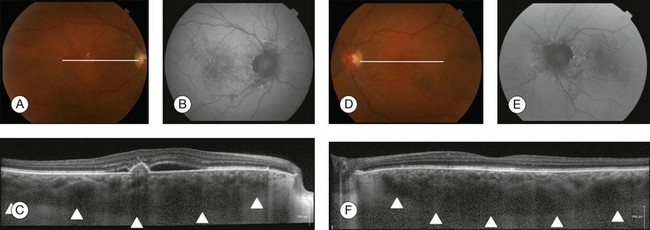
Fig. 3.29 Central serous chorioretinopathy. (A) Color photo of the right eye shows area of retinal elevation with pigmentary changes; white line represents the position of B-scan. (B) Fundus autofluorescence shows an area of hyperfluorescence and hypofluorescence. (C) Spectral domain optical coherence tomography (OCT), enhanced depth imaging, shows serous detachment of the neurosensory retina along with pigmented epithelium detachment, retinal pigment epithelial alterations, granulated posterior detached retina, and thick choroid (arrowheads represent the outer boundary of the choroid). (D) Color photo of the left eye shows pigmentary changes without retinal elevation; white line represents location of B-scan. (E) Fundus autofluorescence shows an area of hyperfluorescence and hypofluorescence. (F) Spectral domain OCT, enhanced depth imaging, demonstrates a thick choroid (arrowheads represent the boundary of the choroid) without serous detachment of the neurosensory retina.
Verteporfin photodynamic therapy is one of the therapies used to treat leakage and subretinal fluid in eyes with CSC. Maruko et al.175 reported that eyes treated with focal laser showed no alteration in choroidal thickness even though there was fluid reabsorption, but eyes treated with verteporfin photodynamic therapy showed a decrease in choroidal thickness by SD-OCT imaging and a decrease in choroidal hyperpermeability seen during ICG angiography. The changes occurring in the choroid after photodynamic therapy may reflect a more normalized choroidal permeability.
Cystoid macular edema
CME is an important cause of reduced visual acuity in a wide variety of retinal diseases such as diabetic retinopathy, retinal vein occlusion, CNV, retinal dystrophies, uveitis, and following intraocular surgery. Regardless of the underlying etiology, CME appears as retinal thickening with intraretinal cavities of reduced reflectivity on OCT (Fig. 3.30).
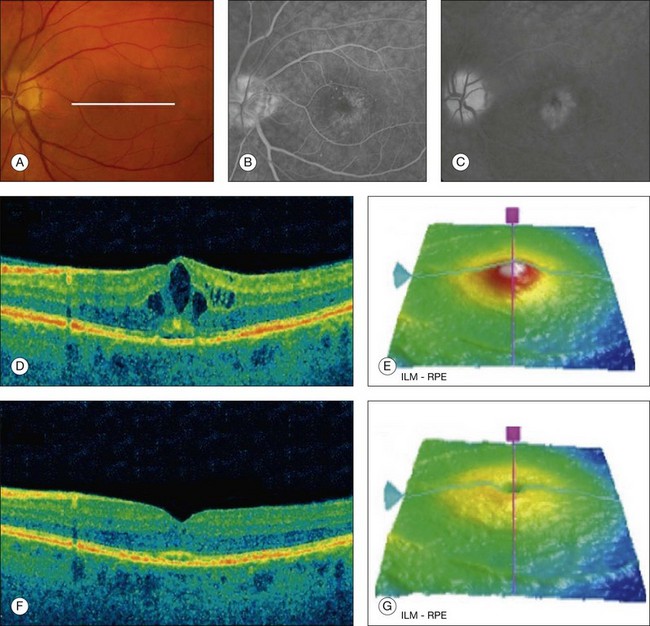
Fig. 3.30 Cystoid macular edema. Left eye of a 64-year-old man 30 days after phacoemulsification. The visual acuity was 20/50. (A) Color fundus image with some cystic changes; white line represents where the B-scan was acquired. (B, C) Fluorescein angiography showing the classic petaloid leakage pattern. (D) B-scan showing the intraretinal cysts as hyporeflective spaces within the retina. (E) Retinal thickness map showing increased retinal thickness due to the presence of cysts. (F, G) Same patient after 45 days of treatment with topical nonsteroid anti-inflammatory medication. The retinal thickness decreased and the intraretinal cysts disappeared. ILM, internal limiting membrane; RPE, retinal pigment epithelium.
Clinically significant pseudophakic CME is estimated to occur in 1–2% of patients undergoing cataract extraction.176,177 Inflammatory components induced by surgery along with mechanical forces induced by a modified vitreous are responsible for the macular changes in these patients.178,179 The diagnosis based only on fundus examination can be challenging and usually fluorescein angiographic imaging, which shows a classic petaloid pattern of leakage, or OCT imaging is needed for confirmation. OCT has the advantage of being a faster and noninvasive imaging technique which can also provide quantitative assessment of the macular thickness that can be used to monitor the clinical course and to make therapeutic decisions.
Diabetic retinopathy
Diabetic retinopathy is the leading cause of blindness in individuals under 65 years of age in the USA, with diabetic macular edema (DME) being the principal cause of vision loss in these patients.180,181 Diabetic retinopathy can be classified into nonproliferative diabetic retinopathy (NPDR) and proliferative diabetic retinopathy (PDR).
Nonproliferative diabetic retinopathy and diabetic macular edema
Determination of macular edema can be difficult with biomicroscopy or color fundus imaging, especially when the edema is mild.182–184 It has been suggested that OCT measurements may be a more sensitive and reproducible indicator of true change in retinal thickness than color fundus imaging, supporting the use of OCT as the principal method for documenting retinal thickness. However, OCT is less suitable than fundus imaging for documenting the location and severity of other morphologic features of diabetic retinopathy, such as hard exudates, retinal hemorrhages, microaneurysms, and vascular abnormalities. Furthermore, OCT cannot provide information on overall retinopathy severity, for which color photographs remain the gold standard.185–188
OCT can be used to distinguish patients with normal retinal contour and thickness despite extensive angiopathy from those with early retinal edema. In general, the DME can be classified into several categories: diffuse retinal thickening, CME, serous retinal detachment or subretinal fluid, and vitreomacular interface abnormality.189–191 Diffuse retinal thickening is usually defined as a sponge-like swelling of the retina with a generalized, heterogeneous, mild hyporeflectivity compared with normal retina. CME is characterized by the presence of intraretinal cystoid areas of low reflectivity, which are typically separated by highly reflective septa (Fig. 3.31). Serous retinal detachment is defined on OCT as a focal elevation of neurosensory retina overlying a hyporeflective, dome-shaped space. The posterior border of the detached retina is usually highly reflective, which helps to differentiate subretinal from intraretinal fluid. Vitreomacular interface abnormalities include the presence of ERMs, VMT, or both. Intraretinal focal hyperreflections that correspond clinically to retinal exudates are a frequent finding in all the patterns described above.
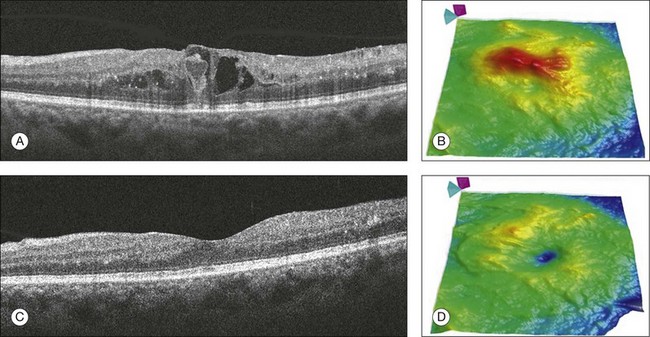
Fig. 3.31 Diabetic macular edema. Right eye of a 43-year-old woman with type 2 diabetes and moderate nonproliferative diabetic retinopathy. (A) B-scan and (B) retinal thickness map showing diffuse macular edema and the presence of intraretinal cysts with an increased retinal thickness. (C) B-scan and (D) retinal thickness map of the same patient after 3 months of intensive blood sugar control and focal laser therapy. The intraretinal cysts disappeared and the retinal thickness map shows an important decrease in the retinal thickness.
OCT has become widely accepted in monitoring progression and treatment response in patients with DME. Prior to OCT imaging, precision in central retinal thickness monitoring was not possible. The ETDRS provided guidelines for laser management of patients with DME.192–194 Although OCT was not available for use in this study, quantitative retinal thickness maps can be used to direct laser therapy and may be better than using biomicroscopy alone. In the era of pharmacotherapy, many agents like triamcinolone and anti-VEGF agents (ranibizumab and bevacizumab) have been studied to treat DME. In these studies, OCT played an important role in determining the retinal thickness and the treatment response.195,196 The treatment response of each OCT pattern of DME has been shown to be different.197 Patients with diffuse retinal thickening may achieve a greater reduction in retinal thickness and a greater improvement in visual acuity compared with patients exhibiting CME, subretinal fluid, or vitreomacular interface abnormality.197,198
Macular traction has become increasingly recognized in patients with DME, especially in eyes with persistent edema after focal laser or pharmacological treatment. These patients often show the clinical appearance of a thick posterior hyaloid with diffuse fluorescein leakage. Recognition of this condition can be difficult using the clinical exam alone. This is readily recognized on OCT imaging as diffuse cystoid retinal thickening, a flat-appearing foveal contour, and a thickened hyperreflective linear vitreoretinal interface. Focal vitreoretinal adhesions that cannot be identified on clinical exam are also often evident on OCT.199,200 These findings can direct the decision as to whether to proceed with pars plana vitrectomy and membrane peeling.201
Furthermore, the improvement in axial resolution with SD-OCT has enhanced the ability to evaluate foveal microstructural abnormalities, including the photoreceptor IS/OS junction, which may reveal damage to macular photoreceptors. Several studies have demonstrated that an intact IS/OS junction is predictive of a better visual acuity in patients after treatment for DME.202–204
Proliferative diabetic retinopathy
PDR can be visualized with OCT imaging as highly reflective preretinal bands anterior to the retinal surface, consistent with preretinal fibrovascular or fibroglial proliferation. Diffuse retinal thickening, distortion, and irregularity of the retinal contour can also occur as a result of the contraction of these preretinal membranes. An associated traction retinal detachment may be observed as well. OCT imaging is valuable in determining the extent of the tractional component as well as the presence of foveal involvement, assisting in the decision to intervene surgically (Fig. 3.32).21 The decision for surgery typically hinges on the progressive nature of the traction and the degree to which the macula is affected by the traction.
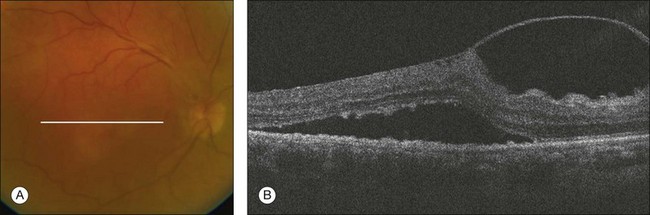
Fig. 3.32 Diabetic retinal tractional detachment. (A) Color fundus image of the right eye of a 72-year-old woman with proliferative diabetic retinopathy. (B) Foveal B-scan of the same patient showing a thick posterior hyaloid distorting the retinal architecture with traction and accumulation of fluid under the retina.
Retinal vein occlusion
Retinal vein occlusions have been defined as retinal vascular disorders characterized by engorgement and dilatation of the retinal veins with secondary, mostly intraretinal, hemorrhages and mostly intraretinal (and partially subretinal) fluid, retinal ischemia, including cotton-wool spots, and retinal exudates.205 Retinal vein occlusions are commonly divided into central retinal vein occlusion and branch retinal vein occlusion, and as soon as the foveal region is involved with macular edema, central visual acuity may be affected.
In retinal vein occlusions, OCT can display intraretinal cysts responsible for the increase in retinal thickness often associated with serous detachment of the neurosensory retina. Retinal cysts can be numerous and confluent, forming large central cystoid spaces. Associated findings can be observed, such as vitreous macular adherence, ERM, and hyperreflectivity of the posterior layer corresponding to atrophy or fibrosis of the RPE, subretinal accumulation of material, subretinal fibrosis, lamellar macular hole formation, intraretinal lipid exudates, and intraretinal hemorrhage (Fig. 3.33).
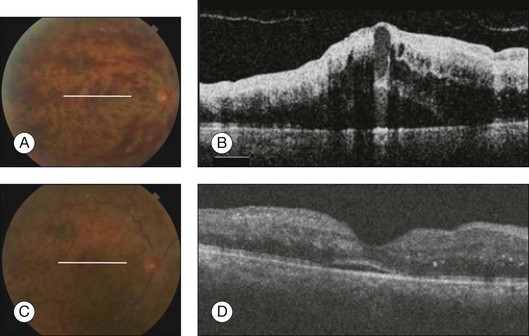
Fig. 3.33 Central retinal vein occlusion. (A) Color photo of the right eye shows optic nerve head edema, dilated tortuous retinal veins, scattered intraretinal hemorrhages in all quadrants, and macular edema; white line represents the location of the B-scan. (B) Spectral domain optical coherence tomography (OCT) obtained through the fovea illustrates loss of normal foveal contour and marked and diffuse retinal thickening. Large areas of low intraretinal reflectivity consistent with cystic fluid accumulation and edema were seen. A detachment of the neurosensory retina with subretinal fluid was observed below the fovea. (C) Color photo of the right eye 1 month after bevacizumab injection shows dilated tortuous retinal veins and scattered intraretinal hemorrhages in all quadrants; white line represents area of B-scan. (D) Spectral domain OCT, 1 month after bevacizumab injection obtained through the fovea, shows that macular edema almost completely disappeared with a small amount of residual subretinal fluid. Improvement in the normal foveal contour and decrease in the retinal thickening and edema. Areas of high intraretinal reflectivity consistent with the hemorrhages.
Ota et al. reported that, in branch retinal vein occlusion, visual function and recovery of vision are correlated with thickness of the central macula, and that is correlated with the integrity of the inner and outer segments of the photoreceptors in the fovea.206 SD-OCT imaging helps to quantify the amount of CME. The accumulation of fluid can be located mostly within the retinal layers or additionally in the subretinal space.207 Anti-VEGF therapy is increasingly used to treat macular edema in patients with retinal vein occlusions. Nevertheless, a significant proportion of eyes retain poor visual acuity despite treatment. Several studies have shown that low visual acuity has been associated with a poor functional outcome after treatment or during the natural course (Fig. 3.34). SD-OCT can help predict visual acuity based on the integrity of the neurosensory retina.
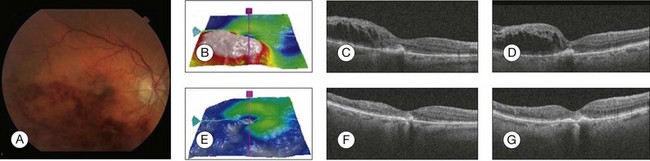
Fig. 3.34 Branch retinal vein occlusion. (A) Color photo of the right eye shows dilated tortuous retinal veins, flame-shaped hemorrhages in an arcuate configuration in the distribution of inferotemporal branch retinal vein occlusion, and macular edema. (B) Retinal thickness map showing increase in retinal thickness. (C, D) Spectral domain optical coherence tomography (OCT) horizontal and vertical scan respectively obtained through the fovea revealed that marked retinal thickening, areas of low intraretinal reflectivity consistent with cystic fluid accumulation, and edema were identified, especially in the outer plexiform layer. High reflectivity is noted in the inner layers from intraretinal hemorrhage. (E) Retinal thickness map 1 month after bevacizumab injection, showing decrease in retinal thickness. (F, G) Spectral domain OCT horizontal and vertical scan respectively, 1 month after bevacizumab injection, obtained through the fovea showed complete resolution of macular edema, improvement in foveal contour, and decrease in retinal thickening.
Central retinal artery occlusion
Central retinal artery occlusion shows a distinct pattern on OCT images. In the acute phase, OCT images demonstrate the increased reflectivity and thickness of the inner retina and a corresponding decrease of reflectivity in the outer layer of the retina and RPE/choriocapillaris layer. Follow-up OCT images demonstrate a decrease in the reflectivity and thickness of the inner retinal layers and a corresponding increase of reflectivity in the outer retina and RPE/choriocapillaris layer compared with the baseline OCT image, suggesting a generalized atrophy of the neurosensory retina as a late finding. Therefore, the use of OCT may help facilitate prompt recognition of acute and chronic central retinal artery occlusion. In patients with central retinal artery occlusion, OCT images closely correspond with known histopathologic changes. Histology following acute central retinal artery occlusion shows retinal changes limited to the nerve fiber and ganglion cell layers. There are profound losses of ganglion cells and diffuse edema of the inner retinal layers with little change seen in the deeper retinal layers supplied by choroidal vessels. OCT images provide an in vivo view of the retinal structure following central retinal artery occlusion. Increased reflectivity of the inner retina, presumably because of opacification of the ganglion cell and nerve fiber layers, corresponds to previously described histologic findings of “cloudy swelling” of these layers. Attenuation of reflectivity in the outer layer of the retina and the RPE/choriocapillaris layer is due to the ganglion cell and nerve fiber changes allowing less light reflected back from the outer portions of the retina. Further evidence of this phenomenon is at the foveal depression where the ganglion cell layer is absent. As more light is allowed through the fovea, the RPE/choriocapillaris layer directly beneath the fovea shows a relative increase in reflectivity compared with the other regions of the RPE/choriocapillaris. An additional finding on OCT imaging is the thinning and atrophy in the affected area of the retina, which occurs after a period of time (Fig. 3.35).208
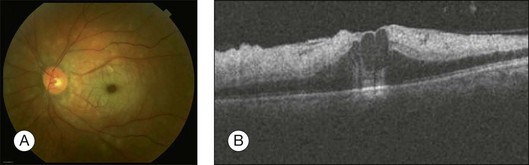
Fig. 3.35 Central retinal artery occlusion. (A) Color photo of the left eye shows cherry-red spot appearance, retinal opacity of posterior fundus, most marked in the parafoveal region, and a small area of normal retina temporal to the optic disc corresponding to the patent cilioretinal retinal artery. (B) Spectral domain optical coherence tomography horizontal scan through the fovea illustrates increased thickness and hyperreflectivity of the inner retinal layers, denoting the presence of intracellular edema, with decreased reflectivity of photoreceptor and retinal pigment epithelial layers because of the shadowing effect.
Branch retinal artery occlusion
Branch retinal artery occlusions are usually embolic in nature. The embolic source is either a carotid artery atheroma or myocardial thrombus. The embolus usually lodges at the bifurcation of the central retinal artery into the branch retinal artery. Histopathologically, acute branch retinal artery occlusions reveal ischemia in the corresponding retinal quadrant marked by inner retinal edema at the initial stage followed by atrophy in long-standing cases. SD-OCT imaging shows the edematous inner retina, comprising the inner nuclear layer, inner plexiform layer, and ganglion cell layer, as a hyperintense band with increased thickness, which is contrasted by the normal reflectivity and thickness of the corresponding layers of the unaffected macular regions. Prolonged ischemia results in consecutive atrophy of these layers with each layer exhibiting differential sensitivity to the underlying hypoxia. Animal experiments have revealed retinal ganglion cells to be relatively resistant to the ischemia compared to the other retinal neurons.209 Similar findings in vivo using SD-OCT imaging revealed the relative preservation of the ganglion cell layer as opposed to the thinning of the inner plexiform and nuclear layers (Fig. 3.36).210
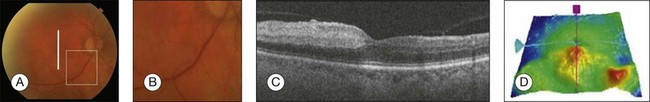
Fig. 3.36 Branch retinal artery occlusion. (A) Color photo of the right eye shows area of whitening in the distribution of an inferotemporal retinal arteriole: white vertical line represents location of B-scan; square dotted line represents area of embolus in arteriole which is magnified. (B) Embolus was appreciated in the inferior retinal arteriole next to the optic nerve. (C) Spectral domain optical coherence tomography (OCT) vertical scan through the fovea illustrates increased thickness and hyperreflectivity of the inner retinal layers in the inferior perifoveolar area, denoting the presence of intracellular edema, with decreased reflectivity of photoreceptor and retinal pigment epithelial layers. The asymmetry of optical reflectivity in perifoveal region is an important finding; OCT findings in the superior perifoveolar area are normal. (D) Retinal thickness map shows increased thickness in the inferior perifoveal area.
Future directions
Current commercial available SD-OCT instruments allow dense scanning of the macula with high axial resolution (approximately 5–8 µm). Ultrahigh-resolution OCT may achieve axial image resolution of 2–3 µm enabling better visualization of retinal structures. However, the price-versus-performance tradeoff remains, limiting the use of this technology to research applications.2 The use of adaptive optics to correct the ocular aberrations may increase not only the axial resolution, but also the transverse resolution of OCT systems and provide cellular level detail.211
Swept-source OCT systems allow significant increases in imaging sensitivity and speed (>300 000 A-scans per second), with decreased motion artifacts, through the use of a tunable laser and a photodetector. While swept-source OCT can achieve extremely high imaging speeds, the axial image resolution is less than that achieved using SD-OCT.2,212
Clinically available SD-OCT instruments operate with a light source of approximately 840 nm. This wavelength is highly scattered and absorbed by the melanin in the RPE and choroid, reducing the light penetration into deeper tissues. Imaging the retina with a wavelength of 1050 nm enables greater light penetration and thus a better visualization of choroidal structures.213,214 The use of this wavelength also has the advantage of less interference by media opacities such as cataract.215
In the field of functional OCT, Doppler OCT systems are able to detect the retinal blood flow by the assessment of light reflectivity in multiple successive datasets over short time periods.216 Polarization-sensitive OCT uses tissue birefringence properties to detect the health of different retinal layers. The combination of birefringence and thickness measurements may provide a more sensitive diagnostic tool than either alone.217,218
References
1. Gabriele, ML, Wollstein, G, Ishikawa, H, et al. Optical coherence tomography: history, current status, and laboratory work. Invest Ophthalmol Vis Sci. 2011;52:2425–2436.
2. Drexler, W, Fujimoto, JG. State-of-the-art retinal optical coherence tomography. Prog Retin Eye Res. 2008;27:45–88.
3. Li, Y, Gregori, G, Knighton, RW, et al. Registration of OCT fundus images with color fundus photographs based on blood vessel ridges. Opt Express. 2011;19:7–16.
4. Jiao, S, Knighton, R, Huang, X, et al. Simultaneous acquisition of sectional and fundus ophthalmic images with spectral-domain optical coherence tomography. Opt Express. 2005;13:444–452.
5. Han, IC, Jaffe, GJ. Evaluation of artifacts associated with macular spectral-domain optical coherence tomography. Ophthalmology. 2010;117:1177–1189.
6. Ho, J, Sull, AC, Vuong, LN, et al. Assessment of artifacts and reproducibility across spectral- and time-domain optical coherence tomography devices. Ophthalmology. 2009;116:1960–1970.
7. Mylonas, G, Ahlers, C, Malamos, P, et al. Comparison of retinal thickness measurements and segmentation performance of four different spectral and time domain OCT devices in neovascular age-related macular degeneration. Br J Ophthalmol. 2009;93:1453–1460.
8. Wolf-Schnurrbusch, UE, Ceklic, L, Brinkmann, CK, et al. Macular thickness measurements in healthy eyes using six different optical coherence tomography instruments. Invest Ophthalmol Vis Sci. 2009;50:3432–3437.
9. Srinivasan, VJ, Monson, BK, Wojtkowski, M, et al. Characterization of outer retinal morphology with high-speed, ultrahigh-resolution optical coherence tomography. Invest Ophthalmol Vis Sci. 2008;49:1571–1579.
10. Krebs, I, Smretschnig, E, Moussa, S, et al. Quality and reproducibility of retinal thickness measurements in two spectral-domain optical coherence tomography machines. Invest Ophthalmol Vis Sci. 2011;52:6925–6933.
11. Mwanza, JC, Oakley, JD, Budenz, DL, et al. Macular ganglion cell-inner plexiform layer: automated detection and thickness reproducibility with spectral domain-optical coherence tomography in glaucoma. Invest Ophthalmol Vis Sci. 2011;52:8323–8329.
12. Yehoshua, Z, Rosenfeld, PJ, Gregori, G, et al. Progression of geographic atrophy in age-related macular degeneration imaged with spectral domain optical coherence tomography. Ophthalmology. 2011;118:679–686.
13. Gregori, G, Wang, F, Rosenfeld, PJ, et al. Spectral domain optical coherence tomography imaging of drusen in nonexudative age-related macular degeneration. Ophthalmology. 2011;118:1373–1379.
14. Yehoshua, Z, Wang, F, Rosenfeld, PJ, et al. Natural history of drusen morphology in age-related macular degeneration using spectral domain optical coherence tomography. Ophthalmology. 2011;118:2434–2441.
15. Malamos, P, Ahlers, C, Mylonas, G, et al. Evaluation of segmentation procedures using spectral domain optical coherence tomography in exudative age-related macular degeneration. Retina. 2011;31:453–463.
16. Matt, G, Sacu, S, Buehl, W, et al. Comparison of retinal thickness values and segmentation performance of different OCT devices in acute branch retinal vein occlusion. Eye (Lond). 2011;25:511–518.
17. Krebs, I, Haas, P, Zeiler, F, et al. Optical coherence tomography: limits of the retinal-mapping program in age-related macular degeneration. Br J Ophthalmol. 2008;92:933–935.
18. Krebs, I, Falkner-Radler, C, Hagen, S, et al. Quality of the threshold algorithm in age-related macular degeneration: Stratus versus Cirrus OCT. Invest Ophthalmol Vis Sci. 2009;50:995–1000.
19. Patel, PJ, Chen, FK, da Cruz, L, et al. Segmentation error in Stratus optical coherence tomography for neovascular age-related macular degeneration. Invest Ophthalmol Vis Sci. 2009;50:399–404.
20. Drexler, W, Sattmann, H, Hermann, B, et al. Enhanced visualization of macular pathology with the use of ultrahigh-resolution optical coherence tomography. Arch Ophthalmol. 2003;121:695–706.
21. Schuman, JS, Pulliafito, CA. Optical coherence tomography of ocular diseases. Thorofare, NJ: Slack; 2004.
22. Gloesmann, M, Hermann, B, Schubert, C, et al. Histologic correlation of pig retina radial stratification with ultrahigh-resolution optical coherence tomography. Invest Ophthalmol Vis Sci. 2003;44:1696–1703.
23. Anger, EM, Unterhuber, A, Hermann, B, et al. Ultrahigh resolution optical coherence tomography of the monkey fovea. Identification of retinal sublayers by correlation with semithin histology sections. Exp Eye Res. 2004;78:1117–1125.
24. Lujan, BJ, Roorda, A, Knighton, RW, et al. Revealing Henle’s fiber layer using spectral domain optical coherence tomography. Invest Ophthalmol Vis Sci. 2010;52:1486–1492.
25. Spaide, RF, Curcio, CA. Anatomical correlates to the bands seen in the outer retina by optical coherence tomography: literature review and model. Retina. 2011;31:1609–1619.
26. Srinivasan, VJ, Ko, TH, Wojtkowski, M, et al. Noninvasive volumetric imaging and morphometry of the rodent retina with high-speed, ultrahigh-resolution optical coherence tomography. Invest Ophthalmol Vis Sci. 2006;47:5522–5528.
27. Toth, CA, Narayan, DG, Boppart, SA, et al. A comparison of retinal morphology viewed by optical coherence tomography and by light microscopy. Arch Ophthalmol. 1997;115:1425–1428.
28. Manjunath, V, Taha, M, Fujimoto, JG, et al. Choroidal thickness in normal eyes measured using Cirrus HD optical coherence tomography. Am J Ophthalmol. 2010;150:325–329.
29. Spaide, RF, Koizumi, H, Pozzoni, MC. Enhanced depth imaging spectral-domain optical coherence tomography. Am J Ophthalmol. 2008;146:496–500.
30. Chen, Y, Burnes, DL, de Bruin, M, et al. Three-dimensional pointwise comparison of human retinal optical property at 845 and 1060 nm using optical frequency domain imaging. J Biomed Opt. 2009;14:024016.
31. Margolis, R, Spaide, RF. A pilot study of enhanced depth imaging optical coherence tomography of the choroid in normal eyes. Am J Ophthalmol. 2009;147:811–815.
32. Ouyang, Y, Heussen, FM, Mokwa, N, et al. Spatial distribution of posterior pole choroidal thickness by spectral domain optical coherence tomography. Invest Ophthalmol Vis Sci. 2011;52:7019–7026.
33. Ikuno, Y, Kawaguchi, K, Nouchi, T, et al. Choroidal thickness in healthy Japanese subjects. Invest Ophthalmol Vis Sci. 2009;51:2173–2176.
34. Ikuno, Y, Maruko, I, Yasuno, Y, et al. Reproducibility of retinal and choroidal thickness measurements in enhanced depth imaging and high-penetration optical coherence tomography. Invest Ophthalmol Vis Sci. 2011;52:5536–5540.
35. Giammaria, D, Ioni, A, Bartoli, B, et al. Comparison of macular thickness measurements between time-domain and spectral-domain optical coherence tomographies in eyes with and without macular abnormalities. Retina. 2011;31:707–716.
36. Gass, J. Stereoscopic atlas of macular diseases: diagnosis and treatment. St Louis: Mosby-Year Book; 1997.
37. Uchino, E, Uemura, A, Ohba, N. Initial stages of posterior vitreous detachment in healthy eyes of older persons evaluated by optical coherence tomography. Arch Ophthalmol. 2001;119:1475–1479.
38. Smiddy, WE, Michels, RG, Green, WR. Morphology, pathology, and surgery of idiopathic vitreoretinal macular disorders. A review. Retina. 1990;10:288–296.
39. Johnson, MW. Perifoveal vitreous detachment and its macular complications. Trans Am Ophthalmol Soc. 2005;103:537–567.
40. Witkin, AJ, Patron, ME, Castro, LC, et al. Anatomic and visual outcomes of vitrectomy for vitreomacular traction syndrome. Ophthalm Surg Lasers Imaging. 2010;41:425–431.
41. Gallemore, RP, Jumper, JM, McCuen, BW, 2nd., et al. Diagnosis of vitreoretinal adhesions in macular disease with optical coherence tomography. Retina. 2000;20:115–120.
42. Johnson, MW. Tractional cystoid macular edema: a subtle variant of the vitreomacular traction syndrome. Am J Ophthalmol. 2005;140:184–192.
43. Do, DV, Cho, M, et al. Impact of optical coherence tomography on surgical decision making for epiretinal membranes and vitreomacular traction. Retina. 2007;27:552–556.
44. Chang, LK, Fine, HF, Spaide, RF, et al. Ultrastructural correlation of spectral-domain optical coherence tomographic findings in vitreomacular traction syndrome. Am J Ophthalmol. 2008;146:121–127.
45. Hikichi, T, Yoshida, A, Trempe, CL. Course of vitreomacular traction syndrome. Am J Ophthalmol. 1995;119:55–61.
46. Sulkes, DJ, Ip, MS, Baumal, CR, et al. Spontaneous resolution of vitreomacular traction documented by optical coherence tomography. Arch Ophthalmol. 2000;118:286–287.
47. Yamada, N, Kishi, S. Tomographic features and surgical outcomes of vitreomacular traction syndrome. Am J Ophthalmol. 2005;139:112–117.
48. Sonmez, K, Capone, A, Jr., Trese, MT, et al. Vitreomacular traction syndrome: impact of anatomical configuration on anatomical and visual outcomes. Retina. 2008;28:1207–1214.
49. Pearlstone, AD. The incidence of idiopathic preretinal macular gliosis. Ann Ophthalmol. 1985;17:378–380.
50. McCarty, DJ, Mukesh, BN, Chikani, V, et al. Prevalence and associations of epiretinal membranes in the visual impairment project. Am J Ophthalmol. 2005;140:288–294.
51. Smiddy, WE, Maguire, AM, Green, WR, et al. Idiopathic epiretinal membranes. Ultrastructural characteristics and clinicopathologic correlation. Ophthalmology. 1989;96:811–820.
52. Vinores, SA, Campochiaro, PA, Conway, BP. Ultrastructural and electron-immunocytochemical characterization of cells in epiretinal membranes. Invest Ophthalmol Vis Sci. 1990;31:14–28.
53. Appiah, AP, Hirose, T. Secondary causes of premacular fibrosis. Ophthalmology. 1989;96:389–392.
54. Wilkins, JR, Puliafito, CA, Hee, MR, et al. Characterization of epiretinal membranes using optical coherence tomography. Ophthalmology. 1996;103:2142–2151.
55. Gass, JD. Reappraisal of biomicroscopic classification of stages of development of a macular hole. Am J Ophthalmol. 1995;119:752–759.
56. Takahashi, A, Nagaoka, T, Yoshida, A. Stage 1-A macular hole: a prospective spectral-domain optical coherence tomography study. Retina. 2011;31:127–147.
57. Takahashi, A, Yoshida, A, Nagaoka, T, et al. Macular hole formation in fellow eyes with a perifoveal posterior vitreous detachment of patients with a unilateral macular hole. Am J Ophthalmol. 2011;151:981–989.
58. Kelly, NE, Wendel, RT. Vitreous surgery for idiopathic macular holes. Results of a pilot study. Arch Ophthalmol. 1991;109:654–659.
59. Brooks, HL, Jr. Macular hole surgery with and without internal limiting membrane peeling. Ophthalmology. 2000;107:1939–1948.
60. Bottoni, F, De Angelis, S, Luccarelli, S, et al. The dynamic healing process of idiopathic macular holes after surgical repair: a spectral-domain optical coherence tomography study. Invest Ophthalmol Vis Sci. 2011;52:4439–4446.
61. Hee, MR, Puliafito, CA, Wong, C, et al. Optical coherence tomography of macular holes. Ophthalmology. 1995;102:748–756.
62. Ko, TH, Witkin, AJ, Fujimoto, JG, et al. Ultrahigh-resolution optical coherence tomography of surgically closed macular holes. Arch Ophthalmol. 2006;124:827–836.
63. Sano, M, Shimoda, Y, Hashimoto, H, et al. Restored photoreceptor outer segment and visual recovery after macular hole closure. Am J Ophthalmol. 2009;147:313–318.
64. Oh, J, Smiddy, WE, Flynn, HW, Jr., et al. Photoreceptor inner/outer segment defect imaging by spectral domain OCT and visual prognosis after macular hole surgery. Invest Ophthalmol Vis Sci. 2009;51:1651–1658.
65. Ooka, E, Mitamura, Y, Baba, T, et al. Foveal microstructure on spectral-domain optical coherence tomographic images and visual function after macular hole surgery. Am J Ophthalmol. 2011;152:283–290.
66. Muqit, MM, Akram, I, Turner, GS, et al. Fourier-domain optical coherence tomography imaging of gas tamponade following macular hole surgery. Ophthalmic Surg Lasers Imaging. 41, 2011.
67. Sano, M, Inoue, M, Taniuchi, S, et al. Ability to determine postoperative status of macular hole in gas-filled eyes by spectral domain-optical coherence tomography. Clin Exp Ophthalmol. 2011;39:885–892.
68. Eckardt, C, Eckert, T, Eckardt, U, et al. Macular hole surgery with air tamponade and optical coherence tomography-based duration of face-down positioning. Retina. 2008;28:1087–1096.
69. Bressler, NM, Bressler, SB, Congdon, NG, et al. Potential public health impact of Age-Related Eye Disease Study results: AREDS report no. 11. Arch Ophthalmol. 2003;121:1621–1624.
70. Congdon, N, O’Colmain, B, Klaver, CC, et al. Causes and prevalence of visual impairment among adults in the United States. Arch Ophthalmol. 2004;122:477–485.
71. Friedman, DS, O’Colmain, BJ, Munoz, B, et al. Prevalence of age-related macular degeneration in the United States. Arch Ophthalmol. 2004;122:564–572.
72. Klein, R, Peto, T, Bird, A, et al. The epidemiology of age-related macular degeneration. Am J Ophthalmol. 2004;137:486–495.
73. Bird, AC, Bressler, NM, Bressler, SB, et al. An international classification and grading system for age-related maculopathy and age-related macular degeneration. The International ARM Epidemiological Study Group. Surv Ophthalmol. 1995;39:367–374.
74. Hirvela, H, Luukinen, H, Laara, E, et al. Risk factors of age-related maculopathy in a population 70 years of age or older. Ophthalmology. 1996;103:871–877.
75. Vingerling, JR, Hofman, A, Grobbee, DE, et al. Age-related macular degeneration and smoking. The Rotterdam Study. Arch Ophthalmol. 1996;114:1193–1196.
76. Seddon, JM, Sharma, S, Adelman, RA. Evaluation of the clinical age-related maculopathy staging system. Ophthalmology. 2006;113:260–266.
77. Bartlett, H, Eperjesi, F. Use of fundus imaging in quantification of age-related macular change. Surv Ophthalmol. 2007;52:655–671.
78. Seddon, JM, Sharma, S, Adelman, RA, et al. Optical coherence tomography of age-related macular degeneration and choroidal neovascularization. Ophthalmology. 1996;103:1260–1270.
79. Pieroni, CG, Witkin, AJ, Ko, TH, et al. Ultrahigh resolution optical coherence tomography in non-exudative age related macular degeneration. Br J Ophthalmol. 2006;90:191–197.
80. Sikorski, BL, Bukowska, D, Kaluzny, JJ, et al. Drusen with accompanying fluid underneath the sensory retina. Ophthalmology. 2010;118:82–92.
81. Spaide, RF, Curcio, CA. Drusen characterization with multimodal imaging. Retina. 2010;30:1441–1454.
82. Roquet, W, Roudot-Thoraval, F, Coscas, G, et al. Clinical features of drusenoid pigment epithelial detachment in age related macular degeneration. Br J Ophthalmol. 2004;88:638–642.
83. Schuman, SG, Koreishi, AF, Farsiu, S, et al. Photoreceptor layer thinning over drusen in eyes with age-related macular degeneration imaged in vivo with spectral-domain optical coherence tomography. Ophthalmology. 2009;116:488–496.
84. Davis, MD, Gangnon, RE, Lee, LY, et al. The Age-Related Eye Disease Study severity scale for age-related macular degeneration: AREDS report no. 17. Arch Ophthalmol. 2005;123:1484–1498.
85. Ferris, FL, Davis, MD, Clemons, TE, et al. A simplified severity scale for age-related macular degeneration: AREDS report no. 18. Arch Ophthalmol. 2005;123:1570–1574.
86. Ho, J, Witkin, AJ, Liu, J, et al. Documentation of intraretinal retinal pigment epithelium migration via high-speed ultrahigh-resolution optical coherence tomography. Ophthalmology. 2010;118:687–693.
87. Zweifel, SA, Imamura, Y, Spaide, TC, et al. Prevalence and significance of subretinal drusenoid deposits (reticular pseudodrusen) in age-related macular degeneration. Ophthalmology. 2010;117:1775–1781.
88. Zweifel, SA, Spaide, RF, Curcio, CA, et al. Reticular pseudodrusen are subretinal drusenoid deposits. Ophthalmology. 2009;117:303–312.
89. Sarks, JP, Sarks, SH, Killingsworth, MC. Evolution of geographic atrophy of the retinal pigment epithelium. Eye (Lond). 1988;2:552–577.
90. Sunness, JS. The natural history of geographic atrophy, the advanced atrophic form of age-related macular degeneration. Mol Vis. 1999;5:25.
91. Sunness, JS, Bressler, NM, Tian, Y, et al. Measuring geographic atrophy in advanced age-related macular degeneration. Invest Ophthalmol Vis Sci. 1999;40:1761–1769.
92. Sunness, JS, Margalit, E, Srikumaran, D, et al. The long-term natural history of geographic atrophy from age-related macular degeneration: enlargement of atrophy and implications for interventional clinical trials. Ophthalmology. 2007;114:271–277.
93. Schmitz-Valckenberg, S, Fleckenstein, M, Gobel, AP, et al. Optical coherence tomography and autofluorescence findings in areas with geographic atrophy due to age-related macular degeneration. Invest Ophthalmol Vis Sci. 2010;52:1–6.
94. Fleckenstein, M, Charbel Issa, P, Helb, HM, et al. High-resolution spectral domain-OCT imaging in geographic atrophy associated with age-related macular degeneration. Invest Ophthalmol Vis Sci. 2008;49:4137–4144.
95. Bearelly, S, Chau, FY, Koreishi, A, et al. Spectral domain optical coherence tomography imaging of geographic atrophy margins. Ophthalmology. 2009;116:1762–1769.
96. Spaide, RF. Age-related choroidal atrophy. Am J Ophthalmol. 2009;147:801–810.
97. Wood, A, Binns, A, Margrain, T, et al. Retinal and choroidal thickness in early age-related macular degeneration. Am J Ophthalmol. 2011;152:1030–1038.
98. Lujan, BJ, Wang, F, Gregori, G, et al. Calibration of fundus images using spectral domain optical coherence tomography. Ophthalmic Surg Lasers Imaging. 2008;39(Suppl):S15–S20.
99. Lujan, BJ, Rosenfeld, PJ, Gregori, G, et al. Spectral domain optical coherence tomographic imaging of geographic atrophy. Ophthalmic Surg Lasers Imaging. 2009;40:96–101.
100. Green, WR. Clinicopathologic studies of treated choroidal neovascular membranes. A review and report of two cases. Retina. 1991;11:328–356.
101. Green, WR. Histopathology of age-related macular degeneration. Mol Vis. 1999;5:27.
102. Keane, PA, Aghaian, E, Ouyang, Y, et al. Acute severe visual decrease after photodynamic therapy with verteporfin: spectral-domain OCT features. Ophthalmic Surg Lasers Imaging. 2010;41(Suppl):S85–S88.
103. Keane, PA, Liakopoulos, S, Chang, KT, et al. Relationship between optical coherence tomography retinal parameters and visual acuity in neovascular age-related macular degeneration. Ophthalmology. 2008;115:2206–2214.
104. Yannuzzi, LA, Hope-Ross, M, Slakter, JS, et al. Analysis of vascularized pigment epithelial detachments using indocyanine green videoangiography. Retina. 1994;14:99–113.
105. Jager, RD, Mieler, WF, Miller, JW. Age-related macular degeneration. N Engl J Med. 2008;358:2606–2617.
106. Zayit-Soudry, S, Moroz, I, Loewenstein, A. Retinal pigment epithelial detachment. Surv Ophthalmol. 2007;52:227–243.
107. Bloom, SM, Singal, IP. The outer Bruch membrane layer: a previously undescribed spectral-domain optical coherence tomography finding. Retina. 2010;31:316–323.
108. Coscas, G, Coscas, F, Zourdani, A, et al. [Optical coherence tomography and ARMD.]. J Fr Ophtalmol. 2004;27:3S7–30.
109. Pepple, K, Mruthyunjaya, P. Retinal pigment epithelial detachments in age-related macular degeneration: classification and therapeutic options. Semin Ophthalmol. 2011;26:198–208.
110. Spaide, RF. Enhanced depth imaging optical coherence tomography of retinal pigment epithelial detachment in age-related macular degeneration. Am J Ophthalmol. 2009;147:644–652.
111. Joeres, S, Tsong, JW, Updike, PG, et al. Reproducibility of quantitative optical coherence tomography subanalysis in neovascular age-related macular degeneration. Invest Ophthalmol Vis Sci. 2007;48:4300–4307.
112. Lee, SY, Stetson, PF, Ruiz-Garcia, H, et al. Automated characterization of pigment epithelial detachment using optical coherence tomography. Invest Ophthalmol Vis Sci. 2012;53:164–170.
113. Hoskin, A, Bird, AC, Sehmi, K. Tears of detached retinal pigment epithelium. Br J Ophthalmol. 1981;65:417–422.
114. Chang, LK, Sarraf, D. Tears of the retinal pigment epithelium: an old problem in a new era. Retina. 2007;27:523–534.
115. Levin, LA, Seddon, JM, Topping, T. Retinal pigment epithelial tears associated with trauma. Am J Ophthalmol. 1991;112:396–400.
116. Ishida, Y, Kato, T, Minamoto, A, et al. Retinal pigment epithelial tear in a patient with central serous chorioretinopathy treated with corticosteroids. Retina. 2004;24:633–636.
117. Gelisken, F, Inhoffen, W, Partsch, M, et al. Retinal pigment epithelial tear after photodynamic therapy for choroidal neovascularization. Am J Ophthalmol. 2001;131:518–520.
118. Pece, A, Introini, U, Bottoni, F, et al. Acute retinal pigment epithelial tear after photodynamic therapy. Retina. 2001;21:661–665.
119. Meyer, CH, Mennel, S, Schmidt, JC, et al. Acute retinal pigment epithelial tear following intravitreal bevacizumab (Avastin) injection for occult choroidal neovascularisation secondary to age related macular degeneration. Br J Ophthalmol. 2006;90:1207–1208.
120. Carvounis, PE, Kopel, AC, Benz, MS. Retinal pigment epithelium tears following ranibizumab for exudative age-related macular degeneration. Am J Ophthalmol. 2007;143:504–505.
121. Gelisken, F, Ziemssen, F, Voelker, M, et al. Retinal pigment epithelial tears after single administration of intravitreal bevacizumab for neovascular age-related macular degeneration. Eye (Lond). 2009;23:694–702.
122. Gass, JD. Pathogenesis of tears of the retinal pigment epithelium. Br J Ophthalmol. 1984;68:513–519.
123. Chan, CK, Abraham, P, Meyer, CH, et al. Optical coherence tomography-measured pigment epithelial detachment height as a predictor for retinal pigment epithelial tears associated with intravitreal bevacizumab injections. Retina. 2009;30:203–211.
124. Chiang, A, Chang, LK, Yu, F, et al. Predictors of anti-VEGF-associated retinal pigment epithelial tear using FA and OCT analysis. Retina. 2008;28:1265–1269.
125. Landa, G, Su, E, Garcia, PM, et al. Inner segment–outer segment junctional layer integrity and corresponding retinal sensitivity in dry and wet forms of age-related macular degeneration. Retina. 2011;31:364–370.
126. Oishi, A, Hata, M, Shimozono, M, et al. The significance of external limiting membrane status for visual acuity in age-related macular degeneration. Am J Ophthalmol. 2010;150:27–32.
127. Yannuzzi, LA, Negrao, S, Iida, T, et al. Retinal angiomatous proliferation in age-related macular degeneration. Retina. 2001;21:416–434.
128. Gass, JD, Agarwal, A, Lavina, AM, et al. Focal inner retinal hemorrhages in patients with drusen: an early sign of occult choroidal neovascularization and chorioretinal anastomosis. Retina. 2003;23:741–751.
129. Truong, SN, Alam, S, Zawadzki, RJ, et al. High resolution Fourier-domain optical coherence tomography of retinal angiomatous proliferation. Retina. 2007;27:915–925.
130. Freund, KB, Ho, IV, Barbazetto, IA, et al. Type 3 neovascularization: the expanded spectrum of retinal angiomatous proliferation. Retina. 2008;28:201–211.
131. Querques, G, Atmani, K, Berboucha, E, et al. Angiographic analysis of retinal-choroidal anastomosis by confocal scanning laser ophthalmoscopy technology and corresponding (eye-tracked) spectral-domain optical coherence tomography. Retina. 2009;30:222–234.
132. Krebs, I, Glittenberg, C, Hagen, S, et al. Retinal angiomatous proliferation: morphological changes assessed by Stratus and Cirrus OCT. Ophthalmic Surg Lasers Imaging. 2009;40:285–289.
133. Yannuzzi, LA, Sorenson, J, Spaide, RF, et al. Idiopathic polypoidal choroidal vasculopathy (IPCV). Retina. 1990;10:1–8.
134. Costa, RA, Navajas, EV, Farah, ME, et al. Polypoidal choroidal vasculopathy: angiographic characterization of the network vascular elements and a new treatment paradigm. Prog Retin Eye Res. 2005;24:560–586.
135. Saito, M, Iida, T, Nagayama, D. Cross-sectional and en face optical coherence tomographic features of polypoidal choroidal vasculopathy. Retina. 2008;28:459–464.
136. Ojima, Y, Hangai, M, Sakamoto, A, et al. Improved visualization of polypoidal choroidal vasculopathy lesions using spectral-domain optical coherence tomography. Retina. 2009;29:52–59.
137. Harding, SP. Neovascular age-related macular degeneration: decision making and optimal management. Eye (Lond). 2010;24:497–505.
138. Brown, DM, Kaiser, PK, Michels, M, et al. Ranibizumab versus verteporfin for neovascular age-related macular degeneration. N Engl J Med. 2006;355:1432–1444.
139. Rosenfeld, PJ, Brown, DM, Heier, JS, et al. Ranibizumab for neovascular age-related macular degeneration. N Engl J Med. 2006;355:1419–1431.
140. Engelbert, M, Zweifel, SA, Freund, KB. Long-term follow-up for type 1 (subretinal pigment epithelium) neovascularization using a modified “treat and extend” dosing regimen of intravitreal antivascular endothelial growth factor therapy. Retina. 2010;30:1368–1375.
141. Martin, DF, Maguire, MG, Ying, GS, et al. Ranibizumab and bevacizumab for neovascular age-related macular degeneration. N Engl J Med. 2011;364:1897–1908.
142. Fung, AE, Lalwani, GA, Rosenfeld, PJ, et al. An optical coherence tomography-guided, variable dosing regimen with intravitreal ranibizumab (Lucentis) for neovascular age-related macular degeneration. Am J Ophthalmol. 2007;143:566–583.
143. Engelbert, M, Zweifel, SA, Freund, KB. “Treat and extend” dosing of intravitreal antivascular endothelial growth factor therapy for type 3 neovascularization/retinal angiomatous proliferation. Retina. 2009;29:1424–1431.
144. Lalwani, GA, Rosenfeld, PJ, Fung, AE, et al. A variable-dosing regimen with intravitreal ranibizumab for neovascular age-related macular degeneration: year 2 of the PrONTO Study. Am J Ophthalmol. 2009;148:43–58.
145. Zweifel, SA, Engelbert, M, Laud, K, et al. Outer retinal tubulation: a novel optical coherence tomography finding. Arch Ophthalmol. 2009;127:1596–1602.
146. Gass, JD. Pathogenesis of disciform detachment of the neuroepithelium. Am J Ophthalmol. 1967;63(Suppl):1–139.
147. Spaide, RF, Campeas, L, Haas, A, et al. Central serous chorioretinopathy in younger and older adults. Ophthalmology. 1996;103:2070–2079.
148. Kitaya, N, Nagaoka, T, Hikichi, T, et al. Features of abnormal choroidal circulation in central serous chorioretinopathy. Br J Ophthalmol. 2003;87:709–712.
149. Jalkh, AE, Jabbour, N, Avila, MP, et al. Retinal pigment epithelium decompensation. I. Clinical features and natural course. Ophthalmology. 1984;91:1544–1548.
150. Yannuzzi, LA, Shakin, JL, Fisher, YL, et al. Peripheral retinal detachments and retinal pigment epithelial atrophic tracts secondary to central serous pigment epitheliopathy. Ophthalmology. 1984;91:1554–1572.
151. Scheider, A, Nasemann, JE, Lund, OE. Fluorescein and indocyanine green angiographies of central serous choroidopathy by scanning laser ophthalmoscopy. Am J Ophthalmol. 1993;115:50–56.
152. Guyer, DR, Yannuzzi, LA, Slakter, JS, et al. Digital indocyanine green videoangiography of central serous chorioretinopathy. Arch Ophthalmol. 1994;112:1057–1062.
153. Piccolino, FC, Borgia, L. Central serous chorioretinopathy and indocyanine green angiography. Retina. 1994;14:231–242.
154. Prunte, C, Flammer, J. Choroidal capillary and venous congestion in central serous chorioretinopathy. Am J Ophthalmol. 1996;121:26–34.
155. Kamppeter, B, Jonas, JB. Central serous chorioretinopathy imaged by optical coherence tomography. Arch Ophthalmol. 2003;121:742–743.
156. Montero, JA, Ruiz-Moreno, JM. Optical coherence tomography characterisation of idiopathic central serous chorioretinopathy. Br J Ophthalmol. 2005;89:562–564.
157. van Velthoven, ME, Verbraak, FD, Garcia, PM, et al. Evaluation of central serous retinopathy with en face optical coherence tomography. Br J Ophthalmol. 2005;89:1483–1488.
158. Hussain, N, Baskar, A, Ram, LM, et al. Optical coherence tomographic pattern of fluorescein angiographic leakage site in acute central serous chorioretinopathy. Clin Experiment Ophthalmol. 2006;34:137–140.
159. Hirami, Y, Tsujikawa, A, Sasahara, M, et al. Alterations of retinal pigment epithelium in central serous chorioretinopathy. Clin Experiment Ophthalmol. 2007;35:225–230.
160. Wang, MS, Sander, B, Larsen, M. Retinal atrophy in idiopathic central serous chorioretinopathy. Am J Ophthalmol. 2002;133:787–793.
161. Stock, G, Ahlers, C, Sayegh, R, et al. [Three-dimensional imaging in central serous chorioretinopathy]. Ophthalmologe. 2008;105:1127–1134.
162. Eandi, CM, Chung, JE, Cardillo-Piccolino, F, et al. Optical coherence tomography in unilateral resolved central serous chorioretinopathy. Retina. 2005;25:417–421.
163. Furuta, M, Iida, T, Kishi, S. Foveal thickness can predict visual outcome in patients with persistent central serous chorioretinopathy. Ophthalmologica. 2009;223:28–31.
164. Maruko, I, Iida, T, Sekiryu, T, et al. Morphologic changes in the outer layer of the detached retina in rhegmatogenous retinal detachment and central serous chorioretinopathy. Am J Ophthalmol. 2009;147:489–494.
165. Fujimoto, H, Gomi, F, Wakabayashi, T, et al. Morphologic changes in acute central serous chorioretinopathy evaluated by Fourier-domain optical coherence tomography. Ophthalmology. 2008;115:1494–1500.
166. Matsumoto, H, Kishi, S, Otani, T, et al. Elongation of photoreceptor outer segment in central serous chorioretinopathy. Am J Ophthalmol. 2008;145:162–168.
167. Hee, MR, Puliafito, CA, Wong, C, et al. Optical coherence tomography of central serous chorioretinopathy. Am J Ophthalmol. 1995;120:65–74.
168. Kon, Y, Iida, T, Maruko, I, et al. The optical coherence tomography-ophthalmoscope for examination of central serous chorioretinopathy with precipitates. Retina. 2008;28:864–869.
169. Mitarai, K, Gomi, F, Tano, Y. Three-dimensional optical coherence tomographic findings in central serous chorioretinopathy. Graefes Arch Clin Exp Ophthalmol. 2006;244:1415–1420.
170. Gupta, P, Gupta, V, Dogra, MR, et al. Morphological changes in the retinal pigment epithelium on spectral-domain OCT in the unaffected eyes with idiopathic central serous chorioretinopathy. Int Ophthalmol. 2009;30:175–181.
171. Ojima, Y, Hangai, M, Sasahara, M, et al. Three-dimensional imaging of the foveal photoreceptor layer in central serous chorioretinopathy using high-speed optical coherence tomography. Ophthalmology. 2007;114:2197–2207.
172. Matsumoto, H, Sato, T, Kishi, S. Outer nuclear layer thickness at the fovea determines visual outcomes in resolved central serous chorioretinopathy. Am J Ophthalmol. 2009;148:105–110.
173. Imamura, Y, Fujiwara, T, Margolis, R, et al. Enhanced depth imaging optical coherence tomography of the choroid in central serous chorioretinopathy. Retina. 2009;29:1469–1473.
174. Maruko, I, Iida, T, Sugano, Y, et al. Subfoveal choroidal thickness in fellow eyes of patients with central serous chorioretinopathy. Retina. 2011;31:1603–1608.
175. Maruko, I, Iida, T, Sugano, Y, et al. One-year choroidal thickness results after photodynamic therapy for central serous chorioretinopathy. Retina. 2011;31:1921–1927.
176. Henderson, BA, Kim, JY, Ament, CS, et al. Clinical pseudophakic cystoid macular edema. Risk factors for development and duration after treatment. J Cataract Refract Surg. 2007;33:1550–1558.
177. Wolf, EJ, Braunstein, A, Shih, C, et al. Incidence of visually significant pseudophakic macular edema after uneventful phacoemulsification in patients treated with nepafenac. J Cataract Refract Surg. 2007;33:1546–1549.
178. Irvine, SR. A newly defined vitreous syndrome following cataract surgery. Am J Ophthalmol. 1953;36:499–619.
179. Schepens, CL, Avila, MP, Jalkh, AE, et al. Role of the vitreous in cystoid macular edema. Surv Ophthalmol. 1984;28(Suppl):499–504.
180. Moss, SE, Klein, R, Klein, BE. Ten-year incidence of visual loss in a diabetic population. Ophthalmology. 1994;101:1061–1070.
181. Moss, SE, Klein, R, Klein, BE. The 14-year incidence of visual loss in a diabetic population. Ophthalmology. 1998;105:998–1003.
182. Strom, C, Sander, B, Larsen, N, et al. Diabetic macular edema assessed with optical coherence tomography and stereo fundus photography. Invest Ophthalmol Vis Sci. 2002;43:241–245.
183. Brown, JC, Solomon, SD, Bressler, SB, et al. Detection of diabetic foveal edema: contact lens biomicroscopy compared with optical coherence tomography. Arch Ophthalmol. 2004;122:330–335.
184. Browning, DJ, Apte, RS, Bressler, SB, et al. Association of the extent of diabetic macular edema as assessed by optical coherence tomography with visual acuity and retinal outcome variables. Retina. 2009;29:300–305.
185. Al-latayfeh, MM, Sun, JK, Aiello, LP. Ocular coherence tomography and diabetic eye disease. Semin Ophthalmol. 2010;25:192–197.
186. Browning, DJ, McOwen, MD, Bowen, RM, Jr., et al. Comparison of the clinical diagnosis of diabetic macular edema with diagnosis by optical coherence tomography. Ophthalmology. 2004;111:712–715.
187. Virgili, G, Menchini, F, Dimastrogiovanni, AF, et al. Optical coherence tomography versus stereoscopic fundus photography or biomicroscopy for diagnosing diabetic macular edema: a systematic review. Invest Ophthalmol Vis Sci. 2007;48:4963–4973.
188. Davis, MD, Bressler, SB, Aiello, LP, et al. Comparison of time-domain OCT and fundus photographic assessments of retinal thickening in eyes with diabetic macular edema. Invest Ophthalmol Vis Sci. 2008;49:1745–1752.
189. Otani, T, Kishi, S, Maruyama, Y. Patterns of diabetic macular edema with optical coherence tomography. Am J Ophthalmol. 1999;127:688–693.
190. Kim, BY, Smith, SD, Kaiser, PK. Optical coherence tomographic patterns of diabetic macular edema. Am J Ophthalmol. 2006;142:405–412.
191. Soliman, W, Sander, B, Hasler, PW, et al. Correlation between intraretinal changes in diabetic macular oedema seen in fluorescein angiography and optical coherence tomography. Acta Ophthalmol. 2008;86:34–39.
192. Early Treatment Diabetic Retinopathy Study research group. Photocoagulation for diabetic macular edema. Early Treatment Diabetic Retinopathy Study report number 1. Arch Ophthalmol. 1985;103:1796–1806.
193. Early Treatment Diabetic Retinopathy Study Research Group. Photocoagulation for diabetic macular edema: Early Treatment Diabetic Retinopathy Study report no. 4. Int Ophthalmol Clin. 1987;27:265–272.
194. Early Treatment Diabetic Retinopathy Study Research Group. Treatment techniques and clinical guidelines for photocoagulation of diabetic macular edema. Early Treatment Diabetic Retinopathy Study report no. 2. Ophthalmology. 1987;94:761–774.
195. Elman, MJ, Bressler, NM, Qin, H, et al. Expanded 2-year follow-up of ranibizumab plus prompt or deferred laser or triamcinolone plus prompt laser for diabetic macular edema. Ophthalmology. 2011;118:609–614.
196. Michaelides, M, Kaines, A, Hamilton, RD, et al. A prospective randomized trial of intravitreal bevacizumab or laser therapy in the management of diabetic macular edema (BOLT study) 12-month data: report 2. Ophthalmology. 2010;117:1078–1086.
197. Kim, NR, Kim, YJ, Chin, HS, et al. Optical coherence tomographic patterns in diabetic macular oedema: prediction of visual outcome after focal laser photocoagulation. Br J Ophthalmol. 2009;93:901–905.
198. Soliman, W, Sander, B, Soliman, KA, et al. The predictive value of optical coherence tomography after grid laser photocoagulation for diffuse diabetic macular oedema. Acta Ophthalmol. 2008;86:284–291.
199. Kaiser, PK, Riemann, CD, Sears, JE, et al. Macular traction detachment and diabetic macular edema associated with posterior hyaloidal traction. Am J Ophthalmol. 2001;131:44–49.
200. Ghazi, NG, Ciralsky, JB, Shah, SM, et al. Optical coherence tomography findings in persistent diabetic macular edema: the vitreomacular interface. Am J Ophthalmol. 2007;144:747–754.
201. Haller, JA, Qin, H, Apte, RS, et al. Vitrectomy outcomes in eyes with diabetic macular edema and vitreomacular traction. Ophthalmology. 2010;117:1087–1093.
202. Maheshwary, AS, Oster, SF, Yuson, RM, et al. The association between percent disruption of the photoreceptor inner segment–outer segment junction and visual acuity in diabetic macular edema. Am J Ophthalmol. 2010;150:63–67.
203. Otani, T, Yamaguchi, Y, Kishi, S. Correlation between visual acuity and foveal microstructural changes in diabetic macular edema. Retina. 2010;30:774–780.
204. Sakamoto, A, Nishijima, K, Kita, M, et al. Association between foveal photoreceptor status and visual acuity after resolution of diabetic macular edema by pars plana vitrectomy. Graefes Arch Clin Exp Ophthalmol. 2009;247:1325–1330.
205. Hayreh, SS. Classification of central retinal vein occlusion. Ophthalmology. 1983;90:458–474.
206. Ota, M, Tsujikawa, A, Murakami, T, et al. Foveal photoreceptor layer in eyes with persistent cystoid macular edema associated with branch retinal vein occlusion. Am J Ophthalmol. 2008;145:273–280.
207. Shroff, D, Mehta, DK, Arora, R, et al. Natural history of macular status in recent-onset branch retinal vein occlusion: an optical coherence tomography study. Int Ophthalmol. 2008;28:261–268.
208. Falkenberry, SM, Ip, MS, Blodi, BA, et al. Optical coherence tomography findings in central retinal artery occlusion. Ophthalmic Surg Lasers Imaging. 2006;37:502–505.
209. Goldenberg-Cohen, N, Dadon, S, Avraham, BC, et al. Molecular and histological changes following central retinal artery occlusion in a mouse model. Exp Eye Res. 2008;87:327–333.
210. Murthy, RK, Grover, S, Chalam, KV. Sequential spectral domain OCT documentation of retinal changes after branch retinal artery occlusion. Clin Ophthalmol. 2010;4:327–329.
211. Fernandez, EJ, Hermann, B, Povazay, B, et al. Ultrahigh resolution optical coherence tomography and pancorrection for cellular imaging of the living human retina. Opt Express. 2008;16:11083–11094.
212. Huber, R, Adler, DC, Srinivasan, VJ, et al. Fourier domain mode locking at 1050 nm for ultra-high-speed optical coherence tomography of the human retina at 236 000 axial scans per second. Opt Lett. 2007;32:2049–2051.
213. Unterhuber, A, Povazay, B, Hermann, B, et al. In vivo retinal optical coherence tomography at 1040 nm – enhanced penetration into the choroid. Opt Express. 2005;13:3252–3258.
214. Povazay, B, Hermann, B, Hofer, B, et al. Wide-field optical coherence tomography of the choroid in vivo. Invest Ophthalmol Vis Sci. 2009;50:1856–1863.
215. Povazay, B, Hermann, B, Unterhuber, A, et al. Three-dimensional optical coherence tomography at 1050 nm versus 800 nm in retinal pathologies: enhanced performance and choroidal penetration in cataract patients. J Biomed Opt. 2007;12:041211.
216. Wang, Y, Lu, A, Gil-Flamer, J, et al. Measurement of total blood flow in the normal human retina using Doppler Fourier-domain optical coherence tomography. Br J Ophthalmol. 2009;93:634–637.
217. Ahlers, C, Gotzinger, E, Pircher, M, et al. Imaging of the retinal pigment epithelium in age-related macular degeneration using polarization-sensitive optical coherence tomography. Invest Ophthalmol Vis Sci. 2010;51:2149–2157.
218. Cense, B, Chen, TC, Park, BH, et al. Thickness and birefringence of healthy retinal nerve fiber layer tissue measured with polarization-sensitive optical coherence tomography. Invest Ophthalmol Vis Sci. 2004;45:2606–2612.