[level-membership-for-opthalmology-category]
Chapter 47 Nonproliferative Diabetic Retinopathy and Diabetic Macular Edema
This chapter discusses the clinical manifestations and management of NPDR and diabetic macular edema (DME). Chapter 48 reviews proliferative diabetic retinopathy (PDR).
Natural course of nonproliferative diabetic retinopathy
Diabetes mellitus without retinopathy
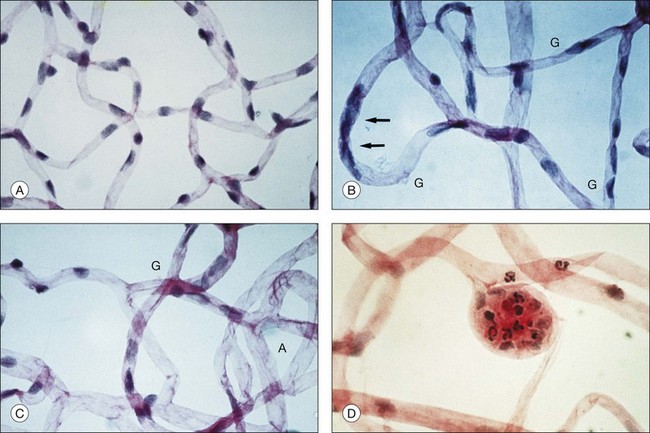
Retinal microvascular alterations visible on ophthalmoscopy typically develop years following the onset of DM. Chapter 46 (Diabetic retinopathy: Genetics and etiologic mechanisms) reviews what we know about the early biochemical and cellular alterations leading to diabetic retinopathy, while Chapter 45 (The epidemiology of diabetic retinopathy) discusses the incidence and prevalence of retinopathy among diabetics. Experimental models of diabetic retinopathy in dogs and rats, and studies of human autopsy eyes, indicate that early alterations in retinal blood vessels include the loss of capillary pericytes (Fig. 47.1) and thickening of the capillary basement membrane.1–21
There is preliminary evidence that parenchymal cells of the retina exhibit changes in the early stages of disease, including glial cell reactivity, alterations in glutamate metabolism, and neuron cell death.22–28 Several studies have documented subtle changes in contrast sensitivity and color perception in diabetics in the absence of visible retinopathy,29–34 but it remains unclear whether these effects result from deficits in retinal function, or from other diabetic alterations such as cataractogenesis. Central vision (measured by visual acuity) and peripheral vision (measured by common perimetric tests) typically remain normal in DM prior to onset of clinically evident retinopathy, in the absence of other factors such as cataract.
Microaneurysms
Microaneurysms arise as hypercellular saccular outpouchings of the capillary wall that can be well visualized in trypsin-digest retinal mounts (see Fig. 47.1D).1 Their lumina are sometimes occluded by agglutinated erythrocytes or thrombus. Over time they sometimes become acellular, just as damaged retinal capillaries can evolve into “ghost” vessels devoid of endothelial cells and pericytes. The mechanism for microaneurysm formation is unknown. Possible contributing factors may include alterations in the retinal microenvironment from metabolic effects on neurons, glial cells, and endothelial cells; endothelial cell injury secondary to leukostasis from altered interaction between endothelial cells and leukocytes; response of endothelial cells to altered balance between proliferative and antiproliferative factors; structural changes in the capillary wall (such as from loss of pericytes); or increase in intraluminal pressure.
Microaneurysms visualized by ophthalmoscopy or angiography commonly appear and disappear over time, though some retain a stable appearance for years. The presence of microaneurysms alone, in the absence of other features of diabetic retinopathy, remains compatible with normal vision. However, as the number of microaneurysms increases, there is a greater risk of retinopathy progression.35–37
Retinal vascular hyperpermeability
Subtle compromise of the blood–retinal barrier may begin at an early stage of disease, even preceding the appearance of retinopathy, but clinically appreciable retinal vascular hyperpermeability typically follows the appearance of microaneurysms. Visualized clinically by angiography, leakage may arise from microaneurysms, retinal capillaries, or other microvascular abnormalities, and can be highly variable in magnitude and extent. Retinal vascular incompetence may or may not result in localized areas of thickening of the retina. Hard exudates, extravascular deposits of lipid-rich material that result from spillage and incomplete resorption of plasma lipoproteins, may accumulate. Intraretinal hemorrhages appear in the posterior pole and in the retinal periphery. The vascular alterations responsible for hyperpermeability in NPDR remain incompletely understood, but may involve dysfunction of the tight junctions between retinal capillary endothelial cells. Possible mechanisms for breakdown of the blood–retinal barrier are discussed in Chapter 27 (Blood–retinal barrier, immune privilege, and autoimmunity).
Diabetic macular edema
The pathogenesis of DME remains poorly understood, partly because of the absence of a good animal model. Chapter 46 (Diabetic retinopathy: Genetics and etiologic mechanisms) reviews what we know about the early biochemical and cellular alterations leading to DME, while Chapter 28 (Mechanism of macular edema) discusses factors involved in the pathogenesis of macular edema of different causes.
Extrafoveal foci of retinal thickening and hard exudates may not cause symptoms or affect visual acuity, but DME that involves or threatens the center of the macula carries a significant risk of vision loss. In the Early Treatment of Diabetic Retinopathy Study (ETDRS), the 3-year risk of moderate visual loss (a decrease of three lines or more on a logarithmic visual acuity chart, corresponding to a doubling of the initial visual angle) among untreated eyes with DME involving or threatening the center of the macula was 32%.38 The natural history of DME is variable. In some eyes, it can persist for years, while in others it may spontaneously resolve. Chapter 45 (The epidemiology of diabetic retinopathy) discusses the incidence and prevalence of DME and consequent vision loss.
Capillary closure, microvascular remodeling, and retinal ischemia
One of the most serious consequences of diabetic retinopathy is progressive loss of functional retinal capillaries. Trypsin-digest preparations of the retina show areas of acellular capillaries, or “ghost” vessels, which have lost the endothelial cells and pericytes that once lined them (see Fig. 47.1C). When patches of such acellular capillaries, first seen early in the course of NPDR, increase and become confluent, the terminal arterioles that supply these capillaries often become occluded. Regions of acellular capillaries in histologic sections have been shown to correspond to areas of capillary nonperfusion visualized by fluorescein angiography.39 Adjacent to these areas of retinal ischemia, clusters of microaneurysms and hypercellular vessels often develop. It has been difficult to determine whether such vessels represent altered pre-existing capillaries or neovascularization within the retina. Such vessels are described clinically as intraretinal microvascular abnormalities (IRMA), a term intended to accommodate both possibilities.
Progressive capillary closure and resulting retinal ischemia are commonly associated with increasing IRMA, intraretinal hemorrhages, and venous abnormalities such as segmental dilation (venous beading). Occasionally, in cases of extensive capillary nonperfusion, the retina acquires a featureless appearance with a relative dearth of visible vessels, hemorrhages, or microvascular abnormalities. Retinal ischemia represents another cause for vision loss in NPDR, and also plays a central role in the pathogenesis of PDR by stimulating elaboration of vascular endothelial growth factor A (VEGF-A) and other factors promoting the growth of extraretinal neovascularization.40–47 Chapter 48 (Proliferative diabetic retinopathy) discusses the natural course of PDR.
Alterations of the vitreous gel and vitreoretinal interface
The vitreous gel plays a key role in the fibrovascular proliferation of PDR, but it may also exert important effects at earlier stages of retinopathy. Epiretinal membrane formation, arising from liquefaction of the vitreous gel and consequent effects at the vitreoretinal interface, can occur with advancing age in otherwise healthy eyes but is more common in diabetic eyes.48–52 It has been hypothesized that liquefaction of the vitreous gel out of proportion to diminution of posterior vitreoretinal adhesion may underlie the pathophysiology of many vitreoretinal diseases,53 and observations at vitrectomy suggest that the posterior cortical vitreous is frequently more adherent to the retina in the setting of diabetic retinopathy. Studies have documented a number of biochemical changes to the vitreous gel in the setting of DM, including increased collagen fibril cross-linking, accumulation of advanced glycation end products that may augment vitreoretinal adhesion and incite retinal glial cell reactivity, and alterations in the concentration of various soluble proteins.54–58
The role of the vitreous gel in the pathophysiology of diabetic retinopathy may extend beyond its capacity to exert mechanical effects on the retina. For example, there is recent evidence that the vitreous may function as an important regulator of intraocular oxygen tension, a finding that could have important implications for diabetic retinopathy and other diseases involving retinal hypoxia.59,60
Clinical evaluation of nonproliferative diabetic retinopathy
Comprehensive evaluation of a patient with DM begins with identification of extraocular factors associated with risk of diabetic retinopathy and its progression. Such factors are presented briefly here and discussed in greater detail in Chapter 45 (The epidemiology of diabetic retinopathy). Pertinent medical history is sought from the patient, and supplemented by records from his or her primary care physician or endocrinologist as warranted.
Duration of diabetes mellitus
The duration of DM is strongly associated with risk of retinopathy. Cross-sectional and longitudinal analyses from population-based epidemiologic studies have established the association between prevalence of retinopathy and duration of disease.61–70 The Wisconsin Epidemiologic Study of Diabetic Retinopathy (WESDR) examined prevalence and severity of diabetic retinopathy among diabetics categorized into a younger-onset group consisting of those diagnosed with DM prior to 30 years of age who were taking insulin at the time of the evaluation (predominantly type 1 DM) and an older-onset group consisting of those diagnosed with DM at 30 years of age or older (predominantly type 2 DM), the latter subdivided according to whether insulin was being used at the time of evaluation. The prevalence of retinopathy may have changed somewhat since the 1980s when WESDR data was collected, given interim advances and evolving standards of care in management of DM, but the WESDR remains one of our most definitive sources of information about the epidemiology of diabetic retinopathy in the United States. In the younger-onset group, retinopathy (consisting of NPDR or PDR) was seen in 13% of those with less than a 5-year duration of DM and in 90% of those with a duration of 10–15 years.65 In the older-onset group using insulin, retinopathy was seen in 40% of those with less than a 5-year duration of disease and in 84% of those with a duration of 15–19 years, while the corresponding rates in the older-onset group not taking insulin were 24% and 53%, respectively.64
Among those with type 2 DM, in which disease onset is often more insidious than in type 1 DM and in which hyperglycemia can remain asymptomatic for years, age at diagnosis may not always accurately reflect disease duration. The Centers for Disease Control and Prevention estimate that 25.8 million people in the United States have DM, of whom 7.0 million do not know they have it.71 The prevalence of undiagnosed type 2 DM is felt to be the key factor explaining the higher rates of retinopathy noted soon after diagnosis among type 2 diabetics (24% in the older-onset group not taking insulin with less than a 5-year duration of disease in the WESDR) compared with type 1 diabetics (13% in the younger-onset group with less than a 5-year duration of disease).
Hyperglycemia
The relationship between the degree of hyperglycemia and the presence and severity of diabetic retinopathy has been extensively studied in observational studies and clinical trials. The observational studies have demonstrated that greater hyperglycemia is associated with increased prevalence and severity of diabetic retinopathy.62,64–67,69,70 Several key randomized controlled clinical trials have demonstrated that better glycemic control is associated with a decreased risk of secondary complications of DM, including diabetic retinopathy.72–79
In the Diabetes Control and Complications Trial (DCCT), 1441 participants with type 1 DM were randomly assigned to either conventional or more intensive insulin treatment and followed for a period of 4–9 years.72,73,76,79 The average difference in glycosylated hemoglobin (hemoglobin A1C [HbA1C]) between the two groups was almost 2%. Intensive insulin treatment as defined by the DCCT was associated with a decreased risk of both the development and progression of diabetic retinopathy. In patients without retinopathy at enrollment, the 3-year risk of developing retinopathy was reduced by 75% in the intensive insulin treatment group compared with the conventional treatment group. The benefit of better glycemic control was also evident in patients with existing retinopathy at baseline, as shown by a 50% reduction in the rate of progression of retinopathy compared with controls. At the 6- and 12-month visits, more intensive insulin treatment exerted a small adverse effect on retinopathy progression, similar to that described in other trials of glycemic control. However, among eyes with little or no retinopathy at the time of initiating better control of hyperglycemia, it was found that such “early worsening” of retinopathy was unlikely to threaten vision. When the DCCT results were stratified by levels of glycosylated hemoglobin, there was a 35–40% reduction in the risk of retinopathy progression for every 10% decrease in HbA1C (e.g., from 8% to 7.2%). This represented a fivefold increase in risk of progression for patients with HbA1C around 10% compared with those with HbA1C around 7%. Notably, there was also a statistically significant reduction in other microvascular complications of DM, including nephropathy and peripheral neuropathy, with more intensive glycemic control in the DCCT.
When the randomized controlled clinical trial was completed, DCCT participants were informed of the results and enrolled in a follow-up phase of the study, known as the Epidemiology of Diabetes Intervention and Complications (EDIC) study.76 After an additional 7 years of follow-up, during which the HbA1C values in both treatment groups did not differ significantly (8.1% vs 8.2%, P = 0.09), the rate of retinopathy progression remained significantly lower in those who had received more intensive treatment in the DCCT than in those who had received conventional therapy. Thus, more intensive glycemic control over a period of 6.5 years conferred benefits well beyond the period of treatment.
In the United Kingdom Prospective Diabetes Study (UKPDS), 3867 patients with newly diagnosed type 2 DM were randomly assigned to conventional therapy or to more intensive glycemic control with either insulin or a sulfonylurea.74,75 Among participants treated with conventional therapy, those who were overweight were given metformin and those who were not overweight did not receive this medication. After 12 years, the rate of retinopathy progression was reduced by 21% and the use of laser photocoagulation was reduced by 29% in those getting intensive glycemic control compared with those getting conventional treatment. For every percentage point decrease in HbA1C (e.g., 9% to 8%), there was a 35% reduction in the risk of microvascular complications of disease.
The results of the UKPDS have recently been corroborated by those of another large randomized controlled clinical trial, the Action to Control Cardiovascular Risk in Diabetes (ACCORD) study. The ACCORD study randomly assigned 10 251 patients with type 2 DM to very intensive glycemic control (targeting HbA1C less than 6%), or to standard treatment (targeting HbA1C between 7 and 7.9%). A subset of 2856 participants was evaluated for progression of retinopathy by comparison of fundus photographs taken at baseline and at 4 years.78 In this subset at one year, median HbA1C in the intensive treatment cohort was 6.4% compared with 7.5% in the cohort getting conventional therapy. In the intensive treatment group, the rate of retinopathy progression was 7.3%, compared with 10.4% in the standard therapy group (adjusted odds ratio, 0.67; 95% confidence interval [CI] 0.51–0.87; P = 0.003). The glycemia trial, performed alongside other studies evaluating control of blood pressure and plasma lipids, was halted early at a median of 3.7 years because of an increased rate of death from all causes in participants treated with intensive control compared with those managed with standard control (5% vs 4%, respectively), and the very intensive control approach was abandoned.
Hypertension
In addition to assessing the effects of differential glycemic control, the UKPDS provided a randomized comparison between more intensive blood pressure control (targeting a systolic blood pressure less than 150 mmHg) and less intensive blood pressure control (targeting a systolic blood pressure less than 180 mmHg) in a large cohort of participants with newly diagnosed type 2 DM.80 Study results demonstrated that intensive blood pressure control was associated with a decreased risk of retinopathy progression. Of 1148 hypertensive participants in the UKPDS, 758 were allocated to more intensive control of blood pressure and 390 to less intensive control with a median follow-up of 8.4 years. More intensive blood pressure control resulted in a 37% reduction in microvascular complications of DM, predominantly a reduced risk of retinal photocoagulation, compared with less intensive control. An earlier report assessing the effects of various blood pressure medications on diabetic retinopathy had suggested that there might be a specific benefit of angiotensin-converting enzyme (ACE) inhibition, even in normotensive persons. The UKPDS included a randomized comparison of beta-blockers and ACE inhibitors within the more intensive blood pressure control arm. Benefit from more intensive blood pressure control was noted in both the beta-blocker and ACE inhibitor treatment groups, with no statistically significant difference between them, suggesting that the treatment effect was probably attributable to blood pressure reduction and not to a specific effect of ACE inhibition.
The ACCORD study attempted to extend the results of the UKPDS by assessing the effect of very tight blood pressure control on retinopathy. In this study, 4733 of the 10 251 participants with type 2 DM were randomly assigned to very intensive control of blood pressure (targeting a systolic blood pressure less than 120 mmHg) or standard blood pressure control (targeting a systolic blood pressure less than 140 mmHg). A subset of 1263 participants in the blood pressure trial was evaluated for progression of retinopathy just as in the glycemia arm of the study, with comparison of fundus photographs at baseline and 4 years.78 Rate of progression of retinopathy was not significantly different in the two groups (10.4% of those treated intensively compared with 8.8% of those treated with standard care, with an adjusted odds ratio of 1.23; 95% CI 0.84–1.79; P = 0.29). The results of the UKPDS and ACCORD study are not necessarily contradictory in this regard, given the very different targets used for more and less intensive control of blood pressure between the two trials.
Dyslipidemia
Elevated levels of plasma cholesterol were associated with greater severity of retinal hard exudates in the WESDR and in the ETRDS.81,82 Independent of coincident retinal thickening, the severity of retinal hard exudates at baseline was associated with decreased visual acuity in the ETDRS. The severity of retinal hard exudates was also a significant risk factor for moderate visual loss during the course of the study. Elevated levels of plasma triglycerides were associated with a greater risk of developing high-risk PDR in the ETDRS patients.83 Two recent randomized controlled clinical trials evaluating the plasma lipid-modulatory agent fenofibrate in combination with statins in individuals with elevated plasma lipids have demonstrated that fenofibrate reduces the risk of diabetic retinopathy progression while only providing modest alterations in the plasma lipid profile.78,84 It is presently uncertain whether the effects of fenofibrate on diabetic retinopathy are secondary to its plasma lipid-modulatory activity or to some other mechanism.
Other extraocular factors
Diabetic retinopathy can worsen precipitously in the setting of pregnancy. Chapter 92 (Pregnancy-related diseases) reviews the natural history of retinopathy in pregnancy. Diabetic nephropathy, as measured by albuminuria, proteinuria, or manifestations of renal failure, has been inconsistently associated with progression of retinopathy.83,85,86 Anemia has been associated with progression of diabetic retinopathy in two small case series and two epidemiologic studies.83,87–89 The ETDRS found association between decrease in hematocrit and increase in the incidence of high-risk PDR in an adjusted multivariate model. A few reports have suggested an association between diabetic neuropathy or cardiovascular autonomic neuropathy and progression of retinopathy.83,90,91 Significant progress has been made in understanding the heritable contributions to the development of DM, particularly the type 1 form and certain familial and syndromic variants of the disease, but the identification of genetic risk factors for development and progression of diabetic retinopathy has been challenging. Chapter 46 (Diabetic retinopathy: Genetics and etiologic mechanisms) reviews our present knowledge about the genetics of diabetic retinopathy.
Ophthalmic evaluation
A comprehensive eye examination in a person with DM includes: measurement of visual acuity and intraocular pressure; evaluation of the anterior segment by slit-lamp biomicroscopy; gonioscopy when warranted (such as in the setting of elevated intraocular pressure, neovascularization of the iris, or glaucoma); and dilated funduscopic examination.92 Evaluation of the anterior segment prior to dilation of the pupil may allow visualization of neovascularization of the iris or anterior chamber angle not visible following mydriasis. Dilation of the pupil is important for adequate assessment of the posterior segment. In the absence of pupil dilation, only 50% of eyes are correctly diagnosed for the presence and severity of retinopathy.93
Ancillary ocular imaging
Fundus photography
Fundus photography is a valuable clinical tool for evaluating progression of retinopathy in individual patients and in participants in clinical trials. Photography is used in clinical practice to document the status of retinopathy and effects of treatment. Though not always as sensitive as ophthalmoscopy at detecting subtle features of diabetic retinopathy such as IRMA and early extraretinal neovascularization, photography can be useful in documenting certain findings in select patients. For example, it can be used to record the extent and distribution of hard exudates in DME, the extent of retinal alterations in severe NPDR, and the appearance of laser photocoagulation burns. Chapter 48 (Proliferative diabetic retinopathy) discusses its role in documenting the extent and characteristics of neovascularization, fibrous proliferation, and retinal traction. The development of digital systems capable of high-resolution images immediately accessible to the clinician has expanded the role of fundus photography in clinical practice, facilitating record-keeping, information-sharing among providers, and use of images as a teaching tool with patients.
Fluorescein angiography
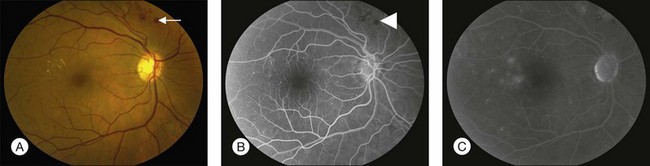
Fluorescein angiography (FA), consisting of photography or videography of the fundus using cameras equipped with appropriate filters following intravenous injection of the hydrocarbon dye fluorescein sodium, has been used clinically in ophthalmology for over 40 years and is described in detail in Chapter 1 (Fluorescein angiography). FA has multiple uses in the clinical evaluation of diabetic retinopathy. Because intravenous injection of fluorescein sodium can be associated with life-threatening adverse reactions (with risk of death estimated at approximately 1/200 000),94 FA for evaluation of diabetic retinopathy is largely confined to settings in which important aspects of management hinge on the results of the test. FA has been used extensively for evaluation of diabetic retinopathy, and is not known to pose any special hazards in DM. Nephropathy or renal failure is not a contraindication to testing.95 In NPDR, FA is most commonly indicated for further characterization of DME diagnosed on ophthalmoscopy (Fig. 47.2), and its utility in this setting is discussed below in the section “Clinical evaluation of diabetic macular edema.”
Commonly used grading systems for severity of diabetic retinopathy do not consider findings on FA, and FA is not indicated for classification of disease. While FA is a sensitive means for detection of early features of NPDR such as microaneurysms and retinal capillary hyperpermeability, it is not clinically indicated to screen for mild retinopathy.92
Optical coherence tomography
Optical coherence tomography (OCT), which utilizes low-coherence interferometry involving near-infrared light for cross-sectional imaging of intraocular structures, has emerged over the last decade as a fast, noninvasive means of imaging the retina, vitreoretinal interface, and the retinal pigment epithelium (RPE) in NPDR and other macular diseases. The basic principles of OCT and the applications of this technology to evaluation of the retina are discussed in Chapter 3 (Optical coherence tomography). In NPDR, OCT is commonly used to characterize DME (Fig. 47.3) and abnormalities of the vitreoretinal interface.
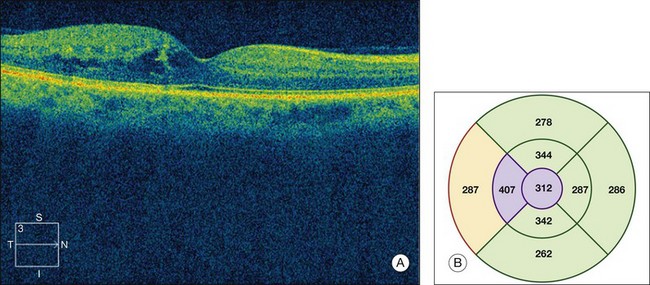
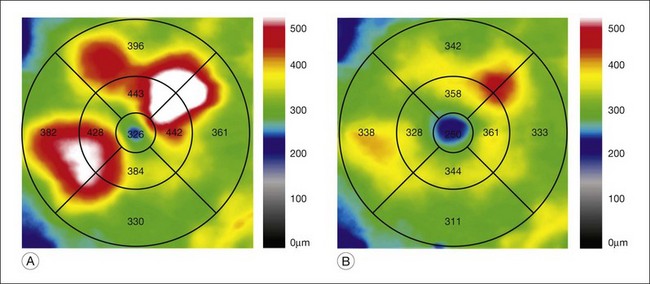
Fig. 47.3 OCT characterization of macular thickening in NPDR and DME. (A) A 6 mm horizontal line scan obtained with a spectral domain OCT system (Cirrus, Carl Zeiss Meditec, Dublin, CA) imaging the macula of the eye illustrated in Fig. 47.2 shows mild retinal thickening temporally, corresponding to the area of microaneurysms leaking on FA. (B) The retinal thickness map generated by automated segmentation of a 6×6 mm 512×128 Macular Cube scan shows mean thickness values for nine standard subfields. Mean thickness is greater than in 99% of normals in the central and inner temporal subfields (shaded purple) and greater than in 95% of normals in the outer temporal subfield (shaded red), based on a comparison to data in the Cirrus normative database.
(National Eye Institute, Bethesda, MD.)
Investigators of the Diabetic Retinopathy Clinical Research Network (DRCR.net),96 a collaborative network of over 100 sites in the United States dedicated to multicenter clinical research of diabetic retinopathy, have rigorously evaluated OCT as a test yielding measures of macular thickness in diabetic eyes. The standardization required for DRCR.net clinical trials has necessitated use of a common OCT platform and scanning technique. OCT scanning in DRCR.net studies to date involves acquisition of images of the macula by certified operators after pupil dilation, with use of a time-domain system called the Stratus OCT (Carl Zeiss Meditec, Inc., Dublin, CA) and a scanning algorithm known as the fast macular thickness map, which obtains 128 axial scans (A scans) along each of six radial lines (each 6 mm in length) intersecting at a common center, with a total scan time of 1.9 seconds. Stratus processing software includes an automated segmentation algorithm that identifies an inner and outer retinal border on line scans and calculates retinal thickness. A retinal thickness map is generated using data from all line scans obtained by the scanning algorithm. Output includes center-point thickness, total macular volume, and mean values for retinal thickness in a grid comprised of a central subfield, four inner subfields, and four outer subfields. Assessment of the quality of output depends on assessment of other parameters such as signal strength and standard deviation of center-point thickness. Software offers a comparison of thickness values to those from a normative database of measurements obtained from normal individuals.
DRCR.net investigators compared central subfield mean thickness (CSMT) values in 97 diabetics with minimal or no retinopathy and no central macular thickening on examination to normal values for nondiabetics in the Stratus OCT database.97 Results showed no significant difference between CSMT of diabetic eyes with minimal or no retinopathy and normal values imputed from nondiabetic individuals in the database, suggesting that the presence of DM is not associated with clinically important changes in CSMT in the absence of retinopathy. The study noted a statistically significant difference between CSMT in men and women, similar to findings in other reports.
DRCR.net investigators evaluated the reproducibility of OCT in eyes with DME, and established thresholds indicative of meaningful change in retinal thickness. In a prospective multicenter one-day study evaluating diurnal variation of DME, 212 eyes of 107 participants with DME involving the foveal center on biomicroscopy and CSMT of 225 microns or greater were imaged multiple times on Stratus OCT and the scans were evaluated by a reading center.98 Both eyes were imaged six times during the day, and at each of these six sittings a pair of scans was generated, with repeat imaging done for scans of suboptimal quality. Of a possible 1284 pairs, 1223 were analyzed. Reproducibility was better for CSMT than for center-point thickness, not surprising considering that CSMT incorporates more data points. The median absolute difference between replicate measurements of CSMT was 7 µm. Expressed as a percentage difference between the two measurements, the half-width of the 95% CI for a change in retinal thickness for CSMT was 10% for eyes with CSMT less than 400 µm, and 13% for eyes with CSMT equal to or greater than 400µm. The authors concluded that a change in CSMT greater than 11% using the Stratus OCT for DME is likely to be real.
The rapid pace of technological progress, resulting in recent improvements such as spectral domain imaging and image-registration capability in some systems, makes for substantial variability in image acquisition, processing, and output metrics among presently available OCT platforms. For example, the spectral domain Cirrus OCT (Carl Zeiss Meditec, Dublin, CA), though its output is similar in many ways to that of the time domain Stratus OCT, uses a distinct automated segmentation algorithm that results in retinal thickness values that are approximately 30–55µm greater than those reported by the Stratus OCT in eyes with DME.99 Meaningful interpretation of an OCT scan requires familiarity with the system utilized, including understanding of scan acquisition, indicators of scan quality, processing of raw data, algorithms for automated segmentation, and format of output metrics, as well as knowledge of any normative database used by system software to compare a given set of measurements to a normal range. Caution is warranted in comparing OCT scans obtained using different systems, and clinical researchers using OCT must grapple with such issues in planning studies that require standardization of procedures among clinical sites. The DRCR.net is presently evaluating issues related to integrating new OCT systems into future research studies.
Funduscopic lesions of nonproliferative diabetic retinopathy
Small or nonperfused microaneurysms may not be discernible on ophthalmoscopy, but those that are visible appear as small deep-red dots between 25 and 100µm in diameter within the retina (see Figs 47.2A, 47.4). Microaneurysms in NPDR typically arise in the posterior pole, but they can also be present in the midperipheral and peripheral retina, particularly in more severe retinopathy. They may be solitary or may appear in clusters. They may remain stable across months or even years, but many appear and eventually disappear. On FA, microaneurysms are visible during arteriovenous transit as hyperfluorescent dots within the retina (see Fig. 47.2B). This hyperfluorescence typically persists in later phases of the angiogram, and may or may not be associated with leakage in mid- and late frames (see Fig. 47.2C). FA is a sensitive means of detecting microaneurysms, and may reveal lesions that were poorly visible or not visible on ophthalmoscopy.
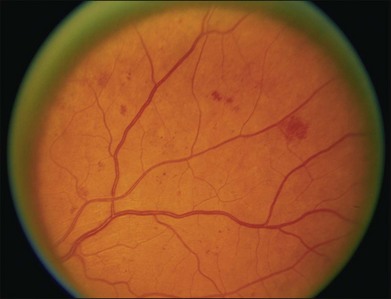
Intraretinal hemorrhages in NPDR are variable in appearance, just as in other retinal diseases (Figs 47.2A, 47.4). Dot-blot hemorrhages are typically small with sharply demarcated borders, and are sometimes indistinguishable from microaneurysms on ophthalmoscopy. Flame hemorrhages can be larger, and manifest wispy margins as a consequence of their location in the nerve fiber layer. Intraretinal hemorrhages appear hypofluorescent on FA, blocking normal fluorescence from the underlying choroid, and consequently FA offers ready distinction between microaneurysms and hemorrhages (Fig. 47.2B). Intraretinal hemorrhages can be present in the posterior pole and in more peripheral retina, and frequently appear and disappear over weeks or months. Hemorrhages on the optic disc are not typical for diabetic retinopathy, and should raise suspicion for neovascularization or a comorbid condition affecting the optic nerve head. Variability in the density of hemorrhages between one sector of the retina and another is common, but striking asymmetry sometimes suggests a superimposed process such as a branch retinal vein occlusion.
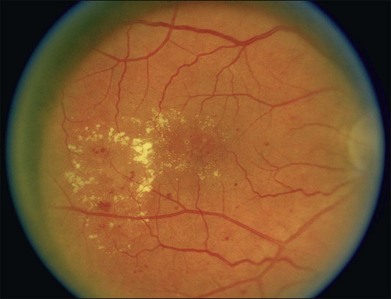
Hard exudates are visible on ophthalmoscopy as sharply demarcated yellow-white deposits within the retina (Figs 47.2A, 47.5). They are visible on OCT line scans as hyperreflective foci within the retina. With stereoscopic viewing they are readily distinguishable from drusen, which reside external to the retina. Hard exudates are often distributed at the border between edematous and nonedematous retina. They may form a circinate ring around areas of prominent vascular hyperpermeability such as a cluster of microaneurysms. They tend to form in the posterior pole in association with macular thickening, but small collections are sometimes present in more peripheral retina. They are hypofluorescent on FA, blocking underlying choroidal fluorescence (see Fig. 47.2B). Hard exudates may appear and disappear over months or years. When severe, they may undergo organization and may cause subretinal fibrosis.
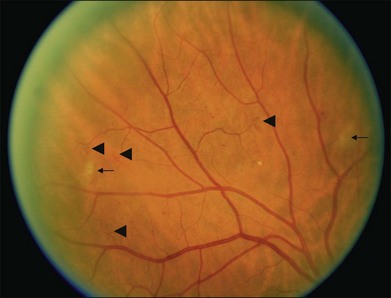
Cotton-wool spots, patches of relative ischemia affecting the nerve fiber layer of the retina, are visible on ophthalmoscopy as small white patches with wispy borders situated in the inner retina (Fig. 47.6). They are hypofluorescent on FA, blocking underlying choroidal fluorescence. They commonly appear and disappear over weeks or months.
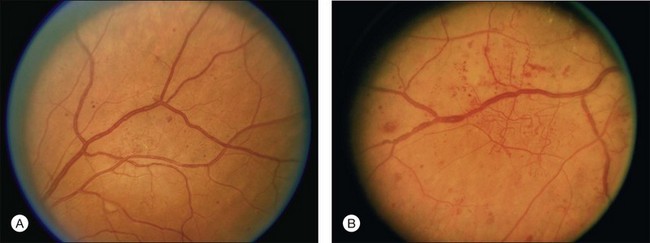
The major retinal vessels can exhibit changes in appearance in the setting of advanced retinopathy. Arterioles may appear thin or white. Venules may appear dilated and tortuous. Venous loops are occasionally present. Venous beading consists of localized areas of change in vessel caliber, visible as alternating regions of relative dilation and constriction (Fig. 47.7).
Intraretinal microvascular abnormalities (IRMA) appear as segments of dilated and tortuous retinal vasculature amidst retinal vessels that are normally too small to be visible on ophthalmoscopy (see Fig. 47.6). They are usually readily distinguishable from extraretinal neovascularization on careful biomicroscopy. On FA they appear hyperfluorescent during the arteriovenous transit phase, may leak in later phases, and are often situated at the borders of areas of capillary nonperfusion. They may persist for months or years.
Classification of diabetic retinopathy
The Diabetic Retinopathy Study, a landmark clinical trial that established the efficacy of scatter laser photocoagulation for reduction of severe vision loss secondary to PDR, used an adaptation of the Airlie House classification of diabetic retinopathy originally developed in 1968.100 This modified Airlie House system was extended for grading severity of retinopathy in the ETDRS.101 Grading of retinopathy in the ETDRS involved evaluation of seven-field 30-degree nonsimultaneous stereo color fundus photographs by trained readers. Over 30 characteristics were separately graded, using standard photographs to define thresholds for scoring (see Figs 47.4, 47.5, 47.6, 47.7 for some of the standard photographs utilized in the system), and a summary grade was assigned. The ETDRS diabetic retinopathy severity scale was evaluated for its reproducibility as part of the study and was validated as a grading system with prognostic power.101–103 ETDRS investigators assigned thresholds to define mild NPDR, moderate NPDR, severe NPDR, early PDR, and high-risk PDR (Box 47.1). The 5-year rates of development of high-risk PDR in eyes randomly assigned to deferral of photocoagulation (no laser treatment unless features of high-risk PDR developed) for eyes with mild, moderate, and severe NPDR at baseline were 15.5%, 26.5%, and 56%, respectively.
Box 47.1
Classification of diabetic retinopathy in the ETDRS
At least one microaneurysm, AND criteria not met for more severe retinopathy.
Hemorrhages/microaneurysms ≥ standard photograph 2A (Fig. 47.4); AND/OR cotton-wool spots, venous beading, or IRMA definitely present; AND criteria not met for more severe retinopathy
Cotton-wool spots, venous beading, and IRMA definitely present in at least two of photographic fields 4 to 7; OR two of the three preceding features present in at least two of fields 4 to 7 and hemorrhages/microaneurysms present in fields 4 to 7 ≥ standard photograph 2A (Fig. 47.4) in at least one of them; OR IRMA present in each of fields 4 to 7 and ≥ standard photograph 8A (Fig. 47.6) in at least two of them; AND criteria not met for more severe retinopathy.
New vessels; AND criteria not met for high-risk PDR.
New vessels on or within one disc diameter of the optic disc (neovascularization of the disc [NVD]) ≥ standard photograph 10A (approximately 1/4 to 1/3 disc area) with or without vitreous or preretinal hemorrhage; OR vitreous and/or preretinal hemorrhage accompanied by new vessels, either NVD < standard photograph 10A or new vessels elsewhere (NVE) ≥ 1/4 disc area.
Grading and classification of retinopathy in the ETDRS involved evaluation of modified Airlie House seven-field 30-degree non-simultaneous stereo color fundus photographs by trained readers. Photographic fields 4 and 6 image superior retina and are tangential to both a vertical line through the center of the optic disc and a horizontal line crossing its superior border. Photographic fields 5 and 7 image inferior retina and are tangential to both a vertical line through the center of the optic disc and a horizontal line crossing its inferior border. A set of standard photographs was used to define thresholds for grading and classification (see Figs 47.3, 47.4, 47.5, 47.6 for some of the standard photographs utilized in the system).
The prognostic utility of a 1-step or a 2-or-greater-step progression in the ETDRS diabetic retinopathy severity scale has been evaluated using data from the WESDR.104 Findings indicated that 1-step or 2-or-greater-step worsening in level of retinopathy over 4 years strongly predicted the development of PDR during the subsequent 6 years. The ETDRS diabetic retinopathy severity scale remains the standard for photographic grading of retinopathy in clinical trials. The schema is impractical for routine clinical use because of its complexity and its basis in photographic – not ophthalmoscopic – assessment of the fundus, but the ETDRS definitions for mild, moderate, and severe NPDR and early and high-risk PDR were incorporated into clinical practice. A 4–2–1 rule was popularized to simplify the definition of severe NPDR.105 Upon examination of the four midperipheral quadrants of the retina, the presence of any one of the following features was considered sufficient for diagnosis of severe NPDR (in the absence of evidence for PDR): (1) severe intraretinal hemorrhages and microaneurysms in all four quadrants (≥ standard photograph 2A [see Fig. 47.4]); (2) venous beading in two or more quadrants; or (3) moderate IRMA in at least one quadrant (≥ standard photograph 8A [see Fig. 47.6]). If any two of these features were present, the retinopathy was considered very severe. It is worth pointing out that the 4–2–1 rule uses a threshold for definition of severe NPDR inclusive of milder retinopathy than the definition of severe NPDR used in the ETDRS.
In answer to the need for a simplified classification of diabetic retinopathy to facilitate communication among clinicians worldwide, the Global Diabetic Retinopathy Project Group published proposed International Clinical Diabetic Retinopathy and Diabetic Macular Edema Severity Scales in 2003 (Table 47.1).106 The classification was developed using evidence from studies such as the ETDRS and WESDR to draw distinctions in retinopathy severity most important for prognosis and management, and approximates the definitions used in the ETDRS.
Table 47.1 Disease severity scales for diabetic retinopathy and diabetic macular edema
| Proposed disease severity level | Findings observable on dilated ophthalmoscopy |
|---|---|
| No apparent retinopathy | No abnormalities |
| Mild NPDR | Microaneurysms only |
| Moderate NPDR | More than just microaneurysms but less than severe NPDR |
| Severe NPDR |
DME is defined as retinal thickening, assessed by stereoscopic evaluation of the fundus by slit-lamp biomicroscopy or assessment of photographs. Hard exudates are a sign of present or past retinal thickening.
(Adapted with permission from Wilkinson CP, Ferris FL 3rd, Klein RE, et al. Proposed international clinical diabetic retinopathy and diabetic macular edema disease severity scales. Ophthalmology 2003;110:1677–82.)
Clinical evaluation of diabetic macular edema
Distribution of retinal thickening and hard exudates
The ETDRS defined clinically significant macular edema (CSME) as any of the following noted on biomicroscopy: (1) thickening of the retina at or within 500 µm of the center of the macula; (2) hard exudates at or within 500 µm of the center of the macula, if associated with thickening of the adjacent retina (not residual hard exudates remaining after the disappearance of retinal thickening); or (3) a zone or zones of retinal thickening one disc area or larger, any part of which is within one disc diameter of the center of the macula.38
The definition for CSME was based on observation that retinal thickening or hard exudation involving or threatening the fovea frequently leads to vision loss. Careful assessment of the distribution of retinal thickening and hard exudates and their relation to the center of the macula remains paramount to management of DME. Severity of DME in the International Clinical Diabetic Macular Edema Disease Severity Scale is based solely on whether retinal thickening and hard exudates involve or threaten the center of the macula, reflecting the importance of foveal involvement for prognosis and management.106
While diagnosis on biomicroscopic examination remains the clinical standard for detection of DME, OCT is increasingly used as a fast and noninvasive tool to quantitatively map areas of macular thickening (see Fig. 47.3). Subtle changes in distribution of thickening over time and relationship to the fovea can be documented with good-quality scans that serially image the same region of the macula (Fig. 47.8). The standardization afforded by OCT has proven valuable in clinical practice and in research. Hard exudates can be visualized on OCT as hyperreflective foci within the retina, but biomicroscopic examination and fundus photography remain important to document their extent and proximity to the fovea.
Magnitude of retinal thickening
The degree of thickening at any given point in the retina has traditionally been estimated on biomicroscopy and stereoscopic photographs, but OCT has recently emerged as a superior means of quantifying retinal thickness. The sensitivity of OCT for retinal thickening exceeds that of contact lens-assisted biomicroscopy performed by experienced examiners.107 Correlation between the estimated degree of retinal thickening at the center of the macula on stereoscopic photographs and the center-point thickness measured on time domain OCT is modest, reflecting the limitations of grading retinal thickness on photographs.108
OCT processing yields several metrics useful in characterizing the thickness of the retina in DME. For example, the Stratus OCT used by DRCR.net sites calculates a center-point thickness, CSMT, inner and outer subfield mean thicknesses, and macular volume for commonly used scanning algorithms. A DRCR.net study concluded that CSMT is well suited as a metric for central macular thickness in clinical research, with high reproducibility and good correlation to other metrics in the setting of DME.109 Mean thickness in other subfields and total macular volume are useful in assessing extrafoveal macular edema.
OCT is capable of detecting areas of subtle macular edema that are sometimes not suspected on ophthalmoscopy (Fig. 47.8B). Easy detection of such “subclinical” thickening has added a new and provocative facet to management of DME, challenging clinicians to incorporate knowledge of more mild pathology into clinical decision-making. Conversely, OCT can illustrate areas of retinal thinning that sometimes result from advanced retinopathy. Occasionally, the presence of mild macular edema in retina that would be thinner than normal in the absence of such edema can result in a retinal thickness that appears “normal” relative to typical thickness in diabetics without retinopathy. Such abnormal thickening of retina that would otherwise be abnormally thin can make it challenging to define what constitutes complete resolution of macular edema in some eyes.
Retinal microvascular alterations and vascular hyperpermeability
The retinal microvasculature and any areas of capillary nonperfusion are best imaged in the arteriovenous transit phase of the angiogram. Microaneurysms and microvascular abnormalities, sometimes unsuspected on ophthalmoscopy, are readily visualized (Fig. 47.2). The absence of normal hyperfluorescence from capillaries in a region where they should usually exist indicates capillary nonperfusion (Fig. 47.9). Areas of foveal capillary nonperfusion manifest as an abnormally large foveal avascular zone (FAZ) or as irregularity in the borders of the FAZ. Unfortunately, visualization of capillary nonperfusion requires resolution near the limit of present camera systems, and even slight decreases in image quality (such as from poor focus or cataract) can impair assessment. The retina in areas of capillary nonperfusion may be edematous, normal thickness, or thin.
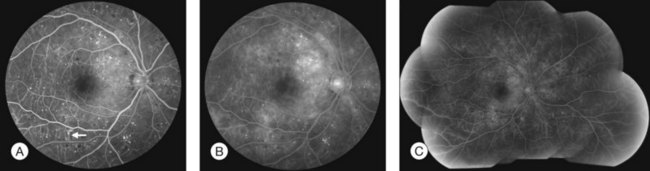
FA is useful in evaluating retinal vascular competence, illustrating areas of hyperpermeability where dye leaks into the extravascular space (Fig. 47.9). Fluorescein leakage may emanate from discrete microaneurysms or microvascular abonormalities visible on the angiogram, or it may accumulate in areas of diffuse retinal capillary incompetence. Microaneurysms, microvascular abnormalities, and capillary telangiectasis visualized in the early phase of the angiogram can exhibit progressive leakage best appreciated in later phases, between 5 and 10 minutes after injection of dye. Fluorescein leakage may be present in a region of the retina that is edematous, normal thickness, or thin, and is therefore not synonymous with macular edema. However, ETDRS investigators and others have demonstrated correlation between area of fluorescein leakage and extent of retinal thickening on stereoscopic photographs and OCT.110–112
Traction by vitreous gel and epiretinal proliferation
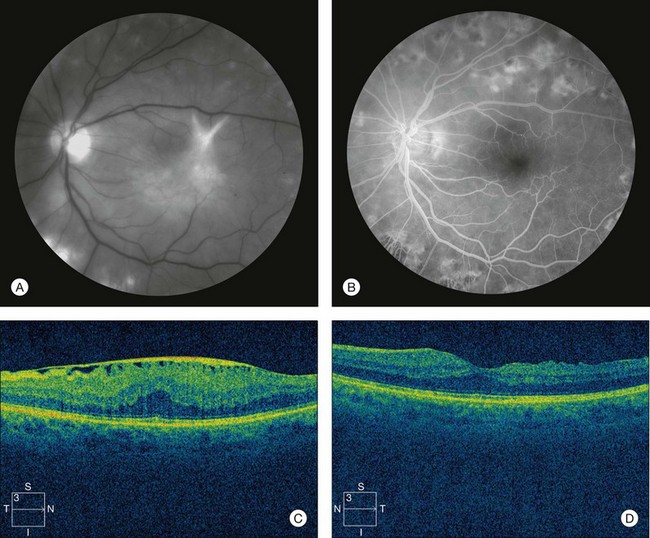
In some cases, findings on biomicroscopy, OCT, and FA strongly suggest a tractional component to DME (Fig. 47.10). A thickened posterior hyaloid membrane or epiretinal membrane with attachment in the area of macular edema, with or without retinal striae, may be visible on biomicroscopic examination. OCT may show a hyaloid or epiretinal membrane stretched taut over an area of retinal thickening. This membrane may appear uniformly attached to the retina, or may show multiple points of focal attachment, the latter frequently associated with focal tentings of the inner aspect of the retina. The region of macular edema may correspond closely with the area in which the membrane has attachment to the retina, and retina outside this area of attachment may be uninvolved, with an appreciable step-off in thickness at the borders of membrane attachment. Fluorescein leakage, if present, may arise diffusely from telangiectatic retinal capillaries in the region of macular edema. These features are similar to those seen in vitreomacular traction in the setting of incomplete posterior vitreous separation or epiretinal membrane formation with macular edema in nondiabetic eyes.
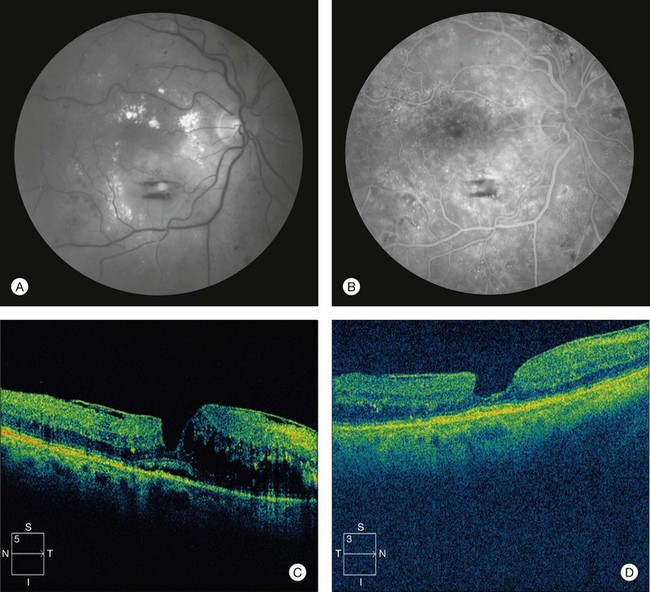
In other cases, a posterior hyaloid or epiretinal membrane visible on ophthalmoscopy or OCT may not appear to exert a predominant mechanical effect on the retina, and findings may suggest that retinal microvascular alterations from the metabolic disease are responsible for DME (Fig. 47.11). A subtle glistening of the vitreoretinal interface on biomicroscopy may belie the presence of the membrane, or the membrane may only be visible on OCT. A membrane visible on OCT may parallel the contour of the inner aspect of the retina with areas of attachment, but without any serrated distortion of the inner retina or retinal striae visible on biomicroscopy. The area of macular edema may exhibit a gradually tapering convexity, with or without presence of cysts, without any abrupt step-off to noninvolved areas at its borders. Biomicroscopy may show discrete microaneurysms in the area of macular edema, and FA may show areas of focal leakage from such microaneurysms or other microvascular abnormalities. Incomplete posterior vitreous separation or epiretinal membrane formation in the absence of retinal distortion or thickening in nondiabetic eyes is often compatible with normal vision. Such membranes, when present in eyes with DME, may be incidental to the macular edema associated with the retinopathy.
Alterations in the retinal pigment epithelium
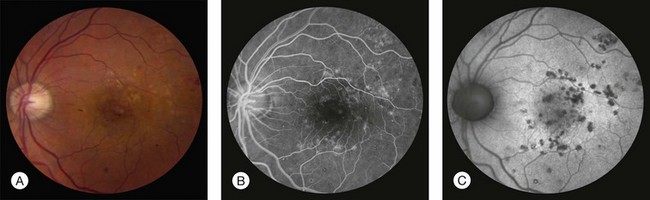
In most eyes with untreated DME, the RPE appears normal on ophthalmoscopy, OCT, and FA. Longstanding macular edema is occasionally accompanied by pigmentary alterations or atrophy of RPE. More commonly, RPE changes reflect stigmata of previous laser photocoagulation in eyes previously treated for DME (Fig. 47.12A). Visualization of discrete laser scars on FA, not always visible on ophthalmoscopy, allows assessment of the adequacy and extent of past treatment and can be helpful in planning further therapy (Fig. 47.12B). Autofluorescence photography has recently emerged as a less invasive means of evaluating such RPE alterations, and may largely supplant angiography for this application in DME (Fig. 47.12C).113,114
Subretinal fibrosis
Subretinal fibrosis is an uncommon feature of DME associated with severe hard exudates or disruption of the RPE by overaggressive laser treatment. In the ETDRS, investigators identified 109 eyes with subretinal fibrosis, defined as a mound or sheet of gray-to-white tissue beneath the retina at or near the center of the macula.115 Very severe hard exudates were present in the macula of 74% of these eyes prior to appearance of subretinal fibrosis; by comparison, exudates this severe were seen only in 2.5% of eyes with CSME that did not develop subretinal fibrosis (P <0.001). Among 264 eyes with very severe hard exudates in the macula at any time during the ETDRS, subretinal fibrosis developed in 31%, while among 5498 eyes with CSME and lesser levels of hard exudation, such fibrosis developed in only 0.05%. In the 4823 eyes that underwent laser photocoagulation for treatment of DME, only 9 eyes developed subretinal fibrosis adjacent to a laser photocoagulation scar, making this at worst a rare complication of such treatment.
Visual acuity and its correlation to retinal thickening and fluorescein leakage
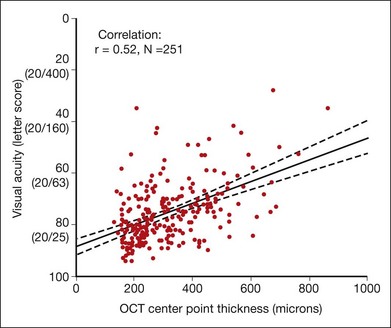
Retinal thickening that involves or threatens the fovea frequently leads to vision loss. In the ETDRS, the 3-year risk of moderate vision loss was 32% among eyes observed with CSME.38 However, studies have shown variable but generally modest correlation between central retinal thickness and concurrently measured visual acuity.116–124 In one study of 251 eyes of 210 participants in a randomized clinical trial evaluating laser techniques, in which vision was tested with an electronic ETDRS protocol following standardized refraction and central retinal thickening was measured using time domain OCT and evaluated by a reading center, the correlation between visual acuity and center-point thickness was 0.52 at the baseline time point (Fig. 47.13).125 The slope of the corresponding best-fit line was 4.4 letters (95% CI 3.5–5.3) of better visual acuity for every 100 µm decrease in center-point thickness.
Fluorescein leakage on FA has low correlation with concurrently measured visual acuity. Among 422 eyes (a mix of study and nonstudy eyes) of participants in the randomized clinical trial evaluating laser techniques mentioned previously, the area of fluorescein leakage within an ETDRS macular grid was graded at baseline and correlated to several other baseline measures.111 Correlation of the area of fluorescein leakage with visual acuity was 0.33, compared with a value of 0.38 for OCT CSMT and 0.58 for OCT total macular volume.
Diurnal variation of DME
On average, retinal thickness in DME decreases slightly during the day, but the proportion of eyes with DME exhibiting clinically meaningful changes is small. In the largest study to date, 156 eyes of 96 participants with center-involved DME on ophthalmoscopy and CSMT of 225 microns or greater were evaluated at six time points between 8am and 4pm using the Stratus OCT.126 Two scans of adequate quality were obtained at each time point and sent to a reading center. The mean change in relative central subfield thickening, defined to represent the change in excess retinal thickness, was a decrease of 6% (95% CI −9% to −3%) between the 8am and 4pm time points. The mean absolute change was a decrease in 13 µm (95% CI −17 to −8 µm). Three percent (5 of 156) of eyes met a composite endpoint of 25% or greater decrease in relative central subfield thickening and 50 µm or greater decrease in CSMT at two consecutive time points, and 1% (2 of 156) of eyes exhibited increases in both measures by at least these amounts.
Management of nonproliferative diabetic retinopathy and diabetic macular edema
Modification of systemic risk factors
Control of hyperglycemia is critical to minimizing risk of onset and progression of diabetic retinopathy. The benefits of better glycemic control in reducing risk for retinopathy progression have been demonstrated in multiple randomized controlled clinical trials, including the DCCT, EDIC study, UKPDS, and ACCORD study mentioned previously and further discussed in Chapter 45 (The epidemiology of diabetic retinopathy).72,73,75,76,78,79 The American Diabetes Association recommends glycemic control targeting a hemoglobin A1C of 7.0% or lower for most diabetics.127 Not only does such a target lower risk of retinopathy onset and progression, it also lowers risk of other microvascular complications of disease, such as neuropathy and nephropathy. The ACCORD study has provoked recent controversy about whether more aggressive targeting of near-normal hemoglobin A1C values is desirable.128,129 As discussed earlier, the ACCORD study included a trial that randomly assigned 10 251 patients with type 2 DM to intensive glycemic control targeting HbA1C of less than 6% or to standard treatment targeting HbA1C between 7 and 7.9%. The glycemia trial was stopped after a median of 3.7 years because of an increase in all-cause mortality in the intensive treatment group (5% in the intensive treatment group versus 4% in the standard treatment group; hazard ratio 1.21; 95% CI 1.02–1.44).130 Rates of hypoglycemia requiring assistance were significantly higher in the intensive treatment group than in the standard treatment group (10.5% vs 3.5%; P = 0.001), corroborating similar findings among intensively treated participants in other clinical trials of glycemic control, but the higher mortality rate noted in participants in the ACCORD study could not be readily attributed to complications of hypoglycemia. Despite evidence that aggressive targeting of near-normal glycosylated hemoglobin levels may offer benefit in reducing microvascular complications of DM, there is consensus that such an approach should be pursued cautiously based on the mortality findings of the ACCORD study.127
Control of hypertension is also beneficial in lowering risk of progression of diabetic retinopathy, as demonstrated in the UKPDS.74,80 Hypertensive participants with newly diagnosed type 2 DM in the UKPDS were randomly assigned to more intensive blood pressure control (targeting a systolic blood pressure less than 150 mmHg) and less intensive blood pressure control (targeting a systolic blood pressure less than 180 mmHg) and also randomly assigned to treatment with beta-blockers or ACE inhibitors. The UKPDS showed benefit of better control of blood pressure, as discussed previously. The ACCORD study, which included a blood pressure trial that randomly assigned participants to more or less intensive control of blood pressure (targeting a systolic blood pressure less than 120 mmHg or less than 140 mmHg, respectively), did not show benefit in reducing risk of retinopathy progression in a subset of participants evaluated for eye disease.78 While provocative, the results of the ACCORD study do not necessarily contradict the findings of the UKPDS, given the very different targets used for more and less intensive control of blood pressure between the two trials. It is possible that modest control of severe hypertension (as done in the UKPDS) lowers retinopathy progression, while very aggressive lowering of blood pressure below present standard of care (as done in the ACCORD study) lends no additional benefit. Alternatively, the disparity in findings could be attributable to differences in the study populations.
Treatment of dyslipidemia may be beneficial to retinopathy, based on consideration of observational data from studies like the WESDR and the ETDRS.81,82 However, there is no evidence from randomized controlled clinical trials that plasma lipid-lowering reduces risk of retinopathy onset or progression, largely because persons with dyslipidemia need to lower their lipid levels to reduce the risk of cardiovascular disease, making such trials difficult or impossible. The ACCORD study, together with another randomized controlled clinical trial called the Fenofibrate Intervention and Event Lowering in Diabetes (FIELD) study, suggests a possible role for fenofibrate in reducing risk of retinopathy progression, but it is unclear whether the mechanism of action involves alteration of the plasma lipid profile.78,84 Fenofibrate is discussed further below as a potential systemic treatment for diabetic retinopathy.
Retinopathy screening and surveillance
Sight-threatening retinopathy may not cause symptoms prompting evaluation until disease is advanced. Treatment to reduce risk of vision loss in eyes with sight-threatening complications of diabetic retinopathy is most effective when initiated before severe vision loss has occurred. These facts underpin the importance of screening and surveillance for retinopathy, but reports suggest that many diabetics do not receive eye examination on the schedule recommended by organizations such as the American Diabetes Association and the American Academy of Ophthalmology.92,131–135 For example, an analysis of Medicare claims data for beneficiaries 65 years of age and older revealed that only between 50 and 60% of diabetics received annual eye examinations over a 15-month period.133 In many less-developed countries the situation is much worse, with only a small fraction of diabetics receiving any eye evaluation at all.
The recommended schedule for screening and surveillance for NPDR reflects knowledge about the epidemiology and natural history of disease. Initial eye examination is recommended 3–5 years following diagnosis of type 1 DM, and at time of diagnosis for those with type 2 DM.92 Recommended follow-up examination for type 1 and type 2 diabetics with no retinopathy is yearly. In the absence of DME, those with mild to moderate NPDR should be evaluated every 6–12 months, and those with severe NPDR should be seen every 2–4 months. Diabetics with DME merit frequent follow-up, generally at least every 2–4 months, and sometimes monthly depending on treatment. Any new ocular symptoms should prompt timely evaluation tailored to the circumstances.
In the setting of pregnancy, eye examinations are recommended prior to conception and early during the first trimester.92 Follow-up for pregnant patients with no retinopathy, mild NPDR, or moderate NPDR should be individualized based on the severity and recent changes in retinopathy. Pregnant patients with severe NPDR should be evaluated every 1–3 months. Specific circumstances, such as presence of DME, may dictate need for more frequent follow-up.
A comprehensive eye evaluation including dilated funduscopic examination by an ophthalmologist experienced in management of diabetic eye disease remains the standard of care for retinopathy screening in areas with adequate access to ophthalmic care. However, as imaging and information-sharing technologies continue to improve, remote screening for diabetic retinopathy, such as review of digital fundus photographs acquired outside the ophthalmologist’s office, may offer a cost-effective alternative. In such a model, patients manifesting findings indicative of a certain level of retinopathy and patients for whom adequate images cannot be obtained are referred to an ophthalmologist for full evaluation.136 Such an approach has particular promise in settings where access to ophthalmic care is limited. A number of studies have demonstrated reasonable sensitivity and specificity of various remote screening platforms compared with the standard of dilated funduscopic examination by an ophthalmologist or expert evaluation of seven-field fundus photographs obtained by an ophthalmic photographer.137–143
Ocular treatment for diabetic macular edema
Recent success of certain pharmacologic agents for treatment of DME has been exciting, but even the most informative studies raise important unsettled questions. Management algorithms for DME have been made more complex by the availability of alternatives to laser photocoagulation, resulting in decision-making individualized to a variety of factors. The value of information gained from high-quality randomized controlled clinical trials and the importance of long-term outcomes in evaluating new therapies cannot be overstated. Recent experience with use of intravitreous injection of triamcinolone acetonide for treatment of DME illustrates both points. Early clinical experience, case series, and small trials with short-term follow-up suggested significant and occasionally dramatic improvement in macular edema following intravitreous administration of triamcinolone, and the treatment gained popularity, particularly in diabetics refractory to laser photocoagulation therapy.121,144–150 A randomized controlled clinical trial was carried out comparing focal/grid laser photocoagulation and intravitreous injections of triamcinolone acetonide (1 mg or 4 mg) for treatment of DME involving the center of the macula.151,152 At 4 months, mean visual acuity was significantly better in eyes treated with triamcinolone (4 mg) than in eyes treated with laser photocoagulation. However, at evaluation of the primary outcome at 2 years, mean visual acuity was significantly better in eyes treated with focal laser than in eyes from either of the triamcinolone groups, a difference that could not be attributed solely to cataract progression in eyes receiving triamcinolone. The results of this trial offered critical clarification of the benefits and limitations of intravitreous triamcinolone not discernible from short-term studies and anecdotal experience.
Despite important progress in treatment, DME remains a significant cause of vision loss. This reflects shortcomings in diagnosis and treatment of DM, inadequacies in screening and surveillance of diabetic retinopathy, and limitations of present treatment for DME. Ocular therapy for DME reduces risk of future vision loss, and may improve vision, but often does not restore normal macular function or structure. In a recent randomized controlled clinical trial demonstrating some of the most significant benefits seen to date for any treatment of DME, groups gaining most vision (those treated with intravitreous injections of the VEGF antagonist ranibizumab plus prompt or deferred focal/grid laser photocoagulation) demonstrated an 8- or 9-letter mean gain in visual acuity at the 2-year visit compared with a baseline mean visual acuity of 63 letters.153 Such results indicate that on average vision in these eyes improved from approximately 20/50− to 20/40+. At 2 years, the percentage of eyes with CSMT equal to or greater than 250 µm (using a time domain system for which normal CSMT measures approximately 200µm) was 43% in the ranibizumab plus prompt laser group and 42% in the ranibizumab plus deferred laser group, reflecting a significant number of eyes with residual macular edema despite treatment.
The ETDRS concept of clinically significant macular edema (CSME), discussed earlier in this chapter, remains relevant to management of DME. The ETDRS demonstrated that eyes with DME involving or threatening the center of vision are at high risk of vision loss,38 and there is consensus that such eyes merit treatment to reduce the chance of further vision loss. However, eyes with clinically significant macular edema that threatens but does not involve the macular center have often been excluded from recent clinical trials, making for greater uncertainty about the best treatment options in this subset of eyes. Such eyes received focal/grid laser photocoagulation in the ETDRS, but it is not known how laser treatment compares to other therapeutic options. Likewise, recent trials have frequently excluded eyes with very good and very poor visual acuity, making evidence-based decision-making more difficult in these cases as well. Finally, as mentioned previously, the sensitivity of OCT for retinal thickening allows identification of very mild disease, often termed “subclinical” macular edema because it is not easily visible on biomicroscopy. OCT thickness parameters designated in eligibility criteria and retreatment algorithms from clinical trials indicate what threshold of thickening was considered significant enough to treat and retreat in a given study; however, such information provides no guidance on whether outcomes would have differed if other thickness thresholds had been used instead. Areas of macular thickening and hard exudate not meeting criteria for CSME can usually be observed vigilantly, with institution of treatment if CSME evolves.38
Attention to the context of DME is important for management. The principles of treatment of DME remain the same regardless of the underlying severity of diabetic retinopathy, but management may differ depending on the circumstances. There are special considerations for treatment of DME in the context of PDR, given the imperative to administer any necessary treatment to lower risk of vision loss from the complications of proliferative disease. Chapter 48 (Proliferative diabetic retinopathy) discusses considerations for management of DME in the setting of PDR. Other ocular conditions may impact DME or the choice of treatment. For example, postoperative cystoid macular edema may complicate DME following intraocular surgery and may warrant different treatment. Presence of glaucoma may contraindicate use of local corticosteroids. Some such considerations are included in the following discussion, but an exhaustive review is beyond the scope of this chapter.
Focal/grid laser photocoagulation
The efficacy of focal/grid laser photocoagulation for treatment of DME was established in the ETDRS,38 though its mechanisms of action remain uncertain even two decades later. Chapter 39 (Retinal laser therapy: Biophysical basis and applications) describes the principles of ophthalmic laser therapy and discusses hypotheses about its mechanisms. The ETDRS was a landmark randomized controlled trial with a complex study design enrolling 3711 participants to test the effect of different strategies of focal/grid and scatter laser photocoagulation and the use of daily aspirin on retinopathy progression and vision loss in eyes with disease ranging from mild NPDR to early (non-high-risk) PDR.154 At 3 years, eyes with mild or moderate NPDR plus macular edema at baseline treated with immediate focal/grid laser photocoagulation showed an approximately 50% decrease in the rate of moderate vision loss (defined as a decrease of three lines or more on a logarithmic visual acuity chart, corresponding to a doubling of the initial visual angle) compared with similar eyes randomly assigned to deferral of photocoagulation (11.2% vs 21.1%; P <0.001). Eyes with severe NPDR or early PDR and macular edema at baseline treated with immediate focal/grid laser photocoagulation were concomitantly treated with immediate full or mild scatter laser, and showed reduction in moderate vision loss apparent at time points later than 3 years, reflecting an early detrimental effect of immediate scatter photocoagulation.
Treatment of eyes assigned to immediate focal/grid laser photocoagulation in the ETDRS involved argon laser application to areas of retinal thickening identified on biomicroscopy and characterized by FA.155 Study treatment involved “direct” treatment of all microaneurysms exhibiting leakage of fluorescein dye in regions of retinal thickening between 500 and 3000 µm from the foveal center. Burn characteristics for direct treatment included size 50–100 µm, exposure 0.05–0.10 seconds, and intensity sufficient to whiten or darken large microaneurysms. The study treatment technique also included “grid” treatment applied to areas of diffuse leakage of fluorescein dye and areas of capillary nonperfusion in regions of retinal thickening between 500 and 3000 µm from the foveal center, with spacing between spots of at least one burn-width. Burn characteristics for grid treatment included size less than 200 µm, exposure 0.05–0.10 seconds, and intensity described as “mild.” Eyes were assessed every 4 months, and retreatment was performed for CSME exhibiting any treatable areas. Minor effects on visual field were attributed to focal/grid laser photocoagulation, but at 4 months the occurrence of scotomata within 20 degrees of fixation identified by kinetic perimetry among eyes with mild or moderate NPDR and macular edema was similar between eyes assigned to immediate focal/grid laser photocoagulation and eyes assigned to deferral of photocoagulation.103 More significant effects on visual field were attributed to full and mild scatter laser. Additional adverse effects of laser treatment included choroidal neovascularization and subsequent fibrosis that can occur in areas of disruption of the RPE caused by laser photocoagulation, sometimes years following the procedure, but this complication is infrequent and is often self-limited. Subretinal fibrosis was noted in proximity to a laser scar in only 9 of 4823 eyes treated with focal/grid laser photocoagulation in the ETDRS.115
The technique for focal/grid laser photocoagulation has evolved since the ETDRS, trending toward application of smaller, less intense burns, and less frequently making use of a fluorescein angiogram to guide treatment. Present standard technique is well summarized by parameters for “modified-ETDRS” focal/grid laser photocoagulation specified by the DRCR.net for use in its protocols (Table 47.2).156 The development and availability of novel ophthalmic laser systems has led to extrapolation of the argon green laser parameters to other platforms. One randomized prospective study treating 171 eyes (91 participants) with modified grid laser for treatment of DME found no significant difference in visual acuity or other measures comparing the argon green laser to the diode (810 nm) laser.157 Some uncertainty persists regarding whether other systems and techniques vary in clinically important ways from focal/grid laser photocoagulation using the argon laser.120,158–167 The value of applying laser photocoagulation in ETDRS-style to areas of retinal thickening and fluorescein leakage was tested in a randomized DRCR.net study comparing standard modified-ETDRS technique to a novel procedure consisting of milder but more extensive burns applied throughout the macula in 323 eyes with DME involving the foveal center.168 Standard modified-ETDRS laser resulted in significantly greater reduction in retinal thickening in CSMT on OCT compared with the modified grid treatment (adjusted mean difference, 33 µm; 95% CI 5–61 µm; P = 0.02). Mean change in visual acuity was similar (0 and −2 letters, respectively, 95% CI −0.5 to 5 letters; P = 0.10) at 12 months.
Table 47.2 Modified-ETDRS focal/grid laser photocoagulation technique used by the Diabetic Retinopathy Clinical Research Network (DRCR.net)
| Treatment parameter | DRCR.net technique for modified-ETDRS focal/grid laser photocoagulation |
|---|---|
| Direct treatment | Directly treat all leaking microaneurysms in areas of retinal thickening between 500 and 3000 µm from the center of the macula (although may treat between 300 and 500 µm microns of center if center-involved edema persists after initial focal photocoagulation, but generally not if the visual acuity is better than 20/40) |
| Change in microaneurysm color with direct treatment | Not required, but at least a mild gray-white burn should be evident beneath all microaneurysms |
| Spot size for direct treatment | 50 µm |
| Burn duration for direct treatment | 0.05 to 0.1 seconds |
| Grid treatment | Apply to all areas with edema not associated with microaneurysms; if fluorescein angiography is obtained, grid is applied to areas of edema with angiographic non-perfusion when judged indicated by the investigator |
| Area considered for grid treatment | 500–3000 µm superiorly, nasally, and inferiorly from center of macula; 500–3500 µm temporally from macular center; no burns placed within 500 µm of disc |
| Burn size for grid treatment | 50 µm |
| Burn duration for grid treatment | 0.05 to 0.1 sec |
| Burn intensity for grid treatment | Barely visible (light gray) |
| Burn separation for grid treatment | Two visible burn widths apart |
| Wavelength (grid and direct treatment) | Green to yellow wavelengths |
Use of fluorescein angiography to direct the treatment is at the discretion of the physician. Laser treatment following an injection, if needed, is based on the preinjection macular appearance. Any laser wavelength for photocoagulation within the green to yellow spectrum may be chosen.* Lenses used for treatment cannot increase or reduce the burn size by more than 10%.
* The DRCR.net provides separate guidelines for the PASCAL photocoagulation system.
(Adapted with permission. Modified-ETDRS Focal Photocoagulation Technique accessed at http://publicfiles.jaeb.org/drcrnet/Misc/FocalGridProcedure42711.pdf.)
The benefits of focal/grid laser photocoagulation have been highlighted by more recent clinical trials following the ETDRS. Many of the eyes treated in the ETDRS had good visual acuity at baseline, limiting the amount of potential vision gain from any intervention; accordingly, the efficacy of laser in the treated ETDRS cohort as a whole consisted chiefly of a reduction of vision loss. However, in an ETDRS subgroup of 114 eyes with thickening of the foveal center, visual acuity worse than 20/32, and mild or moderate NPDR treated with immediate focal/grid laser photocoagulation in the ETDRS, change in mean visual acuity from baseline at two years was +4 letters, with 29% of eyes improving 10 letters or more. By comparison, in a subset of 235 eyes meeting the same baseline criteria for which laser was deferred, change in mean visual acuity from baseline at two years was −6 letters, with 12% improving 10 letters or more (Ferris FL, unpublished data, 2008). Recent trials enrolling eyes with more advanced disease corroborate the suggestion that the benefits of focal/grid laser photocoagulation may exceed those demonstrated in the treated ETRS cohort as a whole. In the previously mentioned study comparing focal/grid laser photocoagulation to injection of intravitreous triamcinolone, which enrolled 840 eyes with visual acuity of 20/40 to 20/320 with retinal thickening involving the center of the fovea and a range of underlying diabetic retinopathy, the 330 eyes randomly assigned to laser treatment showed a change in mean visual acuity of +1 letter (standard deviation, ±17 letters) at 2 years, with improvement of 15 letters or more in 18% of laser-treated eyes.151 In another recent study comparing focal/grid laser photocoagulation alone to intravitreous injection of ranibizumab or triamcinolone acetonide combined with laser treatment in eyes with center-involved DME and baseline visual acuity of 20/32 to 20/320, the change in mean visual acuity at 2 years was +3 letters (standard deviation, ±15 letters) in 211 eyes treated with focal/grid laser photocoagulation alone.169
Although focal/grid laser photocoagulation mitigates the morbidity of DME, it is often insufficient to restore normal vision or completely resolve macular edema. Requirement for multiple treatments is common. Even with retreatment, a significant proportion of eyes continue to manifest residual DME. In the aforementioned DRCR.net trial testing focal/grid laser photocoagulation alone versus intravitreous injection of ranibizumab or triamcinolone acetonide plus laser, eyes treated with laser alone manifested a median CSMT of 266 µm at 2 years, representing a median improvement of 113 µm.169 However, this represents an appreciable amount of residual thickening compared with normal CSMT (approximately 200 µm). Only 39% of eyes in the laser group achieved a CSMT of less than 250 µm with at least a 25 µm decrease in thickness from baseline. Ten percent of eyes treated with laser alone lost 15 or more letters of visual acuity at 2 years from baseline.
Pharmacotherapy with vascular endothelial growth factor (VEGF) antagonists
VEGF-A has been demonstrated to exert potent effects on retinal vascular permeability, and concentrations of certain VEGF-A isoforms in the retina and vitreous are elevated in diabetic retinopathy.40,41,170 Various VEGF antagonists have been developed for ophthalmic and nonophthalmic uses, including bevacizumab, a humanized murine monoclonal antibody binding VEGF-A; ranibizumab, a humanized murine monoclonal antibody fragment, also binding VEGF-A; pegaptanib sodium, an aptamer specifically inhibiting the VEGF-A 165 isoform; and aflibercept, a human fusion protein incorporating ligand-binding elements from VEGF receptors and the Fc region of an IgG1 molecule. Intravenous administration for ophthalmic disease has been studied for some agents,171–173 but intravitreous injection has rapidly become the most common mode of delivery to the eye following seminal clinical trials in neovascular age-related macular degeneration and recent clinical experience demonstrating a reasonable safety profile. Following demonstration of efficacy in neovascular age-related macular degeneration, choroidal neovascularization from other causes, and macular edema following retinal vein occlusion, various VEGF antagonists have been evaluated for treatment of DME in a number of small studies with short-term follow-up.174–180 Encouraging results have led to several larger clinical trials.
The first major clinical trial to report results was designed by DRCR.net investigators to compare four strategies for treatment of DME including focal/grid laser photocoagulation alone, intravitreous injection of ranibizumab (0.5 mg) with deferral of early laser, intravitreous injection of ranibizumab (0.5 mg) with early laser, and intravitreous injection of triamcinolone acetonide (4 mg) with early laser.153,169 A total of 854 eyes of 691 participants with DME involving the center of the fovea and visual acuity of 20/32 to 20/320 were randomly assigned to one of four treatments. The main outcome measure, best-corrected visual acuity, was evaluated at one year, with follow-up planned for 3 years. Eyes in a prompt laser plus sham injection group received modified-ETDRS focal/grid laser photocoagulation within 3–10 days following sham injection. Those in a ranibizumab plus prompt laser group were given an intravitreous injection of ranibizumab followed by focal/grid laser photocoagulation within 3–10 days. Those in a ranibizumab and deferred laser group received intravitreous injection of ranibizumab as required by protocol without any laser treatment for at least 24 weeks. Finally, those in a triamcinolone plus prompt laser were given an intravitreous injection of a preservative-free formulation of triamcinolone acetonide followed by focal/grid laser photocoagulation within 3–10 days. Retreatment algorithms were complex, but were generally intended to require further therapy in eyes with residual disease in order to maximize treatment effects in the first year. Focal/grid laser photocoagulation was repeated as often as every 13 weeks, ranibizumab was readministered as frequently as every 4 weeks, and triamcinolone acetonide was reinjected as often as every 16 weeks. At one year, mean change in visual acuity was significantly better in the ranibizumab plus prompt laser (+9 letters) and ranibizumab and deferred laser (+9 letters) groups compared with the prompt laser plus sham injection group (+3 letters; both P <0.001). Mean change in visual acuity was not significantly different from the prompt laser plus sham injection group in the triamcinolone plus prompt laser group (+4 letters; P = 0.31). Results at 2 years were similar (Fig. 47.14). Median number of injections in the first year was 8 in the ranibizumab plus prompt laser group, 9 in the ranibizumab and deferred laser group, and 3 in the triamcinolone plus prompt laser group. Median number of laser treatments in the first year in these groups was 2, 0, and 2, respectively, compared with 3 in the prompt laser plus sham injection group. Median number of injections in the second year in these groups decreased to 2, 3, and 1, respectively. There were 3 cases of postinjection endophthalmitis among 3973 ranibizumab injections (0.08%; 95% CI 0.02–0.22%), and 1 case of progression of pre-existing tractional retinal detachment in the ranibizumab and deferred laser group. There were no significant differences in rates of systemic adverse events between groups, and specifically no increase in cardiovascular or cerebrovascular events in the ranibizumab groups.
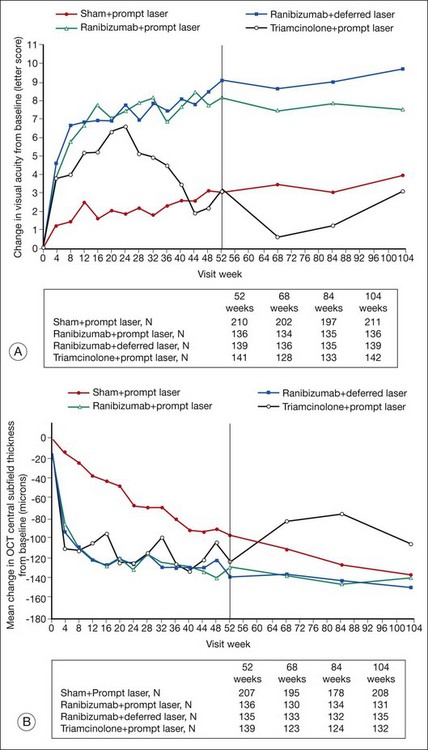
The results of this study have established a role for ranibizumab in treatment of DME, and have already been supplemented by findings from other trials, including one-year results of a small randomized controlled trial evaluating use of intravitreous bevacizumab.181–183 The RESTORE study randomly assigned 345 participants with DME and visual acuity of 20/32 to 20/160 to intravitreous injection of ranibizumab (0.5 mg) and sham laser, injection of ranibizumab (0.5 mg) and focal/grid laser photocoagulation, or sham injection and focal/grid laser photocoagulation.182 Participants received ranibizumab or sham injections monthly for 3 months, then as needed according to retreatment criteria; participants received laser photocoagulation at baseline and then as needed as often as every 3 months at the discretion of investigators. At 12 months, the mean change in visual acuity in the group getting ranibizumab alone (+6.1 letters) and in the group getting ranibizumab plus laser (+5.9 letters) was significantly better compared with the group getting laser alone (+0.8 letters; both P <0.0001). The BOLT study randomly assigned 80 eyes of 80 participants with DME involving the foveal center and visual acuity of 20/40 to 20/200 to intravitreous injection of bevacizumab (1.25 mg) or modified-ETDRS focal/grid laser photocoagulation.183 Participants getting bevacizumab received three injections spaced apart by 6 weeks each, followed by repeat injections every 6 weeks as needed according to retreatment criteria. Participants getting laser treatment received focal/grid laser photocoagulation at baseline and as often as every 4 months thereafter as needed based on ETDRS guidelines. At 12 months, the mean change in visual acuity was significantly better in bevacizumab group (+5.6 letters) than in the laser group (−4.6 letters; P = 0.0006). The results from these studies should soon be supplemented by longer-term follow-up data and findings from other large clinical trials presently underway.
Pharmacotherapy with corticosteroids
Corticosteroids have immune modulatory and antiangiogenic properties and have been utilized for treatment of ophthalmic disease since the 1950s.184–189 Common adverse effects, including hyperglycemia and other metabolic alterations difficult to manage in the setting of DM, limit their long-term systemic use, but a number of formulations allowing local delivery to the eye have been developed. The poor intraocular penetration of existing topical preparations makes them unsuitable for treatment of most retinal diseases, but injectable corticosteroids and sustained-release formulations for intraocular use have been evaluated for efficacy in DME.
Our most definitive knowledge about intravitreous injection of triamcinolone acetonide for treatment of DME comes from two randomized controlled clinical trials conducted by the DRCR.net.151,152,153,169 The first study enrolled 840 eyes of 693 participants with DME involving the foveal center and visual acuity of 20/32 to 20/320, with a primary outcome measure of mean change in best-corrected visual acuity at two years.151,152 Eyes were randomly assigned to receive modified-ETDRS focal/grid laser photocoagulation, intravitreous injection of triamcinolone acetonide (1 mg), or intravitreous injection of triamcinolone acetonide (4 mg), both corticosteroid arms utilizing a preservative-free formulation of the drug. Persistent or new macular edema was retreated every 4 months. Mean change in visual acuity at two years was significantly better in laser-treated eyes (+1 letter) than in eyes receiving 1 mg triamcinolone (−2 letters; P = 0.02) and likewise significantly better than in eyes receiving 4 mg triamcinolone (−3 letters; P = 0.002). The mean number of treatments over two years was 2.9 in the laser group, 3.5 in the 1 mg triamcinolone group, and 3.1 in the 4 mg triamcinolone group. Corticosteroids are well-known to promote cataract and to elevate intraocular pressure in some eyes, and such effects were carefully documented in this study. Cataract surgery was performed in 13% of eyes in the laser group, 23% of eyes in the 1 mg triamcinolone group, and 51% of eyes in the 4 mg triamcinolone group by two years. Intraocular pressure elevation of 10 mmHg or more from baseline at any study visit was noted in 4, 16, and 33% of eyes in the three groups, respectively, by two years. There were no cases of endophthalmitis or inflammatory pseudoendophthalmitis among 1649 intravitreous injections. Addressing whether cataract formation obscured benefit of treatment of DME in eyes treated with corticosteroids, subgroup analysis of 145 eyes pseudophakic at baseline was performed and at two years showed mean change in visual acuity of +2 letters in the laser group, +2 letters in the 1 mg triamcinolone group, and −1 in the 4 mg triamcinolone group. Investigators judged that the superiority of focal/grid laser photocoagulation could not be explained solely by cataract progression in triamcinolone-injected groups. This conclusion was supported by data on change in retinal thickness. At 2 years, mean improvement in CSMT was significantly greater in the laser group (139 µm) compared with the 1 mg triamcinolone group (86 µm; P <0.001) and the 4 mg triamcinolone group (77 µm; P <0.001).
The other study, already discussed above in the section “Pharmacotherapy with VEGF antagonists,” compared a combination of intravitreous injection of preservative-free triamcinolone (4 mg) and focal/grid laser photocoagulation to three other strategies, including focal/grid laser photocoagulation alone, intravitreous injection of ranibizumab plus early focal/grid laser photocoagulation, and intravitreous injection of ranibizumab and deferral of early laser.153,169 At the primary endpoint of one year, mean change in visual acuity was not significantly different in the triamcinolone plus laser group (+4 letters) compared with the prompt laser plus sham injection group (+3 letters; P = 0.31). However, subgroup analysis of eyes pseudophakic at baseline showed a trend toward benefit in the triamcinolone plus laser group comparable to that seen in ranibizumab groups and superior to that seen in the laser group (Fig. 47.15). Investigators judged that cataract formation, cataract surgery, or both may have adversely impacted benefit of combination therapy with intravitreous injection of triamcinolone and focal/grid laser photocoagulation in phakic eyes. Taken together, the results of these two trials suggest that while monotherapy with intravitreous injection of triamcinolone acetonide is inferior to monotherapy with focal/grid laser photocoagulation, the combination of the two treatments in pseudophakic eyes might possibly be superior to laser alone.
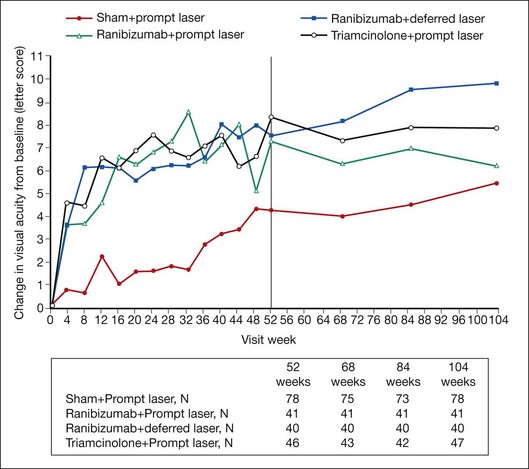
Sustained-release devices designed for intraocular delivery of fluocinolone acetonide and dexamethasone have been developed and tested for various ophthalmic applications, including treatment of DME. The first to achieve wide clinical use was the fluocinolone acetonide intravitreal implant (Retisert, Bausch & Lomb, Rochester, NY), consisting of a 0.59 mg pellet embedded in a nonbiodegradable scaffold designed to be implanted in the vitreous cavity via a sclerotomy and anchored by a suture to the eye wall. The Retisert, which releases drug at steady state between 0.3 and 0.4µg/day for approximately 30 months, has been used most commonly for treatment of chronic non-infectious posterior uveitis.190–193 Though small studies were initiated for treatment of DME, the requirement for incisional surgery and the high rates of cataract progression and intraocular pressure elevation associated with the device have limited its use for this indication.194
An intravitreous insert (Iluvien, Alimera Sciences, Alpharetta, GA) releasing stable quantities of fluocinolone acetonide for at least a year, consisting of a non-biodegradable cylinder (3.5×0.37 mm) containing the same polymer matrix as the Retisert implant and introduced into the vitreous cavity via injection by 25-gauge needle, was recently evaluated for treatment of DME in a large randomized controlled clinical trial.195 Statistically significant benefit was demonstrated at 2 years for inserts releasing 0.2 and 0.5µg/day compared with sham injection in a study design that involved use of “rescue” focal/grid laser photocoagulation for persistent macular edema in all three groups. Progression of cataract and elevation of intraocular pressure were common in eyes receiving steroid inserts. Visual gain in eyes receiving inserts was greater in those that were pseudophakic at baseline and similar in magnitude to benefit seen in eyes treated with intravitreous triamcinolone and prompt focal/grid laser photocoagulation in the DRCR.net trial.
A dexamethasone intravitreous implant (Ozurdex, Allergan, Irvine, CA) consisting of a biodegradable pellet releasing high levels of drug for approximately 60 days and delivered via surgical sclerotomy or 22-gauge needle-injector system has been evaluated in a randomized clinical trial for macular edema.196 Two versions, a 350 µg and 700 µg version, were tested for efficacy in 171 eyes with DME comprising a subgroup of a short-term larger study also enrolling eyes with macular edema secondary to branch and central retinal vein occlusion, uveitis, and cataract surgery. At the primary endpoint at 90 days, the percentage of eyes gaining 10 or more letters was significantly higher in the dexamethasone 700 µg microgram implant group than in the observation group (33% vs 12%; P = 0.007).
Vitrectomy
A number of small case series have reported benefit of vitrectomy in the setting of demonstrable vitreomacular traction and epiretinal proliferation in DME.197–200 Differences in patient populations, definition of clinically significant vitreoretinal traction, surgical approach, use of laser and medications as adjunct treatment, outcome measures, and follow-up, alongside the customary limitations and biases of retrospective studies, make it difficult to assess the efficacy of surgery. A noncontrolled prospective study representing one of the largest series published to date evaluated vitrectomy for 87 eyes with DME and evidence for vitreomacular traction as judged by the investigator.201 Intervention was nonstandardized, with vitrectomy variably accompanied by epiretinal membrane peeling, internal limiting membrane peeling, use of scatter laser, and injection of corticosteroids. At the primary endpoint at 6 months, visual acuity improved by 10 letters or more in 38% (95% CI 28–49%) and worsened by 10 letters or more in 22% (95% CI 13–31%). Adverse events included endophthalmitis in one eye, retinal detachment in 3 eyes, vitreous hemorrhage in 5 eyes, and elevated intraocular pressure necessitating treatment in 7 eyes.
Results of case series evaluating vitrectomy for DME even in the absence of any visible vitreoretinal traction have been mixed, with some reports suggesting efficacy and others not.202–210 Two very small randomized trials showed no evidence for significant benefit.211,212 In the absence of any data from large, well-designed clinical trials, efficacy remains uncertain at best, and, weighed against well-known risks of surgery, does not typically warrant vitrectomy for this indication alone. The possibility of benefit is presently most relevant to surgical decision-making in PDR, in which treatment of DME is undertaken simultaneously with surgical management of fibrovascular proliferation, vitreous hemorrhage, and retinal detachment. The role for surgery in management of PDR is discussed in Chapter 111 (Surgery for proliferative diabetic retinopathy).
Ocular treatment for nonproliferative diabetic retinopathy
Various local therapies have been evaluated for their effects on altering the course of NPDR. The efficacy of scatter laser photocoagulation for reduction of severe vision loss among eyes with advanced retinopathy (severe NPDR and PDR) was established in the Diabetic Retinopathy Study.213 The ETDRS was designed partly to clarify the optimal point during the course of retinopathy for administration of scatter laser photocoagulation. In the ETDRS, eyes were randomly assigned to early laser photocoagulation or deferral of laser treatment. Eyes were categorized according to presence or absence of macular edema and according to severity of retinopathy, and further randomly assigned to various laser strategies in a complex study design. In addition to testing the effects of focal/grid laser photocoagulation for macular edema, the ETDRS also evaluated the effects of immediate “mild” and “full” scatter photocoagulation in eyes with more severe retinopathy (severe NPDR and non-high-risk PDR) with and without macular edema and delayed mild and full scatter photocoagulation in eyes with less severe retinopathy and macular edema. At 5 years, the rate of severe vision loss (defined as visual acuity less than 5/200 at two consecutive visits) was low in eyes receiving early laser treatment (2.6%) and in those with deferral of laser (3.7%) (Fig. 47.16).103 Rates of severe vision loss in the subset of eyes with mild or moderate NPDR were even lower. On the basis of these findings, ETDRS investigators recommended against scatter laser photocoagulation for mild and moderate NPDR, provided that adequate follow-up could be anticipated. They suggested consideration of scatter laser photocoagulation for severe NPDR and non-high risk PDR, with potential benefit balanced against adverse effects of laser on visual acuity and visual fields. The use of scatter laser photocoagulation in diabetic retinopathy is further discussed in Chapter 48 (Proliferative diabetic retinopathy).
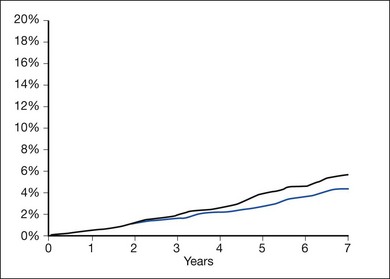
There is preliminary evidence suggesting that local administration of VEGF antagonists or corticosteroids for treatment of DME may also benefit the course of NPDR. In the aforementioned DRCR.net study comparing various strategies of focal/grid laser photocoagulation and intravitreous administration of ranibizumab or triamcinolone acetonide combined with laser for treatment of DME, ranibizumab- and triamcinolone-treated eyes appeared less likely to exhibit progression of retinopathy and more likely to exhibit improvement of retinopathy than eyes treated with focal/grid laser photocoagulation alone, as assessed by reading-center evaluation of fundus photographs taken at baseline and one year.153,169 The trend in most subgroups was not statistically significant. Ranibizumab- and triamcinolone-treated eyes were significantly less likely to manifest vitreous hemorrhage or receive scatter laser photocoagulation during the first year than eyes treated with focal/grid laser photocoagulation alone. A similar exploratory analysis was performed on data from the DRCR.net study comparing focal/grid laser photocoagulation to intravitreous injection of triamcinolone acetonide (1 mg or 4 mg), with worsening of retinopathy defined as a composite measure including evidence of progression on fundus photographs evaluated by a reading center, any documentation of vitreous hemorrhage, or receipt of scatter laser photocoagulation.214 At 2 years, the cumulative probability of retinopathy progression was significantly lower in the 4 mg triamcinolone group (21%) but not in the 1 mg triamcinolone group (29%) compared with the laser group (31%; P = 0.005 and P = 0.64, respectively). Such preliminary findings are intriguing, but merit more definitive investigation to characterize any benefit and its clinical significance.
Other systemic treatment for nonproliferative diabetic retinopathy
Antiplatelet agents have been evaluated for treatment of diabetic retinopathy in a few randomized controlled clinical trials. In a 3-year study, 475 participants with early retinopathy were randomly assigned to daily aspirin, aspirin plus dipyridamole, or placebo, and progression of retinopathy was measured as the change in the number of microaneurysms visualized on FA.215 The annual increase in macroaneurysms was significantly greater in the placebo group than in the treatment groups, but the growth rate was low (less than two microaneurysm per year) in all groups. In an analogous 3-year study involving 435 participants randomly assigned to daily ticlopidine or placebo, the annual increase in microaneurysms was greater in the placebo group than in the treatment group in an analysis that showed low appearance rates and borderline statistical significance.216 Neither study showed a change in severity level of retinopathy, and the clinical significance of differences in microaneurysm counts remains uncertain.
The most definitive evidence for effects of antiplatelet therapy comes from the ETDRS, in which 3711 participants were randomly assigned to aspirin (650 mg per day) or placebo. Eyes assigned to deferral of laser photocoagulation were assessed for the effects of aspirin on progression of diabetic retinopathy. Aspirin use did not affect the severity of retinopathy or the risk of visual loss over 7 years.217 Aspirin use did not increase the incidence, severity, or duration of preretinal or vitreous hemorrhage in eyes with deferral of photocoagulation or in eyes randomly assigned to early laser treatment.217,218 Participants randomly assigned to aspirin exhibited a 17% reduction in morbidity and mortality from cardiovascular disease compared with participants receiving placebo, corroborating benefits seen in other studies. Aspirin remains an important therapy for control of cardiovascular risk in many diabetics, and no level of retinopathy severity, including PDR, should contraindicate its use. The ETDRS results apply to persons with significant diabetic retinopathy, and some uncertainty remains about any effects of antiplatelet agents in very mild NPDR.
Sorbinil, an inhibitor of the enzyme aldose reductase, which catalyzes the conversion of glucose to sorbitol, was evaluated in a randomized controlled clinical trial following animal studies, suggesting that these drugs might slow the development of diabetic retinopathy.7,11,12 The Sorbinil Retinopathy Trial randomized 497 participants with type 1 DM and mild or no retinopathy to sorbinil or placebo.219 The percentage of participants showing significant progression of diabetic retinopathy, defined as a two-step or greater change in the ETDRS diabetic retinopathy severity scale on fundus photographs, was not significantly different between the two groups after 3–4 years of follow-up.
Inhibitors targeting the protein kinase C family, which is implicated in VEGF-mediated vasopermeability and endothelin-mediated vasoconstriction in animal models of diabetic retinopathy,220–223 have been developed and evaluated for effects on diabetic retinopathy. Ruboxistaurin, an inhibitor of beta-isoforms of protein kinase C, has been evaluated in two randomized controlled clinical trials. In the first, which randomly assigned 252 participants with moderate to very severe NPDR to receive ruboxistaurin or placebo for 36–46 months, rates of retinopathy progression were not significantly different between groups, but participants taking ruboxistaurin (32 mg/day) showed a significant delay in time to moderate vision loss (doubling of the visual angle) compared with those taking placebo (P = 0.038).224 In a second larger study, 685 participants with moderate to very severe NPDR were randomly assigned to ruboxistaurin or placebo and evaluated at 3 years for rates of sustained moderate vision loss, defined as decrease in ETDRS visual acuity score of 15 letters or more (doubling of the visual angle) for 6 months or longer.225 The rate of sustained moderate vision loss was significantly lower in the ruboxistaurin group (5.5%) than in the placebo group (9.1%), representing a 40% risk reduction (P = 0.034). Focal/grid laser photocoagulation was initiated 26% less frequently among those treated with ruboxistaurin than among those receiving placebo (P = 0.008). There was no significant difference between rates of retinopathy progression between the two groups. Despite intriguing results, further clinical testing necessary for regulatory approval in the United States and in Europe has not been pursued and the drug remains unavailable.
Fenofibrate, a peroxisome proliferator-activated receptor (PPAR) alpha agonist, has been evaluated for efficacy in treatment of diabetic retinopathy in combination with statin therapy as a plasma lipid-modulating agent capable of lowering triglyceride levels and raising high-density lipoprotein (HDL) cholesterol levels. Two randomized controlled clinical trials have suggested benefit of fenofibrate for diabetic retinopathy. The Fenofibrate Intervention and Event Lowering in Diabetes (FIELD) study was a large trial randomizing 9795 participants with type 2 DM to fenofibrate (200 mg/day) or placebo.84 The cumulative percentage of participants receiving initiation of laser treatment for retinopathy (including focal/grid and scatter laser photocoagulation), a prespecified tertiary endpoint in the main study, was significantly lower in the fenofibrate group (3.4%) than in the placebo group (4.9%; hazard ratio, 0.69; 95% CI 0.56–0.84; P = 0.0002) over six years. Progression by two steps or greater on an adapted ETDRS diabetic retinopathy severity scale, the primary endpoint of a substudy involving analysis of two-field 45-degree fundus photographs for 1012 participants, did not differ significantly between fenofibrate and placebo groups. Investigators commented on a significantly higher rate of retinopathy progression in the placebo group compared with the fenofibrate group among participants with retinopathy at baseline, but the number of incident cases was small in both groups. The ACCORD study, discussed above, was a complex trial that included a lipid study randomizing 5518 participants with type 2 DM and dyslipidemia to receive simvastatin plus fenofibrate (160 mg/day) or simvastatin plus placebo. In the lipid study 1593 participants were evaluated for effects of fenofibrate on retinopathy.78 At 4 years, the rate of progression of retinopathy, defined as a composite measure of three-step or greater progression on the ETDRS diabetic retinopathy severity scale or worsening requiring laser photocoagulation or vitrectomy, was significantly lower in the fenofibrate group (6.5%) compared with the placebo group (10.2%; adjusted odds ratio 0.60; 95% CI 0.42–0.87; P = 0.006).
Conclusion
Diabetic retinopathy is a leading cause of vision loss in working-age Americans and a significant cause of blindness worldwide.226,227 Its impact is expected to grow in the setting of profound increases in prevalence of DM projected in coming decades. At the present time, one in 10 American adults has DM. The Centers for Disease Control and Prevention predict prevalence among Americans will increase to between one in 5 and one in 3 by 2050.71,228 The International Diabetes Federation estimates that as many as 438 million people worldwide will have DM in 2030, an increase from the approximately 285 million people estimated to have the disease in 2010.228
1 Cogan DG, Toussaint D, Kuwabara T. Retinal vascular patterns. IV. Diabetic retinopathy. Arch Ophthalmol. 1961;66:366–378.
2 Cogan DG, Kuwabara T. Capillary shunts in the pathogenesis of diabetic retinopathy. Diabetes. 1963;12:293–300.
3 Kuwabara T, Cogan DG. Retinal vascular patterns. VI. Mural cells of the retinal capillaries. Arch Ophthalmol. 1963;69:492–502.
4 Toussaint D, Dustin P. Electron microscopy of normal and diabetic retinal capillaries. Arch Ophthalmol. 1963;70:96–108.
5 Speiser P, Gittelsohn AM, Patz A. Studies on diabetic retinopathy. 3. Influence of diabetes on intramural pericytes. Arch Ophthalmol. 1968;80:332–337.
6 Babel J, Leuenberger P. A long term study on the ocular lesions in streptozotocin diabetic rats. Albrecht Von Graefes Arch Klin Exp Ophthalmol. 1974;189:191–209.
7 Robison WG, Jr., Kador PF, Kinoshita JH. Retinal capillaries: basement membrane thickening by galactosemia prevented with aldose reductase inhibitor. Science. 1983;221:1177–1179.
8 Sima AA, Garcia-Salinas R, Basu PK. The BB Wistar rat: an experimental model for the study of diabetic retinopathy. Metabolism. 1983;32:136–140.
9 Engerman RL, Kern TS. Experimental galactosemia produces diabetic-like retinopathy. Diabetes. 1984;33:97–100.
10 Kozak WM, Marker NA, Elmer KK. Effects of aldose reductase inhibition on the retina and health indices of streptozotocin-diabetic rats. Doc Ophthalmol. 1986;64:355–377.
11 Kador PF, Akagi Y, Terubayashi H, et al. Prevention of pericyte ghost formation in retinal capillaries of galactose-fed dogs by aldose reductase inhibitors. Arch Ophthalmol. 1988;106:1099–1102.
12 Kador PF, Akagi Y, Takahashi Y, et al. Prevention of retinal vessel changes associated with diabetic retinopathy in galactose-fed dogs by aldose reductase inhibitors. Arch Ophthalmol. 1990;108:1301–1309.
13 Takahashi Y, Wyman M, Ferris F, 3rd., et al. Diabeteslike preproliferative retinal changes in galactose-fed dogs. Arch Ophthalmol. 1992;110:1295–1302.
14 Kern TS, Engerman RL. Comparison of retinal lesions in alloxan-diabetic rats and galactose-fed rats. Curr Eye Res. 1994;13:863–867.
15 Engerman RL, Kern TS. Retinopathy in animal models of diabetes. Diabetes Metab Rev. 1995;11:109–120.
16 Kador PF, Takahashi Y, Wyman M, et al. Diabeteslike proliferative retinal changes in galactose-fed dogs. Arch Ophthalmol. 1995;113:352–354.
17 Kern TS, Engerman RL. Galactose-induced retinal microangiopathy in rats. Invest Ophthalmol Vis Sci. 1995;36:490–496.
18 Robison WG, Jr. Diabetic retinopathy: galactose-fed rat model. Invest Ophthalmol Vis Sci. 1995;36:1743–1744. 4A
19 Kobayashi T, Kubo E, Takahashi Y, et al. Retinal vessel changes in galactose-fed dogs. Arch Ophthalmol. 1998;116:785–789.
20 Kador PF, Takahashi Y, Akagi Y, et al. Age-dependent retinal capillary pericyte degeneration in galactose-fed dogs. J Ocul Pharmacol Ther. 2007;23:63–69.
21 Roy S, Ha J, Trudeau K, et al. Vascular basement membrane thickening in diabetic retinopathy. Curr Eye Res. 2010;35:1045–1056.
22 Barber AJ. A new view of diabetic retinopathy: a neurodegenerative disease of the eye. Prog Neuropsychopharmacol Biol Psychiatry. 2003;27:283–290.
23 Barber AJ, Lieth E, Khin SA, et al. Neural apoptosis in the retina during experimental and human diabetes. Early onset and effect of insulin. J Clin Invest. 1998;102:783–791.
24 Lieth E, Barber AJ, Xu B, et al. Glial reactivity and impaired glutamate metabolism in short-term experimental diabetic retinopathy. Penn State Retina Research Group. Diabetes. 1998;47:815–820.
25 Lieth E, Gardner TW, Barber AJ, et al. Retinal neurodegeneration: early pathology in diabetes. Clin Experiment Ophthalmol. 2000;28:3–8.
26 Martin PM, Roon P, Van Ells TK, et al. Death of retinal neurons in streptozotocin-induced diabetic mice. Invest Ophthalmol Vis Sci. 2004;45:3330–3336.
27 Mizutani M, Gerhardinger C, Lorenzi M. Muller cell changes in human diabetic retinopathy. Diabetes. 1998;47:445–449.
28 Whitmire W, Al-Gayyar MM, Abdelsaid M, et al. Alteration of growth factors and neuronal death in diabetic retinopathy: what we have learned so far. Mol Vis. 2011;17:300–308.
29 Della Sala S, Bertoni G, Somazzi L, et al. Impaired contrast sensitivity in diabetic patients with and without retinopathy: a new technique for rapid assessment. Br J Ophthalmol. 1985;69:136–142.
30 Greenstein V, Sarter B, Hood D, et al. Hue discrimination and S cone pathway sensitivity in early diabetic retinopathy. Invest Ophthalmol Vis Sci. 1990;31:1008–1014.
31 Kurtenbach A, Wagner U, Neu A, et al. Brightness matching and colour discrimination in young diabetics without retinopathy. Vision Res. 1994;34:115–122.
32 Sokol S, Moskowitz A, Skarf B, et al. Contrast sensitivity in diabetics with and without background retinopathy. Arch Ophthalmol. 1985;103:51–54.
33 Tregear SJ, Knowles PJ, Ripley LG, et al. Chromatic-contrast threshold impairment in diabetes. Eye (Lond). 1997;11(Pt 4):537–546.
34 Trick GL, Burde RM, Gordon MO, et al. The relationship between hue discrimination and contrast sensitivity deficits in patients with diabetes mellitus. Ophthalmology. 1988;95:693–698.
35 Klein R, Meuer SM, Moss SE, et al. The relationship of retinal microaneurysm counts to the 4-year progression of diabetic retinopathy. Arch Ophthalmol. 1989;107:1780–1785.
36 Klein R, Meuer SM, Moss SE, et al. Retinal microaneurysm counts and 10-year progression of diabetic retinopathy. Arch Ophthalmol. 1995;113:1386–1391.
37 Kohner EM, Sleightholm M. Does microaneurysm count reflect severity of early diabetic retinopathy? Ophthalmology. 1986;93:586–589.
38 Early Treatment Diabetic Retinopathy Study Research Group. Photocoagulation for diabetic macular edema. Early Treatment Diabetic Retinopathy Study report number 1. Arch Ophthalmol. 1985;103:1796–1806.
39 Kohner EM, Henkind P. Correlation of fluorescein angiogram and retinal digest in diabetic retinopathy. Am J Ophthalmol. 1970;69:403–414.
40 Adamis AP, Miller JW, Bernal MT, et al. Increased vascular endothelial growth factor levels in the vitreous of eyes with proliferative diabetic retinopathy. Am J Ophthalmol. 1994;118:445–450.
41 Aiello LP, Avery RL, Arrigg PG, et al. Vascular endothelial growth factor in ocular fluid of patients with diabetic retinopathy and other retinal disorders. N Engl J Med. 1994;331:1480–1487.
42 Aiello LP, Northrup JM, Keyt BA, et al. Hypoxic regulation of vascular endothelial growth factor in retinal cells. Arch Ophthalmol. 1995;113:1538–1544.
43 Miller JW, Adamis AP, Shima DT, et al. Vascular endothelial growth factor/vascular permeability factor is temporally and spatially correlated with ocular angiogenesis in a primate model. Am J Pathol. 1994;145:574–584.
44 Pe’er J, Shweiki D, Itin A, et al. Hypoxia-induced expression of vascular endothelial growth factor by retinal cells is a common factor in neovascularizing ocular diseases. Lab Invest. 1995;72:638–645.
45 Shweiki D, Itin A, Soffer D, et al. Vascular endothelial growth factor induced by hypoxia may mediate hypoxia-initiated angiogenesis. Nature. 1992;359:843–845.
46 Adamis AP, Shima DT, Tolentino MJ, et al. Inhibition of vascular endothelial growth factor prevents retinal ischemia-associated iris neovascularization in a nonhuman primate. Arch Ophthalmol. 1996;114:66–71.
47 Robinson GS, Pierce EA, Rook SL, et al. Oligodeoxynucleotides inhibit retinal neovascularization in a murine model of proliferative retinopathy. Proc Natl Acad Sci U S A. 1996;93:4851–4856.
48 Fraser-Bell S, Ying-Lai M, Klein R, et al. Prevalence and associations of epiretinal membranes in Latinos: the Los Angeles Latino Eye Study. Invest Ophthalmol Vis Sci. 2004;45:1732–1736.
49 Kawasaki R, Wang JJ, Sato H, et al. Prevalence and associations of epiretinal membranes in an adult Japanese population: the Funagata study. Eye (Lond). 2009;23:1045–1051.
50 Klein R, Klein BE, Wang Q, et al. The epidemiology of epiretinal membranes. Trans Am Ophthalmol Soc. 1994;92:403–425. discussion 25–30
51 Mitchell P, Smith W, Chey T, et al. Prevalence and associations of epiretinal membranes. The Blue Mountains Eye Study, Australia. Ophthalmology. 1997;104:1033–1040.
52 Ng CH, Cheung N, Wang JJ, et al. Prevalence and risk factors for epiretinal membranes in a multi-ethnic United States population. Ophthalmology. 2011;118:694–699.
53 Sebag J. Anomalous posterior vitreous detachment: a unifying concept in vitreo-retinal disease. Graefes Arch Clin Exp Ophthalmol. 2004;242:690–698.
54 Barile GR, Pachydaki SI, Tari SR, et al. The RAGE axis in early diabetic retinopathy. Invest Ophthalmol Vis Sci. 2005;46:2916–2924.
55 Gao BB, Chen X, Timothy N, et al. Characterization of the vitreous proteome in diabetes without diabetic retinopathy and diabetes with proliferative diabetic retinopathy. J Proteome Res. 2008;7:2516–2525.
56 Kim T, Kim SJ, Kim K, et al. Profiling of vitreous proteomes from proliferative diabetic retinopathy and nondiabetic patients. Proteomics. 2007;7:4203–4215.
57 Sebag J, Buckingham B, Charles MA, et al. Biochemical abnormalities in vitreous of humans with proliferative diabetic retinopathy. Arch Ophthalmol. 1992;110:1472–1476.
58 Shitama T, Hayashi H, Noge S, et al. Proteome profiling of vitreoretinal diseases by cluster analysis. Proteomics Clin Appl. 2008;2:1265–1280.
59 Holekamp NM. The vitreous gel: more than meets the eye. Am J Ophthalmol. 2010;149:32–36.
60 Shui YB, Holekamp NM, Kramer BC, et al. The gel state of the vitreous and ascorbate-dependent oxygen consumption: relationship to the etiology of nuclear cataracts. Arch Ophthalmol. 2009;127:475–482.
61 Chen MS, Kao CS, Chang CJ, et al. Prevalence and risk factors of diabetic retinopathy among noninsulin-dependent diabetic subjects. Am J Ophthalmol. 1992;114:723–730.
62 Cikamatana L, Mitchell P, Rochtchina E, et al. Five-year incidence and progression of diabetic retinopathy in a defined older population: the Blue Mountains Eye Study. Eye (Lond). 2007;21:465–471.
63 Klein R, Klein BE, Moss SE, et al. The Wisconsin Epidemiologic Study of diabetic retinopathy. XIV. Ten-year incidence and progression of diabetic retinopathy. Arch Ophthalmol. 1994;112:1217–1228.
64 Klein R, Klein BE, Moss SE, et al. The Wisconsin Epidemiologic Study of diabetic retinopathy. III. Prevalence and risk of diabetic retinopathy when age at diagnosis is 30 or more years. Arch Ophthalmol. 1984;102:527–532.
65 Klein R, Klein BE, Moss SE, et al. The Wisconsin Epidemiologic Sstudy of diabetic retinopathy. II. Prevalence and risk of diabetic retinopathy when age at diagnosis is less than 30 years. Arch Ophthalmol. 1984;102:520–526.
66 Leske MC, Wu SY, Hennis A, et al. Hyperglycemia, blood pressure, and the 9-year incidence of diabetic retinopathy: the Barbados Eye Studies. Ophthalmology. 2005;112:799–805.
67 Svensson M, Eriksson JW, Dahlquist G. Early glycemic control, age at onset, and development of microvascular complications in childhood-onset type 1 diabetes: a population-based study in northern Sweden. Diabetes Care. 2004;27:955–962.
68 Varma R, Choudhury F, Klein R, et al. Four-year incidence and progression of diabetic retinopathy and macular edema: the Los Angeles Latino Eye Study. Am J Ophthalmol. 2010;149:752–761. 3
69 Wong TY, Cheung N, Tay WT, et al. Prevalence and risk factors for diabetic retinopathy: the Singapore Malay Eye Study. Ophthalmology. 2008;115:1869–1875.
70 Zhang X, Saaddine JB, Chou CF, et al. Prevalence of diabetic retinopathy in the United States, 2005–2008. JAMA. 2010;304:649–656.
71 Centers for Disease Control and Prevention. [Internet]. Atlanta, GA: CDC [update 2011 May 23; cited 2012 Feb 2]. National Diabetes Fact Sheet: Diagnosed and undiagnosed diabetes in the United States, all ages http://www.cdc.gov/diabetes/pubs/estimates11.htm#1, 2010. Available from
72 The Diabetes Control and Complications Trial Research Group. The effect of intensive treatment of diabetes on the development and progression of long-term complications in insulin-dependent diabetes mellitus. N Engl J Med. 1993;329:977–986.
73 Diabetes Control and Complications Trial Research Group. The relationship of glycemic exposure (HbA1c) to the risk of development and progression of retinopathy in the diabetes control and complications trial. Diabetes. 1995;44:968–983.
74 UK Prospective Diabetes Study (UKPDS) Group. Intensive blood-glucose control with sulphonylureas or insulin compared with conventional treatment and risk of complications in patients with type 2 diabetes (UKPDS 33). Lancet. 1998;352:837–853.
75 UK Prospective Diabetes Study (UKPDS) Group. Effect of intensive blood-glucose control with metformin on complications in overweight patients with type 2 diabetes (UKPDS 34). Lancet. 1998;352:854–865.
76 The Diabetes Control and Complications Trial/Epidemiology of Diabetes Intervention and Complications Study Research Group. Effect of intensive therapy on the microvascular complications of type 1 diabetes mellitus. JAMA. 2002;287:2563–2569.
77 Holman RR, Paul SK, Bethel MA, et al. 10-year follow-up of intensive glucose control in type 2 diabetes. N Engl J Med. 2008;359:1577–1589.
78 Chew EY, Ambrosius WT, Davis MD, et al. Effects of medical therapies on retinopathy progression in type 2 diabetes. N Engl J Med. 2010;363:233–244.
79 The effect of intensive diabetes treatment on the progression of diabetic retinopathy in insulin-dependent diabetes mellitus. The Diabetes Control and Complications Trial. Arch Ophthalmol. 1995;113:36–51.
80 UK Prospective Diabetes Study Group. Tight blood pressure control and risk of macrovascular and microvascular complications in type 2 diabetes: UKPDS 38. BMJ. 1998;317:703–713.
81 Klein BE, Moss SE, Klein R, et al. The Wisconsin Epidemiologic Study of Diabetic Retinopathy. XIII. Relationship of serum cholesterol to retinopathy and hard exudate. Ophthalmology. 1991;98:1261–1265.
82 Chew EY, Klein ML, Ferris FL, 3rd., et al. Association of elevated serum lipid levels with retinal hard exudate in diabetic retinopathy. Early Treatment Diabetic Retinopathy Study (ETDRS) Report 22. Arch Ophthalmol. 1996;114:1079–1084.
83 Davis MD, Fisher MR, Gangnon RE, et al. Risk factors for high-risk proliferative diabetic retinopathy and severe visual loss: Early Treatment Diabetic Retinopathy Study Report #18. Invest Ophthalmol Vis Sci. 1998;39:233–252.
84 Keech AC, Mitchell P, Summanen PA, et al. Effect of fenofibrate on the need for laser treatment for diabetic retinopathy (FIELD study): a randomised controlled trial. Lancet. 2007;370:1687–1697.
85 Janka HU, Warram JH, Rand LI, et al. Risk factors for progression of background retinopathy in long-standing IDDM. Diabetes. 1989;38:460–464.
86 Rand LI, Prud’homme GJ, Ederer F, et al. Factors influencing the development of visual loss in advanced diabetic retinopathy. Diabetic Retinopathy Study (DRS) Report No. 10. Invest Ophthalmol Vis Sci. 1985;26:983–991.
87 Berman DH, Friedman EA. Partial absorption of hard exudates in patients with diabetic end-stage renal disease and severe anemia after treatment with erythropoietin. Retina. 1994;14:1–5.
88 Qiao Q, Keinanen-Kiukaanniemi S, Laara E. The relationship between hemoglobin levels and diabetic retinopathy. J Clin Epidemiol. 1997;50:153–158.
89 Shorb SR. Anemia and diabetic retinopathy. Am J Ophthalmol. 1985;100:434–436.
90 Krolewski AS, Barzilay J, Warram JH, et al. Risk of early-onset proliferative retinopathy in IDDM is closely related to cardiovascular autonomic neuropathy. Diabetes. 1992;41:430–437.
91 Tesfaye S, Stevens LK, Stephenson JM, et al. Prevalence of diabetic peripheral neuropathy and its relation to glycaemic control and potential risk factors: the EURODIAB IDDM Complications Study. Diabetologia. 1996;39:1377–1384.
92 American Academy of Ophthalmology [homepage on the Internet]. San Francisco, CA: AAO; 2008 [cited 2012 Feb 2]. American Academy of Ophthalmology Retina Panel. Preferred Practice Pattern® guidelines. Diabetic retinopathy. Available from http://www.aao.org/ppp
93 Klein R, Klein BE, Neider MW, et al. Diabetic retinopathy as detected using ophthalmoscopy, a nonmydriatic camera and a standard fundus camera. Ophthalmology. 1985;92:485–491.
94 Yannuzzi LA, Rohrer KT, Tindel LJ, et al. Fluorescein angiography complication survey. Ophthalmology. 1986;93:611–617.
95 AK-FLUOR (fluorescein sodium) injection for intravenous use. Full prescribing information. Package insert. Revised 7/2008.
96 Diabetic Retinopathy Clinical Research Network [homepage on the Internet]. 2007–12 [cited 2012 Feb 2]. Available from http://drcrnet.jaeb.org/
97 Bressler NM, Edwards AR, Antoszyk AN, et al. Retinal thickness on Stratus optical coherence tomography in people with diabetes and minimal or no diabetic retinopathy. Am J Ophthalmol. 2008;145:894–901.
98 Krzystolik MG, Strauber SF, Aiello LP, et al. Reproducibility of macular thickness and volume using Zeiss optical coherence tomography in patients with diabetic macular edema. Ophthalmology. 2007;114:1520–1525.
99 Forooghian F, Cukras C, Meyerle CB, et al. Evaluation of time domain and spectral domain optical coherence tomography in the measurement of diabetic macular edema. Invest Ophthalmol Vis Sci. 2008;49:4290–4296.
100 Diabetic Retinopathy Study Research Group. A modification of the Airlie House classification of diabetic retinopathy. Report Number 7. Invest Ophthalmol Vis Sci. 1981;21:210–226.
101 Grading diabetic retinopathy from stereoscopic color fundus photographs – an extension of the modified Airlie House classification. ETDRS report number 10. Early Treatment Diabetic Retinopathy Study Research Group. Ophthalmology. 1991;98:786–806.
102 Fundus photographic risk factors for progression of diabetic retinopathy. ETDRS report number 12. Early Treatment Diabetic Retinopathy Study Research Group. Ophthalmology. 1991;98:823–833.
103 Early photocoagulation for diabetic retinopathy. ETDRS report number 9. Early Treatment Diabetic Retinopathy Study Research Group. Ophthalmology. 1991;98:766–785.
104 Klein R, Klein BE, Moss SE. How many steps of progression of diabetic retinopathy are meaningful? The Wisconsin Epidemiologic Study of diabetic retinopathy. Arch Ophthalmol. 2001;119:547–553.
105 Murphy RP. Management of diabetic retinopathy. Am Fam Physician. 1995;51:785–796.
106 Wilkinson CP, Ferris FL, 3rd., Klein RE, et al. Proposed international clinical diabetic retinopathy and diabetic macular edema disease severity scales. Ophthalmology. 2003;110:1677–1682.
107 Brown JC, Solomon SD, Bressler SB, et al. Detection of diabetic foveal edema: contact lens biomicroscopy compared with optical coherence tomography. Arch Ophthalmol. 2004;122:330–335.
108 Davis MD, Bressler SB, Aiello LP, et al. Comparison of time-domain OCT and fundus photographic assessments of retinal thickening in eyes with diabetic macular edema. Invest Ophthalmol Vis Sci. 2008;49:1745–1752.
109 Browning DJ, Glassman AR, Aiello LP, et al. Optical coherence tomography measurements and analysis methods in optical coherence tomography studies of diabetic macular edema. Ophthalmology. 2008;115:1366–1371. 71 e1
110 Fluorescein angiographic risk factors for progression of diabetic retinopathy. ETDRS report number 13. Early Treatment Diabetic Retinopathy Study Research Group. Ophthalmology. 1991;98:834–840.
111 Danis RP, Scott IU, Qin H, et al. Association of fluorescein angiographic features with visual acuity and with optical coherence tomographic and stereoscopic color fundus photographic features of diabetic macular edema in a randomized clinical trial. Retina. 2010;30:1627–1637.
112 Neubauer AS, Chryssafis C, Priglinger SG, et al. Topography of diabetic macular oedema compared with fluorescein angiography. Acta Ophthalmol Scand. 2007;85:32–39.
113 Framme C, Roider J. Immediate and long-term changes of fundus autofluorescence in continuous wave laser lesions of the retina. Ophthalmic Surg Lasers Imaging. 2004;35:131–138.
114 Muqit MM, Gray JC, Marcellino GR, et al. Fundus autofluorescence and Fourier-domain optical coherence tomography imaging of 10 and 20 millisecond Pascal retinal photocoagulation treatment. Br J Ophthalmol. 2009;93:518–525.
115 Fong DS, Segal PP, Myers F, et al. Subretinal fibrosis in diabetic macular edema. ETDRS report 23. Early Treatment Diabetic Retinopathy Study Research Group. Arch Ophthalmol. 1997;115:873–877.
116 Bandello F, Polito A, Del Borrello M, et al. “Light” versus “classic” laser treatment for clinically significant diabetic macular oedema. Br J Ophthalmol. 2005;89:864–870.
117 Catier A, Tadayoni R, Paques M, et al. Characterization of macular edema from various etiologies by optical coherence tomography. Am J Ophthalmol. 2005;140:200–206.
118 Goebel W, Kretzchmar-Gross T. Retinal thickness in diabetic retinopathy: a study using optical coherence tomography (OCT). Retina. 2002;22:759–767.
119 Hee MR, Puliafito CA, Wong C, et al. Quantitative assessment of macular edema with optical coherence tomography. Arch Ophthalmol. 1995;113:1019–1029.
120 Laursen ML, Moeller F, Sander B, et al. Subthreshold micropulse diode laser treatment in diabetic macular oedema. Br J Ophthalmol. 2004;88:1173–1179.
121 Martidis A, Duker JS, Greenberg PB, et al. Intravitreal triamcinolone for refractory diabetic macular edema. Ophthalmology. 2002;109:920–927.
122 Massin P, Duguid G, Erginay A, et al. Optical coherence tomography for evaluating diabetic macular edema before and after vitrectomy. Am J Ophthalmol. 2003;135:169–177.
123 Otani T, Kishi S. Tomographic findings of foveal hard exudates in diabetic macular edema. Am J Ophthalmol. 2001;131:50–54.
124 Ozdemir H, Karacorlu M, Karacorlu SA. Regression of serous macular detachment after intravitreal triamcinolone acetonide in patients with diabetic macular edema. Am J Ophthalmol. 2005;140:251–255.
125 Browning DJ, Glassman AR, Aiello LP, et al. Relationship between optical coherence tomography-measured central retinal thickness and visual acuity in diabetic macular edema. Ophthalmology. 2007;114:525–536.
126 Danis RP, Glassman AR, Aiello LP, et al. Diurnal variation in retinal thickening measurement by optical coherence tomography in center-involved diabetic macular edema. Arch Ophthalmol. 2006;124:1701–1707.
127 American Diabetes Association. Standards of medical care in diabetes – 2011. Diabetes Care. 2011;34(Suppl 1):S11–S61.
128 Lachin JM. Point: Intensive glycemic control and mortality in ACCORD – a chance finding? Diabetes Care. 2010;33:2719–2721.
129 Riddle MC. Counterpoint: Intensive glucose control and mortality in ACCORD – still looking for clues. Diabetes Care. 2010;33:2722–2724.
130 Gerstein HC, Miller ME, Genuth S, et al. Long-term effects of intensive glucose lowering on cardiovascular outcomes. N Engl J Med. 2011;364:818–828.
131 Fong DS, Sharza M, Chen W, et al. Vision loss among diabetics in a group model Health Maintenance Organization (HMO). Am J Ophthalmol. 2002;133:236–241.
132 Kraft SK, Marrero DG, Lazaridis EN, et al. Primary care physicians’ practice patterns and diabetic retinopathy. Current levels of care. Arch Fam Med. 1997;6:29–37.
133 Lee PP, Feldman ZW, Ostermann J, et al. Longitudinal rates of annual eye examinations of persons with diabetes and chronic eye diseases. Ophthalmology. 2003;110:1952–1959.
134 Paz SH, Varma R, Klein R, et al. Noncompliance with vision care guidelines in Latinos with type 2 diabetes mellitus: the Los Angeles Latino Eye Study. Ophthalmology. 2006;113:1372–1377.
135 Schoenfeld ER, Greene JM, Wu SY, et al. Patterns of adherence to diabetes vision care guidelines: baseline findings from the Diabetic Retinopathy Awareness Program. Ophthalmology. 2001;108:563–571.
136 Zimmer-Galler IE, Zeimer R. Telemedicine in diabetic retinopathy screening. Int Ophthalmol Clin. 2009;49:75–86.
137 Ahmed J, Ward TP, Bursell SE, et al. The sensitivity and specificity of nonmydriatic digital stereoscopic retinal imaging in detecting diabetic retinopathy. Diabetes Care. 2006;29:2205–2209.
138 Bursell SE, Cavallerano JD, Cavallerano AA, et al. Stereo nonmydriatic digital-video color retinal imaging compared with Early Treatment Diabetic Retinopathy Study seven standard field 35-mm stereo color photos for determining level of diabetic retinopathy. Ophthalmology. 2001;108:572–585.
139 Fransen SR, Leonard-Martin TC, Feuer WJ, et al. Clinical evaluation of patients with diabetic retinopathy: accuracy of the Inoveon diabetic retinopathy-3DT system. Ophthalmology. 2002;109:595–601.
140 Lin DY, Blumenkranz MS, Brothers RJ, et al. The sensitivity and specificity of single-field nonmydriatic monochromatic digital fundus photography with remote image interpretation for diabetic retinopathy screening: a comparison with ophthalmoscopy and standardized mydriatic color photography. Am J Ophthalmol. 2002;134:204–213.
141 Schiffman RM, Jacobsen G, Nussbaum JJ, et al. Comparison of a digital retinal imaging system and seven-field stereo color fundus photography to detect diabetic retinopathy in the primary care environment. Ophthalmic Surg Lasers Imaging. 2005;36:46–56.
142 Tennant MT, Greve MD, Rudnisky CJ, et al. Identification of diabetic retinopathy by stereoscopic digital imaging via teleophthalmology: a comparison to slide film. Can J Ophthalmol. 2001;36:187–196.
143 Whited JD. Accuracy and reliability of teleophthalmology for diagnosing diabetic retinopathy and macular edema: a review of the literature. Diabetes Technol Ther. 2006;8:102–111.
144 Jonas JB, Sofker A. Intraocular injection of crystalline cortisone as adjunctive treatment of diabetic macular edema. Am J Ophthalmol. 2001;132:425–427.
145 Chan CK, Chan WM, Cheung BT, et al. Intravitreal injection of triamcinolone for diffuse diabetic macular edema. Arch Ophthalmol. 2004;122:1083–1085. author reply 6–8
146 Ip MS. Intravitreal injection of triamcinolone: an emerging treatment for diabetic macular edema. Diabetes Care. 2004;27:1794–1797.
147 Kuhn F, Barker D. Intravitreal injection of triamcinolone acetonide for diabetic macular edema. Arch Ophthalmol. 2004;122:1082–1083. author reply 6–8
148 Massin P, Audren F, Haouchine B, et al. Intravitreal triamcinolone acetonide for diabetic diffuse macular edema: preliminary results of a prospective controlled trial. Ophthalmology. 2004;111:218–224. discussion 24–5
149 Rodriguez-Coleman H, Yuan P, Kim H, et al. Intravitreal injection of triamcinolone for diffuse macular edema. Arch Ophthalmol. 2004;122:1085–1086. author reply 6–8
150 Wong R, Sherefat H, Bartholomew D, et al. Intravitreal injection of triamcinolone for diffuse diabetic macular edema. Arch Ophthalmol. 2004;122:1082. author reply 6–8
151 Diabetic Retinopathy Clinical Research Network. A randomized trial comparing intravitreal triamcinolone acetonide and focal/grid photocoagulation for diabetic macular edema. Ophthalmology. 2008;115:1447–1449. 9 e1–10
152 Beck RW, Edwards AR, Aiello LP, et al. Three-year follow-up of a randomized trial comparing focal/grid photocoagulation and intravitreal triamcinolone for diabetic macular edema. Arch Ophthalmol. 2009;127:245–251.
153 Elman MJ, Aiello LP, Beck RW, et al. Randomized trial evaluating ranibizumab plus prompt or deferred laser or triamcinolone plus prompt laser for diabetic macular edema. Ophthalmology. 2010;117:1064–1077.
154 Early Treatment Diabetic Retinopathy Study design and baseline patient characteristics. ETDRS report number 7. Ophthalmology. 1991;98:741–756.
155 Treatment techniques and clinical guidelines for photocoagulation of diabetic macular edema. Early Treatment Diabetic Retinopathy Study Report Number 2. Early Treatment Diabetic Retinopathy Study Research Group. Ophthalmology. 1987;94:761–774.
156 Diabetic Retinopathy Clinical Research Network [Internet]. http://publicfiles.jaeb.org/drcrnet/Misc/FocalGridProcedure42711.pdf, 2011. [cited 2012 Feb 20. Modified-ETDRS focal photocoagulation technique. Available from
157 Akduman L, Olk RJ. Diode laser (810 nm) versus argon green (514 nm) modified grid photocoagulation for diffuse diabetic macular edema. Ophthalmology. 1997;104:1433–1441.
158 Bolz M, Kriechbaum K, Simader C, et al. In vivo retinal morphology after grid laser treatment in diabetic macular edema. Ophthalmology. 2010;117:538–544.
159 Kumar V, Ghosh B, Mehta DK, et al. Functional outcome of subthreshold versus threshold diode laser photocoagulation in diabetic macular oedema. Eye (Lond). 2010;24:1459–1465.
160 Lavinsky D, Cardillo JA, Melo LA, Jr., et al. Randomized clinical trial evaluating mETDRS versus normal or high-density micropulse photocoagulation for diabetic macular edema. Invest Ophthalmol Vis Sci. 2011;52:4314–4323.
161 Muqit MM, Gray JC, Marcellino GR, et al. Barely visible 10-millisecond pascal laser photocoagulation for diabetic macular edema: observations of clinical effect and burn localization. Am J Ophthalmol. 2010;149:979–986. e2
162 Nakamura Y, Mitamura Y, Ogata K, et al. Functional and morphological changes of macula after subthreshold micropulse diode laser photocoagulation for diabetic macular oedema. Eye (Lond). 2010;24:784–788.
163 Ohkoshi K, Yamaguchi T. Subthreshold micropulse diode laser photocoagulation for diabetic macular edema in Japanese patients. Am J Ophthalmol. 2010;149:133–139.
164 Venkatesh P, Ramanjulu R, Azad R, et al. Subthreshold micropulse diode laser and double frequency neodymium: YAG laser in treatment of diabetic macular edema: a prospective, randomized study using multifocal electroretinography. Photomed Laser Surg. 2011.
165 Figueira J, Khan J, Nunes S, et al. Prospective randomised controlled trial comparing sub-threshold micropulse diode laser photocoagulation and conventional green laser for clinically significant diabetic macular oedema. Br J Ophthalmol. 2009;93:1341–1344.
166 Jain A, Collen J, Kaines A, et al. Short-duration focal pattern grid macular photocoagulation for diabetic macular edema: four-month outcomes. Retina. 2010;30:1622–1626.
167 Luttrull JK, Musch DC, Mainster MA. Subthreshold diode micropulse photocoagulation for the treatment of clinically significant diabetic macular oedema. Br J Ophthalmol. 2005;89:74–80.
168 Fong DS, Strauber SF, Aiello LP, et al. Comparison of the modified Early Treatment Diabetic Retinopathy Study and mild macular grid laser photocoagulation strategies for diabetic macular edema. Arch Ophthalmol. 2007;125:469–480.
169 Elman MJ, Bressler NM, Qin H, et al. Expanded 2-year follow-up of ranibizumab plus prompt or deferred laser or triamcinolone plus prompt laser for diabetic macular edema. Ophthalmology. 2011;118:609–614.
170 Hofman P, Blaauwgeers HG, Tolentino MJ, et al. VEGF-A induced hyperpermeability of blood–retinal barrier endothelium in vivo is predominantly associated with pinocytotic vesicular transport and not with formation of fenestrations. Vascular endothelial growth factor-A. Curr Eye Res. 2000;21:637–645.
171 Michels S, Rosenfeld PJ, Puliafito CA, et al. Systemic bevacizumab (Avastin) therapy for neovascular age-related macular degeneration twelve-week results of an uncontrolled open-label clinical study. Ophthalmology. 2005;112:1035–1047.
172 Moshfeghi AA, Rosenfeld PJ, Puliafito CA, et al. Systemic bevacizumab (Avastin) therapy for neovascular age-related macular degeneration: twenty-four-week results of an uncontrolled open-label clinical study. Ophthalmology. 2006;113:2002 e1–12.
173 Nguyen QD, Shah SM, Hafiz G, et al. A phase I trial of an IV-administered vascular endothelial growth factor trap for treatment in patients with choroidal neovascularization due to age-related macular degeneration. Ophthalmology. 2006;113:1522.e1–1522.e14.
174 Cunningham ET, Jr., Adamis AP, Altaweel M, et al. A phase II randomized double-masked trial of pegaptanib, an anti-vascular endothelial growth factor aptamer, for diabetic macular edema. Ophthalmology. 2005;112:1747–1757.
175 Faghihi H, Roohipoor R, Mohammadi SF, et al. Intravitreal bevacizumab versus combined bevacizumab-triamcinolone versus macular laser photocoagulation in diabetic macular edema. Eur J Ophthalmol. 2008;18:941–948.
176 Lam DS, Lai TY, Lee VY, et al. Efficacy of 1.25 MG versus 2.5 MG intravitreal bevacizumab for diabetic macular edema: six-month results of a randomized controlled trial. Retina. 2009;29:292–299.
177 Nguyen QD, Shah SM, Heier JS, et al. Primary end point (six months) results of the Ranibizumab for Edema of the mAcula in diabetes (READ-2) study. Ophthalmology. 2009;116:2175–2181.
178 Paccola L, Costa RA, Folgosa MS, et al. Intravitreal triamcinolone versus bevacizumab for treatment of refractory diabetic macular oedema (IBEME study). Br J Ophthalmol. 2008;92:76–80.
179 Scott IU, Edwards AR, Beck RW, et al. A phase II randomized clinical trial of intravitreal bevacizumab for diabetic macular edema. Ophthalmology. 2007;114:1860–1867.
180 Soheilian M, Ramezani A, Obudi A, et al. Randomized trial of intravitreal bevacizumab alone or combined with triamcinolone versus macular photocoagulation in diabetic macular edema. Ophthalmology. 2009;116:1142–1150.
181 Massin P, Bandello F, Garweg JG, et al. Safety and efficacy of ranibizumab in diabetic macular edema (RESOLVE Study): a 12-month, randomized, controlled, double-masked, multicenter phase II study. Diabetes Care. 2010;33:2399–2405.
182 Mitchell P, Bandello F, Schmidt-Erfurth U, et al. The RESTORE study: ranibizumab monotherapy or combined with laser versus laser monotherapy for diabetic macular edema. Ophthalmology. 2011;118:615–625.
183 Michaelides M, Kaines A, Hamilton RD, et al. A prospective randomized trial of intravitreal bevacizumab or laser therapy in the management of diabetic macular edema (BOLT study) 12-month data: report 2. Ophthalmology. 2010;117:1078–1086.
184 Crum R, Szabo S, Folkman J. A new class of steroids inhibits angiogenesis in the presence of heparin or a heparin fragment. Science. 1985;230:1375–1378.
185 Folkman J, Ingber DE. Angiostatic steroids. Method of discovery and mechanism of action. Ann Surg. 1987;206:374–383.
186 Gordon DM. Prednisone and prednisolone in ocular disease. Am J Ophthalmol. 1956;41:593–600.
187 Ingber DE, Madri JA, Folkman J. A possible mechanism for inhibition of angiogenesis by angiostatic steroids: induction of capillary basement membrane dissolution. Endocrinology. 1986;119:1768–1775.
188 Fauci A. Clinical aspects of immunosuppression: use of cytotoxic agents and corticosteroids. In: Bellanti JA, ed. Immunology II. Philadelphia: WB Saunders, 1978.
189 Nussenblatt R, Whitcup S, Palestine A. Uveitis: fundamentals and clinical practice. St Louis: Mosby; 1996.
190 Callanan DG, Jaffe GJ, Martin DF, et al. Treatment of posterior uveitis with a fluocinolone acetonide implant: three-year clinical trial results. Arch Ophthalmol. 2008;126:1191–1201.
191 Pavesio C, Zierhut M, Bairi K, et al. Evaluation of an intravitreal fluocinolone acetonide implant versus standard systemic therapy in noninfectious posterior uveitis. Ophthalmology. 2010;117:567–575. 75 e1
192 The effect of ruboxistaurin on visual loss in patients with moderately severe to very severe nonproliferative diabetic retinopathy: initial results of the Protein Kinase C beta Inhibitor Diabetic Retinopathy Study (PKC-DRS) multicenter randomized clinical trial. Diabetes. 2005;54:2188–2197.
193 Jaffe GJ, Martin D, Callanan D, et al. Fluocinolone acetonide implant (Retisert) for noninfectious posterior uveitis: thirty-four-week results of a multicenter randomized clinical study. Ophthalmology. 2006;113:1020–1027.
194 Schwartz SG, Flynn HW, Jr. Fluocinolone acetonide implantable device for diabetic retinopathy. Curr Pharm Biotechnol. 2011;12:347–351.
195 Campochiaro PA, Brown DM, Pearson A, et al. Long-term benefit of sustained-delivery fluocinolone acetonide vitreous inserts for diabetic macular edema. Ophthalmology. 2011;118:626–635.
196 Haller JA, Kuppermann BD, Blumenkranz MS, et al. Randomized controlled trial of an intravitreous dexamethasone drug delivery system in patients with diabetic macular edema. Arch Ophthalmol. 2010;128:289–296.
197 Harbour JW, Smiddy WE, Flynn HW, Jr., et al. Vitrectomy for diabetic macular edema associated with a thickened and taut posterior hyaloid membrane. Am J Ophthalmol. 1996;121:405–413.
198 Kaiser PK, Riemann CD, Sears JE, et al. Macular traction detachment and diabetic macular edema associated with posterior hyaloidal traction. Am J Ophthalmol. 2001;131:44–49.
199 Lewis H, Abrams GW, Blumenkranz MS, et al. Vitrectomy for diabetic macular traction and edema associated with posterior hyaloidal traction. Ophthalmology. 1992;99:753–759.
200 Pendergast SD, Hassan TS, Williams GA, et al. Vitrectomy for diffuse diabetic macular edema associated with a taut premacular posterior hyaloid. Am J Ophthalmol. 2000;130:178–186.
201 Haller JA, Qin H, Apte RS, et al. Vitrectomy outcomes in eyes with diabetic macular edema and vitreomacular traction. Ophthalmology. 2010;117:1087–1093.
202 Dillinger P, Mester U. Vitrectomy with removal of the internal limiting membrane in chronic diabetic macular oedema. Graefes Arch Clin Exp Ophthalmol. 2004;242:630–637.
203 Figueroa MS, Contreras I, Noval S. Surgical and anatomical outcomes of pars plana vitrectomy for diffuse nontractional diabetic macular edema. Retina. 2008;28:420–426.
204 Hartley KL, Smiddy WE, Flynn HW, Jr., et al. Pars plana vitrectomy with internal limiting membrane peeling for diabetic macular edema. Retina. 2008;28:410–419.
205 Higuchi A, Ogata N, Jo N, et al. Pars plana vitrectomy with removal of posterior hyaloid face in treatment of refractory diabetic macular edema resistant to triamcinolone acetonide. Jpn J Ophthalmol. 2006;50:529–531.
206 Ikeda T, Sato K, Katano T, et al. Vitrectomy for cystoid macular oedema with attached posterior hyaloid membrane in patients with diabetes. Br J Ophthalmol. 1999;83:12–14.
207 La Heij EC, Hendrikse F, Kessels AG, et al. Vitrectomy results in diabetic macular oedema without evident vitreomacular traction. Graefes Arch Clin Exp Ophthalmol. 2001;239:264–270.
208 Recchia FM, Ruby AJ, Carvalho Recchia CA. Pars plana vitrectomy with removal of the internal limiting membrane in the treatment of persistent diabetic macular edema. Am J Ophthalmol. 2005;139:447–454.
209 Rosenblatt BJ, Shah GK, Sharma S, et al. Pars plana vitrectomy with internal limiting membranectomy for refractory diabetic macular edema without a taut posterior hyaloid. Graefes Arch Clin Exp Ophthalmol. 2005;243:20–25.
210 Yanyali A, Horozoglu F, Celik E, et al. Long-term outcomes of pars plana vitrectomy with internal limiting membrane removal in diabetic macular edema. Retina. 2007;27:557–566.
211 Patel JI, Hykin PG, Schadt M, et al. Diabetic macular oedema: pilot randomised trial of pars plana vitrectomy vs macular argon photocoagulation. Eye (Lond). 2006;20:873–881.
212 Thomas D, Bunce C, Moorman C, et al. A randomised controlled feasibility trial of vitrectomy versus laser for diabetic macular oedema. Br J Ophthalmol. 2005;89:81–86.
213 The Diabetic Retinopathy Study Research Group. Photocoagulation treatment of proliferative diabetic retinopathy. Clinical application of Diabetic Retinopathy Study (DRS) findings, DRS Report Number 8. Ophthalmology. 1981;88:583–600.
214 Bressler NM, Edwards AR, Beck RW, et al. Exploratory analysis of diabetic retinopathy progression through 3 years in a randomized clinical trial that compares intravitreal triamcinolone acetonide with focal/grid photocoagulation. Arch Ophthalmol. 2009;127:1566–1571.
215 The DAMAD Study Group. Effect of aspirin alone and aspirin plus dipyridamole in early diabetic retinopathy. A multicenter randomized controlled clinical trial. Diabetes. 1989;38:491–498.
216 The TIMAD Study Group. Ticlopidine treatment reduces the progression of nonproliferative diabetic retinopathy. Arch Ophthalmol. 1990;108:1577–1583.
217 Effects of aspirin treatment on diabetic retinopathy. ETDRS report number 8. Early Treatment Diabetic Retinopathy Study Research Group. Ophthalmology. 1991;98:757–765.
218 Chew EY, Klein ML, Murphy RP, et al. Effects of aspirin on vitreous/preretinal hemorrhage in patients with diabetes mellitus. Early Treatment Diabetic Retinopathy Study report no. 20. Arch Ophthalmol. 1995;113:52–55.
219 Sorbinil Retinopathy Trial Research Group. A randomized trial of sorbinil, an aldose reductase inhibitor, in diabetic retinopathy. Arch Ophthalmol. 1990;108:1234–1244.
220 Aiello LP, Bursell SE, Clermont A, et al. Vascular endothelial growth factor-induced retinal permeability is mediated by protein kinase C in vivo and suppressed by an orally effective beta-isoform-selective inhibitor. Diabetes. 1997;46:1473–1480.
221 Xu X, Zhu Q, Xia X, et al. Blood–retinal barrier breakdown induced by activation of protein kinase C via vascular endothelial growth factor in streptozotocin-induced diabetic rats. Curr Eye Res. 2004;28:251–256.
222 Yokota T, Ma RC, Park JY, et al. Role of protein kinase C on the expression of platelet-derived growth factor and endothelin-1 in the retina of diabetic rats and cultured retinal capillary pericytes. Diabetes. 2003;52:838–845.
223 Zhu Q, Xu X, Xia X, et al. Role of protein kinase C on the alteration of retinal endothelin-1 in streptozotocin-induced diabetic rats. Exp Eye Res. 2005;81:200–206.
224 PKC-DRS Study Group. The effect of ruboxistaurin on visual loss in patients with moderately severe to very severe nonproliferative diabetic retinopathy: initial results of the Protein Kinase C beta Inhibitor Diabetic Retinopathy Study (PKC-DRS) multicenter randomized clinical trial. Diabetes. 2005;54:2188–2197.
225 Aiello LP, Davis MD, Girach A, et al. Effect of ruboxistaurin on visual loss in patients with diabetic retinopathy. Ophthalmology. 2006;113:2221–2230.
226 Congdon N, O’Colmain B, Klaver CC, et al. Causes and prevalence of visual impairment among adults in the United States. Arch Ophthalmol. 2004;122:477–485.
227 World Health Organization [Internet]. Geneva: WHO; 2011 August [cited 2012 2 Feb]. Fact sheet no. 312: Diabetes. Available from http://www.who.int/mediacentre/factsheets/fs312/en/
228 Centers for Disease Control and Prevention [Press release on the Internet]. CDC: Atlanta, GA http://www.cdc.gov/media/pressrel/2010/r101022.html, 2010. Oct [cited 2012 Feb 2]. Number of Americans with diabetes projected to double or triple by 2050. Available from
[/level-membership-for-opthalmology-category][not-level-membership-for-opthalmology-category]
Chapter 47 Nonproliferative Diabetic Retinopathy and Diabetic Macular Edema
This chapter discusses the clinical manifestations and management of NPDR and diabetic macular edema (DME). Chapter 48 reviews proliferative diabetic retinopathy (PDR).
Natural course of nonproliferative diabetic retinopathy
Diabetes mellitus without retinopathy
Retinal microvascular alterations visible on ophthalmoscopy typically develop years following the onset of DM. Chapter 46 (Diabetic retinopathy: Genetics and etiologic mechanisms) reviews what we know about the early biochemical and cellular alterations leading to diabetic retinopathy, while Chapter 45 (The epidemiology of diabetic retinopathy) discusses the incidence and prevalence of retinopathy among diabetics. Experimental models of diabetic retinopathy in dogs and rats, and studies of human autopsy eyes, indicate that early alterations in retinal blood vessels include the loss of capillary pericytes (Fig. 47.1) and thickening of the capillary basement membrane.1–21
There is preliminary evidence that parenchymal cells of the retina exhibit changes in the early stages of disease, including glial cell reactivity, alterations in glutamate metabolism, and neuron cell death.22–28 Several studies have documented subtle changes in contrast sensitivity and color perception in diabetics in the absence of visible retinopathy,29–34 but it remains unclear whether these effects result from deficits in retinal function, or from other diabetic alterations such as cataractogenesis. Central vision (measured by visual acuity) and peripheral vision (measured by common perimetric tests) typically remain normal in DM prior to onset of clinically evident retinopathy, in the absence of other factors such as cataract.
Microaneurysms
Microaneurysms arise as hypercellular saccular outpouchings of the capillary wall that can be well visualized in trypsin-digest retinal mounts (see Fig. 47.1D).1 Their lumina are sometimes occluded by agglutinated erythrocytes or thrombus. Over time they sometimes become acellular, just as damaged retinal capillaries can evolve into “ghost” vessels devoid of endothelial cells and pericytes. The mechanism for microaneurysm formation is unknown. Possible contributing factors may include alterations in the retinal microenvironment from metabolic effects on neurons, glial cells, and endothelial cells; endothelial cell injury secondary to leukostasis from altered interaction between endothelial cells and leukocytes; response of endothelial cells to altered balance between proliferative and antiproliferative factors; structural changes in the capillary wall (such as from loss of pericytes); or increase in intraluminal pressure.
Microaneurysms visualized by ophthalmoscopy or angiography commonly appear and disappear over time, though some retain a stable appearance for years. The presence of microaneurysms alone, in the absence of other features of diabetic retinopathy, remains compatible with normal vision. However, as the number of microaneurysms increases, there is a greater risk of retinopathy progression.35–37
Retinal vascular hyperpermeability
Subtle compromise of the blood–retinal barrier may begin at an early stage of disease, even preceding the appearance of retinopathy, but clinically appreciable retinal vascular hyperpermeability typically follows the appearance of microaneurysms. Visualized clinically by angiography, leakage may arise from microaneurysms, retinal capillaries, or other microvascular abnormalities, and can be highly variable in magnitude and extent. Retinal vascular incompetence may or may not result in localized areas of thickening of the retina. Hard exudates, extravascular deposits of lipid-rich material that result from spillage and incomplete resorption of plasma lipoproteins, may accumulate. Intraretinal hemorrhages appear in the posterior pole and in the retinal periphery. The vascular alterations responsible for hyperpermeability in NPDR remain incompletely understood, but may involve dysfunction of the tight junctions between retinal capillary endothelial cells. Possible mechanisms for breakdown of the blood–retinal barrier are discussed in Chapter 27 (Blood–retinal barrier, immune privilege, and autoimmunity).
Diabetic macular edema
The pathogenesis of DME remains poorly understood, partly because of the absence of a good animal model. Chapter 46 (Diabetic retinopathy: Genetics and etiologic mechanisms) reviews what we know about the early biochemical and cellular alterations leading to DME, while Chapter 28 (Mechanism of macular edema) discusses factors involved in the pathogenesis of macular edema of different causes.
Extrafoveal foci of retinal thickening and hard exudates may not cause symptoms or affect visual acuity, but DME that involves or threatens the center of the macula carries a significant risk of vision loss. In the Early Treatment of Diabetic Retinopathy Study (ETDRS), the 3-year risk of moderate visual loss (a decrease of three lines or more on a logarithmic visual acuity chart, corresponding to a doubling of the initial visual angle) among untreated eyes with DME involving or threatening the center of the macula was 32%.38 The natural history of DME is variable. In some eyes, it can persist for years, while in others it may spontaneously resolve. Chapter 45 (The epidemiology of diabetic retinopathy) discusses the incidence and prevalence of DME and consequent vision loss.
Capillary closure, microvascular remodeling, and retinal ischemia
One of the most serious consequences of diabetic retinopathy is progressive loss of functional retinal capillaries. Trypsin-digest preparations of the retina show areas of acellular capillaries, or “ghost” vessels, which have lost the endothelial cells and pericytes that once lined them (see Fig. 47.1C). When patches of such acellular capillaries, first seen early in the course of NPDR, increase and become confluent, the terminal arterioles that supply these capillaries often become occluded. Regions of acellular capillaries in histologic sections have been shown to correspond to areas of capillary nonperfusion visualized by fluorescein angiography.39 Adjacent to these areas of retinal ischemia, clusters of microaneurysms and hypercellular vessels often develop. It has been difficult to determine whether such vessels represent altered pre-existing capillaries or neovascularization within the retina. Such vessels are described clinically as intraretinal microvascular abnormalities (IRMA), a term intended to accommodate both possibilities.
Progressive capillary closure and resulting retinal ischemia are commonly associated with increasing IRMA, intraretinal hemorrhages, and venous abnormalities such as segmental dilation (venous beading). Occasionally, in cases of extensive capillary nonperfusion, the retina acquires a featureless appearance with a relative dearth of visible vessels, hemorrhages, or microvascular abnormalities. Retinal ischemia represents another cause for vision loss in NPDR, and also plays a central role in the pathogenesis of PDR by stimulating elaboration of vascular endothelial growth factor A (VEGF-A) and other factors promoting the growth of extraretinal neovascularization.40–47 Chapter 48 (Proliferative diabetic retinopathy) discusses the natural course of PDR.
Alterations of the vitreous gel and vitreoretinal interface
The vitreous gel plays a key role in the fibrovascular proliferation of PDR, but it may also exert important effects at earlier stages of retinopathy. Epiretinal membrane formation, arising from liquefaction of the vitreous gel and consequent effects at the vitreoretinal interface, can occur with advancing age in otherwise healthy eyes but is more common in diabetic eyes.48–52 It has been hypothesized that liquefaction of the vitreous gel out of proportion to diminution of posterior vitreoretinal adhesion may underlie the pathophysiology of many vitreoretinal diseases,53 and observations at vitrectomy suggest that the posterior cortical vitreous is frequently more adherent to the retina in the setting of diabetic retinopathy. Studies have documented a number of biochemical changes to the vitreous gel in the setting of DM, including increased collagen fibril cross-linking, accumulation of advanced glycation end products that may augment vitreoretinal adhesion and incite retinal glial cell reactivity, and alterations in the concentration of various soluble proteins.54–58
The role of the vitreous gel in the pathophysiology of diabetic retinopathy may extend beyond its capacity to exert mechanical effects on the retina. For example, there is recent evidence that the vitreous may function as an important regulator of intraocular oxygen tension, a finding that could have important implications for diabetic retinopathy and other diseases involving retinal hypoxia.59,60
Clinical evaluation of nonproliferative diabetic retinopathy
Comprehensive evaluation of a patient with DM begins with identification of extraocular factors associated with risk of diabetic retinopathy and its progression. Such factors are presented briefly here and discussed in greater detail in Chapter 45 (The epidemiology of diabetic retinopathy). Pertinent medical history is sought from the patient, and supplemented by records from his or her primary care physician or endocrinologist as warranted.
Duration of diabetes mellitus
The duration of DM is strongly associated with risk of retinopathy. Cross-sectional and longitudinal analyses from population-based epidemiologic studies have established the association between prevalence of retinopathy and duration of disease.61–70 The Wisconsin Epidemiologic Study of Diabetic Retinopathy (WESDR) examined prevalence and severity of diabetic retinopathy among diabetics categorized into a younger-onset group consisting of those diagnosed with DM prior to 30 years of age who were taking insulin at the time of the evaluation (predominantly type 1 DM) and an older-onset group consisting of those diagnosed with DM at 30 years of age or older (predominantly type 2 DM), the latter subdivided according to whether insulin was being used at the time of evaluation. The prevalence of retinopathy may have changed somewhat since the 1980s when WESDR data was collected, given interim advances and evolving standards of care in management of DM, but the WESDR remains one of our most definitive sources of information about the epidemiology of diabetic retinopathy in the United States. In the younger-onset group, retinopathy (consisting of NPDR or PDR) was seen in 13% of those with less than a 5-year duration of DM and in 90% of those with a duration of 10–15 years.65 In the older-onset group using insulin, retinopathy was seen in 40% of those with less than a 5-year duration of disease and in 84% of those with a duration of 15–19 years, while the corresponding rates in the older-onset group not taking insulin were 24% and 53%, respectively.64
Among those with type 2 DM, in which disease onset is often more insidious than in type 1 DM and in which hyperglycemia can remain asymptomatic for years, age at diagnosis may not always accurately reflect disease duration. The Centers for Disease Control and Prevention estimate that 25.8 million people in the United States have DM, of whom 7.0 million do not know they have it.71 The prevalence of undiagnosed type 2 DM is felt to be the key factor explaining the higher rates of retinopathy noted soon after diagnosis among type 2 diabetics (24% in the older-onset group not taking insulin with less than a 5-year duration of disease in the WESDR) compared with type 1 diabetics (13% in the younger-onset group with less than a 5-year duration of disease).
Hyperglycemia
The relationship between the degree of hyperglycemia and the presence and severity of diabetic retinopathy has been extensively studied in observational studies and clinical trials. The observational studies have demonstrated that greater hyperglycemia is associated with increased prevalence and severity of diabetic retinopathy.62,64–67,69,70 Several key randomized controlled clinical trials have demonstrated that better glycemic control is associated with a decreased risk of secondary complications of DM, including diabetic retinopathy.72–79
In the Diabetes Control and Complications Trial (DCCT), 1441 participants with type 1 DM were randomly assigned to either conventional or more intensive insulin treatment and followed for a period of 4–9 years.72,73,76,79 The average difference in glycosylated hemoglobin (hemoglobin A1C [HbA1C]) between the two groups was almost 2%. Intensive insulin treatment as defined by the DCCT was associated with a decreased risk of both the development and progression of diabetic retinopathy. In patients without retinopathy at enrollment, the 3-year risk of developing retinopathy was reduced by 75% in the intensive insulin treatment group compared with the conventional treatment group. The benefit of better glycemic control was also evident in patients with existing retinopathy at baseline, as shown by a 50% reduction in the rate of progression of retinopathy compared with controls. At the 6- and 12-month visits, more intensive insulin treatment exerted a small adverse effect on retinopathy progression, similar to that described in other trials of glycemic control. However, among eyes with little or no retinopathy at the time of initiating better control of hyperglycemia, it was found that such “early worsening” of retinopathy was unlikely to threaten vision. When the DCCT results were stratified by levels of glycosylated hemoglobin, there was a 35–40% reduction in the risk of retinopathy progression for every 10% decrease in HbA1C (e.g., from 8% to 7.2%). This represented a fivefold increase in risk of progression for patients with HbA1C around 10% compared with those with HbA1C around 7%. Notably, there was also a statistically significant reduction in other microvascular complications of DM, including nephropathy and peripheral neuropathy, with more intensive glycemic control in the DCCT.
When the randomized controlled clinical trial was completed, DCCT participants were informed of the results and enrolled in a follow-up phase of the study, known as the Epidemiology of Diabetes Intervention and Complications (EDIC) study.76 After an additional 7 years of follow-up, during which the HbA1C values in both treatment groups did not differ significantly (8.1% vs 8.2%, P = 0.09), the rate of retinopathy progression remained significantly lower in those who had received more intensive treatment in the DCCT than in those who had received conventional therapy. Thus, more intensive glycemic control over a period of 6.5 years conferred benefits well beyond the period of treatment.
In the United Kingdom Prospective Diabetes Study (UKPDS), 3867 patients with newly diagnosed type 2 DM were randomly assigned to conventional therapy or to more intensive glycemic control with either insulin or a sulfonylurea.74,75 Among participants treated with conventional therapy, those who were overweight were given metformin and those who were not overweight did not receive this medication. After 12 years, the rate of retinopathy progression was reduced by 21% and the use of laser photocoagulation was reduced by 29% in those getting intensive glycemic control compared with those getting conventional treatment. For every percentage point decrease in HbA1C (e.g., 9% to 8%), there was a 35% reduction in the risk of microvascular complications of disease.
The results of the UKPDS have recently been corroborated by those of another large randomized controlled clinical trial, the Action to Control Cardiovascular Risk in Diabetes (ACCORD) study. The ACCORD study randomly assigned 10 251 patients with type 2 DM to very intensive glycemic control (targeting HbA1C less than 6%), or to standard treatment (targeting HbA1C between 7 and 7.9%). A subset of 2856 participants was evaluated for progression of retinopathy by comparison of fundus photographs taken at baseline and at 4 years.78 In this subset at one year, median HbA1C in the intensive treatment cohort was 6.4% compared with 7.5% in the cohort getting conventional therapy. In the intensive treatment group, the rate of retinopathy progression was 7.3%, compared with 10.4% in the standard therapy group (adjusted odds ratio, 0.67; 95% confidence interval [CI] 0.51–0.87; P = 0.003). The glycemia trial, performed alongside other studies evaluating control of blood pressure and plasma lipids, was halted early at a median of 3.7 years because of an increased rate of death from all causes in participants treated with intensive control compared with those managed with standard control (5% vs 4%, respectively), and the very intensive control approach was abandoned.
Hypertension
In addition to assessing the effects of differential glycemic control, the UKPDS provided a randomized comparison between more intensive blood pressure control (targeting a systolic blood pressure less than 150 mmHg) and less intensive blood pressure control (targeting a systolic blood pressure less than 180 mmHg) in a large cohort of participants with newly diagnosed type 2 DM.80 Study results demonstrated that intensive blood pressure control was associated with a decreased risk of retinopathy progression. Of 1148 hypertensive participants in the UKPDS, 758 were allocated to more intensive control of blood pressure and 390 to less intensive control with a median follow-up of 8.4 years. More intensive blood pressure control resulted in a 37% reduction in microvascular complications of DM, predominantly a reduced risk of retinal photocoagulation, compared with less intensive control. An earlier report assessing the effects of various blood pressure medications on diabetic retinopathy had suggested that there might be a specific benefit of angiotensin-converting enzyme (ACE) inhibition, even in normotensive persons. The UKPDS included a randomized comparison of beta-blockers and ACE inhibitors within the more intensive blood pressure control arm. Benefit from more intensive blood pressure control was noted in both the beta-blocker and ACE inhibitor treatment groups, with no statistically significant difference between them, suggesting that the treatment effect was probably attributable to blood pressure reduction and not to a specific effect of ACE inhibition.
The ACCORD study attempted to extend the results of the UKPDS by assessing the effect of very tight blood pressure control on retinopathy. In this study, 4733 of the 10 251 participants with type 2 DM were randomly assigned to very intensive control of blood pressure (targeting a systolic blood pressure less than 120 mmHg) or standard blood pressure control (targeting a systolic blood pressure less than 140 mmHg). A subset of 1263 participants in the blood pressure trial was evaluated for progression of retinopathy just as in the glycemia arm of the study, with comparison of fundus photographs at baseline and 4 years.78 Rate of progression of retinopathy was not significantly different in the two groups (10.4% of those treated intensively compared with 8.8% of those treated with standard care, with an adjusted odds ratio of 1.23; 95% CI 0.84–1.79; P = 0.29). The results of the UKPDS and ACCORD study are not necessarily contradictory in this regard, given the very different targets used for more and less intensive control of blood pressure between the two trials.
Dyslipidemia
Elevated levels of plasma cholesterol were associated with greater severity of retinal hard exudates in the WESDR and in the ETRDS.81,82 Independent of coincident retinal thickening, the severity of retinal hard exudates at baseline was associated with decreased visual acuity in the ETDRS. The severity of retinal hard exudates was also a significant risk factor for moderate visual loss during the course of the study. Elevated levels of plasma triglycerides were associated with a greater risk of developing high-risk PDR in the ETDRS patients.83 Two recent randomized controlled clinical trials evaluating the plasma lipid-modulatory agent fenofibrate in combination with statins in individuals with elevated plasma lipids have demonstrated that fenofibrate reduces the risk of diabetic retinopathy progression while only providing modest alterations in the plasma lipid profile.78,84 It is presently uncertain whether the effects of fenofibrate on diabetic retinopathy are secondary to its plasma lipid-modulatory activity or to some other mechanism.
Other extraocular factors
Diabetic retinopathy can worsen precipitously in the setting of pregnancy. Chapter 92 (Pregnancy-related diseases) reviews the natural history of retinopathy in pregnancy. Diabetic nephropathy, as measured by albuminuria, proteinuria, or manifestations of renal failure, has been inconsistently associated with progression of retinopathy.83,85,86 Anemia has been associated with progression of diabetic retinopathy in two small case series and two epidemiologic studies.83,87–89 The ETDRS found association between decrease in hematocrit and increase in the incidence of high-risk PDR in an adjusted multivariate model. A few reports have suggested an association between diabetic neuropathy or cardiovascular autonomic neuropathy and progression of retinopathy.83,90,91 Significant progress has been made in understanding the heritable contributions to the development of DM, particularly the type 1 form and certain familial and syndromic variants of the disease, but the identification of genetic risk factors for development and progression of diabetic retinopathy has been challenging. Chapter 46 (Diabetic retinopathy: Genetics and etiologic mechanisms) reviews our present knowledge about the genetics of diabetic retinopathy.
Ophthalmic evaluation
A comprehensive eye examination in a person with DM includes: measurement of visual acuity and intraocular pressure; evaluation of the anterior segment by slit-lamp biomicroscopy; gonioscopy when warranted (such as in the setting of elevated intraocular pressure, neovascularization of the iris, or glaucoma); and dilated funduscopic examination.92 Evaluation of the anterior segment prior to dilation of the pupil may allow visualization of neovascularization of the iris or anterior chamber angle not visible following mydriasis. Dilation of the pupil is important for adequate assessment of the posterior segment. In the absence of pupil dilation, only 50% of eyes are correctly diagnosed for the presence and severity of retinopathy.93
Ancillary ocular imaging
Fundus photography
Fundus photography is a valuable clinical tool for evaluating progression of retinopathy in individual patients and in participants in clinical trials. Photography is used in clinical practice to document the status of retinopathy and effects of treatment. Though not always as sensitive as ophthalmoscopy at detecting subtle features of diabetic retinopathy such as IRMA and early extraretinal neovascularization, photography can be useful in documenting certain findings in select patients. For example, it can be used to record the extent and distribution of hard exudates in DME, the extent of retinal alterations in severe NPDR, and the appearance of laser photocoagulation burns. Chapter 48 (Proliferative diabetic retinopathy) discusses its role in documenting the extent and characteristics of neovascularization, fibrous proliferation, and retinal traction. The development of digital systems capable of high-resolution images immediately accessible to the clinician has expanded the role of fundus photography in clinical practice, facilitating record-keeping, information-sharing among providers, and use of images as a teaching tool with patients.
Fluorescein angiography
Fluorescein angiography (FA), consisting of photography or videography of the fundus using cameras equipped with appropriate filters following intravenous injection of the hydrocarbon dye fluorescein sodium, has been used clinically in ophthalmology for over 40 years and is described in detail in Chapter 1 (Fluorescein angiography). FA has multiple uses in the clinical evaluation of diabetic retinopathy. Because intravenous injection of fluorescein sodium can be associated with life-threatening adverse reactions (with risk of death estimated at approximately 1/200 000),94 FA for evaluation of diabetic retinopathy is largely confined to settings in which important aspects of management hinge on the results of the test. FA has been used extensively for evaluation of diabetic retinopathy, and is not known to pose any special hazards in DM. Nephropathy or renal failure is not a contraindication to testing.95 In NPDR, FA is most commonly indicated for further characterization of DME diagnosed on ophthalmoscopy (Fig. 47.2), and its utility in this setting is discussed below in the section “Clinical evaluation of diabetic macular edema.”
Commonly used grading systems for severity of diabetic retinopathy do not consider findings on FA, and FA is not indicated for classification of disease. While FA is a sensitive means for detection of early features of NPDR such as microaneurysms and retinal capillary hyperpermeability, it is not clinically indicated to screen for mild retinopathy.92
Optical coherence tomography
Optical coherence tomography (OCT), which utilizes low-coherence interferometry involving near-infrared light for cross-sectional imaging of intraocular structures, has emerged over the last decade as a fast, noninvasive means of imaging the retina, vitreoretinal interface, and the retinal pigment epithelium (RPE) in NPDR and other macular diseases. The basic principles of OCT and the applications of this technology to evaluation of the retina are discussed in Chapter 3 (Optical coherence tomography). In NPDR, OCT is commonly used to characterize DME (Fig. 47.3) and abnormalities of the vitreoretinal interface.
Fig. 47.3 OCT characterization of macular thickening in NPDR and DME. (A) A 6 mm horizontal line scan obtained with a spectral domain OCT system (Cirrus, Carl Zeiss Meditec, Dublin, CA) imaging the macula of the eye illustrated in Fig. 47.2 shows mild retinal thickening temporally, corresponding to the area of microaneurysms leaking on FA. (B) The retinal thickness map generated by automated segmentation of a 6×6 mm 512×128 Macular Cube scan shows mean thickness values for nine standard subfields. Mean thickness is greater than in 99% of normals in the central and inner temporal subfields (shaded purple) and greater than in 95% of normals in the outer temporal subfield (shaded red), based on a comparison to data in the Cirrus normative database.
(National Eye Institute, Bethesda, MD.)
Investigators of the Diabetic Retinopathy Clinical Research Network (DRCR.net),96 a collaborative network of over 100 sites in the United States dedicated to multicenter clinical research of diabetic retinopathy, have rigorously evaluated OCT as a test yielding measures of macular thickness in diabetic eyes. The standardization required for DRCR.net clinical trials has necessitated use of a common OCT platform and scanning technique. OCT scanning in DRCR.net studies to date involves acquisition of images of the macula by certified operators after pupil dilation, with use of a time-domain system called the Stratus OCT (Carl Zeiss Meditec, Inc., Dublin, CA) and a scanning algorithm known as the fast macular thickness map, which obtains 128 axial scans (A scans) along each of six radial lines (each 6 mm in length) intersecting at a common center, with a total scan time of 1.9 seconds. Stratus processing software includes an automated segmentation algorithm that identifies an inner and outer retinal border on line scans and calculates retinal thickness. A retinal thickness map is generated using data from all line scans obtained by the scanning algorithm. Output includes center-point thickness, total macular volume, and mean values for retinal thickness in a grid comprised of a central subfield, four inner subfields, and four outer subfields. Assessment of the quality of output depends on assessment of other parameters such as signal strength and standard deviation of center-point thickness. Software offers a comparison of thickness values to those from a normative database of measurements obtained from normal individuals.
DRCR.net investigators compared central subfield mean thickness (CSMT) values in 97 diabetics with minimal or no retinopathy and no central macular thickening on examination to normal values for nondiabetics in the Stratus OCT database.97 Results showed no significant difference between CSMT of diabetic eyes with minimal or no retinopathy and normal values imputed from nondiabetic individuals in the database, suggesting that the presence of DM is not associated with clinically important changes in CSMT in the absence of retinopathy. The study noted a statistically significant difference between CSMT in men and women, similar to findings in other reports.
DRCR.net investigators evaluated the reproducibility of OCT in eyes with DME, and established thresholds indicative of meaningful change in retinal thickness. In a prospective multicenter one-day study evaluating diurnal variation of DME, 212 eyes of 107 participants with DME involving the foveal center on biomicroscopy and CSMT of 225 microns or greater were imaged multiple times on Stratus OCT and the scans were evaluated by a reading center.98 Both eyes were imaged six times during the day, and at each of these six sittings a pair of scans was generated, with repeat imaging done for scans of suboptimal quality. Of a possible 1284 pairs, 1223 were analyzed. Reproducibility was better for CSMT than for center-point thickness, not surprising considering that CSMT incorporates more data points. The median absolute difference between replicate measurements of CSMT was 7 µm. Expressed as a percentage difference between the two measurements, the half-width of the 95% CI for a change in retinal thickness for CSMT was 10% for eyes with CSMT less than 400 µm, and 13% for eyes with CSMT equal to or greater than 400µm. The authors concluded that a change in CSMT greater than 11% using the Stratus OCT for DME is likely to be real.
The rapid pace of technological progress, resulting in recent improvements such as spectral domain imaging and image-registration capability in some systems, makes for substantial variability in image acquisition, processing, and output metrics among presently available OCT platforms. For example, the spectral domain Cirrus OCT (Carl Zeiss Meditec, Dublin, CA), though its output is similar in many ways to that of the time domain Stratus OCT, uses a distinct automated segmentation algorithm that results in retinal thickness values that are approximately 30–55µm greater than those reported by the Stratus OCT in eyes with DME.99 Meaningful interpretation of an OCT scan requires familiarity with the system utilized, including understanding of scan acquisition, indicators of scan quality, processing of raw data, algorithms for automated segmentation, and format of output metrics, as well as knowledge of any normative database used by system software to compare a given set of measurements to a normal range. Caution is warranted in comparing OCT scans obtained using different systems, and clinical researchers using OCT must grapple with such issues in planning studies that require standardization of procedures among clinical sites. The DRCR.net is presently evaluating issues related to integrating new OCT systems into future research studies.
Funduscopic lesions of nonproliferative diabetic retinopathy
Small or nonperfused microaneurysms may not be discernible on ophthalmoscopy, but those that are visible appear as small deep-red dots between 25 and 100µm in diameter within the retina (see Figs 47.2A, 47.4). Microaneurysms in NPDR typically arise in the posterior pole, but they can also be present in the midperipheral and peripheral retina, particularly in more severe retinopathy. They may be solitary or may appear in clusters. They may remain stable across months or even years, but many appear and eventually disappear. On FA, microaneurysms are visible during arteriovenous transit as hyperfluorescent dots within the retina (see Fig. 47.2B). This hyperfluorescence typically persists in later phases of the angiogram, and may or may not be associated with leakage in mid- and late frames (see Fig. 47.2C). FA is a sensitive means of detecting microaneurysms, and may reveal lesions that were poorly visible or not visible on ophthalmoscopy.
Intraretinal hemorrhages in NPDR are variable in appearance, just as in other retinal diseases (Figs 47.2A, 47.4). Dot-blot hemorrhages are typically small with sharply demarcated borders, and are sometimes indistinguishable from microaneurysms on ophthalmoscopy. Flame hemorrhages can be larger, and manifest wispy margins as a consequence of their location in the nerve fiber layer. Intraretinal hemorrhages appear hypofluorescent on FA, blocking normal fluorescence from the underlying choroid, and consequently FA offers ready distinction between microaneurysms and hemorrhages (Fig. 47.2B). Intraretinal hemorrhages can be present in the posterior pole and in more peripheral retina, and frequently appear and disappear over weeks or months. Hemorrhages on the optic disc are not typical for diabetic retinopathy, and should raise suspicion for neovascularization or a comorbid condition affecting the optic nerve head. Variability in the density of hemorrhages between one sector of the retina and another is common, but striking asymmetry sometimes suggests a superimposed process such as a branch retinal vein occlusion.
Hard exudates are visible on ophthalmoscopy as sharply demarcated yellow-white deposits within the retina (Figs 47.2A, 47.5). They are visible on OCT line scans as hyperreflective foci within the retina. With stereoscopic viewing they are readily distinguishable from drusen, which reside external to the retina. Hard exudates are often distributed at the border between edematous and nonedematous retina. They may form a circinate ring around areas of prominent vascular hyperpermeability such as a cluster of microaneurysms. They tend to form in the posterior pole in association with macular thickening, but small collections are sometimes present in more peripheral retina. They are hypofluorescent on FA, blocking underlying choroidal fluorescence (see Fig. 47.2B). Hard exudates may appear and disappear over months or years. When severe, they may undergo organization and may cause subretinal fibrosis.
Cotton-wool spots, patches of relative ischemia affecting the nerve fiber layer of the retina, are visible on ophthalmoscopy as small white patches with wispy borders situated in the inner retina (Fig. 47.6). They are hypofluorescent on FA, blocking underlying choroidal fluorescence. They commonly appear and disappear over weeks or months.
The major retinal vessels can exhibit changes in appearance in the setting of advanced retinopathy. Arterioles may appear thin or white. Venules may appear dilated and tortuous. Venous loops are occasionally present. Venous beading consists of localized areas of change in vessel caliber, visible as alternating regions of relative dilation and constriction (Fig. 47.7).
Intraretinal microvascular abnormalities (IRMA) appear as segments of dilated and tortuous retinal vasculature amidst retinal vessels that are normally too small to be visible on ophthalmoscopy (see Fig. 47.6). They are usually readily distinguishable from extraretinal neovascularization on careful biomicroscopy. On FA they appear hyperfluorescent during the arteriovenous transit phase, may leak in later phases, and are often situated at the borders of areas of capillary nonperfusion. They may persist for months or years.
Classification of diabetic retinopathy
The Diabetic Retinopathy Study, a landmark clinical trial that established the efficacy of scatter laser photocoagulation for reduction of severe vision loss secondary to PDR, used an adaptation of the Airlie House classification of diabetic retinopathy originally developed in 1968.100 This modified Airlie House system was extended for grading severity of retinopathy in the ETDRS.101 Grading of retinopathy in the ETDRS involved evaluation of seven-field 30-degree nonsimultaneous stereo color fundus photographs by trained readers. Over 30 characteristics were separately graded, using standard photographs to define thresholds for scoring (see Figs 47.4, 47.5, 47.6, 47.7 for some of the standard photographs utilized in the system), and a summary grade was assigned. The ETDRS diabetic retinopathy severity scale was evaluated for its reproducibility as part of the study and was validated as a grading system with prognostic power.101–103 ETDRS investigators assigned thresholds to define mild NPDR, moderate NPDR, severe NPDR, early PDR, and high-risk PDR (Box 47.1). The 5-year rates of development of high-risk PDR in eyes randomly assigned to deferral of photocoagulation (no laser treatment unless features of high-risk PDR developed) for eyes with mild, moderate, and severe NPDR at baseline were 15.5%, 26.5%, and 56%, respectively.
Box 47.1
Classification of diabetic retinopathy in the ETDRS
At least one microaneurysm, AND criteria not met for more severe retinopathy.
Hemorrhages/microaneurysms ≥ standard photograph 2A (Fig. 47.4); AND/OR cotton-wool spots, venous beading, or IRMA definitely present; AND criteria not met for more severe retinopathy
Cotton-wool spots, venous beading, and IRMA definitely present in at least two of photographic fields 4 to 7; OR two of the three preceding features present in at least two of fields 4 to 7 and hemorrhages/microaneurysms present in fields 4 to 7 ≥ standard photograph 2A (Fig. 47.4) in at least one of them; OR IRMA present in each of fields 4 to 7 and ≥ standard photograph 8A (Fig. 47.6) in at least two of them; AND criteria not met for more severe retinopathy.
New vessels; AND criteria not met for high-risk PDR.
New vessels on or within one disc diameter of the optic disc (neovascularization of the disc [NVD]) ≥ standard photograph 10A (approximately 1/4 to 1/3 disc area) with or without vitreous or preretinal hemorrhage; OR vitreous and/or preretinal hemorrhage accompanied by new vessels, either NVD < standard photograph 10A or new vessels elsewhere (NVE) ≥ 1/4 disc area.
Grading and classification of retinopathy in the ETDRS involved evaluation of modified Airlie House seven-field 30-degree non-simultaneous stereo color fundus photographs by trained readers. Photographic fields 4 and 6 image superior retina and are tangential to both a vertical line through the center of the optic disc and a horizontal line crossing its superior border. Photographic fields 5 and 7 image inferior retina and are tangential to both a vertical line through the center of the optic disc and a horizontal line crossing its inferior border. A set of standard photographs was used to define thresholds for grading and classification (see Figs 47.3, 47.4, 47.5, 47.6 for some of the standard photographs utilized in the system).
The prognostic utility of a 1-step or a 2-or-greater-step progression in the ETDRS diabetic retinopathy severity scale has been evaluated using data from the WESDR.104 Findings indicated that 1-step or 2-or-greater-step worsening in level of retinopathy over 4 years strongly predicted the development of PDR during the subsequent 6 years. The ETDRS diabetic retinopathy severity scale remains the standard for photographic grading of retinopathy in clinical trials. The schema is impractical for routine clinical use because of its complexity and its basis in photographic – not ophthalmoscopic – assessment of the fundus, but the ETDRS definitions for mild, moderate, and severe NPDR and early and high-risk PDR were incorporated into clinical practice. A 4–2–1 rule was popularized to simplify the definition of severe NPDR.105 Upon examination of the four midperipheral quadrants of the retina, the presence of any one of the following features was considered sufficient for diagnosis of severe NPDR (in the absence of evidence for PDR): (1) severe intraretinal hemorrhages and microaneurysms in all four quadrants (≥ standard photograph 2A [see Fig. 47.4]); (2) venous beading in two or more quadrants; or (3) moderate IRMA in at least one quadrant (≥ standard photograph 8A [see Fig. 47.6]). If any two of these features were present, the retinopathy was considered very severe. It is worth pointing out that the 4–2–1 rule uses a threshold for definition of severe NPDR inclusive of milder retinopathy than the definition of severe NPDR used in the ETDRS.
In answer to the need for a simplified classification of diabetic retinopathy to facilitate communication among clinicians worldwide, the Global Diabetic Retinopathy Project Group published proposed International Clinical Diabetic Retinopathy and Diabetic Macular Edema Severity Scales in 2003 (Table 47.1).106 The classification was developed using evidence from studies such as the ETDRS and WESDR to draw distinctions in retinopathy severity most important for prognosis and management, and approximates the definitions used in the ETDRS.
Table 47.1 Disease severity scales for diabetic retinopathy and diabetic macular edema
| Proposed disease severity level | Findings observable on dilated ophthalmoscopy |
|---|---|
| No apparent retinopathy | No abnormalities |
| Mild NPDR | Microaneurysms only |
| Moderate NPDR | More than just microaneurysms but less than severe NPDR |
| Severe NPDR |
DME is defined as retinal thickening, assessed by stereoscopic evaluation of the fundus by slit-lamp biomicroscopy or assessment of photographs. Hard exudates are a sign of present or past retinal thickening.
(Adapted with permission from Wilkinson CP, Ferris FL 3rd, Klein RE, et al. Proposed international clinical diabetic retinopathy and diabetic macular edema disease severity scales. Ophthalmology 2003;110:1677–82.)
Clinical evaluation of diabetic macular edema
Distribution of retinal thickening and hard exudates
The ETDRS defined clinically significant macular edema (CSME) as any of the following noted on biomicroscopy: (1) thickening of the retina at or within 500 µm of the center of the macula; (2) hard exudates at or within 500 µm of the center of the macula, if associated with thickening of the adjacent retina (not residual hard exudates remaining after the disappearance of retinal thickening); or (3) a zone or zones of retinal thickening one disc area or larger, any part of which is within one disc diameter of the center of the macula.38
The definition for CSME was based on observation that retinal thickening or hard exudation involving or threatening the fovea frequently leads to vision loss. Careful assessment of the distribution of retinal thickening and hard exudates and their relation to the center of the macula remains paramount to management of DME. Severity of DME in the International Clinical Diabetic Macular Edema Disease Severity Scale is based solely on whether retinal thickening and hard exudates involve or threaten the center of the macula, reflecting the importance of foveal involvement for prognosis and management.106
While diagnosis on biomicroscopic examination remains the clinical standard for detection of DME, OCT is increasingly used as a fast and noninvasive tool to quantitatively map areas of macular thickening (see Fig. 47.3). Subtle changes in distribution of thickening over time and relationship to the fovea can be documented with good-quality scans that serially image the same region of the macula (Fig. 47.8). The standardization afforded by OCT has proven valuable in clinical practice and in research. Hard exudates can be visualized on OCT as hyperreflective foci within the retina, but biomicroscopic examination and fundus photography remain important to document their extent and proximity to the fovea.
Magnitude of retinal thickening
The degree of thickening at any given point in the retina has traditionally been estimated on biomicroscopy and stereoscopic photographs, but OCT has recently emerged as a superior means of quantifying retinal thickness. The sensitivity of OCT for retinal thickening exceeds that of contact lens-assisted biomicroscopy performed by experienced examiners.107 Correlation between the estimated degree of retinal thickening at the center of the macula on stereoscopic photographs and the center-point thickness measured on time domain OCT is modest, reflecting the limitations of grading retinal thickness on photographs.108
OCT processing yields several metrics useful in characterizing the thickness of the retina in DME. For example, the Stratus OCT used by DRCR.net sites calculates a center-point thickness, CSMT, inner and outer subfield mean thicknesses, and macular volume for commonly used scanning algorithms. A DRCR.net study concluded that CSMT is well suited as a metric for central macular thickness in clinical research, with high reproducibility and good correlation to other metrics in the setting of DME.109 Mean thickness in other subfields and total macular volume are useful in assessing extrafoveal macular edema.
OCT is capable of detecting areas of subtle macular edema that are sometimes not suspected on ophthalmoscopy (Fig. 47.8B). Easy detection of such “subclinical” thickening has added a new and provocative facet to management of DME, challenging clinicians to incorporate knowledge of more mild pathology into clinical decision-making. Conversely, OCT can illustrate areas of retinal thinning that sometimes result from advanced retinopathy. Occasionally, the presence of mild macular edema in retina that would be thinner than normal in the absence of such edema can result in a retinal thickness that appears “normal” relative to typical thickness in diabetics without retinopathy. Such abnormal thickening of retina that would otherwise be abnormally thin can make it challenging to define what constitutes complete resolution of macular edema in some eyes.
