Noninvasive Respiratory Monitoring
Advances in respiratory monitoring continue to occur in terms of technological improvements and in enhancing current understanding of the pathophysiology of respiratory failure.1 It is estimated that 20% to 40% of patients in intensive care units (ICUs) are admitted solely for the purposes of monitoring and do not receive any treatment that is unique to the ICU.2
Gas Exchange
The human eye is poor at recognizing hypoxemia.3,4 With the availability of pulse oximetry, episodic hypoxemia has been found to be more common than was previously suspected, with an incidence ranging from 20% to 82%.5 Patients experiencing hypoxemia have a threefold higher risk of death compared with patients who do not display desaturations.6 Whether earlier detection and treatment of episodic hypoxemia can affect patient outcome is not known.
Pulse Oximetry
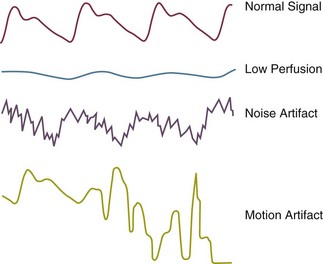
Pulse oximeters determine oxygen (O2) saturation by measuring light absorption of arterial blood at two specific wavelengths, 660 nm (red) and 940 nm (infrared).7,8 The ratio of absorbencies at these two wavelengths is calibrated empirically against direct measurements of arterial blood oxygen saturation (SaO2), and the resulting calibration algorithm is used to generate the pulse oximeter’s estimate of arterial saturation (SpO2).9 In addition to the digital readout of O2 saturation, most pulse oximeters display a plethysmographic waveform, which can help clinicians distinguish an artifactual signal from the true signal (Fig. 13.1).
Accuracy
The accuracy of commercially available oximeters in critically ill patients has been validated in several studies.10 Compared with the measurement standard (multiwavelength oximeter), pulse oximeters have a mean difference (bias) of less than 1% and a standard deviation (precision) of less than 2% when SaO2 is 90% or above.8 Although pulse oximetry is accurate in reflecting one-point measurements of SaO2, it does not reliably predict changes in SaO2. In 1085 simultaneous measurements of SaO2 and SpO2 in 41 ICU patients, changes in SaO2 correlated moderately with changes in SpO2 (r = 0.6), and the pulse oximeter tended to overestimate actual changes in SaO2.11
The accuracy of pulse oximeters deteriorates when SaO2 falls to 80% or less.12 In critically ill patients, poor agreement between the oximeter and a CO-oximeter was observed, with bias ranging from −12% to 18%; and oximetry tended to systematically underestimate SaO2 when it was less than 80%.13
Limitations
Oximeters have a number of limitations that may lead to inaccurate readings (Box 13.1). Pulse oximeters measure SaO2, which is physiologically related to arterial oxygen tension (PaO2) according to the O2 dissociation curve. Because the dissociation curve has a sigmoid shape, oximetry is relatively insensitive in detecting hypoxemia in patients with high baseline levels of PaO2.8,14
Pulse oximeters use only two wavelengths of light; accordingly, they can discriminiate only two substances, oxyhemoglobin and reduced hemoglobin. Elevated carboxyhemoglobin and methemoglobin levels can therefore cause inaccurate oximetry readings.15–18 Anemia does not appear to affect the accuracy of pulse oximetry.19,20
Intravenous dyes such as methylene blue, indocyanine green, and indigo carmine can cause falsely low SpO2 readings, an effect that persists for up to 20 minutes.20 In critically ill patients requiring mechanical ventilation, nail polish—blue, white, purple, and black—has been shown not to affect the accuracy of SpO2 readings;21 acrylic nails, however, may interfere with readings.22 Falsely low and falsely high SpO2 readings occur with fluorescent and xenon arc surgical lamps.23
Skin pigmentation can affect the accuracy of pulse oximetry.24,25 In critically ill patients,12 bias plus precision was greater in black patients, 3.3 + 2.7%, than in white patients, 2.2 + 1.8%; also, a bias greater than 4% occurred more frequently in black patients (27%) than in white patients (11%).
Low-perfusion states, such as low cardiac output, vasoconstriction, and hypothermia, may impair peripheral perfusion, making it difficult for a sensor to distinguish a true signal from background noise. In patients experiencing hypothermia and poor perfusion during cardiac surgery, only 2 of 20 oximeters (Criticare CSI 503, Datex Satlite, Helsinki, Finland) provided measurements within +4% of the CO-oximeter value.26 Measurements of SpO2 with a Biox 3700 oximeter had an associated bias greater than ±4% in 37% of patients receiving vasoactive therapy.27
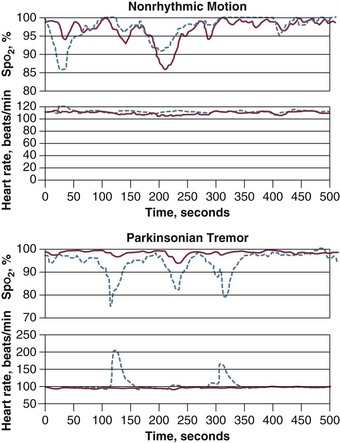
Motion artifact is a frustrating problem, and it results in inaccurate readings and false alarms. Patient motion is a common reason for temporary or definitive abandonment of pulse oximetry in a particular patient. An innovative technological approach, termed Masimo Signal Extraction Technology (SET), was introduced to extract the true signal from artifact secondary to noise and low perfusion28 (Fig. 13.2).
In 18 healthy volunteers, investigators compared the latest generation of pulse oximeters—Masimo SET (Irvine, CA), Nellcor OxismartXL (Pleasanton, CA), Philips Medical Systems FAST-SpO2 (Andover, MA), Respironics Novametrix MARSpO2 (Wallingford, CT), and Siemens Oxisure (Danvers, MA)—with an older model, Nellcor N-200, under conditions of low perfusion and motion.10 Of the five new-generation oximeters, Masimo SET and Nellcor OxismartXL outperformed the other three devices in reducing nuisance alarms and ensuring alarm reliability. These two oximeters also were found to have better protection against light interference than the other three devices.
Despite their popularity for continuous monitoring of O2 saturation, pulse oximeters fail to provide valid data in a variety of settings.29–31 In a prospective study in ICU patients, SpO2 signals accounted for almost half of a total of 2525 false alarms.32 In 235 surgical ICU patients, a study revealed that false alarms from the pulse oximeter were secondary to low perfusion (21%), cardiac arrhythmias (9%), motion artifacts (8.4%), shivering (1.7%), and extubation (1.7%).33
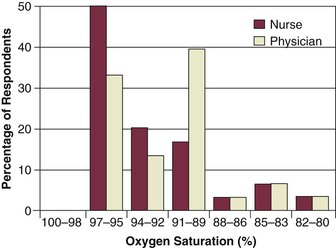
An underrecognized and worrisome problem with pulse oximetry is that many users have a limited understanding of how the oximeter functions and the implications of the measurements obtained. One survey revealed that 30% of physicians and 93% of nurses thought that the oximeter measured PaO2. Some clinicians did not recognize that SpO2 values in the high 80s represent seriously low values of PaO2. Of special concern was the observation that some doctors and nurses were not especially worried about patients with SpO2 values as low as 80% (equivalent to PaO2 less than 45 mm Hg)34 (Fig. 13.3). Another audit demonstrated that fewer than 50% of nurses and physicians were able to identify that motion artifact and arrhythmias can affect the accuracy of pulse oximetry.35
Clinical Applications
With the introduction of pulse oximetry, hypoxemia (defined as an SpO2 value less than 90%) is now detected more often in critically ill patients.36 Changes in SpO2 may not accurately reflect changes in PaO2. Accordingly, caution is required in clinical decision making in critically ill patients based solely on pulse oximetry. Although pulse oximetry is a suitable way of measuring arterial oxygenation, it does not assess ventilation. Indeed, measurements of SpO2 have been shown to be inaccurate in assessing abnormal pulmonary gas exchange, defined as an elevated alveolar-arterial O2 difference.5
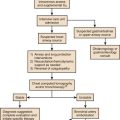
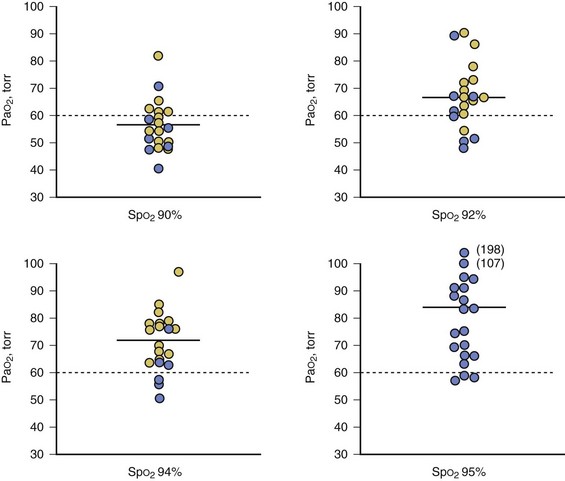
Pulse oximetry can assist with titration of fractional inspired oxygen concentration (FIO2) in ventilator-dependent patients, although the appropriate SpO2 target depends on a patient’s pigmentation.12 The SpO2 target value that predicts a satisfactory level of oxygenation is 92% in white patients and 95% in black patients (Fig. 13.4).
Pulse oximetry has been evaluated as a means of screening for respiratory failure in patients with severe asthma.37 Respiratory failure was unlikely in patients with SpO2 greater than 92%. Of interest, this threshold value of 92% is the same target value that reliably predicted a satisfactory level of oxygenation during titration of FIO2 in ventilator-dependent patients.12
The use of pulse oximetry compared with other vital signs in predicting hospital complications from pulmonary embolus has been investigated.38 In 207 patients with documented pulmonary embolism, a room-air SpO2 value obtained in the emergency department was the most important predictor of death: the mortality rate was 2% in patients with SpO2 95% or greater versus 20% with SpO2 less than 95%. When the threshold value was prospectively evaluated in 119 patients, in 10 of whom hospital complications developed, SpO2 less than 95% had a sensitivity of 90%, specificity of 64%, and overall diagnostic accuracy of 67%. Although the number of patients with complications was low, these data suggest that pulse oximetry may be useful in predicting outcome in patients with pulmonary embolus.
Moller and associates39 conducted the first prospective, randomized study of pulse oximetry on the outcome of anesthesia care in 20,802 surgical patients. Detection of hypoxemia (defined as an SpO2 less than 90%) was 19-fold higher in the oximeter group than in the control group. Myocardial ischemia was more common in the control group than in the oximetry group, occurring in 26 and 12 patients, respectively. Pulse oximetry, however, did not decrease the rate of postoperative complications or mortality.
The lack of proven efficacy of pulse oximetry in the study of Moller and associates39 was related to the sample size. These investigators concluded that it would take at least 500,000 patients to show a reduction in a rare event such as myocardial infarction and 1.9 million patients to show a reduction in anesthesia-related deaths. When anesthesiologists in the study were surveyed,40 80% of them reported feeling more secure when they used a pulse oximeter. Of 104 anesthesiologists, 19 believed that the pulse oximeter helped them avoid serious complications (such as esophageal intubation, tracheal tube disconnection or displacement, anesthesia machine failure, and respiratory problems immediately after extubation). It is this mindset that has established pulse oximetry as an essential component of the standard of care despite a failure to achieve a level of proven efficacy with a p value of less than 0.05. The lack of concurrence between randomized trial proof of efficacy of pulse oximetry and its requirement as part of the standard of care has major ramifications for all monitoring techniques.1
Cost Effectiveness
Studies evaluating the cost effectiveness of pulse oximetry have reported that fewer arterial blood gas (ABG) samples were obtained if SpO2 data were available to the caregivers.41–43 The effect of implementing pulse oximetry in an ICU without any specific plan for its appropriate use was examined in 148 patients before the implementation of oximetry and 141 patients after its implementation.44 The number of ABG samples decreased from 7.2 to 6.4 per patient per day—a reduction of only 10.3%, compared with average reductions of 39% in the previous studies.5 This suggests that without explicit guidelines, the pulse oximeter was used in addition to, rather than instead of, blood gas sampling.
Transcutaneous Blood Gas Monitoring
Transcutaneous measurements of O2 tension (PtcO2) are made by placing a heated Clark polarographic electrode directly on the skin and measuring the O2 that diffuses from the blood to the skin.45 This technique more commonly is used by neonatologists because neonatal skin is thin, so PtcO2 values approximate PaO2 values. In a multicenter study including 251 patients of various ages (range, 4 weeks to 60 years), the PtcO2/PaO2 ratio was 1.05 in neonates and 0.93 in older patients when PaO2 was less than 80 mm Hg. This ratio, however, decreased to 0.88 in neonates and 0.74 in older patients when the PaO2 was greater than 80 mm Hg.46 During low-perfusion states, PtcO2 measurements do not reflect changes in PaO2. In critically ill patients, the PtcO2/PaO2 ratio decreased from 0.79 ± 0.125 when the cardiac index was greater than 2.2 L/minute/m2 to 0.12 ± 12 when the cardiac index was less than 1.5 L/minute/m2.47
Transcutaneous monitoring of the partial pressure of carbon dioxide (PtcCO2) can be performed using a modified Severinghaus electrode. The underlying skin is heated to 44° C to enhance CO2 diffusion through the skin. Heating also increases the local production of CO2, with the result that transcutaneous PCO2 values usually are higher than arterial PCO2 (PaCO2) values.47 Because of greater diffusibility of CO2 compared with O2 through the skin, the correlation of PtcCO2 with PaCO2 usually is good: r = 0.93.46
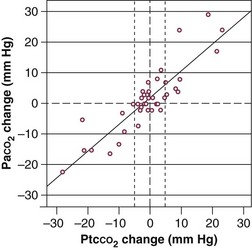
The accuracy of PtcCO2 as a surrogate measure for PaCO2 was evaluated in 50 critically ill patients in a medical ICU.48 Of the 189 paired measures of PCO2 obtained, 21 were excluded from analysis because of profound skin vasoconstriction. Of the available 168 measurements, mean difference between PaCO2 and PtcCO2 was −0.2 ± 4.6 mm Hg; correlation between two measurements was 0.92. A strong correlation was observed between changes in PaCO2 and PtcCO2 (r2 = 0.78) (Fig. 13.5). These data suggest that transcutaneous PCO2 may be reliable in monitoring changes in PaCO2, provided that no major vasoconstriction is present.
Capnography
The carbon dioxide concentration at the end of a tidal breath—end-tidal CO2—can be employed as a continuous, indirect measure of PaCO2. In intubated patients with respiratory failure, correlation between end-tidal CO2 and PaCO2 was good (r = 0.78).49 The correlation between changes in end-tidal CO2 and changes in PaCO2 from baseline, however, was considerably weaker (r = 0.58). Change in end-tidal CO2 incorrectly indicated the direction of change in PaCO2 in 43% of patients being weaned from mechanical ventilation after cardiac surgery.50
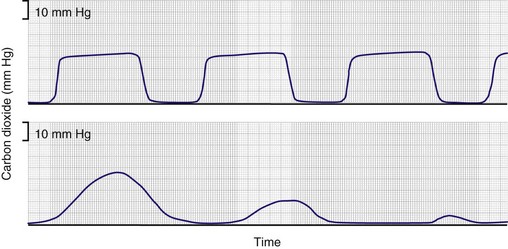
Capnometry commonly is used in detecting esophageal intubation51–53 (Fig. 13.6). When the trachea of a patient with an intact pulmonary circulation is intubated, end-tidal CO2 is recorded. When, however, the endotracheal tube is erroneously placed in the esophagus, end-tidal CO2 will be zero. Monitoring of end-tidal CO2 has been compared with three other methods—auscultation, negative-pressure testing using a self-inflating bulb, and transillumination—for verifying tracheal tube placement.54 Monitoring of end-tidal CO2 was found to be the most reliable.
Respiratory Neuromuscular Function
Airway Occlusion Pressure
Measuring airway pressure 0.1 second after initiation of an inspiratory effort against airway occlusion (P0.1) provides a measure of respiratory drive. In ventilator-dependent patients, P0.1 has been shown to correlate significantly with the work of breathing during pressure-support ventilation (r = 0.87).55 By taking advantage of the decrease in airway pressure to open the demand valve during triggering, investigators have demonstrated that commercially available ventilators can measure P0.1 accurately.56 Several studies56–58 have indicated that an elevated P0.1 predicted weaning failure, but the threshold separating success from failure differed among the studies.59
Maximal Inspiratory Airway Pressure
Maximum inspiratory pressure (Pimax), a global measure of inspiratory muscle strength, is measured using a one-way valve that allows exhalation but prevents inhalation.60,61 Pimax is one of the standard measurements employed to determine a need for the continuation of mechanical ventilation. Values that are more negative than −30 cm H2O are considered to predict weaning success; values that are less negative than −20 cm H2O are predictive of weaning failure. These criteria, however, frequently are falsely positive and falsely negative.62
Breathing Pattern
Rapid shallow breathing is a common respiratory pattern in patients who fail a trial of weaning from mechanical ventilation,63 and this can be quantitated in terms of the frequency–to–tidal volume ratio (f/VT). The higher the f/VT, the more pronounced the rapid, shallow breathing and the greater the likelihood of unsuccessful weaning. An f/VT above 100 breaths per minute per liter suggests that a trial of weaning is unlikely to be successful.62 When prospectively evaluated, f/VT was found to be superior to nine other weaning predictors: sensitivity was 0.97, specificity 0.64, positive predictive value 0.78, and negative predictive value 0.95.60
The usefulness of f/VT in predicting weaning outcome was challenged. Using a meta-analysis, an American College of Chest Physicians (ACCP) Task Force concluded that f/VT was unreliable.64,65 In their evaluation of published reports on f/VT, the Task Force ignored the important influence of pretest probability on the interpretation of test results. The implications of pretest probability are greater for weaning than for many clinical situations because weaning involves a sequence of three diagnostic tests: measurement of predictors, followed by a weaning trial, followed by an extubation trial. The undertaking of three diagnostic tests in a sequential manner poses an enormous risk for the occurrence of test referral and spectrum bias. The introductions of such biases will, in turn, increase the pretest probability.66,67 Indeed, the mean pretest probability of weaning success was 75% in the studies included in the meta-analysis. When data from studies included in the Task Force meta-analysis were entered into a bayesian model with pretest probability as the operating point, the observed post-test probabilities were closely correlated with the values predicted by the original study on f/VT: r = 0.86 for positive predictive value and r = 0.82 for negative predictive value.68
It has been suggested that measurements of f/VT at 30 minutes into a weaning trial more accurately predict outcome than measurements in the first minute.69,70 Although it is true that including data for the first 30 seconds or so may be unrepresentative, this does not mean that it takes 30 minutes to establish a steady state.
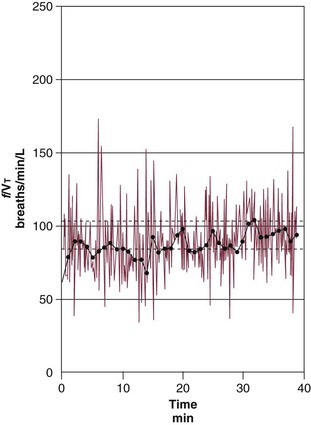
Jubran and colleagues70 studied the time required for f/VT to reach a point of equilibration in 17 weaning failure and 14 weaning success patients. The median time (plus interquartile range) to reach +10% of the final value of f/VT was 2 (1 to 2) minutes in both the weaning success and the weaning failure patients (Fig. 13.7). Within 2 minutes of the onset of the T-tube trial, 77% of the weaning failure patients and 73% of the weaning success patients had reached +10% of the final value of f/VT. As indicated by these data, a reasonable strategy is to commence measurement of f/VT at 60 seconds after removal of the ventilator and then continue the measurement for another 60 seconds.
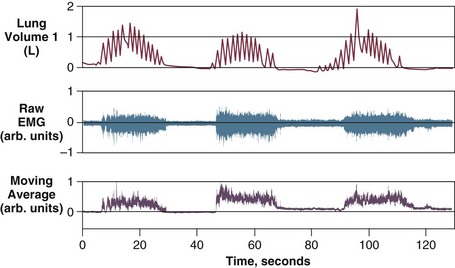
Continuous recording of breathing pattern provides an important approach for assessing the ability of the respiratory controller to maintain or adjust its response over time.71 Simple measurements, such as coefficients of variation, indicate that healthy subjects display considerable variation in tidal volume and respiratory cycle time from one breath to the next.72 Signal analysis techniques reveal that this variability is composed of random and nonrandom fractions.73–78 The predominantly random character of the variability makes it possible for the respiratory system to engage in tasks other than gas exchange. A smaller fraction of variability is nonrandom; moreover, tidal volume and respiratory cycle time of one breath are significantly related to those of the preceding breath.73,74,76,77 When healthy subjects are faced with external chemical or mechanical loads, however, the random fraction decreases significantly.74,76,77 This decrease in random variability may lessen the freedom of the respiratory system to undertake behavioral tasks.76,77,79
Using autocorrelation analysis and fast-Fourier transformation, Brack and associates80 showed that patients with restrictive lung disease display a marked decrease in breath-to-breath variability of breathing. The random fraction of variability was approximately  of that found in healthy subjects, and the nonrandom correlated fraction was as much as three times higher in the patients. Slight variations from the average resting tidal volume caused large increases in dyspnea in the patients, but not in the healthy subjects80 (Fig. 13.8). In patients undergoing a weaning trial, Wysocki and coworkers81 noted a higher gross variability of breathing (quantitated in terms of coefficient of variation) in patients who were successfully weaned than in patients who failed the trial. These data suggest that an increase in the ability to vary breathing may be associated with a favorable weaning outcome.82
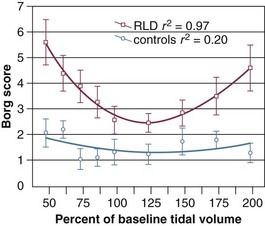
Figure 13.8 The relationship between variation in tidal volume and dyspnea (Borg score) in patients with restrictive lung disease and in control subjects. Dyspnea scores were higher in the patients than in the control subjects (P < 0.01, ANOVA); dyspnea varied with tracked volume in the patients (P < 0.05, ANOVA) but not in the control group. The regression between dyspnea and tidal volume was parabolic in the patients (y = 10.3 − 0.12x + 0.0005x2; P < 0.0001), but not in the control subjects (y = 2.76 − 0.02x + 0.00008x2; P = 0.5). Bars represent ± SEM. ANOVA, analysis of variance; SEM, standard error of the mean. (From Brack T, Jubran A, Tobin MJ: Dyspnea and decreased variability of breathing in patients with restrictive lung disease. Am J Respir Crit Care Med 2002;165:1260-1264).
Changes in End-Expiratory Lung Volume
Alterations in the end-expiratory level of signal from an inductive plethysmograph can provide a measurement of the change in functional residual capacity provided that motion artifact is absent83,84 (Fig. 13.9). Inductive plethysmography has been used to estimate a patient’s level of auto-PEEP (positive end-expiratory pressure).49 By noting the level of external PEEP at which end-expiratory lung volume increased, a close estimate of the patient’s original level of auto-PEEP can be obtained. An attractive feature of this technique is that it does not disturb expiration, unlike the occlusive technique, in which foreshortening of expiratory time is unavoidable.85
Respiratory Mechanics
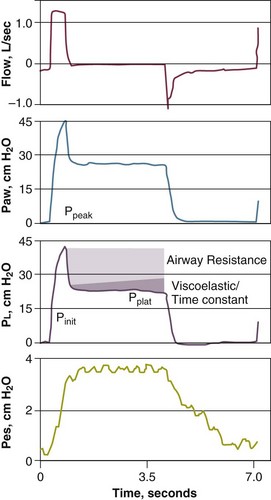
Measurements of respiratory mechanics in a relaxed ventilator-dependent patient can be obtained using the technique of rapid airway occlusion during constant-flow inflation.86 Rapid airway occlusion at the end of a passive inflation produces an immediate drop in both airway pressure (Paw) and transpulmonary pressure (PL) from a peak value (Ppeak) to a lower initial value (Pinit), followed by a gradual decrease until a plateau (Pplat) is achieved after 3 to 5 seconds87,88 (Fig. 13.10). Pplat on the Paw, PL, and Pes tracings represents the static end-inspiratory recoil pressure of the total respiratory system, lung, and chest wall, respectively.
Elastance (Compliance)
The end-inspiratory airway occlusion method is used clinically to measure the static compliance, or its reciprocal, elastance, of the respiratory system (Est,rs) according to the following equation89:
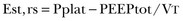
where Pplat is plateau pressure obtained after occlusion of the airway, PEEPtot is the sum of external and intrinsic PEEPs if present, and VT is tidal volume (see Fig. 13.10).
Mechanical ventilation in itself can produce or aggravate lung injury in patients with acute respiratory distress syndrome (ARDS).90–92 Injury may be decreased by minimizing alveolar overdistention. To avoid lung injury, ideally the alveolar volume should be monitored, but that is not possible. Alveolar volume is reflected by peak alveolar pressure, which can be assessed indirectly by measuring the plateau pressure during an end-inspiratory hold maneuver. It has been recommended that plateau pressure not exceed 32 cm H2O.93,94
A new era of ventilatory management began in 1990, when a report demonstrated that lowering tidal volume caused a 60% decrease in the expected mortality rate among patients with ARDS.95 Subsequently, randomized trials were undertaken.96–99 In 861 patients, the ARDS Network investigators reported a 22% difference in mortality rates with use of a tidal volume of 6 mL/kg versus 12 mL/kg.100 It is now generally accepted that the use of high tidal volumes in patients with ARDS is associated with high mortality rates.93,101 Whether the use of low tidal volumes implies a survival advantage is controversial.101–103
Pressure-Volume Curves
A pressure-volume curve of the respiratory system in a paralyzed patient can be constructed by measuring the airway pressure as the lungs are progressively inflated with a 1.5- to 2-L syringe. A lower inflection point and an upper inflection point may be seen on the pressure-volume curve.104 The lower inflection point is thought to reflect the point at which small airways or alveoli reopen, corresponding to closing volume. In patients with acute lung injury, investigators have recommended that PEEP be set at a pressure slightly above the lower inflection point.105
When an “open-lung approach,” consisting of use of a lower tidal volume (less than 6 mL/kg) with PEEP individually titrated to be consistently above the inflection point on the pressure-volume curve, was compared with a conventional approach, consisting of use of tidal volume of 12 mL/kg and a low PEEP level, the mortality rate was significantly reduced in the group managed with the new approach.96,106
A National Institutes of Health (NIH)-sponsored trial of high versus low PEEP, however, failed to demonstrate a significant survival advantage for patients randomized to the high PEEP group.107 Several methodologic considerations cast doubt on the conclusions of the investigators.108 First, baseline characteristics of the two groups were not balanced; the low PEEP group patients had higher PaO2/FIO2 ratios and were younger than patients in the high PEEP group. Second, PEEP-induced recruitment was estimated by improvement in oxygenation. It is well known that changes in oxygenation depend not only on recruitment but also on cardiac output.109 Thus, oxygenation may have improved without any lung recruitment. Third, recruitment potential was not stratified, so that patients who were not likely to benefit were assigned to both groups.110
The importance of individualizing PEEP in ventilator management in patients with ARDS was confirmed in a Spanish trial. One group of patients was randomized to a treatment group in which PEEP was titrated to 2 cm H2O above the lower inflection point. The mortality rate was lower in these patients than in control group patients who did not receive customized titration of PEEP.111
Resistance
Airway resistance can be measured in ventilator-dependent patients using the technique of rapid airway occlusion during constant-flow inflation86,87,89,112 (see Fig. 13.10).
Measurements of airway resistance are helpful in assessing the response of patients to bronchodilator therapy. In a study in ventilator-dependent patients with chronic obstructive pulmonary disease (COPD), a significant decrease in airway resistance occurred after giving 4 puffs, with no further effect after the addition of 8 and 16 puffs (cumulative doses of 12 and 28 puffs).113,114
Intrinsic Positive End-Expiratory Pressure
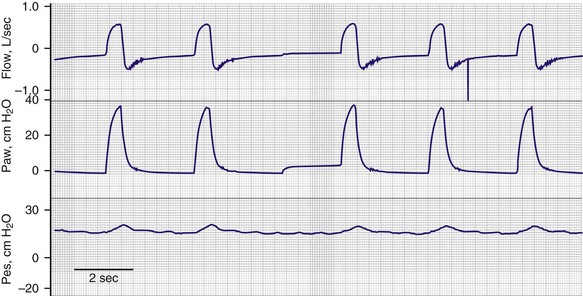
The static recoil pressure of the respiratory system at end-expiration may be elevated in patients receiving mechanical ventilation.89 This positive recoil pressure, or intrinsic PEEP (static PEEPi), can be quantified in relaxed patients using an end-expiratory hold maneuver on a mechanical ventilator immediately before the onset of the next breath11,115 (Fig. 13.11), or as a change in Paw required to reduce expiratory flow to zero and initiate lung inflation by the ventilator (dynamic PEEPi). In patients with COPD, dynamic PEEPi is lower than static PEEPi; this discrepancy is attributed to the presence of time-constant inequalities.116,117
PEEPi poses a significant inspiratory threshold load that has to be fully counterbalanced by increasing inspiratory muscle effort in order to generate a negative pressure in the central airway and trigger the ventilator. Thus, PEEPi adds to the triggering pressure such that the total inspiratory effort needed to trigger the ventilator is the set trigger sensitivity plus the level of PEEPi. This is one of the factors that may account for the not infrequent observation of a patient who is unable to trigger a ventilator despite obvious respiratory effort118–123 (Fig. 13.12).
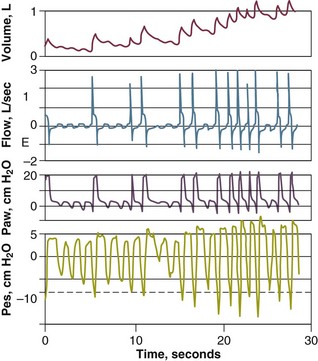
In a study of ventilator-dependent patients, Leung and colleagues120 reported that ineffective triggering occurred with all assisted modes of mechanical ventilation. The ineffective or wasted efforts were significantly related to resistance (r = 0.85), elastance (r = −0.61), and static PEEPi (r = 0.77). A decrease in the magnitude of inspiratory effort at a given level of assistance was not the cause—indeed, effort was 38% higher during nontriggering attempts than during the triggering phase of attempts that successfully opened the inspiratory valve. Significant differences, however, were observed in the breaths before the triggering and nontriggering attempts. Breaths before nontriggering attempts were associated with shorter respiratory cycle time and expiratory time and higher static PEEPi compared with the breaths before triggered attempts. These findings suggest that ineffective triggering resulted not from a decrease in the magnitude of effort but rather from inspiratory efforts that were premature and insufficient to overcome the elevated elastic recoil pressure associated with dynamic hyperinflation.
Airway Pressure Profile
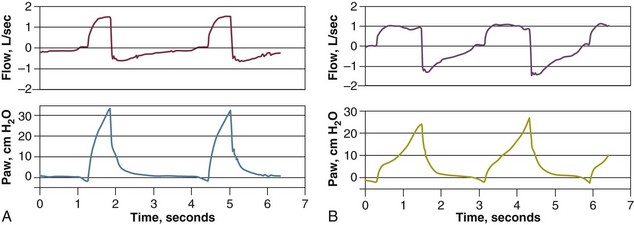
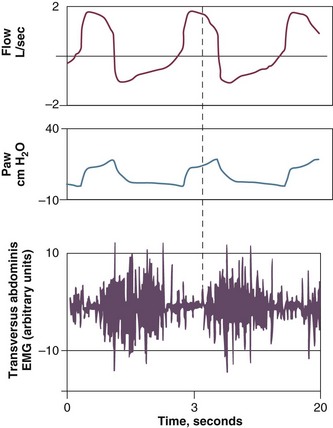
A continuous recording of airway pressure provides helpful information about the amount of respiratory work being performed by a patient receiving ventilator assistance. Ideally the waveform should show a smooth rise with a convex appearance during inspiration.1,124 By contrast, a prolonged negative phase with excessive scalloping of the tracing reflects increased inspiratory effort; this pattern indicates unsatisfactory sensitivity and inappropriate flow settings (Fig. 13.13). A “bump” on the airway pressure tracing observed while the ventilator is still pumping gas in the patient may reflect recruitment of expiratory muscles (Fig. 13.14).
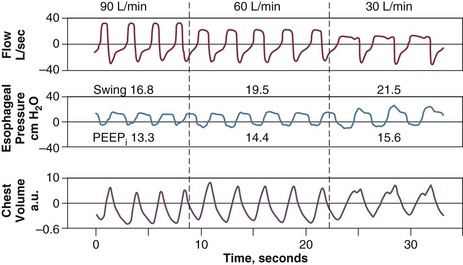
Use of a flow setting that does not meet a patient’s ventilatory demands will cause inspiratory effort to increase. Sometimes the flow is increased to shorten the inspiratory time and increase the expiratory time. An increase in flow, however, can cause immediate and persistent tachypnea; if this happens, the resulting decrease in expiratory time may lead to increased PEEPi.125,126 In general, however, an increase in inspiratory flow does not lead to an increase in PEEPi126 (Fig. 13.15).
Flow-Volume Curves
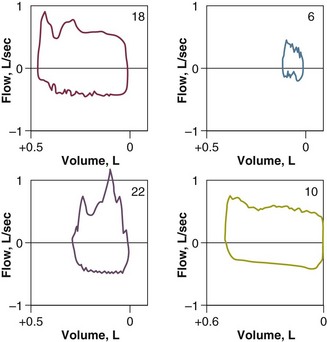
Flow-volume curves may be helpful in indicating a need for endotracheal suctioning. In 50 intubated patients, Jubran and Tobin127 found that the presence of a sawtooth pattern strongly suggested the presence of secretions (positive predictive value, 94%), and the absence of this pattern suggested that secretions are unlikely to be present (negative predictive value, 77%) (Fig. 13.16). Clinical examination had much higher false-positive and false-negative rates (42% and 43%, respectively) than the flow-volume curves (12% and 14%, respectively). The usefulness of a sawtooth pattern for detecting secretions was confirmed by Guglielminotti and colleagues128 in a study of 62 patients who were receiving pressure support or assist-control ventilation.
Key Points
• Roughly 20% to 40% of patients in an ICU are admitted mainly for the purpose of monitoring.
• Pulse oximetry can accurately measure oxygen saturation at levels of 90% or above; its accuracy deteriorates when the saturation falls to 80% or less.
• Inaccurate readings from pulse oximetry can occur as a result of interference from substances or from problems in signal processing.
• Hypoxemia is detected more frequently in patients monitored with pulse oximetry than in patients in whom this modality is not used.
• Transcutaneous monitoring of PCO2 may be reliable in monitoring changes in arterial PCO2 in the absence of major vasoconstriction.
• Measuring airway pressure at 0.1 second after initiating an inspiratory effort against an occluded airway is closely associated with increased work of breathing during mechanical ventilation.
• One-time measurements of breathing pattern (frequency and tidal volume) are helpful in predicting weaning outcome; continuous measurements of breathing pattern can provide information about the function of the respiratory controller.
• Measurements of respiratory mechanics in a ventilator-dependent patient can be easily performed at the bedside using the rapid airway occlusion technique.
• Continuous recordings of airway pressure can provide useful information about the respiratory work performed by a patient receiving mechanical ventilation.
• Flow-volume curves may be helpful in indicating a need for endotracheal suctioning.
References
1. Jubran, A, Tobin, MJ. Monitoring during mechanical ventilation. In: Tobin MJ, ed. Principles and Practice of Mechanical Ventilation. 3rd ed. New York: McGraw Hill; 2012:1136–1165.
2. Henning, RJ, McClish, D, Daly, B, et al. Clinical characteristics and resource utilization of ICU patients: Implications for organization of intensive care. Crit Care Med. 1987; 15:264–269.
3. Comroe, JH, Bothello, S. The unreliability of cyanosis in the recognition of arterial anoxemia. Am J Med Sci. 1947; 214:1–9.
4. Mower, WR, Sachs, C, Nicklin, EL, et al. Effect of routine emergency department triage pulse oximetry screening on medical management. Chest. 1995; 108:1297–1302.
5. Jubran, A. Pulse oximetry. In: Tobin MJ, ed. Principles and Practice of Intensive Care Monitoring. New York: McGraw-Hill; 1998:261–287.
6. Bowton, DL, Scuderi, PE, Haponik, EF. The incidence and effect on outcome of hypoxemia in hospitalized medical patients. Am J Med. 1994; 97:38–46.
7. Wukitisch, MW, Peterson, MT, Tobler, DR, Pologe, JA. Pulse oximetry: Analysis of theory, technology, and practice. J Clin Monit. 1988; 4:290–301.
8. Jubran, A. Pulse oximetry. Intensive Care Med. 2004; 30:2017–2020.
9. Brochard, L, Martin, GS, Blanch, L, et al. Clinical review: Respiratory monitoring in the ICU—A consensus of 16. Crit Care. 2012; 16:219.
10. Emergency Care Research Institute. Next-generation pulse oximetry. Health Devices. 2003; 32:49–103.
11. Perkins, GD, McAuley, DF, Giles, S, et al. Do changes in pulse oximeter oxygen saturation predict equivalent changes in arterial oxygen saturation? Crit Care. 2003; 7:R67–R71.
12. Jubran, A, Tobin, MJ. Reliability of pulse oximetry in titrating supplemental oxygen therapy in ventilator-dependent patients. Chest. 1990; 97:1420–1425.
13. Van de Louw, A, Cracco, C, Cerf, C, et al. Accuracy of pulse oximetry in the intensive care unit. Intensive Care Med. 2001; 27:1606–1613.
14. Webb, RK, Ralston, AC, Runciman, WB. Potential errors in pulse oximetry. II—Effects of changes in saturation and signal quality. Anaesthesia. 1991; 96:207–212.
15. Barker, SJ, Tremper, KK. The effect of carbon monoxide inhalation on pulse oximeter signal detection. Anesthesiology. 1987; 67:599–603.
16. Tawaklna, MT, Greville, HW. The effect of carboxyhemoglobin on the accuracy of pulse oximetry in ambulatory care patients. Chest. 1991; 143:A72.
17. Hampson, NB. Pulse oximetry in severe carbon monoxide poisoning [see comments]. Chest. 1998; 114:1036–1041.
18. Barker, SJ, Tremper, KK, Hyatt, J. Effects of methemoglobinemia on pulse oximetry and mixed-venous oximetry. Anesthesiology. 1989; 70:112–117.
19. Jay, GD, Hughes, L, Renzi, FP. Pulse oximetry is accurate in acute anemia from hemorrhage. Ann Emerg Med. 1994; 24:32–35.
20. Ortiz, FO, Aldrich, TK, Nagel, RL, et al. Accuracy of pulse oximetry in sickle cell disease. Am J Respir Crit Care Med. 1999; 159:447–451.
21. Hinkelbein, J, Genzwuerker, HV, Sogl, R, Fiedler, F. Effect of nail polish on oxygen saturation determined by pulse oximetry in critically ill patients. Resuscitation. 2007; 72:82–91.
22. Hinkelbein, J, Koehler, H, Genzwuerker, HV, Fiedler, F. Artificial acrylic finger nails may alter pulse oximetry measurement. Resuscitation. 2007; 74:75–82.
23. Amar, D, Neidzwski, J, Wald, A, Finck, AD. Fluorescent light interferes with pulse oximetry. J Clin Monit. 1989; 5:135–136.
24. Jubran, A. Advances in respiratory monitoring during mechanical ventilation. Chest. 1999; 116:1416–1425.
25. Zeballos, RJ, Weisman, IM. Reliability of noninvasive oximetry in black subjects during exercise and hypoxia. Am Rev Respir Dis. 1991; 144:1240–1244.
26. Clayton, D, Webb, RK, Ralston, AC, et al. Pulse oximeter probes: A comparison between finger, nose, ear, and forehead probes under conditions of poor perfusion. Anaesthesia. 1991; 46:260–265.
27. Ibanez, J, Velasco, J, Raurich, JM. The accuracy of the Biox 3700 pulse oximeter in patients receiving vasoactive therapy. Intensive Care Med. 1991; 17:484–486.
28. Dumas, C, Wahr, JA, Tremper, KK. Clinical Evaluation of a prototype motion artifact resistant pulse oximeter in the recovery room. Anesth Analg. 1996; 83:269–272.
29. Reich, DL, Timcenko, A, Bodian, CA, et al. Predictors of pulse oximetry data failure. Anesthesiology. 1996; 84:859–864.
30. Moller, JT, Hohannessen, NW, Berg, H, et al. Hypoxaemia during anesthesia—An observer study. Br J Anaesth. 1991; 66:437–444.
31. Lawless, ST. Crying wolf: False alarms in a pediatric intensive care unit. Crit Care Med. 1994; 22:981–985.
32. Tsien, CL, Fackler, JC. Poor prognosis for existing monitors in the intensive care unit. Crit Care Med. 1997; 25:614–619.
33. Lutter, NO, Urankar, S, Kroeber, S. False alarm rates of three third-generation pulse oximeters in PACU, ICU and IABP patients. Anesth Analg. 2002; 94:S69–S75.
34. Stoneham, MD, Saville, GM, Wilson, IH. Knowledge about pulse oximetry among medical and nursing staff. Lancet. 1994; 344:1339–1342.
35. Howell, M. Pulse oximetry: An audit of nursing and medical staff understanding. Br J Nurs. 2002; 11:191–197.
36. Bowton, DL, Scuderi, PE, Harris, L, et al. Pulse oximetry monitoring outside the intensive care unit: Progress or problem? Ann Intern Med. 1991; 115:450–454.
37. Carruthers, DM, Harrison, BDW. Arterial blood gas analysis or oxygen saturation in the assessment of acute asthma. Thorax. 1995; 50:186–188.
38. Kline, JA, Hernandez-Nino, J, Newgard, CD, et al. Use of pulse oximetry to predict in-hospital complications in normotensive patients with pulmonary embolism. Am J Med. 2003; 115:203–208.
39. Moller, JT, Pedersen, T, Rasmussen, LS, et al. Randomized evaluation of pulse oximetry in 20,802 patients: I—Design, demography, pulse oximetry failure rate and overall complication rate. Anesthesiology. 1993; 78:436–444.
40. Moller, JT, Johannessen, NW, Espersen, K, et al. Randomized evaluation of pulse oximetry in 20,802 patients: II—Perioperative events and postoperative complications. Anesthesiology. 1993; 78:445–453.
41. Bierman, MI, Stein, KL, Snyder, JV. Pulse oximetry in postoperative care of cardiac surgical patients: A randomized controlled trial. Chest. 1992; 102:1367–1370.
42. Le Bourdelles, G, Estagnasie, P, Lenoir, F, et al. Use of a pulse oximeter in an adult emergency department: Impact on the number of arterial blood gas analyses ordered. Chest. 1998; 113:1042–1047.
43. Solsona, JF, Marrugat, J, Vazquez, A, et al. Effect of pulse oximetry on clinical practice in the intensive care unit. Lancet. 1993; 342:311–312.
44. Inman, KJ, Sibbald, WJ, Rutledge, FS, et al. Does implementing pulse oximetry in a critical care unit result in substantial arterial blood gas savings? Chest. 1993; 104:542–546.
45. Hutchison, DCS, Gray, BJ. Transcutaneous and transconjunctival oxygen monitoring. In: Tobin MJ, ed. Principles and Practice of Intensive Care Monitoring. New York: McGraw-Hill; 1998:289–302.
46. Palmisano, BW, Severinghaus, JW. Transcutaneous PCO2 and PO2: A multicenter study of accuracy. J Clin Monit. 1990; 6:189–195.
47. Tremper, KK, Shoemaker, WC. Transcutaneous oxygen monitoring of critically ill adults, with and without low flow shock. Crit Care Med. 1981; 9:706–709.
48. Rodriguez, P, Lellouche, F, Aboab, J, et al. Transcutaneous arterial carbon dioxide pressure monitoring in critically ill adult patients. Intensive Care Med. 2006; 32:309–312.
49. Hoffman, RA, Ershowsky, PF, Krieger, BP. Determination of auto-PEEP during spontaneous and controlled ventilation by monitoring changes in end-expiratory thoracic gas volume. Chest. 1989; 96:613–616.
50. Hess, D, Schlottag, A, Levin, B, et al. An evaluation of the usefulness of end-tidal PCO2 to aid weaning from mechanical ventilation following cardiac surgery. Respir Care. 1991; 36:837–843.
51. Birmingham, PK, Cheney, FW, Ward, RJ. Esophageal intubation: A review of detection techniques. Anesth Analg. 1986; 65:886–891.
52. Vaghadia, H, Jenkins, LC, Ford, RW. Comparison of end-tidal carbon dioxide, oxygen saturation and clinical signs for the detection of oesophageal intubation. Can J Anaesth. 1989; 36:560–564.
53. Linko, K, Paloheimo, M, Tammisto, T. Capnography for detection of accidental oesophageal intubation. Acta Anaesthesiol Scand. 1983; 27:199–202.
54. Knapp, S, Kofler, J, Stoiser, B, et al. The assessment of four different methods to verify tracheal tube placement in the critical care setting. Anesth Analg. 1999; 88:766–770.
55. Alberti, A, Gallo, F, Fongaro, A, et al. P0. 1 is a useful parameter in setting the level of pressure support ventilation. Intensive Care Med. 1995; 21:547–553.
56. Conti, G, Cinnella, G, Barboni, E, et al. Estimation of occlusion pressure during assisted ventilation in patients with intrinsic PEEP. Am J Respir Crit Care Med. 1996; 154:907–912.
57. Capdevila, XJ, Perrigault, PF, Perey, PJ, et al. Occlusion pressure and its ratio to maximum inspiratory pressure are useful predictors for successful extubation following T-piece weaning trial. Chest. 1995; 108:482–489.
58. Sassoon, CSH, Mahutte, CK. Airway occlusion pressure and breathing pattern as predictors of weaning outcome. Am Rev Respir Dis. 1993; 148:860–866.
59. Tobin, MJ, Jubran, A. Weaning from mechanical ventilation. In Tobin MJ, ed. : Principles and Practice of Mechanical Ventilation, 3rd ed, New York: McGraw Hill, 2012.
60. Marini, JJ, Smith, TC, Lamb, V. Estimation of inspiratory muscle strength in mechanically ventilated patients: The measurement of maximal inspiratory pressure. J Crit Care. 1986; 1:32–38.
61. Multz, AS, Aldrich, TK, Prezant, DJ, et al. Maximal inspiratory pressure is not a reliable test of inspiratory muscle strength in mechanically ventilated patients. Am Rev Respir Dis. 1990; 142:529–532.
62. Yang, K, Tobin, MJ. A prospective study of indexes predicting outcome of trials of weaning from mechanical ventilation. N Engl J Med. 1991; 324:1445–1450.
63. Tobin, MJ, Guenther, SM, Perez, W, et al. The pattern of breathing during successful and unsuccessful trials of weaning from mechanical ventilation. Am Rev Respir Dis. 1986; 134:1111–1118.
64. Meade, M, Guyatt, G, Cook, D, et al. Predicting success in weaning from mechanical ventilation. Chest. 2001; 120:400S–424S.
65. MacIntyre, NR, Cook, DJ, Ely, EW, Jr., et al. Evidence-based guidelines for weaning and discontinuing ventilatory support: A collective task force facilitated by the American College of Chest Physicians; the American Association for Respiratory Care; and the American College of Critical Care Medicine. Chest. 2001; 120:375S–395S.
66. Feinstein, AR. Clinical Epidemiology: The Architecture of Clinical Research. Philadelphia: WB Saunders; 1985.
67. Sox, HC, Jr., Clatt, MA, Higgins, MC, Marton, KI. Medical Decision Making. Boston: Butterworths; 1988.
68. Tobin, MJ, Jubran, A. Variable performance of weaning-predictor tests: Role of Bayes’ theorem and spectrum and test-referral bias. Intensive Care Med. 2006; 32:2002–2012.
69. Chatila, W, Jacob, B, Guaglionone, D, Manthous, CA. The unassisted respiratory rate-tidal volume ratio accurately predicts weaning outcome. Am J Med. 1996; 101:61–67.
70. Jubran, A, Grant, BJ, Laghi, F, et al. Weaning prediction: Esophageal pressure monitoring complements readiness testing. Am J Respir Crit Care Med. 2005; 171:1252–1259.
71. Tobin, MJ, Laghi, F, Jubran, A. Ventilatory failure, ventilator support and ventilator weaning. Compr Physiol. 2012; 2(2):2871–2921.
72. Tobin, MJ, Mador, MJ, Guenther, SM, et al. Variability of resting respiratory drive and timing in healthy subjects. J Appl Physiol. 1988; 65:309–317.
73. Tobin, MJ, Yang, KL, Jubran, A, Lodato, RF. Interrelationship of breath components in neighboring breaths of normal eupneic subjects. Am J Respir Crit Care Med. 1995; 152:1967–1976.
74. Jubran, A, Grant, BJB, Tobin, MJ. Effect of hyperoxic hypercapnia on variational activity of breathing. Am J Respir Crit Care Med. 1997; 156:1129–1139.
75. Preas, HL, Jubran, A, Vandivier, RW, et al. Effect of cyclooxygenase inhibition on ventilatory resposnes to human experimental endotoxemia. Am J Respir Crit Care Med. 2001; 164:620–626.
76. Brack, T, Jubran, A, Tobin, MJ. Effect of elastic loading on variational activity of breathing. Am J Respir Crit Care Med. 1997; 155:1341–1348.
77. Brack, T, Jubran, A, Tobin, MJ. Effect of resistive loading on variational activity of breathing. Am J Respir Crit Care Med. 1998; 157:1756–1763.
78. Jubran, A, Tobin, MJ. Effect of isocapnic hypoxia on variational activity of breathing. Am J Respir Crit Care Med. 2000; 162:1202–1209.
79. Goldberger, AL. Non-linear dynamics for clinicians: Chaos theory, fractals, and complexity at the bedside. Lancet. 1996; 347:1312–1314.
80. Brack, T, Jubran, A, Tobin, MJ. Dyspnea and decreased variability of breathing in patients with restrictive lung disease. Am J Respir Crit Care Med. 2002; 165:1260–1264.
81. Wysocki, M, Cracco, C, Teixeira, A, et al. Reduced breathing variability as a predictor of unsuccessful patient separation from mechanical ventilation. Crit Care Med. 2006; 34:2076–2083.
82. Marini, JJ. Breathing patterns as integrative weaning predictors: Variations on a theme. Crit Care Med. 2006; 34:2241–2243.
83. Brack, T, Jubran, A, Laghi, F, Tobin, MJ. Fluctuations in end-expiratory lung volume during Cheyne-Stokes respiration. Am J Respir Crit Care Med. 2005; 171:1408–1413.
84. Jubran, A, Tobin, MJ. The effect of hyperinflation on rib cage-abdominal motion. Am Rev Respir Dis. 1992; 146:1378–1382.
85. Tobin, MJ. Noninvasive monitoring of ventilation. In: Tobin MJ, ed. Principles and Practice of Intensive Care Monitoring. New York: McGraw-Hill; 1998:465–495.
86. Bates, JHT, Rossi, A, Milic-Emili, J. Analysis of the behaviour of the respiratory system with constant inspiratory flow. J Appl Physiol. 1985; 58:1840–1848.
87. Jubran, A, Tobin, MJ. Passive mechanics of lung and chest wall in patients who failed and succeeded in trials of weaning. Am J Respir Crit Care Med. 1997; 155:916–921.
88. Polese, G, Rossi, A, Appendini, L, et al. Partitioning of respiratory mechanics in mechanically ventilated patients. J Appl Physiol. 1991; 71:2425–2433.
89. Rossi, A, Polese, G, Milic-Emili, J. Monitoring respiratory mechanics in ventilator-dependent patients. In: Tobin MJ, ed. Principles and Practice of Intensive Care Monitoring. New York: McGraw-Hill; 1998:553–596.
90. Dreyfuss, D, de Prost, N, Ricard, J-D, Saumon, G. Ventilator-induced injury. In Tobin MJ, ed. : Principles and Practice of Mechanical Ventilation, 3rd ed, New York: McGraw-Hill, 2012.
91. Dreyfuss, D, Soler, P, Basset, G, Saumon, G. High inflation pressure pulmonary edema: Respective effects of high airway pressure, high tidal volume, and positive end-expiratory pressure. Am Rev Respir Dis. 1988; 137:1159–1164.
92. Muscedere, JG, Muller, JBM, Gan, K, et al. Tidal volume at low airway pressures can augment lung injury. Am J Respir Crit Care Med. 1994; 149:1327–1334.
93. Tobin, MJ. Culmination of an era in research on the acute respiratory distress syndrome [editorial; comment]. N Engl J Med. 2000; 342:1360–1361.
94. Tobin, MJ. Advances in mechanical ventilation. N Engl J Med. 2001; 344:1986–1996.
95. Hickling, KG, Henderson, SJ, Jackson, R. Low mortality associated with low volume pressure limited ventilation with permissive hypercapnia in severe adult respiratory distress syndrome. Intensive Care Med. 1990; 16:372–377.
96. Amato, MB, Barbas, CS, Medeiros, DM, et al. Effect of a protective-ventilation strategy on mortality in the acute respiratory distress syndrome. N Engl J Med. 1998; 338:347–354.
97. Brochard, L, Roudot-Thoraval, F, Roupie, E, et al. Tidal volume reduction for prevention of ventilator-induced lung injury in acute respiratory distress syndrome. Am J Respir Crit Care Med. 1998; 158:1831–1838.
98. Brower, RG, Shanholtz, CB, Fessler, HE, et al. Prospective, randomized, controlled clinical trial comparing traditional versus reduced tidal volume ventilation in acute respiratory distress syndrome patients [see comments]. Crit Care Med. 1999; 27:1492–1498.
99. Stewart, TEM, Meade, MO, Cook, DJ, et al. Evaluation of a ventilation strategy to prevent barotrauma in patients at high risk for acute respiratory distress syndrome. N Engl J Med. 1998; 338:355–361.
100. Ventilation with lower tidal volumes as compared with traditional tidal volumes for acute lung injury and the acute respiratory distress syndrome. The Acute Respiratory Distress Syndrome Network. N Engl J Med. 2000; 342:1301–1308.
101. Eichacker, PQ, Gerstenberger, EP, Banks, SM, et al. Meta-analysis of acute lung injury and acute respiratory distress syndrome trials testing low tidal volumes. Am J Respir Crit Care Med. 2002; 166:1510–1514.
102. Deans, KJ, Minneci, PC, Cui, X, et al. Mechanical ventilation in ARDS: One size does not fit all. Crit Care Med. 2005; 33:1141–1143.
103. Kallet, RH, Jasmer, RM, Pittet, JF, et al. Clinical implementation of the ARDS network protocol is associated with reduced hospital mortality compared with historical controls. Crit Care Med. 2005; 33:925–929.
104. Brochard, L. Respiratory pressure-volume curves. In: Tobin MJ, ed. Principles and Practice of Intensive Care Monitoring. New York: McGraw-Hill; 1998:597–616.
105. Matamis, D, Lemaire, F, Harf, A, et al. Total respiratory pressure-volume curves in the adult respiratory distress syndrome. Chest. 1984; 86:58–66.
106. Amato, MBP, Barbas, CSV, Medeiros, DM, et al. Beneficial effects of the “open lung approach” with low distending pressures in acute respiratory distress syndrome: A prospective randomized study on mechanical ventilation. Am J Respir Crit Care Med. 1995; 152:1835–1846.
107. Brower, RG, Lanken, PN, MacIntyre, N, et al. Higher versus lower positive end-expiratory pressures in patients with the acute respiratory distress syndrome. N Engl J Med. 2004; 351:327–336.
108. Marini, JJ. Mechanical ventilation in the acute respiratory distress syndrome. In Tobin MJ, ed. : Principles and Practice of Mechanical Ventilation, 3rd ed, New York: McGraw-Hill, 2012.
109. Navalesi, P, Maggiore, SM. Positive end-expiratory pressure. In Tobin MJ, ed. : Principles and Practice of Mechanical Ventilation, 3rd ed, New York: McGraw-Hill, 2012.
110. Grasso, S, Fanelli, V, Cafarelli, A, et al. Effects of high versus low positive end-expiratory pressures in acute respiratory distress syndrome. Am J Respir Crit Care Med. 2005; 171:1002–1008.
111. Villar, J, Kacmarek, RM, Perez-Mendez, L, Aguirre-Jaime, A. A high positive end-expiratory pressure, low tidal volume ventilatory strategy improves outcome in persistent acute respiratory distress syndrome: A randomized, controlled trial. Crit Care Med. 2006; 34:1311–1318.
112. Jubran, A, Laghi, F, Mazur, M, et al. Partitioning of lung and chest wall mechanics before and after lung volume reduction surgery. Am J Respir Crit Care Med. 1998; 158:306–310.
113. Dhand, R, Duarte, AG, Jubran, A, et al. Dose response to bronchodilator delivered by metered-dose inhaler in ventilator-supported patients. Am J Respir Crit Care Med. 1996; 154:388–393.
114. Dhand, R, Jubran, A, Tobin, MJ. Efficacy of bronchodilator delivered by metered-dose inhaler in ventilator-supported patients with COPD. Am J Respir Crit Care Med. 1995; 152:129–136.
115. Tobin, MJ, Van de Graaff, WB. Monitoring of lung mechanics and work of breathing. In: Tobin MJ, ed. Principles and Practice of Mechanical Ventilation. New York: McGraw-Hill; 1994:967–1003.
116. Petrof, BJ, Legaré, M, Goldberg, P, et al. Continuous positive airway pressure reduces work of breathing and dyspnea during weaning from mechanical ventilation in severe chronic obstructive pulmonary disease. Am Rev Respir Dis. 1990; 141:281–289.
117. Maltais, F, Reissmann, H, Navalesi, P, et al. Comparison of static and dynamic measurements of intrinsic PEEP in mechanically ventilated patients. Am J Respir Crit Care Med. 1994; 150:1318–1324.
118. Nava, S, Bruschi, C, Rubini, F, et al. Respiratory response and inspiratory effort during pressure support ventilation in COPD patients. Intensive Care Med. 1995; 21:871–879.
119. Tobin, MJ, Jubran, A, Hines, E, Jr. Pathophysiology of failure to wean from mechanical ventilation. Schweiz Med Wochenschr. 1994; 124:2139–2145.
120. Leung, P, Jubran, A, Tobin, MJ. Comparison of assisted ventilator modes on triggering, patient effort, and dyspnea. Am J Respir Crit Care Med. 1997; 155:1940–1948.
121. Parthasarathy, S, Jubran, A, Tobin, MJ. Cycling of inspiratory and expiratory muscle groups with the ventilator in airflow limitation. Am J Respir Crit Care Med. 1998; 158:1471–1478.
122. Thille, AW, Rodriguez, P, Cabello, B, et al. Patient-ventilator asynchrony during assisted mechanical ventilation. Intensive Care Med. 2006; 32:1515–1522.
123. Thille, AW, Cabello, B, Galia, F, et al. Reduction of patient-ventilator asynchrony by reducing tidal volume during pressure-support ventilation. Intensive Care Med. 2008; 34:1477–1486.
124. Tobin, MJ, Laghi, F, Jubran, A. Ventilator-induced respiratory muscle weakness. Ann Intern Med. 2010; 153:240–245.
125. Puddy, A, Younes, M. Effect of inspiratory flow rate on respiratory output in normal subjects. Am Rev Respir Dis. 1992; 146:787–789.
126. Laghi, F, Segal, J, Choe, WK, Tobin, MJ. Effect of imposed inflation time on respiratory frequency and hyperinflation in patients with chronic obstructive pulmonary disease. Am J Respir Crit Care Med. 2001; 163:1365–1370.
127. Jubran, A, Tobin, MJ. Use of flow-volume curves in detecting secretions in ventilator- dependent patients. Am J Respir Crit Care Med. 1994; 150:766–769.
128. Guglielminotti, J, Alzieu, M, Maury, E, et al. Bedside detection of retained tracheobronchial secretions in patients receiving mechanical ventilation: Is it time for tracheal suctioning? Chest. 2000; 118:1095–1099.