Non-invasive monitoring
Monitoring equipment can be invasive or non-invasive. The latter is discussed in this chapter, whereas the former is discussed in Chapter 11.
Integrated monitoring
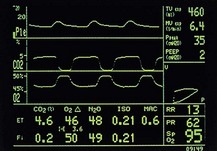
Until recently, it was common to see the anaesthetic machine adorned with discrete, bulky monitoring devices. Significant advances in information technology have allowed an integrated monitoring approach to occur. Plug-in monitoring modules feed a single visual display on which selected values and waveforms can be arranged and colour-coded (Figs 10.1–10.3).
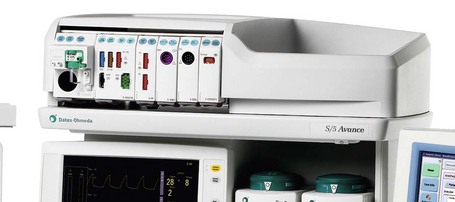
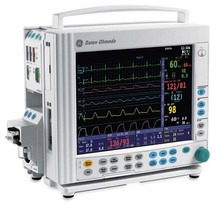
Fig. 10.2 Datex-Ohmeda compact monitor.
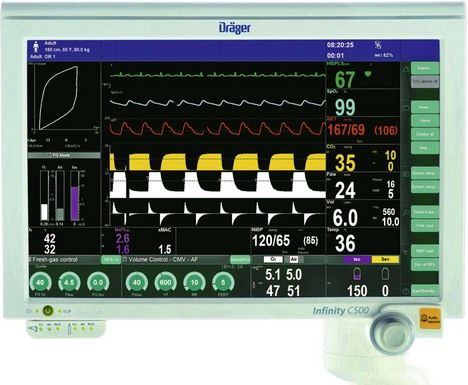
Fig. 10.3 Colour-coded values and waveforms displayed on the Zeus Dräger monitor. (Courtesy of Dräger.)
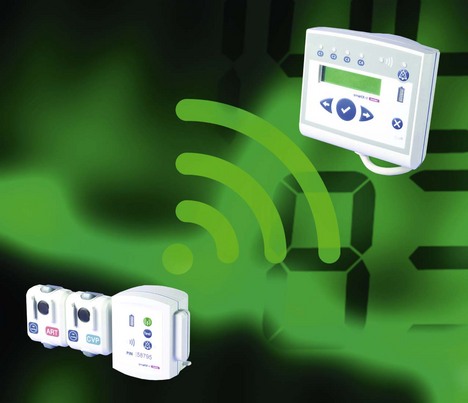
More recently, wireless monitoring systems are becoming available. An example is wireless invasive pressure monitoring systems (Fig. 10.4). This reduces the clutter of cables surrounding the patients.
Electrocardiogram (ECG)
Components
1. Skin electrodes detect the electrical activity of the heart (Fig. 10.5). Silver and silver chloride form a stable electrode combination. Both are held in a cup and separated from the skin by a foam pad soaked in conducting gel.
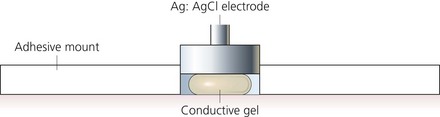
Fig. 10.5 An ECG electrode.
2. Colour-coded cables to transmit the signal from electrodes to the monitor. Cables are available in 3- and 5-lead versions as snap or grabber design and with a variety of lengths. All the cables of a particular set should have the same length to minimize the effect of electromagnetic interference.
3. The ECG signal is then boosted using an amplifier. The amplifier covers a frequency range of 0.05–150 Hz. It also filters out some of the frequencies considered to be noise. The amplifier has ECG filters that are used to remove the noise/artifacts from ECG and produce a ‘clean’ signal.
4. An oscilloscope that displays the amplified ECG signal. A high-resolution monochrome or colour monitor is used.
Mechanism of action
1. Proper attachment of ECG electrodes involves cleaning the skin, gently abrading the stratum corneum and ensuring adequate contact using conductive gel. Skin impedance varies at different sites and it is thought to be higher in females. The electrodes are best positioned on bony prominences to reduce artifacts from respiration.
2. Modern ECG monitors use multiple filters for signal processing. The filters used should be capable of removing the unwanted frequencies, leaving the signal intact (Fig. 10.6). Two types of filters are used for this purpose:
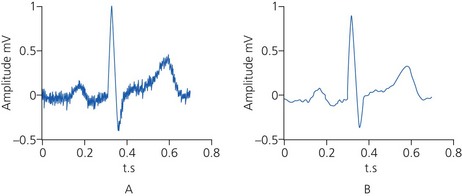
a) high-pass filters attenuate the frequency components of a signal below a certain frequency. They help to remove lower frequency noise from the signal. For example, the respiratory component from ECG can be removed by turning on a 1-Hz high pass filter on the amplifier. The filter will centre the signal around the zero isoline
b) low-pass filters attenuate the frequency components of a signal above a certain frequency. They are useful for removing noise from lower frequency signals. So an amplifier with a 35-Hz low-pass filter will remove/attenuate signals above 35 Hz and help to ‘clean’ the ECG signal.
3. The ECG monitor can have two modes:
a) the monitoring mode has a limited frequency response of 0.5–50 Hz. Filters are used to narrow the bandwidth to reduce environmental artifacts. The high-frequency filters reduce distortions from muscle movement, mains current and electromagnetic interference from other equipment. The low-frequency filters help provide a stable baseline by reducing respiratory and body movement artifacts
b) the diagnostic mode has a wider frequency response of 0.05–150 Hz. The high-frequency limit allows the assessment of the ST segment, QRS morphology and tachyarrhythmias. The low-frequency limit allows representation of P- and T-wave morphology and ST-segment analysis.
4. There are many ECG electrode configurations. Usually during anaesthesia, three skin electrodes are used (right arm, left arm and indifferent leads). The three limb leads used include two that are ‘active’ and one that is ‘inactive’ (earth). Sometimes five electrodes are used. Lead II is ideal for detecting arryhthmias. CM5 configuration is able to detect 89% of ST-segment changes due to left ventricular ischaemia. In CM5, the right arm electrode is positioned on the manubrium (chest lead from manubrium), the left arm electrode is on V5 position (fifth interspace in the left anterior axillary line) and the indifferent lead is on the left shoulder or any convenient position (Fig. 10.7).
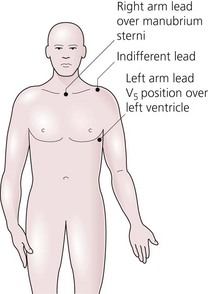
Fig. 10.7 The CM5 ECG lead configuration.
5. The CB5 configuration is useful during thoracic anaesthesia. The right arm electrode is positioned over the centre of the right scapula and the left arm electrode is over V5.
6. A display speed of 25 mm/s and a sensitivity of 1 mV/cm are standard in the UK.
Problems in practice and safety features
1. Incorrect placement of the ECG electrodes in relation to the heart is a common error, leading to false information.
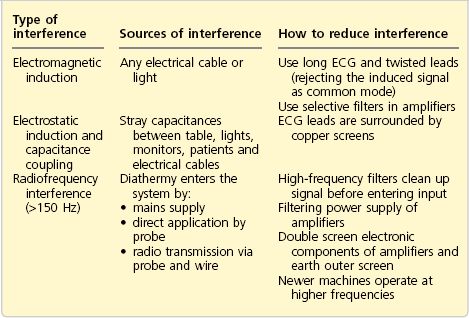
2. Electrical interference can be a 50-Hz (in UK) mains line interference because of capacitance or inductive coupling effect. Any electrical device powered by AC can act as one plate of a capacitor and the patient acts as the other plate. Interference can also be because of high-frequency current interference from diathermy. Most modern monitors have the facilities to avoid interference. Shielding of cables and leads, differential amplifiers and electronic filters all help to produce an interference-free monitoring system. Differential amplifiers measure the difference between the potential from two different sources. If there is interference common to the two input terminals (e.g. mains frequency), it can be eliminated as only the differences between the two terminals is amplified. This is called common mode rejection ratio (CMRR). Amplifiers used in ECG monitoring should have a high CMRR of 100 000 : 1 to 1 000 000 : 1, which is a measurement of capability to reject the noise. They should also have a high input impedance (about 10 MΩ) to minimize the current taken from the electrodes. Table 10.1 shows the various types and sources of interference and how to reduce the interference.
3. Muscular activity, such as shivering, can produce artifacts. Positioning the electrodes over bony prominences and the use of low-pass filters can reduce these artifacts.
4. High and low ventricular rate alarms and an audible indicator of ventricular rate are standard on most designs. More advanced monitors have the facility to monitor the ST segment (Fig. 10.8). Continuous monitoring and measurement of the height of the ST segment allows early diagnosis of ischaemic changes.
Fig. 10.8 12-lead ECG and ST-segment monitoring.
5. Absence of or improperly positioned patient diathermy plate can cause burns at the site of ECG skin electrodes. This is because of the passage of the diathermy current via the electrodes causing a relatively high current density.
Arterial blood pressure
Components
1. A cuff with a tube used for inflation and deflation. Some designs have an extra tube for transmitting pressure fluctuations to the pressure transducer.
2. The case where the microprocessor, pressure transducer and a solenoid valve which controls the deflation of the arm cuff are housed. It contains the display and a timing mechanism which adjusts the frequency of measurements. Alarm limits can be set for both high and low values.
Mechanism of action
1. The microprocessor is set to control the sequence of inflation and deflation.
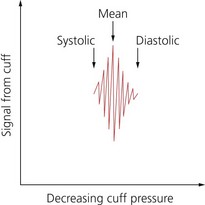
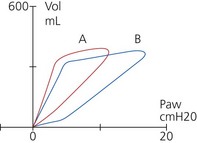
2. The cuff is inflated to a pressure above the previous systolic pressure, then it is deflated incrementally. The return of blood flow causes oscillation in cuff pressure (Fig. 10.9).
3. The transducer senses the pressure changes which are interpreted by the microprocessor. This transducer has an accuracy of ±2%.
4. The output signal from the transducer passes through a filter to an amplifier that amplifies the oscillations. The output from the amplifier passes to the microprocessor through the analogue digital converter (ADC). The microprocessor controls the pneumatic pump for inflation of the cuff and the solenoid valve for deflation of the cuff.
5. The mean arterial blood pressure corresponds to the maximum oscillation at the lowest cuff pressure. The systolic pressure corresponds to the onset of rapidly increasing oscillations.
6. The diastolic pressure corresponds to the onset of rapidly decreasing oscillations. In addition, it is mathematically computed from the systolic and mean pressure values (mean blood pressure = diastolic blood pressure + 1/3 pulse pressure).
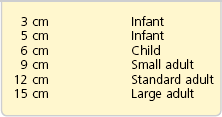
7. The cuff must be of the correct size (Table 10.2). It should cover at least two-thirds of the upper arm. The width of the cuff’s bladder should be 40% of the mid-circumference of the limb. The middle of the cuff’s bladder should be positioned over the brachial artery.
8. Some designs have the ability to apply venous stasis to facilitate intravenous cannulation.
Problems in practice and safety features
1. For the device to measure the arterial blood pressure accurately, it should have a fast cuff inflation and a slow cuff deflation (at a rate of 3 mmHg/s or 2 mmHg/beat). The former is to avoid venous congestion and the latter provides enough time to detect the arterial pulsation.
2. If the cuff is too small, the blood pressure is over-read, while it is under-read if the cuff is too large. The error is greater with too small than too large a cuff.
3. The systolic pressure is over-read at low pressures (systolic pressure less than 60 mmHg) and under-read at high systolic pressures.
4. Atrial fibrillation and other arrhythmias affect performance.
5. External pressure on the cuff or its tubing can cause inaccuracies.
6. Frequently repeated cuff inflations can cause ulnar nerve palsy and petechial haemorrhage of the skin under the cuff.
The von recklinghausen oscillotonometer
During the premicroprocessor era, the Von Recklinghausen Oscillotonometer was widely used (Fig. 10.10).
Fig. 10.10 The Von Recklinghausen oscillotonometer.
Components
Mechanism of action
1. With the control lever at rest, air is pumped into both cuffs and the air-tight case of the instrument using the inflation bulb to a pressure exceeding systolic arterial pressure. By operating the control lever, the lower sensing cuff is isolated and the pressure in the upper cuff and instrument case is allowed to decrease slowly through an adjustable leak controlled by the release valve. As systolic pressure is reached, pulsation of the artery under the lower cuff results in pressure oscillations within the cuff and its bellows. The pressure oscillations are transmitted via a mechanical amplification system to the needle. As the pressure in the upper cuff decreases below diastolic pressure, the pulsation ceases.
2. The mean pressure is at the point of maximum oscillation.
3. This method is reliable at low pressures. It is useful to measure trends in blood pressure.
Pulse oximetry
This is a non-invasive measurement of the arterial blood oxygen saturation at the level of the arterioles. A continuous display of the oxygenation is achieved by a simple, accurate and rapid method (Fig. 10.11).
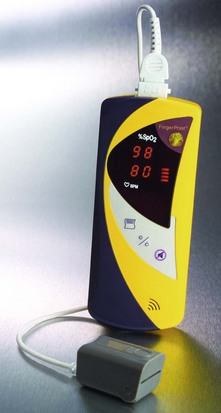
Fig. 10.11 Smiths Medical FingerPrint oximeter.
Components
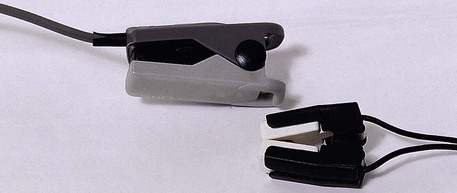
1. A probe is positioned on the finger, toe, ear lobe or nose (Fig. 10.12). Two light-emitting diodes (LEDs) produce beams at red and infrared frequencies (660 nm and 940 nm respectively) on one side and there is a sensitive photodetector on the other side. The LEDs operate in sequence at a rate of about 30 times per second (Fig. 10.13).
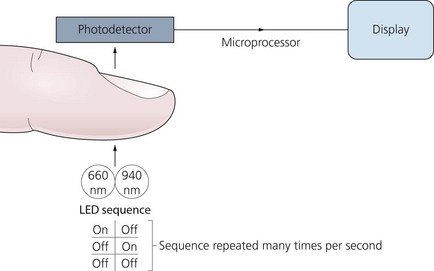
2. The case houses the microprocessor. There is a display of the oxygen saturation, pulse rate and a plethysmographic waveform of the pulse. Alarm limits can be set for a low saturation value and for both high and low pulse rates.
Mechanism of action
1. The oxygen saturation is estimated by measuring the transmission of light, through a pulsatile vascular tissue bed (e.g. finger). This is based on Beer’s law (the relation between the light absorbed and the concentration of solute in the solution) and Lambert’s law (relation between absorption of light and the thickness of the absorbing layer).
2. The amount of light transmitted depends on many factors. The light absorbed by non-pulsatile tissues (e.g. skin, soft tissues, bone and venous blood) is constant (DC). The non-constant absorption (AC) is the result of arterial blood pulsations (Fig. 10.14). The sensitive photodetector generates a voltage proportional to the transmitted light. The AC component of the wave is about 1–5% of the total signal.
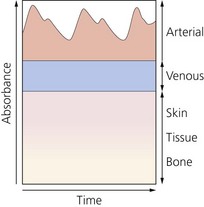
Fig. 10.14 Schematic representation of the contribution of various body components to the absorbance of light.
3. The high frequency of the LEDs allows the absorption to be sampled many times during each pulse beat. This is used to enable running averages of saturation to be calculated many times per second. This decreases the ‘noise’ (e.g. movement) effect on the signal.
4. The microprocessor is programmed to mathematically analyse both the DC and AC components at 660 and 940 nm calculating the ratio of absorption at these two frequencies (R/IR ratio). The result is related to the arterial saturation. The absorption of oxyhaemoglobin and deoxyhaemoglobin at these two wavelengths is very different. This allows these two wavelengths to provide good sensitivity. 805 nm is one of the isobestic points of oxyhaemoglobin and deoxyhaemoglobin. The OFF part allows a baseline measurement for any changes in ambient light.
5. A more recent design uses multiple wavelengths to eradicate false readings from carboxy haemoglobin and methaemoglobinaemia. Advanced oximeters use more than seven light wavelengths. This has enabled the measurement of haemoglobin value, oxygen content, carboxyhaemoglobin and methaemoglobin concentrations.
6. A variable pitch beep provides an audible signal of changes in saturation.
Problems in practice and safety features
1. It is accurate (±2%) in the 70–100% range. Below the saturation of 70%, readings are extrapolated.
2. The absolute measurement of oxygen saturation may vary from one probe to another but with accurate trends. This is due to the variability of the centre wavelength of the LEDs.
3. Carbon monoxide poisoning (including smoking), coloured nail varnish, intravenous injections of certain dyes (e.g. methylene blue, indocyanine green) and drugs responsible for the production of methaemoglobinaemia are all sources of error (Table 10.3).
Table 10.3
Sources of error in pulse oximetry
| HbF | No significant clinical change (absorption spectrum is similar to the adult Hb over the range of wavelengths used) |
| MetHb | False low reading |
| CoHb | False high reading |
| SulphHb | Not a clinical problem |
| Bilirubin | Not a clinical problem |
| Dark skin | No effect |
| Methylene blue | False low reading |
| Indocyanine green | False low reading |
| Nail varnish | May cause false low reading |
4. Hypoperfusion and severe peripheral vasoconstriction affect the performance of the pulse oximeter. This is because the AC signal sensed is about 1–5% of the DC signal when the pulse volume is normal. This makes it less accurate during vasoconstriction when the AC component is reduced.
5. The device monitors the oxygen saturation with no direct information regarding oxygen delivery to the tissues.
6. Pulse oximeters average their readings every 10–20 s. They cannot detect acute desaturation. The response time to desaturation is longer with the finger probe (more than 60 s) whereas the ear probe has a response time of 10–15 s.
7. Excessive movement or malposition of the probe is a source of error. Newer designs such as the Masimo oximeter claim more stability despite motion. External fluorescent light can be a source of interference.
8. Inaccurate measurement can be caused by venous pulsation. This can be because of high airway pressures, the Valsalva manoeuvre or other consequences of impaired venous return. Pulse oximeters assume that any pulsatile absorption is caused by arterial blood pulsation only.
9. The site of the application should be checked at regular intervals as the probe can cause pressure sores with continuous use. Some manufacturers recommend changing the site of application every 2 h especially in patients with impaired microcirculation. Burns in infants have been reported.
10. Pulse oximetry only gives information about a patient’s oxygenation. It does not give any indication of a patient’s ability to eliminate carbon dioxide.
End-tidal carbon dioxide analysers (capnographs)
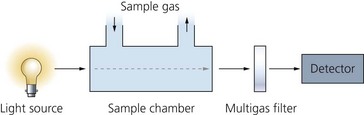
Gases with molecules that contain at least two dissimilar atoms absorb radiation in the infrared region of the spectrum. Using this property, both inspired and exhaled carbon dioxide concentration can be measured directly and continuously throughout the respiratory cycle (Fig. 10.15).
Components
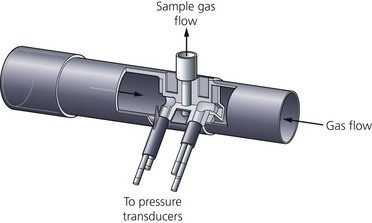
1. The sampling chamber can either be positioned within the patient’s gas stream (main-stream version, Fig. 10.16) or connected to the distal end of the breathing system via a sampling tube (side-stream version, Fig. 10.17).
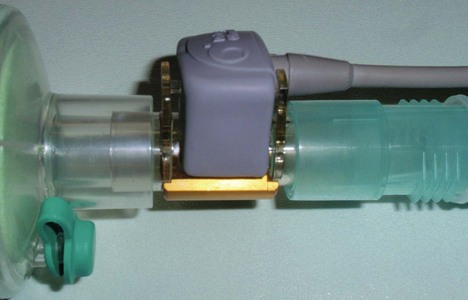
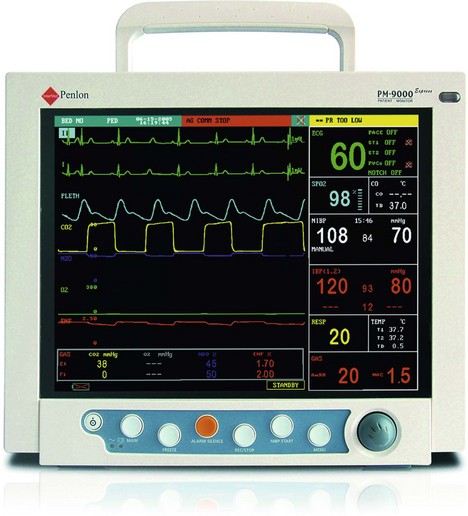
Fig. 10.17 The Penlon PM9000 Express which measures end-tidal CO2, oximetry and inhalational agent concentration using a side-stream method. (Courtesy of Penlon Ltd, Abingdon, UK (www.penlon.com).)
2. A photodetector measures light reaching it from a light source at the correct infrared wavelength (using optical filters) after passing through two chambers. One acts as a reference whereas the other one is the sampling chamber (Fig. 10.18).
Mechanism of action
1. Carbon dioxide absorbs the infrared radiation particularly at a wavelength of 4.3 µm.
2. The amount of infrared radiation absorbed is proportional to the number of carbon dioxide molecules (partial pressure of carbon dioxide) present in the chamber.
3. The remaining infrared radiation falls on the thermopile detector, which in turn produces heat. The heat is measured by a temperature sensor and is proportional to the partial pressure of carbon dioxide gas present in the mixture in the sample chamber. This produces an electrical output. This means that the amount of gas present is inversely proportional to the amount of infrared light present at the detector in the sample chamber (Fig 10.19).
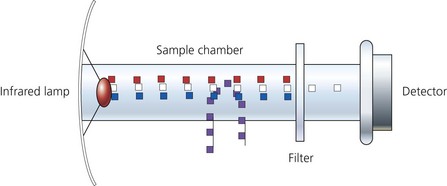
4. In the same way, a beam of light passes through the reference chamber which contains room air. The absorption detected from the sample chamber is compared to that in the reference chamber. This allows the calculation of carbon dioxide values.
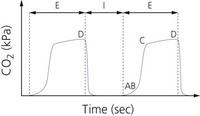
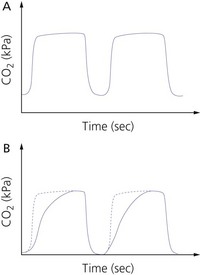
5. The inspired and exhaled carbon dioxide forms a square wave, with a zero baseline unless there is rebreathing (Fig. 10.20A).
6. A microprocessor-controlled infrared lamp is used. This produces a stable infrared source with a constant output. The current is measured with a current-sensing resistor, the voltage across which is proportional to the current flowing through it. The supply to the light source is controlled by the feedback from the sensing resistor maintaining a constant current of 150 mA.
7. Using the rise and fall of the carbon dioxide during the respiratory cycle, monitors are designed to measure the respiratory rate.
8. Alarm limits can be set for both high and low values.
9. To avoid drift, the monitor should be calibrated regularly with known concentrations of CO2 to ensure accurate measurement.
1. The photo-acoustic technique is extremely stable and its calibration remains constant over much longer periods of time.
2. The very fast rise and fall times give a much more accurate representation of any change in CO2 concentration.
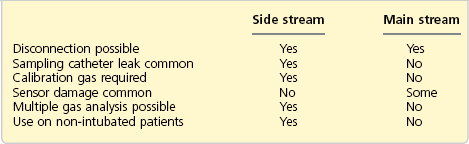
Carbon dioxide analysers can be either side-stream or main-stream analysers.
Side-stream analysers
1. This consists of a 1.2-mm internal diameter tube that samples the gases (both inspired and exhaled) at a constant rate (e.g. 150–200 mL/min). The tube is connected to a lightweight adapter near the patient’s end of the breathing system (with a pneumotachograph for spirometry) with a small increase in the dead space. It delivers the gases to the sample chamber. It is made of Teflon so it is impermeable to carbon dioxide and does not react with anaesthetic agents.
2. As the gases are humid, there is a moisture trap with an exhaust port, allowing gas to be vented to the atmosphere or returned to the breathing system.
3. In order to accurately measure end-tidal carbon dioxide, the sampling tube should be positioned as close as possible to the patient’s trachea.
4. A variable time delay before the sample is presented to the sample chamber is expected. The transit time delay depends on the length (which should be as short as possible, e.g. 2 m) and diameter of the sampling tube and the sampling rate. A delay of less than 3.8 s is acceptable. The rise time delay is the time for the analyser to respond to the signal and depends upon the size of the sample chamber and the gas flow.
5. Other gases and vapours can be analysed from the same sample.
6. Portable hand-held side-stream analysers are available (Fig. 10.21). They can be used during patient transport and out-of-hospital situations.
Main-stream analyser
1. The sample chamber is positioned within the patient’s gas stream, increasing the dead space. In order to prevent water vapour condensation on its windows, it is heated to about 41°C.
2. Since there is no need for a sampling tube, there is no transport time delay in gas delivery to the sample chamber.
See Table 10.4 for a comparison of side-stream and main-stream analysers.
Uses (Table 10.5)
Table 10.5
Summary of the uses of end-tidal CO2
| Increased end-tidal carbon dioxide | Decreased end-tidal carbon dioxide |
| Hypoventilation | Hyperventilation |
| Rebreathing | Pulmonary embolism |
| Sepsis | Hypoperfusion |
| Malignant hyperpyrexia | Hypometabolism |
| Hyperthermia | Hypothermia |
| Skeletal muscle activity | Hypovolaemia |
| Hypermetabolism | Hypotension |
1. To diagnose oesophageal intubation (no or very little carbon dioxide is detected). Following manual ventilation or the ingestion of carbonated drinks, some carbon dioxide might be present in the stomach. Characteristically, this may result in up to 5–6 waveforms with an abnormal shape and decreasing in amplitude.
2. As a disconnection alarm for a ventilator or breathing system. There is sudden absence of the end-tidal carbon dioxide.
3. To diagnose lung embolism as a sudden decrease in end-tidal carbon dioxide assuming that the arterial blood pressure remains stable.
4. To diagnose malignant hyperpyrexia as a gradual increase in end-tidal carbon dioxide.
Problems in practice and safety features
1. In patients with chronic obstructive airways disease, the waveform shows a sloping trace and does not accurately reflect the end-tidal carbon dioxide (see Fig. 10.20B). An ascending plateau usually indicates impairment of ventilation : perfusion ratio because of uneven emptying of the alveoli.
2. During paediatric anaesthesia, it can be difficult to produce and interpret end-tidal carbon dioxide because of the high respiratory rates and small tidal volumes. The patient’s tidal breath can be diluted with fresh gas.
3. During a prolonged expiration or end-expiratory pause, the gas flow exiting the trachea approaches zero. The sampling line may aspirate gas from the trachea and the inspiratory limb, causing ripples on the expired CO2 trace (cardiogenic oscillations). They appear during the alveolar plateau in synchrony with the heart beat. It is thought to be due to mechanical agitation of deep lung regions that expel CO2-rich gas. Such fluctuations can be smoothed over by increasing lung volume using positive end expiratory pressure (PEEP).
4. Dilution of the end-tidal carbon dioxide can occur whenever there are loose connections and system leaks.
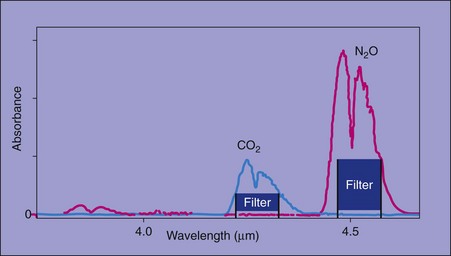
5. Nitrous oxide (may be present in the sample for analysis) absorbs infrared light with an absorption spectrum partly overlapping that of carbon dioxide (Fig. 10.22). This causes inaccuracy of the detector, nitrous oxide being interpreted as carbon dioxide. By careful choice of the wavelength using special filters, this can be avoided. This is not a problem in most modern analysers.
6. Collision broadening or pressure broadening is a cause of error. The absorption of carbon dioxide is increased because of the presence of nitrous oxide or nitrogen. Calibration with a gas mixture that contains the same background gases as the sample solves this problem.
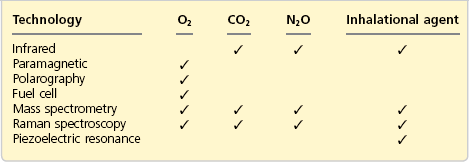
Oxygen concentration analysers
It is fundamental to monitor oxygen concentration in the gas mixture delivered to the patient during general anaesthesia. The inspired oxygen concentration (FiO2) is measured using a galvanic, polarographic or paramagnetic method (Fig. 10.23). The galvanic and polarographic analysers have a slow response time (20–30 s) because they are dependent on membrane diffusion. The paramagnetic analyser has a rapid response time. The paramagnetic analyser is currently more widely used. These analysers measure the oxygen partial pressure, displayed as a percentage.
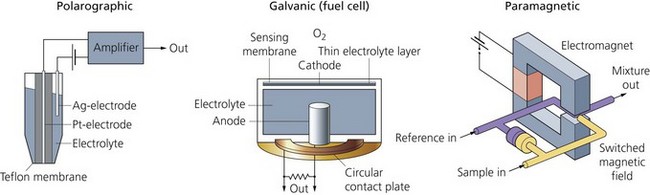
Fig. 10.23 Different types of oxygen analysers.
Paramagnetic (pauling) oxygen analysers
1. Two chambers separated by a sensitive pressure transducer. The gas sample containing oxygen is delivered to the measuring chamber. The reference (room air) is delivered to the other chamber. This is accomplished via a sampling tube.
2. An electromagnet is rapidly switched on and off (a frequency of about 100–110 Hz) creating a changing magnetic field to which the gases are subjected. The electromagnet is designed to have its poles in close proximity, forming a narrow gap.
Mechanism of action (Fig. 10.24)
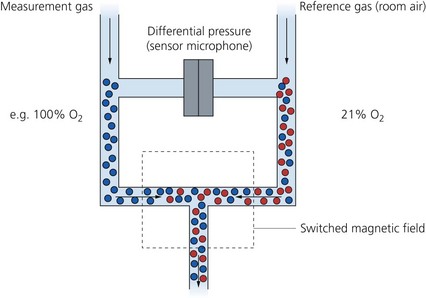
Fig. 10.24 Paramagnetic oxygen analyser.
1. Oxygen is attracted to the magnetic field (paramagnetism) because of the fact that it has two electrons in unpaired orbits. Most of the gases used in anaesthesia are repelled by the magnetic field (diamagnetism).
2. The magnetic field causes the oxygen molecules to be attracted and agitated. This leads to changes in pressure on both sides of the transducer. The pressure difference (about 20–50 µbar) across the transducer is proportional to the oxygen partial pressure difference between the sample and reference gases. The transducer converts this pressure force to an electrical signal that is displayed as oxygen partial pressure or converted to a reading in volume percentage.
3. They are very accurate and highly sensitive. The analyser should function continuously without any service breaks.
4. The recently designed paramagnetic oxygen analysers have a rapid response making it possible to analyse the inspired and expired oxygen concentration on a breath-to-breath basis. The older designs of oxygen analysers had a slow response time (nearly 1 min).
5. The audible alarms can be set for low and high concentration limits (e.g. 28% low and 40% high).
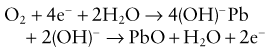
The galvanic oxygen analyser (hersch fuel cell)
1. It generates a current proportional to the partial pressure of oxygen (so acting as a battery requiring oxygen for the current to flow).
2. It consists of a noble metal cathode and a lead anode in a potassium chloride electrolyte solution. An oxygen-permeable membrane separates the cell from the gases in the breathing system.
3. The oxygen molecules diffuse through the membrane and electrolyte solution to the gold cathode (see Fig. 10.23), generating an electrical current proportional to the partial pressure of oxygen:
4. Calibration is achieved using 100% oxygen and room air (21% oxygen).
5. It reads either the inspiratory or expiratory oxygen concentration.
6. Water vapour does not affect its performance.
7. It is depleted by continuous exposure to oxygen because of exhaustion of the cell, so limiting its lifespan to about 1 year.
8. The fuel cell has a slow response time of about 20 s with an accuracy of ±3%.
Polarographic (clark electrode) oxygen analysers
1. They have similar principles to the galvanic analysers (see Fig. 10.23). A platinum cathode and a silver anode in an electrolyte solution are used. The electrodes are polarized by a 600–800 mV power source. An oxygen-permeable Teflon membrane separates the cell from the sample.
2. The number of oxygen molecules that traverse the membrane is proportional to its partial pressure in the sample. An electric current is produced when the cathode donates electrons that are accepted by the anode. For every molecule of oxygen, four electrons are supplied making the current produced proportional to the oxygen partial pressure in the sample.
3. They give only one reading, which is the average of inspiratory and expiratory concentrations.
4. Their life expectancy is limited (about 3 years) because of the deterioration of the membrane.
5. The positioning of the oxygen analyser is debatable. It has been recommended that slow responding analysers are positioned on the inspiratory limb of the breathing system and fast responding analysers are positioned as close as possible to the patient.
Problems in practice and safety features
1. Regular calibration of the analysers is vital.
2. Paramagnetic analysers are affected by water vapour therefore a water trap is incorporated in their design.
3. The galvanic and the polarographic cells have limited lifespans and need regular service.
4. The fuel cell and the polarographic electrode have slow response times of about 20–30 s with an accuracy of ±3%.
Nitrous oxide and inhalational agent concentration analysers
Modern analysers can measure the concentration of all the agents available, halothane, enflurane, isoflurane, sevoflurane and desflurane, on a breath-by-breath basis (Fig. 10.25) using infrared.
Mechanism of action
1. Infrared absorption analysers are used (Fig. 10.26). The sampled gas enters a chamber where it is exposed to infrared light. A photodetector measures the light reaching it across the correct infrared wavelength band. Absorption of the infrared light is proportional to the vapour concentration. The electrical signal is then analysed and processed to give a measurement of the agent concentration.
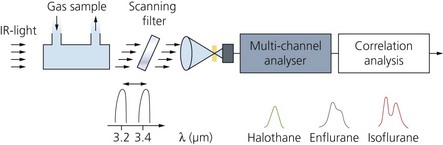
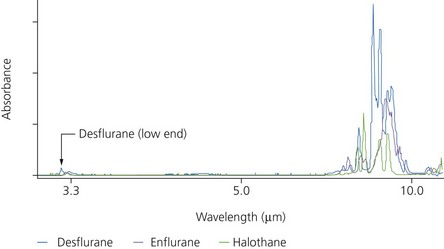
2. Optical filters are used to select the desired wavelengths. Different analyser designs use different wavelengths for anaesthetic agent analysis. An infrared light of a wavelength of 4.6 µm is used for N2O. For the inhalational agents, higher wavelengths are used, between 8 and 9 µm. This is to avoid interference from methane and alcohol that happen at the lower 3.3-µm band.
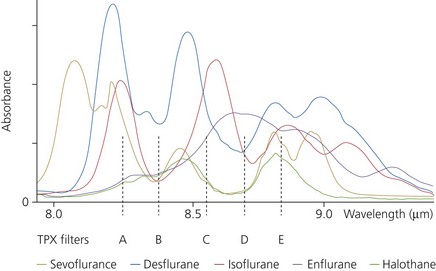
3. Modern sensors can automatically identify and measure concentrations of up to three agents present in a mixture and produce a warning message to the user. Five sensors are used to produce a spectral shape where the five outputs are compared and the shape produced represents the spectral signal of the agent present in the sample. This is compared with the spectral shapes stored in the memory of the sensor and used to identify the agent. Currently, it is possible to detect and measure the concentrations of halothane, enflurane, isoflurane, sevoflurane and desflurane (Figs 10.27 and 10.28).
4. The amplitude of the spectral shape represents the amount of vapour present in the mixture. The amplitude is inversely proportional to the amount of agent present. The output of the infrared lamp is kept constant with a constant supply of current. Optical filters are used to filter the desirable wavelengths. Because of the autodetection, individual calibration for each agent is not necessary.
5. A reference beam is incorporated. This allows the detector software to calculate how much energy has been absorbed by the sample at each wavelength and therefore the concentration of agent in the sample.
6. The sample gas can be returned to the breathing system, making the analysers suitable for use with the circle breathing system.
7. No individual calibration for each agent is necessary.
8. Water vapour has no effect on the performance and accuracy of the analyser.
Piezoelectric quartz crystal oscillation
Other methods less commonly used for measuring inhalational agent concentration are:
1. Raman spectroscopy: the anaesthetic gas sample is illuminated by an intense argon laser. Some light energy is simply reflected but some energy stimulates the sample molecules, causing them to scatter light of a different wavelength from that of the incident light energy (Raman scattering). This scattered light is detected at right angles to the laser beam and the difference in energy level between the incident and reflected light is measured. All molecules in the gas/volatile phase can be identified by their characteristic spectrum of (Raman) scattering.
2. Ultraviolet absorption: in the case of halothane, with similar principles to infrared absorption but using ultraviolet absorption.
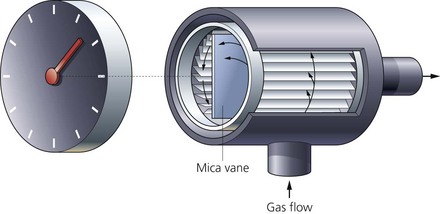
Wright respirometer
This compact and light (weighs less than 150 g) respirometer is used to measure the tidal volume and minute volume (Fig. 10.29).
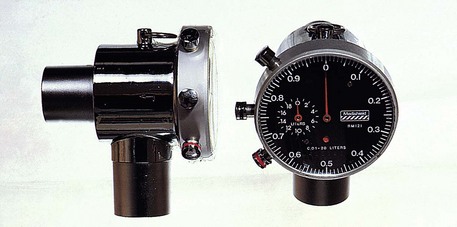
Fig. 10.29 A Wright respirometer. An arrow on the side of the casing indicates the direction of gas flow.
Components
Mechanism of action
1. The Wright respirometer is a one-way system. It allows the measurement of the tidal volume if the flow of the gases is in one direction only. The correct direction for gas flow is indicated by an arrow.
2. The slits surrounding the vane are to create a circular flow in order to rotate the vane. The vane does 150 revolutions for each litre of gas passing through. This causes the pointer to rotate round the respirometer display.
3. The outer display is calibrated at 100 mL per division. The small inner display is calibrated at 1 L per division.
4. It is usually positioned on the expiratory side of the breathing system, which is at a lower pressure than the inspiratory side. This minimizes the loss of gas volume due to leaks and expansion of the tubing.
5. For clinical use, the respirometer reads accurately the tidal volume and minute volume (±5–10%) within the range of 4–24 L/min. A minimum flow of 2 L/min is required for the respirometer to function accurately.
6. To improve accuracy, the respirometer should be positioned as close to the patient’s trachea as possible.
7. The resistance to breathing is very low at about 2 cm H2O at 100 L/min.
8. A paediatric version exists with a capability of accurate tidal volume measurements between 15 and 200 mL.
9. A more accurate version of the Wright respirometer uses light reflection to measure the tidal volume. The mechanical causes of inaccuracies (friction and inertia) and the accumulation of water vapour are avoided. Other designs use a semiconductive device that is sensitive to changes in magnetic field. Tidal volume and minute volume can be measured by converting these changes electronically. An alarm system can also be added.
Pneumotachograph
This measures gas flow. From this, gas volume can be calculated.
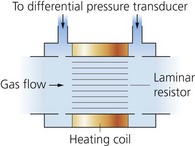
Mechanism of action
1. The principle of its function is sensing the change in pressure across a fixed resistance through which gas flow is laminar.
2. The pressure change is only a few millimetres of water and is linearly proportional, over a certain range, to the flow rate of gas passing through the resistance.
3. The tidal volumes can be summated over a period of a minute to give the minute volume.
4. It can measure flows in both inspiration and expiration (i.e. bidirectional).
Combined pneumotachograph and Pitot tube
This combination (Fig. 10.32) is designed to improve accuracy and calculate and measure the compliance, airway pressures, gas flow, volume/pressure (Fig. 10.33) and flow/volume loops. Modern devices can be used accurately even in neonates and infants.
The pitot tube
1. Two pressure ports – one facing the direction of gas flow, the other perpendicular to the gas flow. This is used to measure gas flow in one direction only.
2. In order to measure bidirectional flows (inspiration and expiration), two pressure ports face in opposite directions within the gas flow (Fig. 10.34).
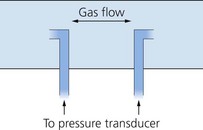
3. These pressure ports are connected to pressure transducers.
Mechanism of action
The pressure difference between the ports is proportional to the square of the flow rate.
Ventilator alarms
Pressure monitoring alarm
Mechanism of action
1. In this alarm, the peak inspiratory pressure is usually measured and monitored during controlled ventilation.
2. A decrease in peak inspiratory pressure activates the alarm. This indicates that the ventilator is unable to achieve the preset threshold pressure in the breathing system. Causes can be disconnection, gas leak or inadequate fresh gas flow.
3. An increase in the peak inspiratory pressure usually indicates an obstruction.
4. The low-pressure alarm can be set to 7 cm H2O, 7 cm H2O plus time delay or 13 cm H2O. The high-pressure alarm is set at 60 cm H2O.
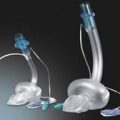
Peripheral nerve stimulators
These devices are used to monitor transmission across the neuromuscular junction. The depth, adequate reversal and type of neuromuscular blockade can be established (Fig. 10.36).
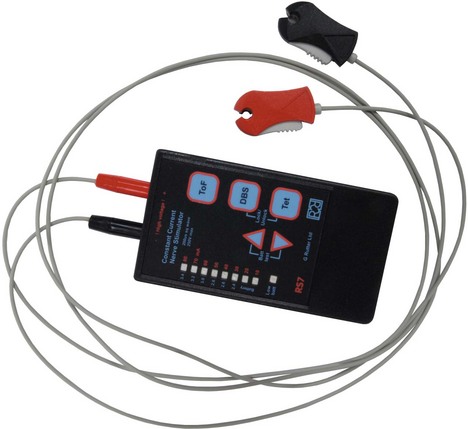
Components
1. Two surface electrodes (small ECG electrodes) are positioned over the nerve and connected via the leads to the nerve stimulator.
2. Alternatively skin contact can be made via ball electrodes which are mounted on the nerve stimulator casing.
3. The case consists of an on/off switch, facility to deliver a twitch, train-of-four (at 2 Hz) and tetanus (50 Hz). The stimulator is battery operated.
Mechanism of action
1. A supramaximal stimulus is used to stimulate a peripheral nerve. This ensures that all the motor fibres of the nerve are depolarized. The response of the muscle(s) supplied by the nerve is observed. A current of 15–40 mA is used for the ulnar nerve (a current of 50–60 mA may have to be used in obese patients).
2. This device should be battery powered and capable of delivering a constant current. It is the current magnitude that determines whether the nerve depolarizes or not, so delivering a constant current is more important than delivering a constant voltage as the skin resistance is variable (Ohm’s Law).
3. The muscle contraction can be observed visually, palpated, measured using a force transducer, or the electrical activity can be measured (EMG).
4. The duration of the stimulus is less than 0.2–0.3 ms. The stimulus should have a monophasic square wave shape to avoid repetitive nerve firing.
5. Superficial, accessible peripheral nerves are most commonly used for monitoring purposes, e.g. ulnar nerve at the wrist, common peroneal nerve at the neck of the fibula, posterior tibial nerve at the ankle and the facial nerve.
6. The negative electrode is positioned directly over the most superficial part of the nerve. The positive electrode is positioned along the proximal course of nerve to avoid direct muscle stimulation.
7. Consider the ulnar nerve at the wrist. Two electrodes are positioned over the nerve, with the negative electrode placed distally and the positive electrode positioned about 2 cm proximally. Successful ulnar nerve stimulation causes the contraction of the adductor pollicis brevis muscle.
Neuromuscular monitoring
There are various methods for monitoring the neuromuscular transmission using a nerve stimulator (Fig. 10.37).
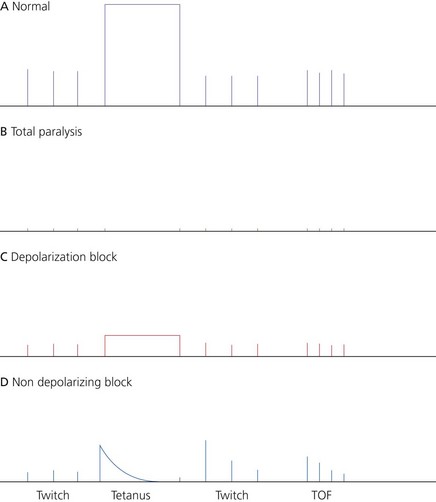
1. Twitch: a short duration (0.1–0.2 ms) square wave stimulus of a frequency of 0.1–1 Hz (one stimulus every 10 seconds to one stimulus every 1 second) is applied to a peripheral nerve. When used on its own, it is of limited use. It is the least precise method of assessing partial neuromuscular block.
2. Tetanic stimulation: a tetanus of 50–100 Hz is used to detect any residual neuromuscular block. Fade will be apparent even with normal response to a twitch. Tetanus is usually applied to anaesthetized patients because of the discomfort caused.
3. Train-of-four (TOF): used to monitor the degree of the neuromuscular block clinically. The ratio of the fourth to the first twitch is called the TOF ratio:
a) four twitches of 2 Hz each applied over 2 s. A gap of 10 s between each TOF
b) as the muscle relaxant is administered, fade is noticed first, followed by the disappearance of the fourth twitch. This is followed by the disappearance of the third then the second and last by the first twitch
c) on recovery, the first twitch appears first then the second followed by the third and fourth; reversal of the neuromuscular block is easier if the second twitch is visible
d) for upper abdominal surgery, at least three twitches must be absent to achieve adequate surgical conditions
e) the TOF ratio can be estimated using visible or tactile means. Electrical recording of the response is more accurate.
4. Post-tetanic facilitation or potentiation: this is used to assess more profound degrees of neuromuscular block.
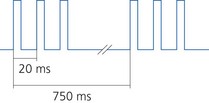
5. Double burst stimulation (Fig. 10.38): this allows a more accurate visual assessment than TOF for residual neuromuscular blockade. Two short bursts of 50 Hz tetanus are applied with a 750-ms interval. Each burst comprises of two or three square wave impulses lasting for 0.2 ms.
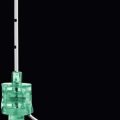
Bispectral index (BIS) analysis (Fig. 10.39)
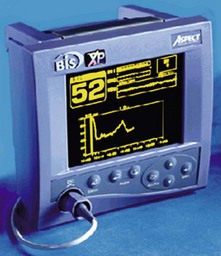
Fig. 10.39 BIS monitor.
Components
a) BIS (as a single value or trend)
b) facial electromyogram, EMG (in decibels)
d) signal quality index (SQI) which indicates the amount of interference from EMG.
2. A forehead sensor with four numbered electrodes (elements) and a smart chip. The sensor uses small tines, which part the outer layers of the skin, and a hydrogel to make electrical contact. It is designed to lower the impedance and to optimize the quality of the signal.
3. A smaller paediatric sensor with three electrodes is available. It has a flexible design to adjust to various head sizes and contours.
Mechanism of action
1. Bispectral analysis is a statistical method that quantifies the level of synchronization of the underlying frequencies in the signal.
2. BIS is a value derived mathematically using information from EEG power and frequency as well as bispectral information. Along with the traditional amplitude and frequency variables, it provides a more complete description of complex EEG patterns.
3. BIS is an empirical, statistically derived measurement. It uses a linear, dimensionless scale from 0 to 100. The lower the value, the greater the hypnotic effect. A value of 100 represents an awake EEG while zero represents complete electrical silence (cortical suppression). BIS values of 65–85 are recommended for sedation, whereas values of 40–60 are recommended for general anaesthesia. At BIS values of less than 40, cortical suppression becomes discernible in raw EEG as a burst suppression pattern (Fig. 10.40).
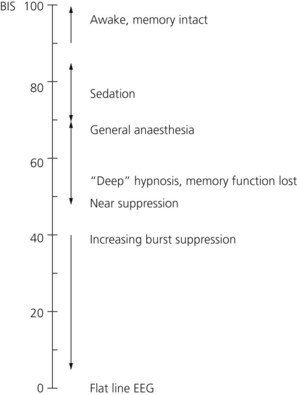
Fig. 10.40 BIS values scale.
4. BIS measures the state of the brain, not the concentration of a particular drug. So a low value for BIS indicates hypnosis irrespective of how it was produced.
5. It has been shown that return of consciousness occurs consistently when the BIS is above 60 and, interestingly, at the same time, changes in blood pressure and heart rate are poor predictors for response.
6. The facial electromyogram (in decibels) is displayed to inform the user of possible interference affecting the BIS value.
7. The sensor is applied on the forehead at an angle. It can be placed on either the right or left side of the head. Element number 1 is placed at the centre of the forehead, 5 cm above the nose. Element number 4 is positioned just above and adjacent to the eyebrow. Element number 2 is positioned between number 1 and number 4. Element number 3 is positioned on either temple between the corner of the eye and the hairline. The sensor will not function beyond the hairline. Each element should be pressed for 5 seconds with the fingertip.
8. Cerebral ischaemia from any cause can result in a decrease in the BIS value if severe enough to cause a global EEG slowing or outright suppression.
9. BIS is being ‘incorporated’ as an additional monitoring module that can be added to the existing modular patient monitors such as Datex-Ohmeda S/5, Philips Viridia or GE Marquette Solar 8000M. In addition to its use in the operating theatre, BIS has also been used in the intensive care setting to assess the level of sedation in mechanically ventilated patients.
Problems and safety features
1. Hypothermia of less than 33°C results in a decrease in BIS levels as the brain processes slow. In such situations, e.g. during cardiac bypass procedures, BIS reflects the synergistic effects of hypothermia and hypnotic drugs. A rapid rise in BIS usually occurs during rewarming.
2. Interference from non-EEG electrical signals such as electromyogram. High-frequency facial electromyogram activity may be present in sedated, spontaneously breathing patients and during awakening, causing BIS to increase in conjunction with higher electromyogram. Significant electromyogram interference can lead to a faulty high BIS despite the patient being still unresponsive. EEG signals are considered to exist in the 0.5–30-Hz band whereas electromyogram signals exist in the 30–300-Hz band. Separation is not absolute and low-frequency electromyogram signals can occur in the conventional EEG band range. The more recent BIS XP is less affected by electromyogram.
3. BIS cannot be used to monitor hypnosis during ketamine anaesthesia. This is due to ketamine being a dissociative anaesthetic with excitatory effects on the EEG.
4. Sedative concentrations of nitrous oxide (up to 70%) do not appear to affect BIS.
5. There are conflicting data regarding opioid dose–response and interaction of opioids with hypnotics on BIS.
6. Currently there are insufficient data to evaluate the use of BIS in patients with neurological diseases.
7. When the SQI value goes below 50%, the BIS is not stored in the trend memory. The BIS value on the monitor appears in ‘reverse video’ to indicate this.
8. Interference from surgical diathermy. A recent version, BIS XP, is better protected from the diathermy.
9. As with any other monitor, the use of BIS does not obviate the need for critical clinical judgement.
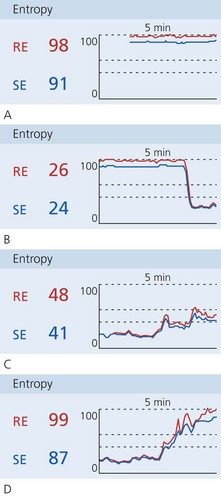
Entropy of the EEG
Both RE and SE are displayed with the RE ranges from 100 to zero and the SE ranges from a maximum of 91 to zero (Fig. 10.41). In practice, zero corresponds to a very ‘deep’ level of anaesthesia and values close to 100 correspond to the awake patient. Like BIS, values between 40 and 60 represent clinically desirable depths of anaesthesia. At this level, the SE and RE indexes should be similar if not identical.
McGrath C.D., Hunter J.M. Monitoring of neuromuscular block. Continuing Education in Anaesthesia. Critical Care and Pain. 2006;6(1):7–12.
MHRA. Medical device alert: Unilect (TM) ECG monitoring electrodes manufactured by Unomedical (MDA/2010/046). Online. Available at http://www.mhra.gov.uk/Publications/Safetywarnings/MedicalDeviceAlerts/CON084595, 2010.
MHRA. Pulse oximeter top tips. Online. Available at http://www.mhra.gov.uk/Publications/Postersandleaflets/CON100224, 2012.
Patel S., Souter M. Equipment-related electrocardiographic artifacts: causes, characteristics, consequences, and correction. Anesthesiology. 2008;108:138–148.
In the following lists, which of the statements (a) to (e) are true?
a) Capnography is a more useful indicator of ventilator disconnection and oesophageal intubation than pulse oximetry.
b) Capnography typically works on the absorption of CO2 in the ultraviolet region of the spectrum.
c) In side-stream analysers, a delay in measurement of less than 38 s is acceptable.
d) The main-stream analyser type can measure other gases simultaneously.
e) In patients with chronic obstructive airways disease, the waveform can show a sloping trace instead of the square shape wave.
2. Concerning oxygen concentration measurement:
a) An infrared absorption technique is used.
b) Paramagnetic analysers are commonly used because oxygen is repelled by the magnetic field.
c) The galvanic (fuel cell) analyser has a slow response time of about 20 s and a lifespan of about 1 year.
d) The fast responding analysers should be positioned as near the patient as possible.
e) Paramagnetic analysers can provide breath-to-breath measurement.
a) The probe consists of two emitting diodes producing beams at red and infrared frequencies.
b) Accurately reflects the ability of the patient to eliminate CO2.
c) The measurements are accurate within the clinical range of 70–100%.
d) Carbon monoxide in the blood causes a false under-reading.
a) Mean blood pressure is the systolic pressure plus one-third of the pulse pressure.
b) Too small a cuff causes a false high pressure.
c) Oscillotonometry is widely used to measure blood pressure.
d) The Finapres technique uses ultraviolet light absorption to measure the blood pressure.
e) A slow cuff inflation followed by a fast deflation are needed to improve the accuracy of a non-invasive blood pressure technique.
a) It is a fixed orifice variable pressure flowmeter.
b) It consists of two sensitive pressure transducers positioned on either side of a resistance.
c) It is capable of flowing in one direction only.
d) A Pitot tube can be added to improve accuracy.
e) Humidity and water vapour condensation have no effect on its accuracy.
6. Polarographic oxygen electrode:
a) It can measure oxygen partial pressure in a blood or gas sample.
b) The electrode acts as a battery requiring no power source.
c) Oxygen molecules pass from the sample to the potassium chloride solution across a semipermeable membrane.
d) It uses a silver cathode and a platinum anode.
e) The amount of electrical current generated is proportional to the oxygen partial pressure.
a) It is best positioned on the inspiratory limb of the ventilator breathing system.
b) It is a bidirectional device.
c) It is accurate for clinical use.
d) It over-reads at high flow rates and under-reads at low flow rates.
8. Paramagnetic gases include:
9. Oxygen in a gas mixture can be measured by:
10. The concentrations of volatile agents can be measured using:
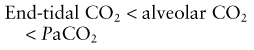
11. A patient with healthy lungs and a PaCO2 of 40 mmHg will have which of the following percentages of CO2 in the end expiratory mixture?
a) It uses a linear dimensionless scale from 0 to 100 Hz.
b) Hypothermia can increase the BIS value.
c) The BIS value is not accurate during ketamine anaesthesia.
d) Interference can occur due to EMG or diathermy.
e) BIS can measure the drug concentration of a particular drug.
a) The monitoring mode of ECG has a wider frequency response range than the diagnostic mode.
b) The electrical potentials have a range of 0.5–2 V.
c) Interference due to electrostatic induction can be reduced by surrounding ECG leads with copper screens.
d) Silver and silver chloride electrodes are used.
e) It is standard in the UK to use a display speed of 25 cm/s and a sensitivity of 1 mV/cm.
a) CO2 absorbs infrared radiation mainly at a wavelength of 4.3 mm.
b) Photo-acoustic spectrometry is more stable than the conventional infrared spectrometry.
c) Sampling catheter leak is a potential problem with the side-stream analysers.
d) A wavelength of 4.6 µm is used for nitrous oxide measurement.
e) A wavelength of 3.3 µm is used to measure the concentration of inhalational agents.
Single best answer (SBA)
15. Regarding the minimum monitoring required for anaesthesia:
a) Renders bed-side clinical signs obsolete.
b) ECG monitoring is essential.
c) Modern ECG monitoring is immune from artefacts.
d) Non-invasive blood pressure requires two cuffs and a minimum cycle time of 1 minute.
e) National Institute for Health and Clinical Excellence (NICE) guidelines forbid temperature monitoring.
a) True. Capnography gives a fast warning in cases of disconnection or oesophageal intubation. The end-tidal CO2 will decrease sharply and suddenly. The pulse oximeter will be very slow in detecting disconnection or oesophageal intubation as the arterial oxygen saturation will remain normal for longer periods especially if the patient was preoxygenated.
b) False. CO2 is absorbed in the infrared region.
c) False. In side-stream analysers, a delay of less than 3.8 s is acceptable. The length of the sampling tubing should be as short as possible, e.g. 2 m, with an internal diameter of 1.2 mm and a sampling rate of about 150 mL/min.
d) False. Only CO2 can be measured by the main-stream analyser. CO2, N2O and inhalational agents can be measured simultaneously with a side-stream analyser.
e) True. In patients with chronic obstructive airways disease, the alveoli empty at different rates because of the differing time constants in different regions of the lung with various degrees of altered compliance and airway resistance.
2. Concerning oxygen concentration measurement:
a) False. Oxygen does not absorb infrared radiation. Only molecules with two differing atoms can absorb infrared radiation.
b) False. Oxygen is attracted by the magnetic field because it has two electrons in unpaired orbits.
c) True. The fuel cell is depleted by continuous exposure to oxygen due to the exhaustion of the cell giving it a lifespan of about 1 year.
d) True. Although the positioning of the oxygen analyser is still debatable, it has been recommended that the fast responding ones are positioned as close to the patient as possible. The slow responding analysers are positioned on the inspiratory limb of the breathing system.
e) True. Modern paramagnetic analysers have a rapid response allowing them to provide breath-to-breath measurement. Older versions have a 1-min response time.
a) True. The probe uses light-emitting diodes (LEDs) that emit light at red (660 nm) and infrared (940 nm) frequencies. The LEDs operate in sequence with an ‘off’ period when the photodetector measures the background level of ambient light. This sequence happens at a rate of about 30 times per second.
b) False. Pulse oximetry is a measurement of the arterial oxygen saturation.
c) True. Readings below 70% are extrapolated by the manufacturers.
d) False. Using a pulse oximeter, carbon monoxide causes a false high reading of the arterial oxygen saturation.
e) True. The probe can cause pressure sores with continuous use so its site should be checked at regular intervals. Some recommend changing the site every 2 hours.
a) False. The mean blood pressure is the diastolic pressure plus one-third of the pulse pressure (systolic pressure − diastolic pressure).
b) True. The opposite is also correct.
c) True. Most of the non-invasive blood pressure measuring devices use oscillometry as the basis for measuring blood pressure. Return of the blood flow during deflation causes pressure changes in the cuff. The transducer senses the pressure changes which are interpreted by the microprocessor.
d) False. The Finapres uses oscillometry and a servo control unit is used.
e) False. Slow cuff inflation leads to venous congestion and inaccuracy. A fast cuff deflation might miss the oscillations caused by the return of blood flow (i.e. systolic pressure). A fast inflation and slow deflation of the cuff is needed. A deflation rate of 3 mmHg/s or 2 mmHg/beat is adequate.
a) True. The pneumotachograph consists of a tube with a fixed resistance, usually as a bundle of parallel tubes, and is therefore a ‘fixed orifice’ device. As the fluid (gas or liquid) passes across the resistance, the pressure across the resistance changes, therefore it is a ‘variable pressure’ flowmeter.
b) True. The two pressure transducers measure the pressures on either side of the resistance. The pressure changes are proportional to the flow rate across the resistance.
c) False. It can measure flows in both directions; i.e. it is bidirectional.
d) True. The combined design improves accuracy and allows the measurement and calculation of other parameters: compliance, airway pressure, gas flow, volume/pressure and flow/volume loops.
e) False. A laminar flow is required for the pneumotachograph to measure accurately. Water vapour condensation at the site of the resistance leads to the formation of turbulent flow thus reducing the accuracy of the measurement.
6. Polarographic oxygen electrode:
a) True. The polarographic (Clark) electrode analysers can be used to measure oxygen partial pressure in a gas sample (e.g. on an anaesthetic machine giving an average inspiratory and expiratory concentration) or in blood in a blood gas analyser.
b) False. A power source of about 700 mV is needed in a polarographic analyser. The galvanic analyser (fuel cell) acts as a battery requiring no power source.
c) True. The oxygen molecules pass across a Teflon semipermeable membrane at a rate proportional to their partial pressure in the sample into the sodium chloride solution. The performance of the electrode is affected as the membrane deteriorates or perforates.
d) False. The opposite is correct: the anode is made of silver and the cathode is made of platinum.
e) True. When the oxygen molecules pass across the membrane, very small electrical currents are generated as electrons move from the cathode to the anode.
a) False. The Wright respirometer is best positioned on the expiratory limb of the ventilator breathing system. This minimizes the loss of gas volume due to leaks and expansion of the tubing on the inspiratory limb.
b) False. It is a unidirectional device allowing the measurement of the tidal volume if the flow of gases is in one direction only. An arrow on the device indicates the correct direction of the gas flow.
c) True. It is suitable for routine clinical use with an accuracy of ±5–10% within a range of flows of 4–24 L/min.
d) True. Over-reading at high flows and under-reading at low flows is due to the effect of inertia on the rotating vane. Using a Wright respirometer based on light reflection or the use of a semiconductive device, sensitive to changes in magnetic field, instead of the mechanical components, improves the accuracy.
e) True. The Wright respirometer can measure the volume per breath, and if the measurement is continued for 1 minute, the minute volume can be measured as well.
8. Paramagnetic gases include:
a) True. Oxygen is attracted by the magnetic field because it has two electrons in unpaired orbits causing it to possess paramagnetic properties.
9. Oxygen in a gas mixture can be measured by:
a) True. The oxygen molecules diffuse through a membrane and electrolyte solution to reach the cathode. This generates a current proportional to the partial pressure of oxygen in the mixture.
b) False. Oxygen does not absorb ultraviolet radiation. Halothane absorbs ultraviolet radiation.
c) True. Mass spectrometry can be used for the measurement of any gas. It separates the gases according to their molecular weight. The sample is ionized and then the ions are separated. Mass spectrometry allows rapid simultaneous breath-to-breath measurement of oxygen concentration.
d) True. Although polarographic analysers are used mainly to measure oxygen partial pressure in a blood sample in blood gas analysers, they can also be used to measure the partial pressure in a gas sample. See Question 6 above.
e) False. Gases that absorb infrared radiation have molecules with two different atoms (e.g. carbon and oxygen in CO2). An oxygen molecule has two similar atoms.
10. The concentrations of volatile agents can be measured using:
a) False. The fuel cell is used to measure the oxygen concentration.
b) True. A piezoelectric quartz crystal with a lipophilic coat undergoes changes in natural frequency when exposed to a lipid-soluble inhalational agent. It lacks agent specificity. It is not widely used in current anaesthetic practice.
c) True. Halothane can absorb ultraviolet radiation. It is not used in current anaesthetic practice.
d) True. Infrared radiation is absorbed by all the gases with dissimilar atoms in the molecule. Infrared analysers can be either side stream or main stream.
e) False. The Clark polarographic electrode is used to measure oxygen concentration.
11. A patient with healthy lungs and a PaCO2 of 40 mmHg will have which of the following percentages of CO2 in the end expiratory mixture?
b) True. In a patient with healthy lungs, the end-tidal CO2 concentration is a true reflection of the arterial CO2. A PaCO2 of 40 mmHg (5.3 kPa) is therefore equivalent to an end-tidal CO2 of about 5 kPa. One atmospheric pressure is 760 mmHg or 101.33 kPa. That makes the end-tidal CO2 percentage about 5%.
a) False. BIS uses a linear dimensionless scale of 0–100 without any units. The lower the BIS value, the greater the hypnotic effect. General anaesthesia is between 40 and 60.
b) False. Hypothermia below 33°C decreases the BIS value as the electrical activity in brain is decreased by the low temperature.
c) True. The BIS value is not accurate during ketamine anaesthesia. Ketamine is a dissociative anaesthetic with excitatory effects on the EEG.
d) True. Newer versions have better protection from diathermy and EMG.
e) False. BIS monitors the electrical activity in the brain and not the concentration of a particular drug.
a) False. The monitoring mode has a limited frequency response of 0.5–40 Hz whereas the diagnostic mode has a much wider range of 0.05–100 Hz.
b) False. The electrical activity of the heart has an electrical potentials range of 0.5–2 mV.
c) True. Surrounding the ECG leads with copper screens reduces interference due to electrostatic induction and capacitance coupling.
d) True. Silver and silver chloride form a stable electrode combination. They are held in a cup and separated from the skin by a foam pad soaked in conducting gel.
e) False. The standard in the UK is to use a display speed of 25 mm/s and a sensitivity of 1 mV/cm.
a) False. CO2 absorbs infrared radiation mainly at a wavelength of 4.3 µm.
b) True. Photo-acoustic spectrometry is more stable than the conventional infrared spectrometry. Its calibration remains constant over much longer periods of time.
c) True. This is not the case with the main-stream analysers.
d) True. Optical filters are used to select the desired wavelengths to avoid interference from other vapours or gases.
e) False. For the inhalational agents, higher wavelengths are used, such as 8–9 µm, to avoid interference from methane and alcohol (at 3.3 µm).