CHAPTER 348 Neurovascular Imaging
Moniz performed the first cerebral angiogram in 1927.1,2 Since that time, neurovascular imaging has undergone rapid evolution. The introduction of computed tomography (CT) and magnetic resonance imaging (MRI) offered viable noninvasive means of imaging the neurovascular tree. More recently, improvements in technology and technique have enabled the acquisition of direct and indirect hemodynamic measurements and functional and physiologic data, as well as visualization of intravascular pathology.
Computed Tomography–Based Techniques
Since the advent of CT in the 1970s, serial advances in imaging technique and computer software have provided increasingly detailed imaging of cerebrovascular anatomy, as well as the neurophysiologic properties of the brain in both the normal and pathologic states. For a comprehensive review of the available literature, please see the American Heart Association scientific statement on guidelines and recommendations for perfusion imaging in cerebral ischemia.3
Computed Tomographic Angiography
Technique
After the initial acquisition of non–contrast-enhanced head CT, 100 to 120 mL of nonionic intravenous contrast agent is administered at a rate of 3 to 4 mL/sec. A scanning delay is built in based on either detection of contrast material within the aortic arch or an empirical delay of 25 seconds. The area of the aortic arch to the circle of Willis is then imaged in 2.5-mm-thick slices. Postprocessing is generally performed at a computer workstation to generate reformatted and three-dimensional (3D) maximum intensity projection images.3–5
Clinical Applications
Cerebral Aneurysm
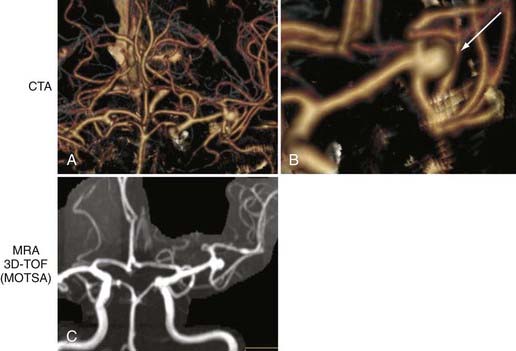
One of the most clinically useful applications of CTA is detection (Fig. 348-1A and B) and follow-up of cerebral aneurysms. Although digital subtraction angiography (DSA) has traditionally been the “gold standard” for detection of cerebral aneurysms, CTA has proved to have a sensitivity of greater than 90% for detection of aneurysms less than 2 mm in diameter.4–6 Because of the availability and speed of CTA, it has become the first-line imaging choice for subarachnoid hemorrhage (SAH) in many institutions. However, negative CTA findings necessitate subsequent DSA for evaluation of possible small aneurysms.
Because DSA is invasive and expensive, noninvasive modalities such as CTA are used to monitor aneurysms after treatment. CTA has been shown to be feasible for monitoring coiled aneurysms,6 but clipped aneurysms produce too much artifact to be well visualized on CTA, so specialized protocols have been developed to optimize the visualization of clipped aneurysms with CTA. Brown and coauthors reported on a technique in which CTA is performed with the patient’s head tilted so that the axial plane through the aneurysm clip projects away from the remainder of the circle of Willis. In their hands, this technique, when combined with other artifact-reducing methods (i.e., thin collimation), provides improved resolution of previously clipped aneurysms and surrounding structures.7
Acute Ischemia
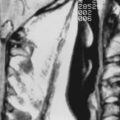
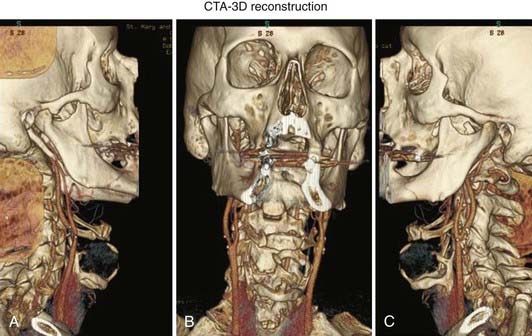
The speed and ease of CTA have made it part of the stroke protocol at many institutions. Excellent views of the carotid (Fig. 348-2) and vertebral arteries in the neck can be inspected for evidence of stenosis, dissection, or thrombus. In addition, the primary intracerebral branches (i.e., the M1 division of the middle cerebral artery) may also be well visualized (see Fig. 348-1) and may confirm the vascular territory of the infarct and provide guidance for subsequent intra-arterial chemical or mechanical thrombolysis.
Chronic Ischemia/Carotid Stenosis
CTA is increasingly being used as a stand-alone diagnostic test to identify carotid stenosis (see Fig. 348-2). Because it is noninvasive, CTA is frequently preferred over DSA for outpatients or for those who cannot otherwise tolerate DSA.
Other
Another major advantage of CTA over DSA or MRA is that it provides excellent visualization of bony anatomy as it relates to vascular structures. For example, many rely on visualizing the optic strut on CTA to determine whether an ophthalmic aneurysm is intradural or extradural.8 CTA can also provide visualization of intraluminal thrombus.
Despite improvements, CTA does not always provide the same anatomic detail as either MRI or DSA. Information about flow rates or collateralization is not available on standard CTA sequences. As discussed later, CT perfusion can provide reliable relative cerebral blood flow (CBF) data.9
Computed Tomographic Perfusion
There have been attempts to use CT scans to provide functional and physiologic data since its advent in the 1970s. Only recently, however, have technologic advances allowed CT perfusion to be performed in timely fashion on standard helical scanners, which has consequently made it part of the stroke protocol at many institutions.10–13
Technique
The most commonly used technique is called dynamic contrast-enhanced CT. After the acquisition of unenhanced images on a helical scanner, two to four sections are chosen for analysis based on the non–contrast-enhanced CT scans. The area of the basal ganglia is frequently used as one of these sections because it includes vascular territories from the anterior, middle, and posterior cerebral arteries. In this technique, the first pass of an iodinated contrast bolus through the cerebral circulation is monitored. The contrast material causes a transient increase in attenuation that is used to generate time-attenuation curves. Mathematical modeling and deconvolution analysis are then used to generate the key measurements in the identification of ischemic and infarcted brain tissue.14 Perfused blood volume mapping is a separate technique that requires only subtraction of the unenhanced CT images from subsequent CTA images to obtain maps of the blood volume present. In contrast to the dynamic contrast-enhanced technique, perfused blood volume mapping can image the entire brain volume. However, it cannot evaluate CBF or mean transit time (MTT) and thus cannot be used to identify a stroke penumbra and consequently is used infrequently.3
Clinical Applications
Acute Stroke
The key benefit in using CT perfusion is its ability to determine cerebral blood volume (CBV), CBF, MTT, and time to peak enhancement. These measurements are most useful for identification of the stroke “penumbra” of ischemic but not yet infarcted brain tissue that can potentially be saved by either intravenous or intra-arterial thrombolysis. Srinivasan and colleagues noted that “the clinical application of CT perfusion imaging in acute stroke is based on the hypothesis that the penumbra shows either (1) increased MTT with moderately decreased CBF (>60%) and normal or increased CBV (80% to 100% or higher) secondary to autoregulatory mechanisms or (2) increased MTT with markedly reduced CBF (>30%) and moderately reduced CBV (>60%), whereas infarcted tissue shows severely decreased CBF (<30%) and CBV (<40%) with increased MTT.”5 Complex deconvolution algorithms can then be used to produce color maps on which areas of a potential penumbra can quickly be identified. A large penumbra may prompt further attempts at clot lysis or retrieval, whereas a small or absent penumbra may be evidence that any new intervention will just incur new risks without any additional advantage in preserving brain tissue.
CT perfusion has been shown to be comparable to Xe-CT for evaluation of regional CBF.15 However, CT perfusion is faster and easier to use. Helical/spiral CT scanners are readily available in most institutions, and CT perfusion can usually be combined with CTA to provide data about the site of the obstructed vessel. Images can be acquired and easily conceptualized maps generated with enough speed to be of use in an acute stroke protocol.14,16
Early reports suggested that CTA with or without CT perfusion may offer a noninvasive way of evaluating vasospasm.17,18 A study of CTA alone had a sensitivity and specificity of 86.8% and 96.8%, respectively, for mild to moderate vasospasm and 76.5% and 99.5%, respectively, for severe vasospasm, whereas CT perfusion had a sensitivity and specificity of 20% and 100%, respectively, for mild to moderate vasospasm and 90% and 100%, respectively, for severe vasospasm.18 This and other studies suggest that in the near future, the combination of these two modalities may provide high sensitivity and specificity for the noninvasive evaluation of vasospasm.19
Xenon-Enhanced Computed Tomography
Xe-CT has been in use for more than 30 years20,21 and relies on application of the Kety-Schmidt equation to calculate CBF. Xenon is a small, biologically inert and inhalable molecule that serves as the “contrast agent.” Its easily crosses the blood-brain barrier and has a short half-life (40 seconds).16 Thus, it is an ideal tracer for the evaluation of cerebral perfusion. Xenon causes x-ray attenuation similar to iodine and hence can quickly be identified with CT-based technology. By measuring the xenon tissue concentration, both arterial input and tissue uptake can be determined.21
Technique
A stable (nonradioactive) xenon and oxygen (28% Xe, 21% to 60% O2) mixture is inhaled over the course of 4.33 minutes. A nonenhanced CT scan is obtained, and four to six contiguous, 10-mm-thick levels are selected for study.16 Each level is scanned six times across the inhalation time, which requires exact table relocation. As xenon gas builds up in cerebral tissue, a mild sedative effect, respiratory depression, or nausea has been reported.16 These effects usually resolve over a few minutes after the procedure.
The CT scanner subtracts the baseline x-ray attenuation coefficients from those obtained during xenon accumulation. A modified Kety-Schmidt equation is used to calculate CBF for each voxel based on the rate of change in the concentration of xenon in the blood and brain and on the blood-brain partition coefficient for xenon. This yields flow data that are most accurate for regions of interest greater than 100 voxels (1 voxel = 10 mm3). These flow data can be overlaid on the standard CT image to create an anatomic quantitative flow map.3,22
Clinical Applications
Acute Stroke
Many studies have demonstrated the accuracy of Xe-CT in determining CBF values, which can then be used to identify areas of reversible and irreversible ischemia.16,20,21,23 Flow values determined with Xe-CT have also been used to identify volumes of eventual infarction and areas at increased risk for hemorrhage and edema.
Chronic Ischemia
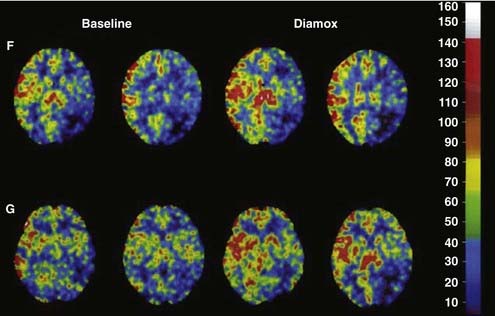
Xe-CT–determined CBF has been used in conjunction with hypotensive or acetazolamide challenge to identify the subset of patients at higher risk for future infarction. For a detailed review of cerebral hemodynamic impairment, methods of measurement, and the association with stroke risk, please see Derdeyn and associates.23 These patients may benefit from either surgical (e.g., extracranial-to-intracranial bypass) or endovascular flow augmentation (Fig. 348-3).
Balloon Occlusion Testing
Xe-CT provides a well-studied method for obtaining quantitative values for CBF. Indeed, early work from Yonas’ group and others provides the basis for much of our understanding of cerebral hemodynamics.16,23,24 It can be used in conjunction with other CT studies such as CTA. Moreover, because it is so well studied, the results are standardized between different scanners and different centers.
Single-Photon Emission Computed Tomography
Technique
SPECT uses a radioisotope such as technetium 99m attached to a delivery compound such as hexamethylpropyleneamine oxime or ethylcysteinate dimer to cross the blood-brain barrier after intravenous injection. The radioisotope is metabolized and trapped in the tissue, with its uptake being proportional to CBF at the time of injection. Imaging can then be performed for several hours after the injection.3
Direct quantification of CBF is not generally possible without an indwelling arterial line, and therefore a semiquantitative approach is frequently used. In this method, the relative counts of the radioisotope are compared between the area of interest (i.e., the area of presumed infarction) and another control area. One drawback of the technique is that patients with acute stroke frequently have underlying chronic ischemia, which may make interpretation of relative uptake difficult. In addition, acute changes in CBF can be seen in “unaffected” control areas, which again will obfuscate direct comparison of radioisotope uptake in different regions.3
Clinical Applications
Ischemia
SPECT imaging has been used in patients with both acute and chronic ischemia to determine areas of infarction, as well as areas of ischemia that are at risk for infarction.3 Although the technique frequently provides only semiquantitative or relative data comparison, it has still been shown to have a good degree of sensitivity and specificity for stroke detection,25 as well as for correlation with stroke volume, response to thrombolytic therapy, and clinical outcome.26,27
Vasospasm
SPECT evidence of hypoperfusion has been shown to correlate with delayed neurological deficits in the setting of SAH.28 It may be able to provide noninvasive evidence of vasospasm when used in conjunction with the transcranial Doppler method.
Balloon Occlusion Testing
SPECT (Fig. 348-4) can be used as an adjunct to angiographic, electroencephalographic, and neurological determination of a patient’s ability to tolerate hypoperfusion in a given vascular territory.
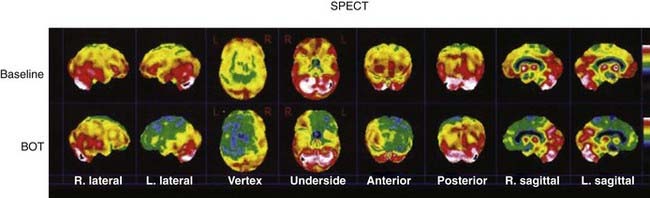
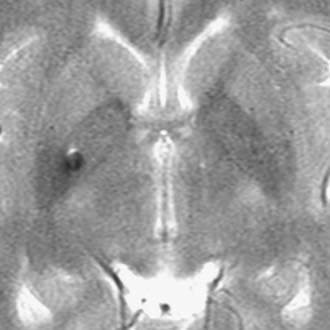
FIGURE 348-4 A 78-year-old woman with a history of a previously coiled left carotid-ophthalmic, internal carotid artery aneurysm was found to have significant recurrence on magnetic resonance angiography (MRA) and digital subtraction angiography (DSA). In preparation for possible vessel sacrifice, multiple planar and tomographic images of the cerebral hemispheres were obtained 30 minutes after the injection of 30.1 mCi of radiolabeled cerebral perfusion agent and balloon inflation. Single-photon emission computed tomography showed that when compared with the baseline study, there is a dramatic change in the relative perfusion of the left cerebral hemisphere. Markedly decreased activity is noted throughout the left frontal, temporal, and parts of the posterior parietal region in the left hemisphere. In addition, the medial temporal lobe and basal ganglion on the left show decreased activity in comparison to baseline. BOT, balloon occlusion test. (For related DSA and MRA images, please see Fig. 348-7.)
Magnetic Resonance Imaging–Based Techniques
Magnetic Resonance Angiography
Technique
MRI utilizes radiofrequency (RF) excitation/pulses and specific magnetic localizing fields to enable visualization of variations in proton spin.29,30 Currently, there are a variety of methods by which MRI can be optimized to acquire angiographic data. However, a detailed and exhaustive discussion is beyond the scope of this chapter. For the purposes of introduction, there are three general approaches to MRA: time-of-flight (TOF), phase-contrast (PC), and contrast-enhanced (CE) MRA. In general, direct visualization of blood vessels with TOF or PC techniques is achieved by taking advantage of the dynamic nature of flowing blood in comparison to the static surrounding tissue to create “angiographic contrast” without the use of intravenous agents. CE MRA, however, relies on intravenous agents to provide contrast.
Time of Flight
TOF MRA is based on the principle known as flow-related enhancement (FRE). Briefly, MRI relies on the application of RF excitation pulses to a given section or slice.29,31 Repeated pulses without adequate recovery time can saturate the section and reduce signal intensity. Stationary tissue is subject to repeated pulses and thus has attenuated intensity. Conversely, moving tissue (flowing blood) will not be subject to the saturation effects of repeated pulses because it washes in and out of the imaging plane. As a result, flowing blood appears brighter than the static surrounding tissue. FRE is increased as the vessel approaches a perpendicular orientation with respect to the slice plane. Simply stated, as blood flow velocity increases in the plane perpendicular to the slice, FRE increases. Unfortunately, based on the same principles, imaging of slow flow and in-plane flow can be challenging with the TOF technique.31 As discussed later, use of contrast agents, which helps increase intensity, can partially mitigate this problem.
The typical TOF technique uses gradient-recalled echoes.29,30 As a result, vessels are hyperintense and appear white (white blood images). The flip angle of the excitation pulse is variable, with a typical range of 15 to 60 degrees. As the angle increases, the saturation effect increases. Spin echo acquisition can be used to create black blood images. For this technique, two RF pulses are applied. The first excitation pulse is applied at 90 degrees and the second, refocusing pulse at 180 degrees. Basically, if blood is flowing fast enough, the blood flows out of the slice before a refocusing pulse is applied and a hypointense region results.31
TOF images can be acquired in a two-dimensional (2D) or 3D mode. 2D TOF protocols acquire a single slice per pass.29 3D TOF protocols acquire images from multiple slices or a “slab” of data in a single pass and stack them sequentially. 3D TOF provides thinner slices with better spatial resolution and shorter echo times. However, when multiple slices are acquired simultaneously, FRE is highest in the first or entry slice and degrades in the interior slices as the blood becomes progressively saturated. Thus, 3D TOF is prone to this entry slice effect. The loss of signal is particularly evident in slow-flow situations. Specialized techniques, such as multiple overlapping thin-slab angiography (MOTSA), have been developed to account for this problem.31
Phase Contrast
MRI takes into account both the magnitude of the signal and its phase. Phase differences may occur for many reasons but can be used to determine motion occurring in a given direction in a magnetic gradient. To obtain a PC measurement, two images are subtracted. One image is taken with a bipolar gradient oriented in a specified direction, whereas the other image is taken with the gradient reversed.31 This process selects for phase differences caused by motion. Moreover, because phase is proportional to the velocity of the motion in the direction of the applied gradient, PC imaging can be used to quantify the velocity and direction of flow. If all voxels or subvoxels have a uniform phase angle, signal intensity is maximized. Signal is suppressed if voxel motion is not in a uniform direction or is out of phase (intravoxel dephasing). Laminar flowing blood generally accumulates a uniform phase as compared with static tissue and therefore appears hyperintense. However, complex flow patterns such as those seen at branch points, sharp turns, or distal to stenoses can lead to significant signal loss. Pulsatile flow can also result in inconsistent phase and signal loss that leads to ghosting artifact. Cardiac cycle–triggered acquisition can mitigate this problem.
As mentioned earlier, PC MRI can be used to obtain quantitative data because the velocity and direction of flow are encoded in the magnitude and sign of the phase difference, respectively. The velocity that leads to a phase difference of 180 degrees is known as the velocity encoding (VENC) and is the highest velocity that can be measured unambiguously with this method. The MRI operator selects the VENC setting. Smaller VENCs improve the signal-to-noise ratio while exacerbating other problems such as flow-related bias. Thus, in an effort to optimize the signal-to-noise ratio, one must not only take into consideration the coil, FRE, and the voxel but must also select a VENC that is slightly greater than the velocity of flow in the vessel of interest.31
Quantitative PC (qPC) MRA is a powerful technique that offers many benefits over other direct and indirect flow measurement methods. As understanding of the pathophysiology of neurovascular disease advances, recognition of the importance of flow data has become clearer.24,32 Volume flow measured with qPC MRA is simply the product of the velocity of blood and the area of the vessel through which it flows. Errors caused by inaccurate/incomplete (partial volume error) definition of the vessel or nonlinear flow (curved flow error) can significantly reduce the accuracy of flow quantification. With this in mind, accurate and reliable definition of the vessel is paramount. To reduce these effects, it is advantageous to select an optimal vessel segment that is straight and a slice orientation that is perpendicular to the vessel segment.31,33 2D TOF localization is useful for long straight vessels but is not as accurate when examining the branching and often tortuous intracranial circulation. In light of this problem, alternative localization techniques have been explored.33–36
In 2000, Zhao and coauthors reported the benefit of a 3D localization technique.36 This technique is the basis for the Noninvasive Optimal Vessel Analysis (NOVA; VasSol, Inc, River Forest, IL) qPC MRA protocol that has been more widely accepted as a means of noninvasively measuring intracranial blood flow. Briefly, the volumetric flow rate in cerebral vessels can be measured noninvasively with a PC MRA technique. The technique of blood flow quantification by qPC MRA has been described previously and is now implemented and enhanced with the commercially available software called NOVA. Axial 2D or 3D TOF MRA is performed and the acquired images are transmitted to a computer workstation where the NOVA software is used to create a rotating 3D surface rendering of the vasculature, including the circle of Willis, with a marching cube algorithm.36 From a scan line calculated by a line-fitting algorithm, a double-oblique scan is performed by using gated 2D PC MRA, imaged perpendicular to the vessel axis. A flow report on each vessel of interest is created with the NOVA software; this report includes the mean volumetric flow rate. Images can be acquired with either a 1.5- or 3-T MRI unit. Flow measurements performed on 1.5- and 3-T units have been demonstrated to be equivalent.37
Contrast Enhanced
Unlike TOF and PC MRA, CE MRA does not rely on FRE or phase differences to create contrast. Instead, the CE MRA technique is based on shortening of blood T1 when a bolus of paramagnetic contrast media is infused.31 To be effective, the contrast bolus must be temporally coordinated with the acquisition of images. CE MRA is more like conventional x-ray–based angiography in that it provides visualization based on filling of the lumen with contrast material. Because CE MRA does not rely on flow, it can be extremely useful in slow-flow regions, in tortuous or branching vessels, or when interested in examining the luminal surface or atherosclerotic plaque morphology.38
Magnetic Resonance Perfusion and Diffusion Imaging
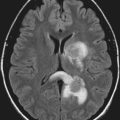
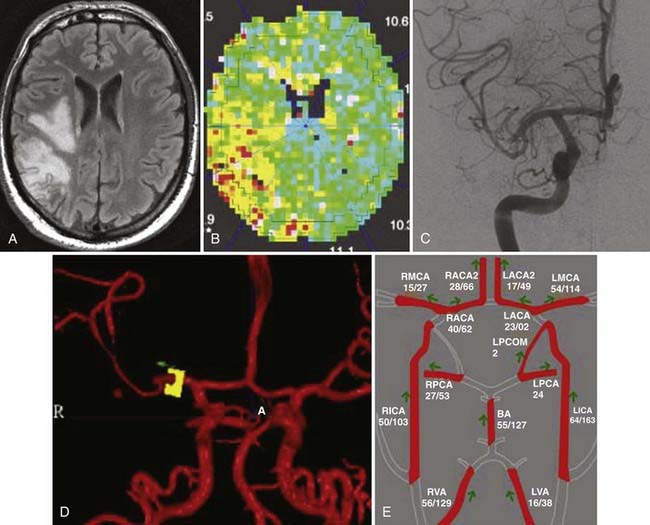
Unlike the methods mentioned earlier, MR perfusion protocols offer an indirect way of estimating blood flow in a given area of brain. These are not MRA techniques but are included because of their utility in evaluating the neurovascular tree. A rapid gradient echo, echo planar sequence is used to acquire multiple volumes of images through the brain during the first passage of a standard dose of a gadolinium-based contrast agent administered rapidly (5 mL/sec, antecubital vein) as an intravenous bolus through the capillary bed of the brain. Measurement of all the data takes less than 1 minute. Just as with CT perfusion, there are several methods for processing the temporal information within the time course. If postprocessing uses an arterial input function (AIF) and indicator-dilution calculations, a map in which the signal intensity is proportional to CBF can be produced.39,40 Similarly, maps of CBV and MTT can also be obtained. In general, the AIF is difficult to define, and such analyses are used to obtain relative blood flow data. MR perfusion is ideally suited for perfusion measurements in the capillary bed but is not appropriate for large vessels or in areas of high vascularity.16 MR perfusion is useful for qualitative flow analysis. qPC MRA, as discussed earlier, is the best choice for specific flow data. When combined with data from MR diffusion imaging, MR perfusion has been used to provide an estimate of the penumbra and therefore tissue that may be salvageable with proper therapy (Fig. 348-5A and B).16
Clinical Applications
Cerebral Aneurysm
DSA has been the gold standard for the evaluation of cerebral aneurysms. Its major benefit is that it provides high-resolution images with minimal bone/soft tissue artifact. The major drawback is the invasive nature of the procedure. Indeed, a recent meta-analysis reported that the risk for permanent and transient neurological complication associated with DSA for the diagnosis of unruptured and ruptured aneurysms is 0.3% and 1.8%, respectively.41 However, the risk with using DSA in the setting of ischemic disease can be as high as 3.7%.41 Thus, the risk associated with a single angiogram is significant, and for those who are in need of multiple angiograms, the compounded risk may outweigh the benefit in some cases. With that in mind, the need for a reliable noninvasive method of neurovascular evaluation is of even greater importance. MRA offers a safe alternative to DSA for the evaluation of aneurysms. Its primary problems are that it is time-consuming, requires special expertise to interpret, and may not be possible in patients with claustrophobia or certain metal implants, such as pacemakers, pre-1995 era aneurysm clips, or bullet fragments.42
Aneurysm Screening and Pretreatment Evaluation
The incidence of cerebral aneurysms is estimated to be 5%. However, in people with one or more first-degree relatives with an aneurysm, the incidence can be as high as 20%.42 Although there is no consensus, many recommend screening of first-degree relatives of those with a known cerebral aneurysm. 3D TOF MRA provides an efficient way to look for aneurysms (Fig. 348-6; also see Fig. 348-1C) without exposing patients with a low probability of a positive finding to a relatively high-risk study. MRA has been shown to have high sensitivity for detection of aneurysms larger than 3 mm.42,43 If an aneurysm is visualized on screening MRA, further, more definitive evaluation can be performed with DSA. Alternatively, there are some who would advocate the use of MRA alone or in conjunction with other noninvasive studies such as CTA (see earlier) as the only imaging needed to evaluate a cerebral aneurysm. This is particularly true in the case of unruptured aneurysms.
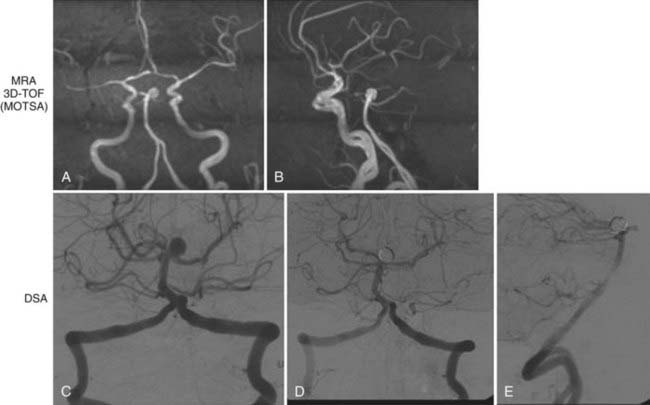
For unruptured aneurysms, 3D TOF MRA is a useful pretreatment study (see Figs. 348-1C and 348-6). It can effectively visualize aneurysms larger than 3 mm.43 Previous studies have shown that small aneurysms have a very low risk of rupture in patients with no history of SAH.44 In some cases, high-quality MRA can be superior to DSA because it can be reconstructed in three dimensions, which allows the lesion to viewed from all angles. Thus, 3D MRA can enable visualization of aneurysms that can be missed with DSA.
For the most part, MRA is used only as the primary tool for evaluating unruptured aneurysms. For ruptured aneurysms, most still rely on DSA or, less often, CTA as the primary modality. DSA provides better resolution and is not subject to blood-related artifact. Moreover, SAH is often an emergency situation and patients are too critical to tolerate a lengthy MRA study. Finally, the false-negative rate is higher for MRA than for DSA. A false-negative finding in the setting of SAH carries an unacceptable risk for death or major morbidity. A recent study suggests that MRA should not be used alone.45
3D TOF MRA is a very versatile modality, but as mentioned before, it relies on rapid, perpendicular flow for optimum signal intensity. In cases of slow or complex flow, the signal-to-noise ratio can be poor. In these cases special techniques such as MOTSA are used. Alternatively, 3D TOF MRA could be combined with CE MRA to improve the signal-to-noise ratio by overcoming the effects of saturation. PC MRA has also been shown to be useful for aneurysms larger than 1.5 cm. qPC MRA can be used to evaluate aneurysms that may need bypass for flow replacement. In these cases, NOVA qPC MRA provides neuroanatomic imaging, as well as measurement of flow in the parent vessels (see Figs. 348-1C and 348-5D).
The benefit of high–field strength MRA (3 T) versus standard MRA (1.5 T) is still controversial.46,47 A field strength of 3 T provides a better signal-to-noise ratio and spatial resolution. Moreover, it can enable more efficient image acquisition. However, it has not been shown to increase the sensitivity of aneurysm detection.
Aneurysm Post-Treatment Follow-Up
Although there is still some controversy regarding the use of MRA for initial evaluation, many practitioners use MRA as a follow-up tool. Approximately 10% to 60% of all aneurysms treated by endovascular means will have a significant recurrence rate42,48 with an overall risk for rerupture of 3.4%.48 Of patients in whom rerupture occurs, nearly 60% die.48 Recent reports have confirmed that the risk for rerupture is directly related to the degree of aneurysm occlusion.48 Therefore, lesions treated with endovascular therapy need careful long-term follow-up.
Platinum coils are optimized to be seen well on standard radiographic studies and therefore produce significant beam-hardening artifact on CTA. However, they do not produce significant artifact on MRA. Thus, MRA is the ideal study with which to monitor endovascularly treated aneurysms without the compounded risk of multiple DSA (Fig. 348-7). For ruptured aneurysms, many centers perform follow-up at 6 months, 2 years, and then 5 years. The first follow-up evaluation can be performed with DSA and MRA. If the two correlate well, subsequent follow-up should be performed with MRA. Reports by Wallace and colleagues have shown that MRA is a reliable means of surveillance of coiled aneurysms and has a sensitivity and specificity of 90% and 100%, respectively, for the detection of residual aneurysms.42 This compares favorably with DSA. Indeed, Yamada and associates suggested that when compared with DSA, MRA is a more sensitive indicator of residual flow in certain types of aneurysms.49 CE MRA is particularly useful because it allows visualization of luminal filling and thus mimics the results of DSA. Moreover, Gauvrit and coworkers reported that CE MRA is as good as or better than DSA for 6-month follow-up.50 Although many find DSA and MRA to be complementary studies, one could argue that MRA alone is adequate. Indeed, Wallace and colleagues recommend immediate post-treatment MRA as a baseline to correlate with the post-treatment control DSA. If the correlation is good, MRA can be performed at 3 to 6 months, 12 to 15 months, and 24 to 36 months.42 Lesions with complex treatment constructs (e.g., clips from previous surgery, multiple stents) or those that do not correlate well with the post-treatment DSA findings are best visualized with DSA.
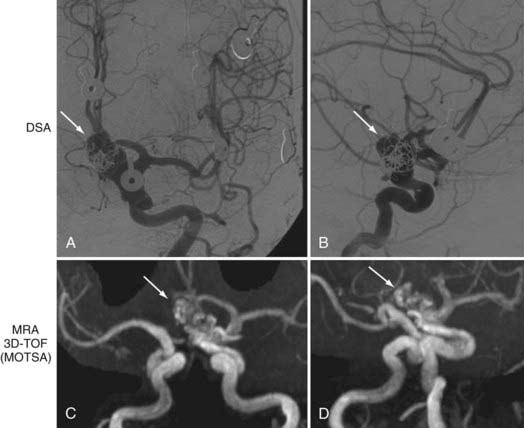
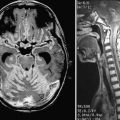
FIGURE 348-7 Evaluation of a 78-year-old woman with a history of a previously coiled left carotid-ophthalmic, internal carotid artery aneurysm. Digital subtraction angiography (DSA) and magnetic resonance angiography (MRA) were performed. MRA is useful for evaluating coiled aneurysms because it provides good resolution with minimal artifact. Residual opacification is seen on both DSA (A, anteroposterior [AP]; B, lateral) and MRA (C, AP; D, oblique). Arrows indicate recurrent aneurysm. (For related balloon occlusion test and single-photon emission computed tomography images, please see Fig. 348-4.)
Several important drawbacks must be considered when using MRA to monitor coiled aneurysms. The coil mass does produce some susceptibility artifacts, including regional distortion, dynamic eddy currents, and spin dephasing because of complex flow. These issues make interpretation of the images more difficult. Having an in-depth understanding of the source images and initial post-treatment DSA can mitigate these problems. In addition, short TE and increased bandwidth have been shown to reduce artifact.42 As mentioned earlier, the use of contrast material can increase the yield, but some patients have medical contraindications to gadolinium. Other problems include long acquisition times, which increase the likelihood of motion artifacts.
Aneurysms treated by surgical clipping can be evaluated with MRA if the clip is compatible with MRI. However, the clip can create significant artifact that can completely obscure the area around the aneurysm. In turn, this renders visualization of a small remnant or recurrence virtually impossible.6,42 Therefore, most advocate the use of DSA or possibly CTA (see earlier) as a way of monitoring these lesions. Fortunately, surgical clipping is known to be a more stable and definitive treatment with a rerupture rate of just 1.3% after clipping.48 Thus, when compared with endovascularly treated lesions, fewer follow-up studies are needed.
Arteriovenous Malformations
AVMs are complex vascular lesions characterized by an abnormal tangle of high-flow arteries feeding directly into veins. Large venous varices and flow-related or intranidal aneurysms are a common occurrence. As mentioned previously, MRA image quality is degraded by complex flow patterns and slow flow, which can occur within the nidus. Standard MRA has poor temporal resolution and does not provide hemodynamic information, which in turn makes arterial and venous phases difficult to visualize. Moreover, partial volume effects and other artifactual errors make small arteriovenous shunts and subtle changes in the size of the nidus difficult to evaluate. Thus, MRA is not the study of choice for the initial evaluation of a lesion or for the definitive follow-up study. However, MRA has been useful as an intermediate follow-up study. Patients who are treated surgically do not usually need long-term follow-up. However, because the vaso-occlusive effects of radiosurgery are variable, AVM obliteration can occur as early as 4 months or may take up to 5 years. MRA can be used to monitor the nidus after treatment.51 If the nidus is filling on MRA, an angiogram is not necessary. Once the nidus seems to have disappeared, DSA is indicated as the definitive test to document nidal obliteration. qPC MRA can also be quite helpful in the imaging of AVMs. It can provide useful hemodynamic information before and after treatment.
Dural Arteriovenous Fistulas
MRA typically has a limited role in the evaluation of these lesions.31 Although MRA can be used to evaluate the external carotid and to look for dilated veins and occluded sinuses,52 DSA has much higher sensitivity and enables better characterization of feeding arteries and the venous drainage pattern. Recently, Meckel and coauthors reported data from a small study suggesting that although standard 3D TOF is inferior to DSA, time-resolved 3D CE MRA may play a limited role in diagnosis and follow-up.53 However, DSA is still the modality of choice for planning treatment.
Extracranial Atherosclerotic Disease
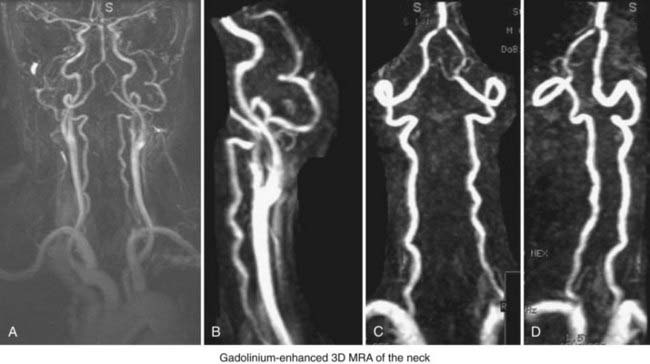
MRA can very useful in the evaluation of extracranial carotid atherosclerotic disease (Fig. 348-8A; also see Fig. 348-1B). In addition to the reduced risk associated with MRA as compared with DSA, the multiple (3D) views obtained with MRA have been shown to provide a more accurate estimation of stenosis in some cases. In a recent meta-analysis, standard TOF MRA had a sensitivity and specificity of 91.2% and 88.3%, respectively, for the diagnosis of carotid stenosis (>70% to 90%).38 Likewise, TOF MRA had a sensitivity and specificity of 94.5% and 99.3%, respectively, for the diagnosis of carotid occlusion.38 2D TOF has the advantage of being useful for stationary tissue and for slow flow. However, because of phase dispersion artifact, it has been shown to significantly overestimate high-grade stenosis, which reduces its specificity. Moreover, as discussed earlier, complex or turbulent flow patterns also lead to signal loss or artifact. Although modified 3D techniques, such as MOTSA, provide some reduction in intravoxel dephasing artifact, 3D techniques are still insensitive to stagnant flow (i.e., ulcerated plaque, carotid bulb). Furthermore, like ultrasound, both standard 2D and 3D TOF techniques are flow-based imaging studies.
Recently, CE MRA has markedly improved the usefulness of MRA for the evaluation of extracranial carotid stenosis. It is similar to DSA because it images the lumen. Recently, CE MRA (see Fig. 348-8) has been shown to have a sensitivity and specificity of 97% and 82%, respectively.54 When used as a tool to decide whether a patient was suitable for surgical revascularization, it had a misclassification rate of just 3.1%.54 Although some still believe that additional evaluation is required, these data and others suggest that CE MRA can be used as a stand-alone evaluation technique.54,55 Other smaller studies have shown that 3D TOF MRA is superior to CE MRA in some cases. Thus, CE and 3D TOF may be complementary and, when used together, may offer a viable and equivalent alternative to DSA.56 It is important to note that to achieve high sensitivity and specificity with MRA, state-of-the-art hardware, software, and contrast material must be used. Older technology does not provide adequate resolution. Interestingly, modern qPC MRA techniques used with software packages can provide highly sensitive and specific qualitative information along with precise information regarding flow in a given vessel.
MRA can also be used to evaluate the vertebral arteries (Fig. 348-8C and D). However, less work has been done to establish its effectiveness. Visualization of the origin of the great vessels is not ideal with standard TOF techniques. CE MRA with time-resolved techniques provides some improvement.
Traditionally, the degree of carotid stenosis has been the primary factor in angiographic assessment of stroke risk. However, recent studies suggest that in addition to the size and thickness of the atherosclerotic plaque, the nature and composition of the plaque may also be important determinants of stroke risk and reliable prognostic indicators.57–59 Complex or unstable plaque can be characterized by the presence of surface rupture or intraplaque hemorrhage.57,60,61 It has been shown to be more prevalent in the ipsilateral carotid arteries of patients with carotid stenosis and recent cerebral ischemic events.62 Moreover, this vulnerable plaque has been associated with increased risk for initial and recurrent symptomatic thromboembolism. In a study of 66 patients, Altaf and coauthors reported that intraplaque hemorrhage significantly increased the risk for recurrent cerebral ischemia.58 In another study of 154 patients, Takaya and colleagues showed that MRI evidence of unstable features, including ruptured fibrous caps and intraplaque hemorrhage, was associated with the occurrence of subsequent cerebrovascular events.59
MRI/MRA can be used to obtain detailed information about the composition of atherosclerotic plaque. Indeed, specialized protocols can reliably identify vulnerable plaque and therefore provide useful prognostic information. In 2003, Moody and coworkers reported on an MRI technique that uses a fat-suppressed, T1-weighted, magnetization-prepared 3D gradient echo sequence for direct imaging of intraplaque hemorrhage.57 This technique relies on the detection of methemoglobin within the plaque. Thus, intraplaque hemorrhage can be directly visualized as a hyperintense signal on T1-weighted MRI. With the use of MRI techniques, intraplaque hemorrhage can be detected with a sensitivity of 84% to 90%, specificity of 70% to 84%, negative predictive value of 70%, and positive predictive value of 93% in comparison to patient-matched histologic specimens after carotid endarterectomy.57,63 Thus, in addition to being an effective tool for assessment of the degree of stenosis present in atherosclerotic disease, MRI/MRA can also be used to assess the composition of the plaque itself. Although more work needs to be done, this additional information has the potential to significantly improve the ability to provide early preventive treatment.
Intracranial Atherosclerotic Disease
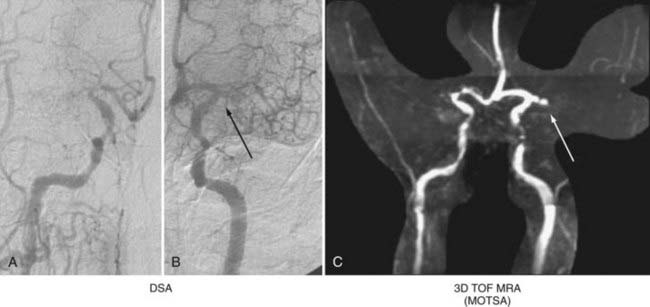
Modern MRA techniques have improved the visualization of intracranial vessels (Fig. 348-9). However, until lately, MRA had not been rigorously evaluated as a stand-alone test for intracranial atherosclerosis. Recently, the Stroke Outcomes and Neuroimaging of Intracranial Atherosclerosis (SONIA) trial investigators reported data from 407 patients suggesting that MRA (and transcranial Doppler) alone was sufficient to rule out significant intracranial atherosclerosis.64 However, they recommend that abnormalities noted on MRA be confirmed with DSA. Higher field strength has been shown to provide better resolution of smaller intracranial vessels. By using 3-T MRI, practitioners have even been able to detect moyamoya-type intracranial stenosis/occlusion in large and moderate-sized vessels.65
Other
Other applications of MRA include visualization of dissections and visualization of dural sinus thrombosis with magnetic resonance venography (MRV).66 In both cases, MRA/MRV provides useful initial information. In the case of dural sinus thrombosis, however, standard MRI techniques provide a static picture without reliable visualization of dynamic venous outflow. In addition, thrombus can mimic flow. New dynamic time-resolved techniques have been introduced to overcome these problems, but until they have been tested more rigorously, DSA remains the gold standard.52,66
Ashley WW, Amin-Hanjani S, Alaraj A, et al. Flow-assisted surgical cerebral revascularization. Neurosurg Focus. 2008;24(2):E20.
Binaghi S, Colleoni ML, Maeder P, et al. CT angiography and perfusion CT in cerebral vasospasm after subarachnoid hemorrhage. AJNR Am J Neuroradiol. 2007;28:750-758.
Cloft HJ, Joseph GJ, Dion JE. Risk of cerebral angiography in patients with subarachnoid hemorrhage, cerebral aneurysm, and arteriovenous malformation: a meta-analysis. Stroke. 1999;30:317-320.
Derdeyn CP, Grubb RLJr, Powers WJ. Cerebral hemodynamic impairment: methods of measurement and association with stroke risk. Neurology. 1999;53:251-259.
Drayer BP, Wolfson SK, Boehnke M, et al. Physiologic changes in regional cerebral blood flow defined by xenon-enhanced CT scanning. Neuroradiology. 1978;16:220-223.
Drayer BP, Wolfson SK, Reinmuth OM, et al. Xenon enhanced CT for analysis of cerebral integrity, perfusion, and blood flow. Stroke. 1978;9:123-130.
Endo H, Inoue T, Ogasawara K, et al. Quantitative assessment of cerebral hemodynamics using perfusion-weighted MRI in patients with major cerebral artery occlusive disease: comparison with positron emission tomography. Stroke. 2006;37:388-392.
Fellner C, Lang W, Janka R, et al. Magnetic resonance angiography of the carotid arteries using three different techniques: accuracy compared with intraarterial x-ray angiography and endarterectomy specimens. J Magn Reson Imaging. 2005;21:424-431.
Gauvrit JY, Leclerc X, Pernodet M, et al. Intracranial aneurysms treated with Guglielmi detachable coils: usefulness of 6-month imaging follow-up with contrast-enhanced MR angiography. AJNR Am J Neuroradiol. 2005;26:515-521.
Gupta R, Jovin TG, Yonas H. Xenon CT cerebral blood flow in acute stroke. Neuroimaging Clin N Am. 2005;15:531-542. x
Hoeffner EG, Case I, Jain R, et al. Cerebral perfusion CT: technique and clinical applications. Radiology. 2004;231:632-644.
Johnston SC, Dowd CF, Higashida RT, et al. Predictors of rehemorrhage after treatment of ruptured intracranial aneurysms: the Cerebral Aneurysm Rerupture After Treatment (CARAT) study. Stroke. 2008;39:120-125.
Karonen JO, Nuutinen J, Kuikka JT, et al. Combined SPECT and diffusion-weighted MRI as a predictor of infarct growth in acute ischemic stroke. J Nucl Med. 2000;41:788-794.
Latchaw RE, Yonas H, Hunter GJ, et al. Guidelines and recommendations for perfusion imaging in cerebral ischemia: a scientific statement for healthcare professionals by the Writing Group on Perfusion Imaging, from the Council on Cardiovascular Radiology of the American Heart Association. Stroke. 2003;34:1084-1104.
Molyneux A, Kerr R, Stratton I, et al. International Subarachnoid Aneurysm Trial (ISAT) of neurosurgical clipping versus endovascular coiling in 2143 patients with ruptured intracranial aneurysms: a randomised trial. Lancet. 2002;360:1267-1274.
Moody AR, Murphy RE, Morgan PS, et al. Characterization of complicated carotid plaque with magnetic resonance direct thrombus imaging in patients with cerebral ischemia. Circulation. 2003;107:3047-3052.
Nighoghossian N, Derex L, Douek P. The vulnerable carotid artery plaque: current imaging methods and new perspectives. Stroke. 2005;36:2764-2772.
Ruggieri PM, Masaryk TJ, Ross JS. Magnetic resonance angiography. Cerebrovascular applications. Stroke. 1992;23:774-780.
Sanelli PC, Mifsud MJ, Zelenko N, et al. CT angiography in the evaluation of cerebrovascular diseases. AJR Am J Roentgenol. 2005;184:305-312.
Shetty SK, Lev MH. CT perfusion in acute stroke. Neuroimaging Clin N Am. 2005;15:481-501. ix
Srinivasan A, Goyal M, Al Azri F, et al. State-of-the-art imaging of acute stroke. Radiographics. 2006;26(suppl 1):S75-95.
Stary HC, Chandler AB, Dinsmore RE, et al. A definition of advanced types of atherosclerotic lesions and a histological classification of atherosclerosis. A report from the Committee on Vascular Lesions of the Council on Arteriosclerosis, American Heart Association. Arterioscler Thromb Vasc Biol. 1995;15:1512-1531.
Wallace RC, Karis JP, Partovi S, et al. Noninvasive imaging of treated cerebral aneurysms. Part II: CT angiographic follow-up of surgically clipped aneurysms. AJNR Am J Neuroradiol. 2007;28:1207-1212.
Wallace RC, Karis JP, Partovi S, et al. Noninvasive imaging of treated cerebral aneurysms. Part I: MR angiographic follow-up of coiled aneurysms. AJNR Am J Neuroradiol. 2007;28:1001-1008.
Wintermark M, Sesay M, Barbier E, et al. Comparative overview of brain perfusion imaging techniques. Stroke. 2005;36:e83-e99.
Wintermark M, Thiran JP, Maeder P, et al. Simultaneous measurement of regional cerebral blood flow by perfusion CT and stable xenon CT: a validation study. AJNR Am J Neuroradiol. 2001;22:905-914.
Zhao M, Charbel FT, Alperin N, et al. Improved phase-contrast flow quantification by three-dimensional vessel localization. Magn Reson Imaging. 2000;18(6):697-706.
1 Ferro JM. Egas Moniz and internal carotid occlusion. Arch Neurol. 1988;45:563-564.
2 Lowis GW, Minagar A. The neglected research of Egas Moniz of internal carotid artery (ICA) occlusion. J Hist Neurosci. 2003;12:286-291.
3 Latchaw RE, Yonas H, Hunter GJ, et al. Guidelines and recommendations for perfusion imaging in cerebral ischemia: a scientific statement for healthcare professionals by the Writing Group on Perfusion Imaging, from the Council on Cardiovascular Radiology of the American Heart Association. Stroke. 2003;34:1084-1104.
4 Sanelli PC, Mifsud MJ, Zelenko N, et al. CT angiography in the evaluation of cerebrovascular diseases. AJR Am J Roentgenol. 2005;184:305-312.
5 Srinivasan A, Goyal M, Al Azri F, et al. State-of-the-art imaging of acute stroke. Radiographics. 2006;26(suppl 1):S75-S95.
6 Wallace RC, Karis JP, Partovi S, et al. Noninvasive imaging of treated cerebral aneurysms. Part II: CT angiographic follow-up of surgically clipped aneurysms. AJNR Am J Neuroradiol. 2007;28:1207-1212.
7 Brown JH, Lustrin ES, Lev MH, et al. Reduction of aneurysm clip artifacts on CT angiograms: a technical note. AJNR Am J Neuroradiol. 1999;20:694-696.
8 Hashimoto K, Nozaki K, Hashimoto N. Optic strut as a radiographic landmark in evaluating neck location of a paraclinoid aneurysm. Neurosurgery. 2006;59:880-895.
9 Klotz E, Konig M. Perfusion measurements of the brain: using dynamic CT for the quantitative assessment of cerebral ischemia in acute stroke. Eur J Radiol. 1999;30:170-184.
10 Molina CA, Saver JL. Extending reperfusion therapy for acute ischemic stroke: emerging pharmacological, mechanical, and imaging strategies. Stroke. 2005;36:2311-2320.
11 Miles KA, Griffiths MR. Perfusion CT: a worthwhile enhancement? Br J Radiol. 2003;76:220-231.
12 Skagervik I, Wikholm G, Rosengren L, et al. Brain CT perfusion in stroke in progression. Eur Neurol. 2008;59:98-100.
13 Shetty SK, Lev MH. CT perfusion in acute stroke. Neuroimaging Clin N Am. 2005;15:481-501. ix
14 Hoeffner EG, Case I, Jain R, et al. Cerebral perfusion CT: technique and clinical applications. Radiology. 2004;231:632-644.
15 Wintermark M, Thiran JP, Maeder P, et al. Simultaneous measurement of regional cerebral blood flow by perfusion CT and stable xenon CT: a validation study. AJNR Am J Neuroradiol. 2001;22:905-914.
16 Wintermark M, Sesay M, Barbier E, et al. Comparative overview of brain perfusion imaging techniques. Stroke. 2005;36:e83-99.
17 Ochi RP, Vieco PT, Gross CE. CT angiography of cerebral vasospasm with conventional angiographic comparison. AJNR Am J Neuroradiol. 1997;18:265-269.
18 Binaghi S, Colleoni ML, Maeder P, et al. CT angiography and perfusion CT in cerebral vasospasm after subarachnoid hemorrhage. AJNR Am J Neuroradiol. 2007;28:750-758.
19 Wintermark M, Dillon WP, Smith WS, et al. Visual grading system for vasospasm based on perfusion CT imaging: comparisons with conventional angiography and quantitative perfusion CT. Cerebrovasc Dis. 2008;26:163-170.
20 Drayer BP, Wolfson SK, Boehnke M, et al. Physiologic changes in regional cerebral blood flow defined by xenon-enhanced CT scanning. Neuroradiology. 1978;16:220-223.
21 Drayer BP, Wolfson SK, Reinmuth OM, et al. Xenon enhanced CT for analysis of cerebral integrity, perfusion, and blood flow. Stroke. 1978;9:123-130.
22 Gupta R, Jovin TG, Yonas H. Xenon CT cerebral blood flow in acute stroke. Neuroimaging Clin N Am. 2005;15:531-542. x
23 Derdeyn CP, Grubb RLJr, Powers WJ. Cerebral hemodynamic impairment: methods of measurement and association with stroke risk. Neurology. 1999;53:251-259.
24 Ashley WW, Amin-Hanjani S, Alaraj A, et al. Flow-assisted surgical cerebral revascularization. Neurosurg Focus. 2008;24(2):E20.
25 Brass LM, Walovitch RC, Joseph JL, et al. The role of single photon emission computed tomography brain imaging with 99mTc-bicisate in the localization and definition of mechanism of ischemic stroke. J Cereb Blood Flow Metab. 1994;14(suppl 1):S91-S98.
26 Karonen JO, Nuutinen J, Kuikka JT, et al. Combined SPECT and diffusion-weighted MRI as a predictor of infarct growth in acute ischemic stroke. J Nucl Med. 2000;41:788-794.
27 Grotta JC, Alexandrov AV. tPA-associated reperfusion after acute stroke demonstrated by SPECT. Stroke. 1998;29:429-432.
28 Davis SM, Andrews JT, Lichtenstein M, et al. Correlations between cerebral arterial velocities, blood flow, and delayed ischemia after subarachnoid hemorrhage. Stroke. 1992;23:492-497.
29 Ruggieri PM, Masaryk TJ, Ross JS. Magnetic resonance angiography. Cerebrovascular applications. Stroke. 1992;23:774-780.
30 Dumoulin CL, Hart HRJr. Magnetic resonance angiography. Radiology. 1986;161:717-720.
31 Huston J3rd, Berstein M. Magnetic resonance angiography, 5th ed. Winn HR, editor. Youman’s Neurological Surgery, vol 2. Philadelphia: Elsevier. 2004:1575-1599.
32 Amin-Hanjani S, Du X, Zhao M, et al. Use of quantitative magnetic resonance angiography to stratify stroke risk in symptomatic vertebrobasilar disease. Stroke. 2005;36:1140-1145.
33 Guo G, Wu RH, Zhang YP, et al. Combination 3D TOP with 2D PC MRA technique for cerebral blood flow volume measurement. Conf Proc IEEE Eng Med Biol Soc. 2006;1:489-492.
34 Guzman R, Lovblad KO, Altrichter S, et al. Clinical validation of an automated vessel-segmentation software of the extracranial-carotid arteries based on 3D-MRA: a prospective study. J Neuroradiol. 2008;35:278-285.
35 Guzman R, Oswald H, Bartha A, et al. Clinical validation of quantitative carotid MRA. Int Congr Series. 2001;1230:981-985.
36 Zhao M, Charbel FT, Alperin N, et al. Improved phase-contrast flow quantification by three-dimensional vessel localization. Magn Reson Imaging. 2000;18:697-706.
37 Zhao M, Curcio, A., Clark, ME, et al. In-vitro validation of MR volumetric flow measurements. Paper presented at the 2004 International Workshop on Flow and Motion, 2004. Zurich, Switzerland.
38 Debrey SM, Yu H, Lynch JK, et al. Diagnostic accuracy of magnetic resonance angiography for internal carotid artery disease: a systematic review and meta-analysis. Stroke. 2008;39:2237-2248.
39 Endo H, Inoue T, Ogasawara K, et al. Quantitative assessment of cerebral hemodynamics using perfusion-weighted MRI in patients with major cerebral artery occlusive disease: comparison with positron emission tomography. Stroke. 2006;37:388-392.
40 Carroll TJ, Teneggi V, Jobin M, et al. Absolute quantification of cerebral blood flow with magnetic resonance, reproducibility of the method, and comparison with H2(15)O positron emission tomography. J Cereb Blood Flow Metab. 2002;22:1149-1156.
41 Cloft HJ, Joseph GJ, Dion JE. Risk of cerebral angiography in patients with subarachnoid hemorrhage, cerebral aneurysm, and arteriovenous malformation: a meta-analysis. Stroke. 1999;30:317-320.
42 Wallace RC, Karis JP, Partovi S, et al. Noninvasive imaging of treated cerebral aneurysms. Part I: MR angiographic follow-up of coiled aneurysms. AJNR Am J Neuroradiol. 2007;28:1001-1008.
43 Okahara M, Kiyosue H, Yamashita M, et al. Diagnostic accuracy of magnetic resonance angiography for cerebral aneurysms in correlation with 3D-digital subtraction angiographic images: a study of 133 aneurysms. Stroke. 2002;33:1803-1808.
44 Molyneux A, Kerr R, Stratton I, et al. International Subarachnoid Aneurysm Trial (ISAT) of neurosurgical clipping versus endovascular coiling in 2143 patients with ruptured intracranial aneurysms: a randomised trial. Lancet. 2002;360:1267-1274.
45 Schwab KE, Gailloud P, Wyse G, et al. Limitations of magnetic resonance imaging and magnetic resonance angiography in the diagnosis of intracranial aneurysms. Neurosurgery. 2008;63:29-34.
46 Gibbs GF, Huston J3rd, Bernstein MA, et al. Improved image quality of intracranial aneurysms: 3.0-T versus 1.5-T time-of-flight MR angiography. AJNR Am J Neuroradiol. 2004;25:84-87.
47 Buhk JH, Kallenberg K, Mohr A, et al. No advantage of time-of-flight magnetic resonance angiography at 3 Tesla compared to 1.5 Tesla in the follow-up after endovascular treatment of cerebral aneurysms. Neuroradiology. 2008;50:855-861.
48 Johnston SC, Dowd CF, Higashida RT, et al. Predictors of rehemorrhage after treatment of ruptured intracranial aneurysms: the Cerebral Aneurysm Rerupture After Treatment (CARAT) study. Stroke. 2008;39:120-125.
49 Yamada N, Hayashi K, Murao K, et al. Time-of-flight MR angiography targeted to coiled intracranial aneurysms is more sensitive to residual flow than is digital subtraction angiography. AJNR Am J Neuroradiol. 2004;25:1154-1157.
50 Gauvrit JY, Leclerc X, Pernodet M, et al. Intracranial aneurysms treated with Guglielmi detachable coils: usefulness of 6-month imaging follow-up with contrast-enhanced MR angiography. AJNR Am J Neuroradiol. 2005;26:515-521.
51 Gauvrit JY, Oppenheim C, Nataf F, et al. Three-dimensional dynamic magnetic resonance angiography for the evaluation of radiosurgically treated cerebral arteriovenous malformations. Eur Radiol. 2006;16:583-591.
52 Meckel S, Glucker TM, Kretzschmar M, et al. Display of dural sinuses with time-resolved, contrast-enhanced three-dimensional MR venography. Cerebrovasc Dis. 2008;25:217-224.
53 Meckel S, Maier M, Ruiz DS, et al. MR angiography of dural arteriovenous fistulas: diagnosis and follow-up after treatment using a time-resolved 3D contrast-enhanced technique. AJNR Am J Neuroradiol. 2007;28:877-884.
54 Cosottini M, Pingitore A, Puglioli M, et al. Contrast-enhanced three-dimensional magnetic resonance angiography of atherosclerotic internal carotid stenosis as the noninvasive imaging modality in revascularization decision making. Stroke. 2003;34:660-664.
55 Barth A, Arnold M, Mattle HP, et al. Contrast-enhanced 3-D MRA in decision making for carotid endarterectomy: a 6-year experience. Cerebrovasc Dis. 2006;21:393-400.
56 Fellner C, Lang W, Janka R, et al. Magnetic resonance angiography of the carotid arteries using three different techniques: accuracy compared with intraarterial x-ray angiography and endarterectomy specimens. J Magn Reson Imaging. 2005;21:424-431.
57 Moody AR, Murphy RE, Morgan PS, et al. Characterization of complicated carotid plaque with magnetic resonance direct thrombus imaging in patients with cerebral ischemia. Circulation. 2003;107:3047-3052.
58 Altaf N, MacSweeney ST, Gladman J, et al. Carotid intraplaque hemorrhage predicts recurrent symptoms in patients with high-grade carotid stenosis. Stroke. 2007;38:1633-1635.
59 Takaya N, Yuan C, Chu B, et al. Association between carotid plaque characteristics and subsequent ischemic cerebrovascular events: a prospective assessment with MRI—initial results. Stroke. 2006;37:818-823.
60 Stary HC, Chandler AB, Dinsmore RE, et al. A definition of advanced types of atherosclerotic lesions and a histological classification of atherosclerosis. A report from the Committee on Vascular Lesions of the Council on Arteriosclerosis, American Heart Association. Arterioscler Thromb Vasc Biol. 1995;15:1512-1531.
61 Nighoghossian N, Derex L, Douek P. The vulnerable carotid artery plaque: current imaging methods and new perspectives. Stroke. 2005;36:2764-2772.
62 Murphy RE, Moody AR, Morgan PS, et al. Prevalence of complicated carotid atheroma as detected by magnetic resonance direct thrombus imaging in patients with suspected carotid artery stenosis and previous acute cerebral ischemia. Circulation. 2003;107:3053-3058.
63 Chu B, Kampschulte A, Ferguson MS, et al. Hemorrhage in the atherosclerotic carotid plaque: a high-resolution MRI study. Stroke. 2004;35:1079-1084.
64 Feldmann E, Wilterdink JL, Kosinski A, et al. The Stroke Outcomes and Neuroimaging of Intracranial Atherosclerosis (SONIA) trial. Neurology. 2007;68:2099-2106.
65 Ashley WWJr, Zipfel GJ, Moran CJ, et al. Moyamoya phenomenon secondary to intracranial atherosclerotic disease: diagnosis by 3T magnetic resonance imaging. J Neuroimaging. 2009:381-384.
66 Dormont D, Sag K, Biondi A, et al. Gadolinium-enhanced MR of chronic dural sinus thrombosis. AJNR Am J Neuroradiol. 1995;16:1347-1352.